
1 Copyright © 2002, Icosystem
Inferring micro-rules from macro-behavior in the Minority Game
Alexis Arias, Ben Shargel, Eric Bonabeau
Icosystem Corporation
IMA Conference
Nov 5,2003

2 Copyright © 2002, Icosystem
The Problem
Under what conditions is it possible to identify behavioral rules at the micro level from aggregate output data?
In Real World Applications:
• Need to enhance predictive power
• No direct information regarding micro behavior
• Lack of expert consensus but…
• Some knowledge/assumptions about micro-strategies

3 Copyright © 2002, Icosystem
Inference in The Minority Game
• Why the minority game?– Simple structure – Complex aggregate behavior results from individual interactions– Global interactions: individual behavior depends on aggregates
• Questions?– Can the distribution of behavioral rules be inferred from
observable time series data at three levels of aggregation:– Individual actions observable– Size of the minority– Action taken by the minority
– What is the effect of increasing the available sample size, number of individuals and length of the time series, on the estimation error.

4 Copyright © 2002, Icosystem
Inference in The Minority Game
• 2 Models:
– Discount Factor Model• Every individual holds one strategy characterized by a
discount factor • Finite memory• Strategy set has a natural ordering
– Learning Model• Every individual holds a bag of strategies• In every period individuals follow their most successful
strategy• All strategies are re-evaluated every period
5 Copyright © 2002, Icosystem
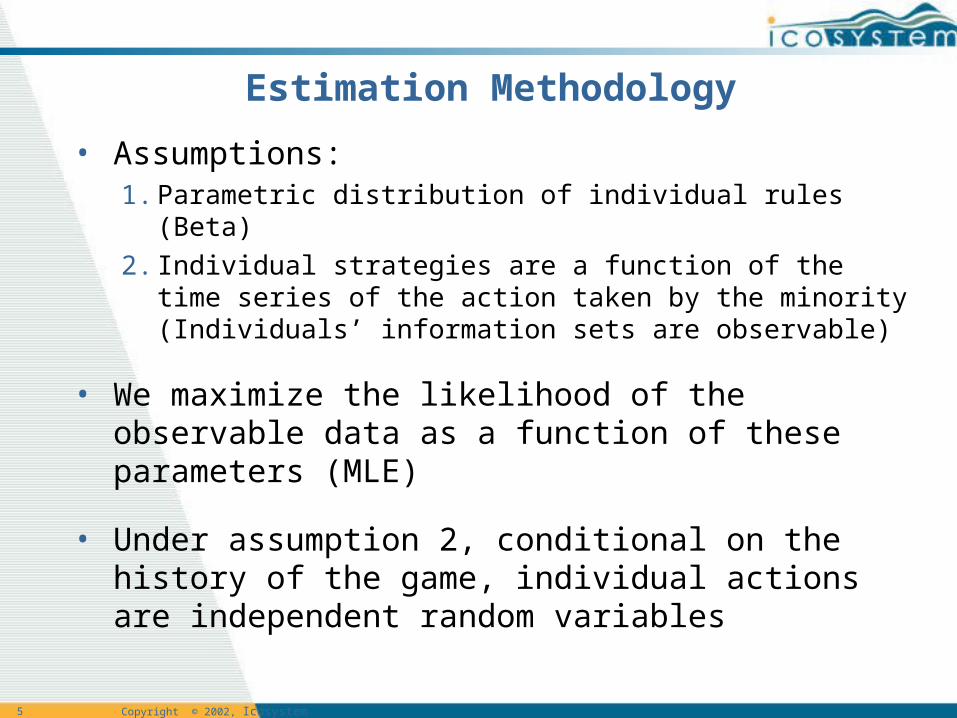
Estimation Methodology
• Assumptions:1. Parametric distribution of individual rules (Beta)
2. Individual strategies are a function of the time series of the action taken by the minority (Individuals’ information sets are observable)
• We maximize the likelihood of the observable data as a function of these parameters (MLE)
• Under assumption 2, conditional on the history of the game, individual actions are independent random variables

6 Copyright © 2002, Icosystem
Discount Factor Model
• Individual strategies are characterized by a discount factor λ[0,1]
• The distribution of discount factors in the population is Beta with parameters a, b
• Same finite memory: m periods
• At each period t, given the history of the game h, the probability of attending the bar is:
p(h, λ) = (i h(i)*^m-i) / (j ^m-j) Where:
• h is binary vector size m• h(i) is the ith element of h

7 Copyright © 2002, Icosystem
Results
• Panel Data– We estimated individual discount factors– The likelihood of the time series of actions taken by
an individual {a(t)} conditional on λ and {h(t)} is:
L({a} / λ,{h}) = ∏t { Ind(a(t)) =1) p(h(t), λ ) + (1- Ind(a(t))=1)(1- p(h(t), λ))}
– Easy to estimate λ even for small data sets (50 periods)

8 Copyright © 2002, Icosystem
Results
• Size of the Minority Observable– The likelihood of the time series of the size of the minority {s(t)}
and the corresponding action series {AM(t)} conditional on {h(t)}, a and b is:
L({s(t)} / {h(t)}, a, b) = ∏t b(s(t), N; δ(h(t),a,b))
Where b(s(t), N; δ (h(t),a,b)) is the probability of s(t) successful trials out of N with probability of success equal to δ (h(t),a,b) and
δ (h(t),a,b) = ∫ (p(h(t) , λ)*Beta(λ;a,b)) dλ if AM(t)=1
1- ∫ (p(h(t) , λ)*Beta(λ;a,b)) dλ if AM(t)=0
– We maximize the likelihood with respect to a, b

9 Copyright © 2002, Icosystem
Results
• System is in principle identified:– Expected probabilities are different for every pair of underlying
distributions and every history
• Simulations– For 100 different pairs (a, b) we simulated the game
with N individuals for T periods– N and T range from 50 to 200– For each simulation we estimated the parameters (a,
b) and calculated an estimation error– The estimation error we used is:
D(a,b;a*,b*) = ∫{| Beta(λ;a,b)- Beta(λ;a*,b*)| /2}dλWhere a, b are true parameters and a*, b* are
estimates

10 Copyright © 2002, Icosystem
Results
12
34
56
78
910
0
2
4
6
8
10
0
0.05
0.1
0.15
0.2
0.25
0.3
0.35
0.4
Mean Error
Parameter a Parameter b
11 Copyright © 2002, Icosystem
Results
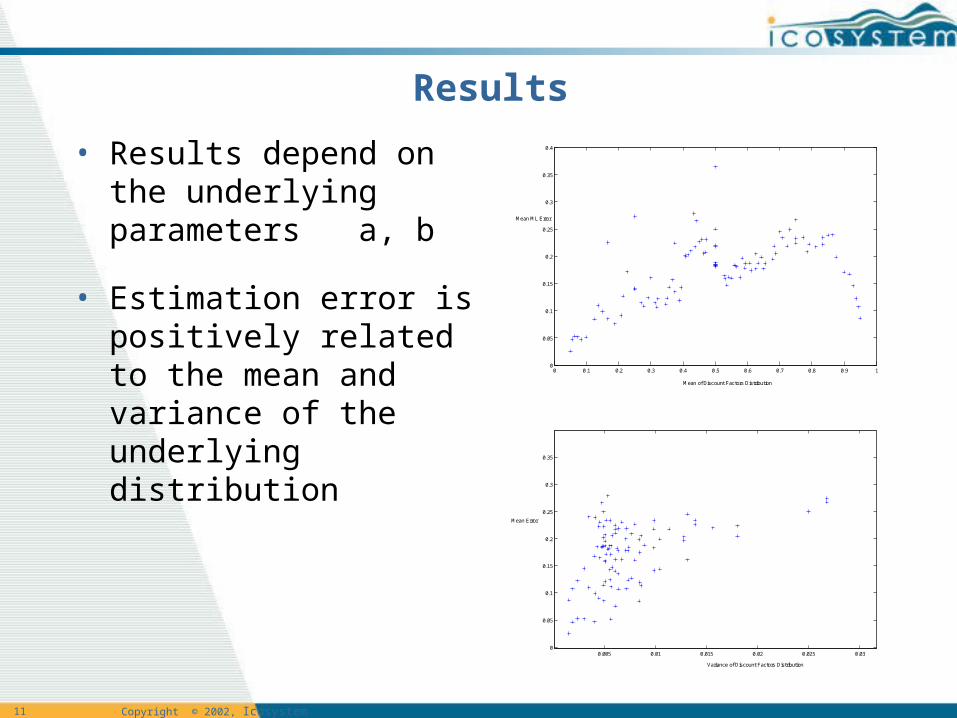
• Results depend on the underlying parameters a, b
• Estimation error is positively related to the mean and variance of the underlying distribution
0 0.1 0.2 0.3 0.4 0.5 0.6 0.7 0.8 0.9 10
0.05
0.1
0.15
0.2
0.25
0.3
0.35
0.4
Mean ML Error
Mean of Discount Factors Distribution
0.005 0.01 0.015 0.02 0.025 0.030
0.05
0.1
0.15
0.2
0.25
0.3
0.35
Mean Error
Variance of Discount Factors Distribution
12 Copyright © 2002, Icosystem
Results
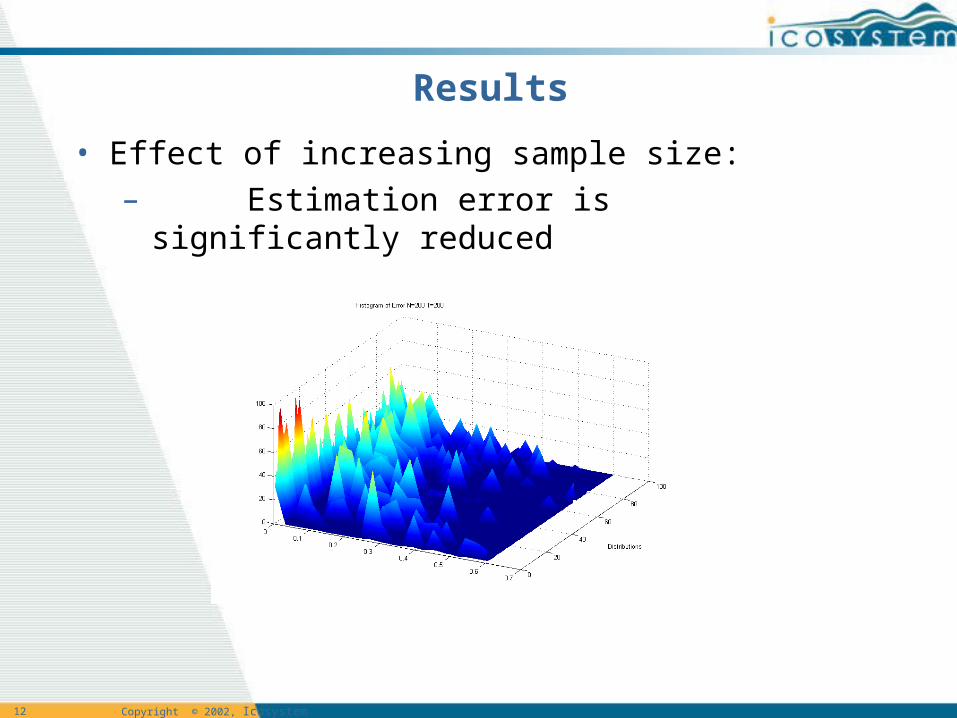
• Effect of increasing sample size:– Estimation error is significantly
reduced

13 Copyright © 2002, Icosystem
Results
0 10 20 30 40 50 60 70 80 90 100-0.1
0
0.1
0.2
0.3
0.4
0.5
0.6
0.7
0.8
0.9
Proportion
Distributions
Percentage Reduction in Mean Errors
0 0.05 0.1 0.15 0.2 0.25 0.3 0.35 0.4-0.02
0
0.02
0.04
0.06
0.08
0.1
0.12
0.14
0.16
0.18
Mean Error N=50 T=50
Difference
– More significant improvements in distributions with high mean and high variance

14 Copyright © 2002, Icosystem
Results
– Increasing N or T has a similar effect on the estimation error
0 10 20 30 40 50 60 70 80 90 1000
0.05
0.1
0.15
0.2
0.25
0.3
0.35
0.4
Effect of Increasing N for T=50
Mean Error
Distributions
0 10 20 30 40 50 60 70 80 90 1000
0.05
0.1
0.15
0.2
0.25
0.3
0.35
0.4
Effect of Increasing T for N=100
Mean Error
Distribution

15 Copyright © 2002, Icosystem
Results
• Action of the Minority Observable– The likelihood of the time series of the action of the
minority {AM(t)} conditional on {h(t)}, a and b is:
L({AM(t)} / {h(t)}, a, b) = ∏t ∑ b(n, N; δ(h(t),a,b))
Where the summation is carried over n< N/2
– We maximize the likelihood with respect to a, b

16 Copyright © 2002, Icosystem
Results
Very poor results even for N=200 T-200
12
34
56
78
910
1
2
3
4
5
6
7
8
9
10
0
0.1
0.2
0.3
0.4
0.5
0.6
0.7
0.8
0.9
1
Mean Error
Parameter a
Parameter b
17 Copyright © 2002, Icosystem
Results
0 10 20 30 40 50 60 70 80 90 1000
0.1
0.2
0.3
0.4
0.5
0.6
0.7
0.8
0.9
1
Mean Error
Distributions
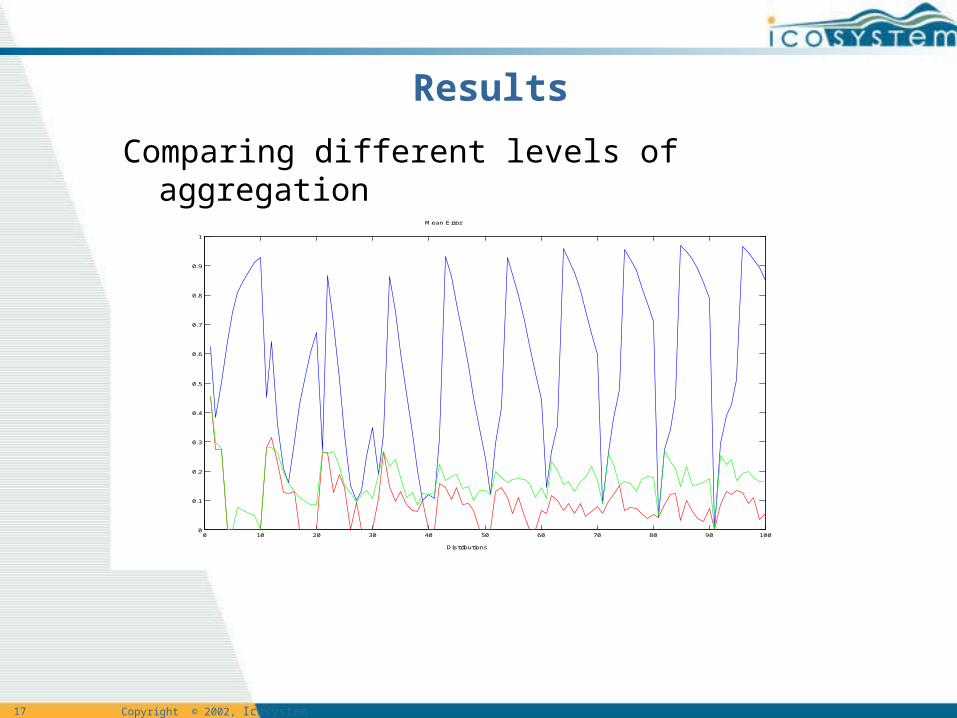
Comparing different levels of aggregation

18 Copyright © 2002, Icosystem
Future Work
• Extend length of time series
• Analyze prediction loss
• Reduce level of correlation of individual actions
• Consider multimodal distributions

19 Copyright © 2002, Icosystem
Learning Model
• Individuals hold a bag of strategies
• In every period they choose strategy s with probability– ρ(s,t) = eA(s,t) / ∑s’ eA(s’,t)
Where A(s,t) is strategy s accumulated rewards at time t
• In every period successful strategies receive 1 point, the others 0
• Strategies are characterized by three components:• Binary vector v size m
• Threshold value θ
• Operator {≤,>}
• Individual takes action 1 if v*h {≤,>} θ

20 Copyright © 2002, Icosystem
Results
• Panel Data– We estimated individuals’ bags and the initial level of accumulated
rewards
– Implemented a GA to maximize log likelihood
– Preliminary results encouraging successful estimation in 80% cases for t >150, N>100
– Increasing N and T has a significant effect as the strategy space is more populated


