Download - Indian pharmaceutical industry

INDIANPHARMACEUTICAL
INDUSTRY By: Devansh Mehta
M.Pharm.(Pharmacology)M.B.A.in Pharmaceutical marketing and H.A.B.PharmaMob. +91-8171552727Email: [email protected]
02 INTRODUCTION
• On the front rank of India’s science-based industries
• A highly organized sector, the Indian Pharma Industry is estimated to be worth $ 4.5 billion
• Growing at about 8-9 % annually
• Indigenously manufactures products from simple headache pills to sophisticated antibiotics and complex cardiac compounds
INTRODUCTION• Highly fragmented sector with more than 20,000
registered units.
• Leading 250 pharmaceutical companies control 70% of the market
• 250 large units, 8000 Small Scale Units,form the core of the industry in India (including 5 Central Public Sector Units).
• Complete range of pharmaceutical formulations, i.e., medicines ready for consumption by patients and about 350 bulk drugs
• The industry remains largely unaffected by the Current Recession
• The patented drugs have recorded a growth of over 37 per cent in the last couple of years.
• The national Pharma market would experience the rise in the sales of the patent drugs
IMPACT OF RECESSION
• The industry has already launched a drive to tighten costs at all levels
• It is focusing on ways to optimise productivity to position itself for the future.
• Need to improve productivity in the area of R&D, Cost containment , coupled with prudent management of resources and reserves
IMPACT OF RECESSION
MAJOR PLAYERS
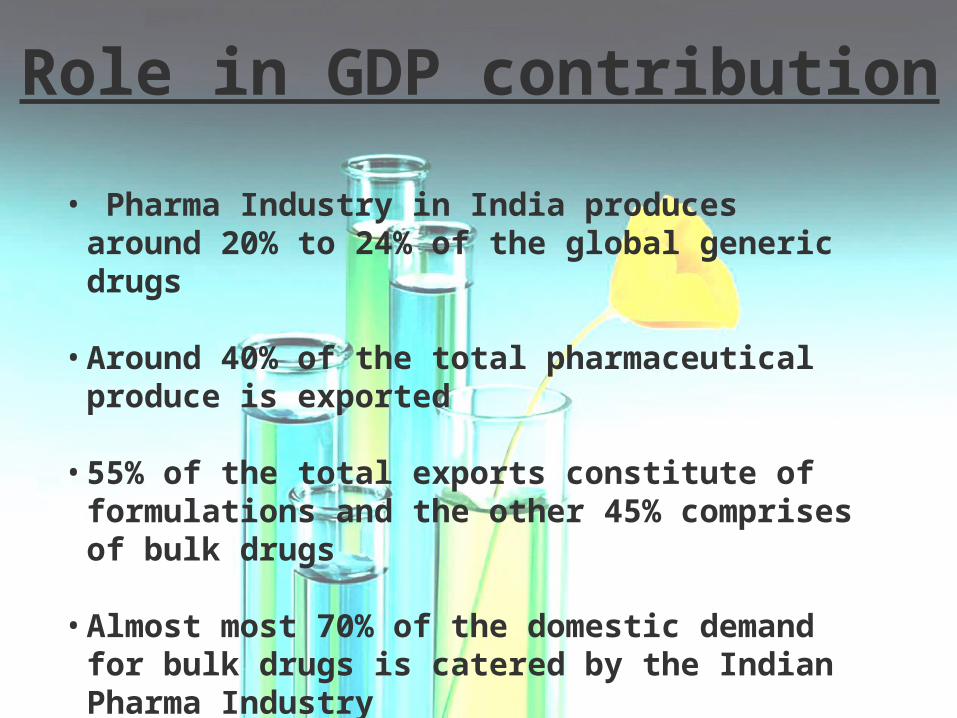
Role in GDP contribution
• Pharma Industry in India produces around 20% to 24% of the global generic drugs
• Around 40% of the total pharmaceutical produce is exported
• 55% of the total exports constitute of formulations and the other 45% comprises of bulk drugs
• Almost most 70% of the domestic demand for bulk drugs is catered by the Indian Pharma Industry
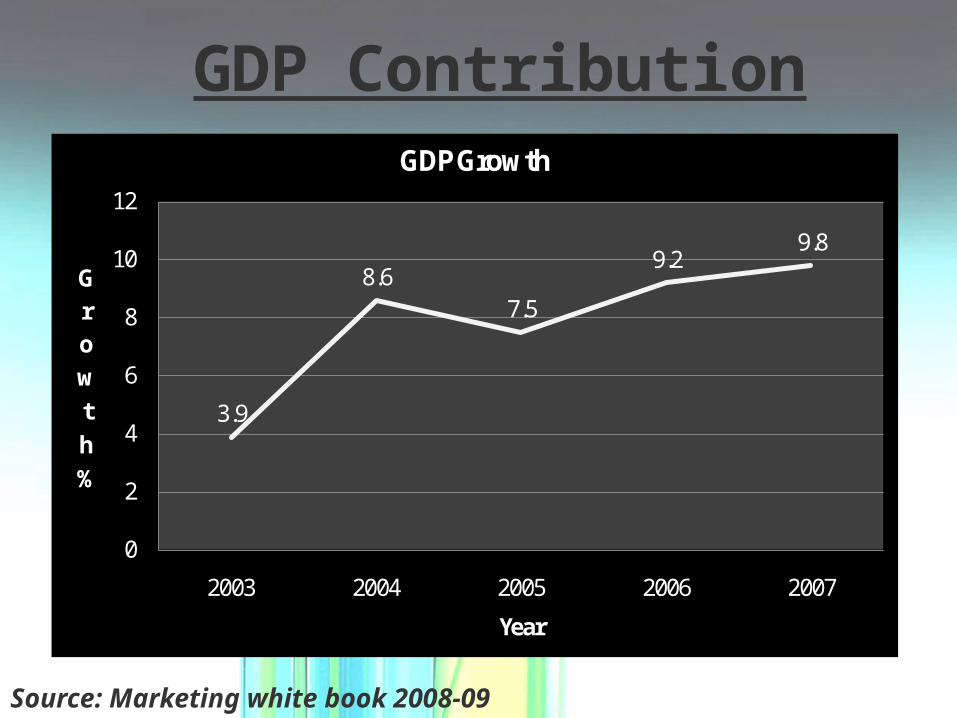
3.9
8.67.5
9.29.8
0
2
4
6
8
10
12
2003 2004 2005 2006 2007
Growth%
Year
GDP Growth
GDP Contribution
Source: Marketing white book 2008-09
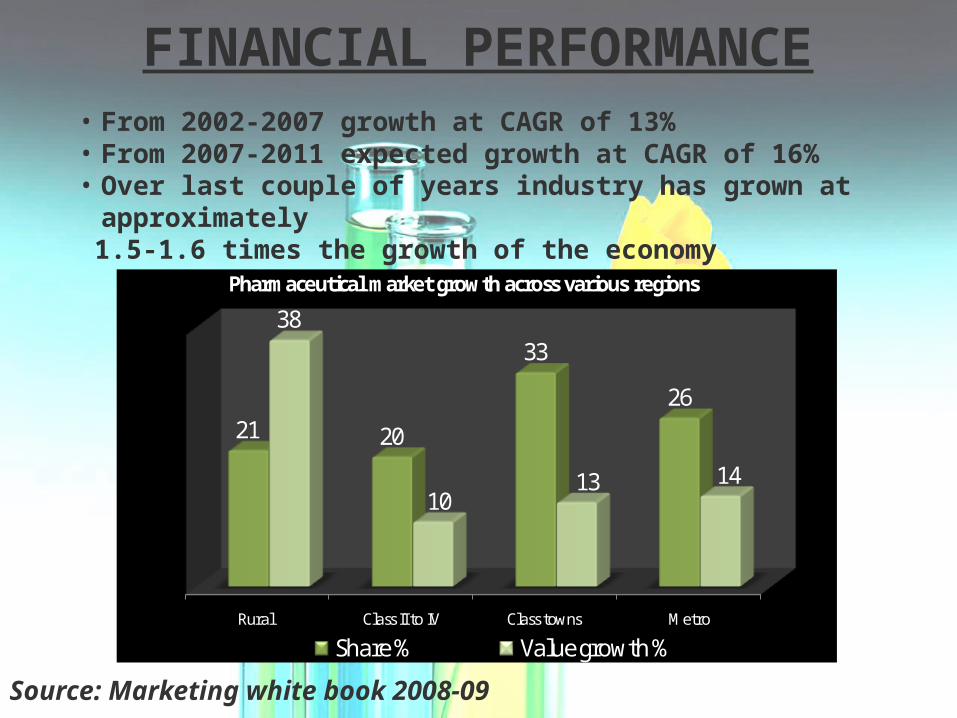
FINANCIAL PERFORMANCE• From 2002-2007 growth at CAGR of 13%• From 2007-2011 expected growth at CAGR of 16%• Over last couple of years industry has grown at
approximately 1.5-1.6 times the growth of the economy
Rural Class II to IV Class towns Metro
21 20
33
26
38
1013 14
Pharmaceutical market growth across various regions
Share % Value growth %
Source: Marketing white book 2008-09
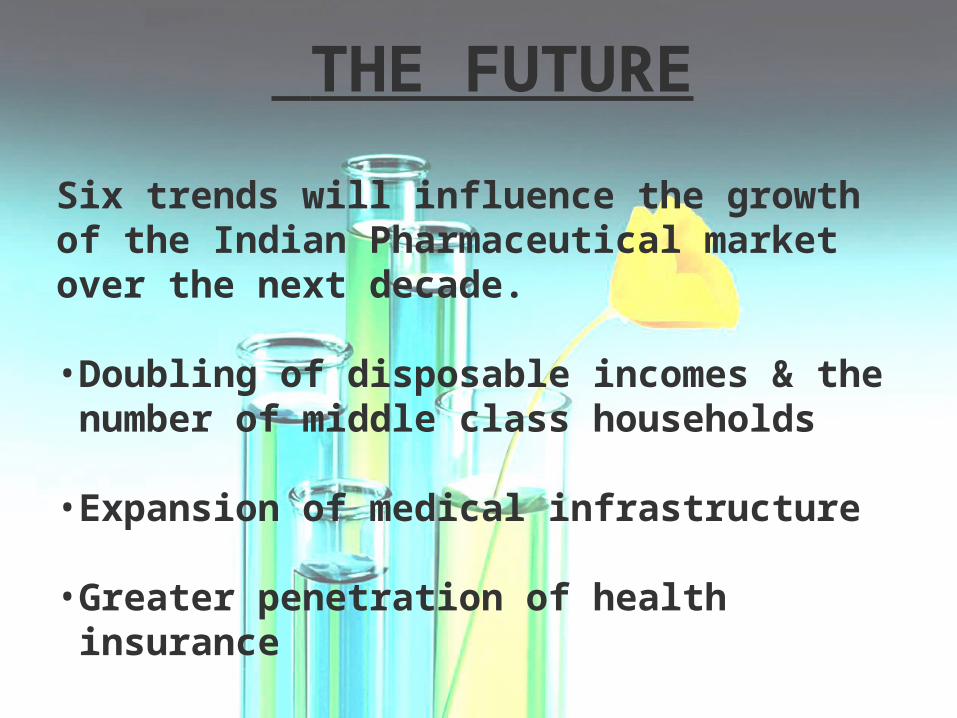
THE FUTURE
Six trends will influence the growth of the Indian Pharmaceutical market over the next decade.
• Doubling of disposable incomes & the number of middle class households
• Expansion of medical infrastructure
• Greater penetration of health insurance
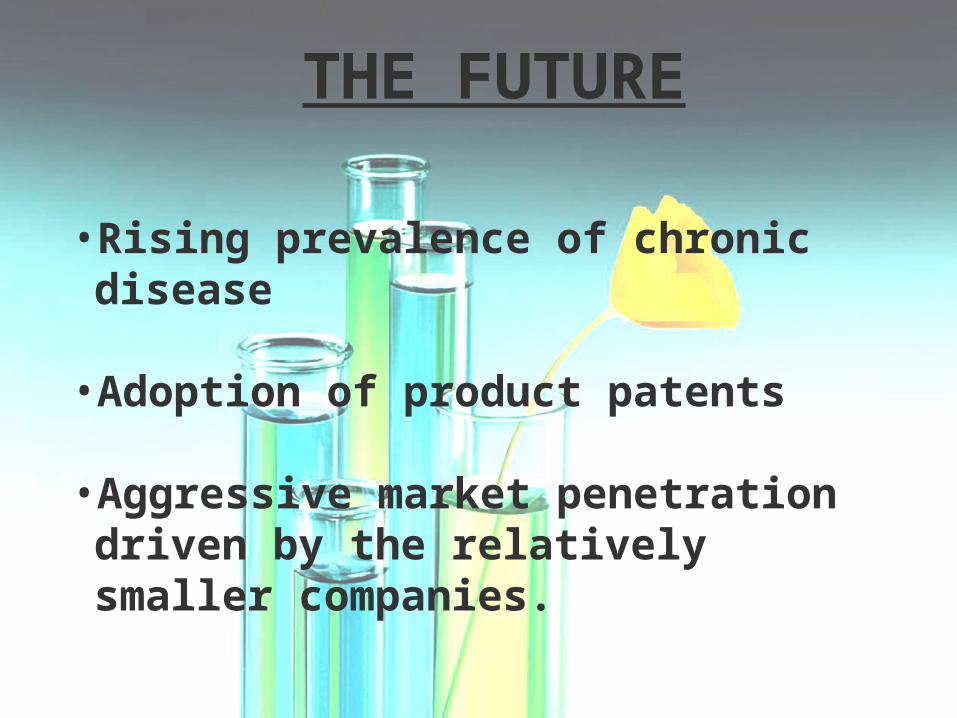
• Rising prevalence of chronic disease
• Adoption of product patents
• Aggressive market penetration driven by the relatively smaller companies.
THE FUTURE
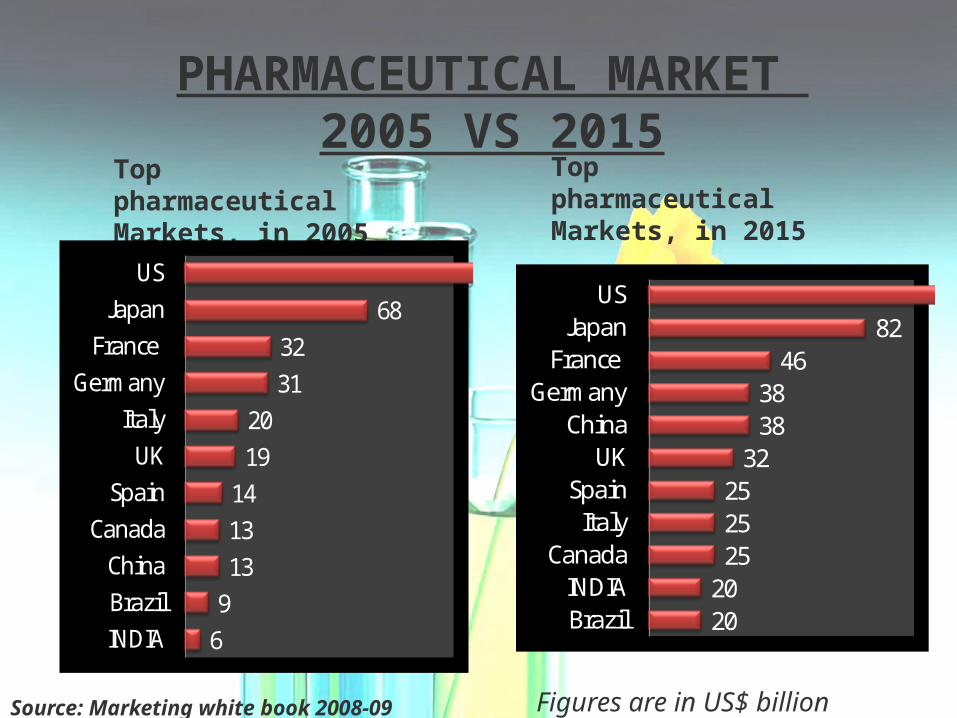
Top pharmaceutical Markets, in 2005
Top pharmaceutical Markets, in 2015
Figures are in US$ billion
PHARMACEUTICAL MARKET 2005 VS 2015
248
69
131314
1920
3132
68
INDIABrazilChina
CanadaSpain
UKItaly
GermanyFrance
JapanUS 444248
2020
252525
323838
4682
BrazilINDIA
CanadaItaly
SpainUK
ChinaGermany
France Japan
US
Source: Marketing white book 2008-09
GLENMARK AT A GLANCE
• Intensively Research-driven
• Truly Global and fully integrated pharmaceutical company
• Headquartered at Mumbai, India.
• Employs over 4100 people across its global operations shares are listed on BSE and NSE
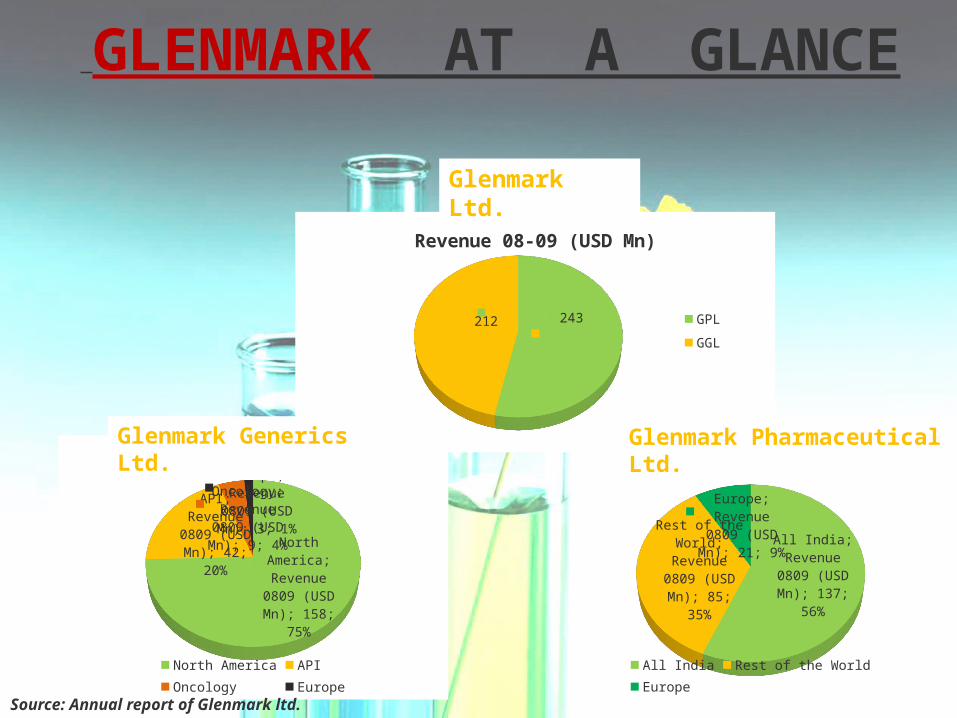
GLENMARK AT A GLANCE
243212
Revenue 08-09 (USD Mn)
GPL
GGL
Glenmark Ltd.
All India; Revenue 0809 (USD Mn);
137; 56%
Rest of the World; Revenue 0809 (USD Mn); 85;
35%
Europe; Revenue 0809 (USD Mn);
21; 9%
All India Rest of the World Europe
Glenmark Pharmaceutical Ltd.
North America; Revenue 0809 (USD Mn); 158;
75%
API; Revenue 0809 (USD Mn);
42; 20%
Oncology; Rev-enue 0809 (USD
Mn); 9; 4%
Europe; Revenue 0809 (USD Mn);
3; 1%
North America API
Oncology Europe
Glenmark Generics Ltd.
Source: Annual report of Glenmark ltd.
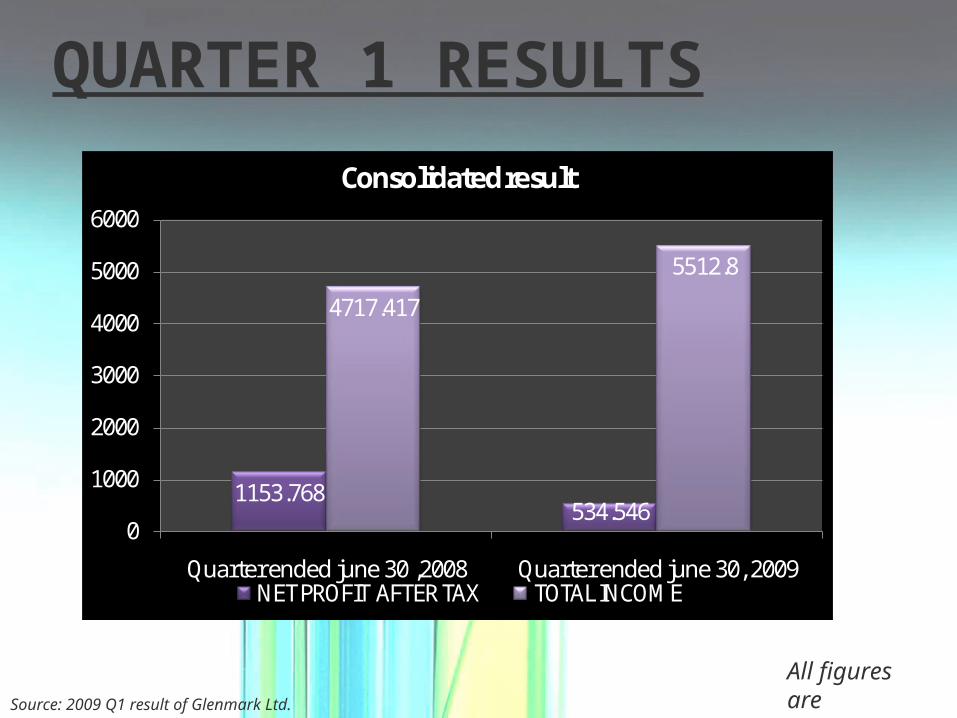
QUARTER 1 RESULTS
1153.768534.546
4717.417
5512.8
0
1000
2000
3000
4000
5000
6000
Quarter ended june 30 ,2008 Quarter ended june 30, 2009
Consolidated result
NET PROFIT AFTER TAX TOTAL INCOME
All figures are in millionSource: 2009 Q1 result of Glenmark Ltd.
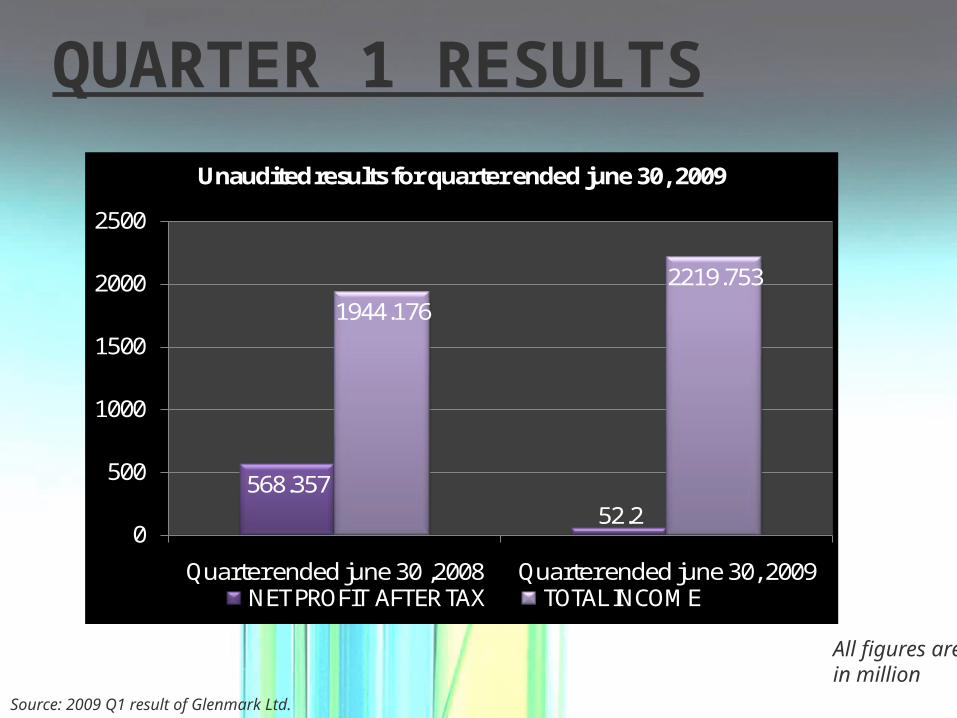
568.35752.2
1944.1762219.753
0
500
1000
1500
2000
2500
Quarter ended june 30 ,2008 Quarter ended june 30, 2009
Unaudited results for quarter ended june 30, 2009
NET PROFIT AFTER TAX TOTAL INCOME
All figures are in million
QUARTER 1 RESULTS
Source: 2009 Q1 result of Glenmark Ltd.
• The expected sales of the for the year was approx 23 crores Indian rupees.
• The actual sales of Glenmark for the year end March,2009 is 21,160,332 crore Indian rupees.
• In comparison to the previous year the sales rose by 10,68,327
SALES
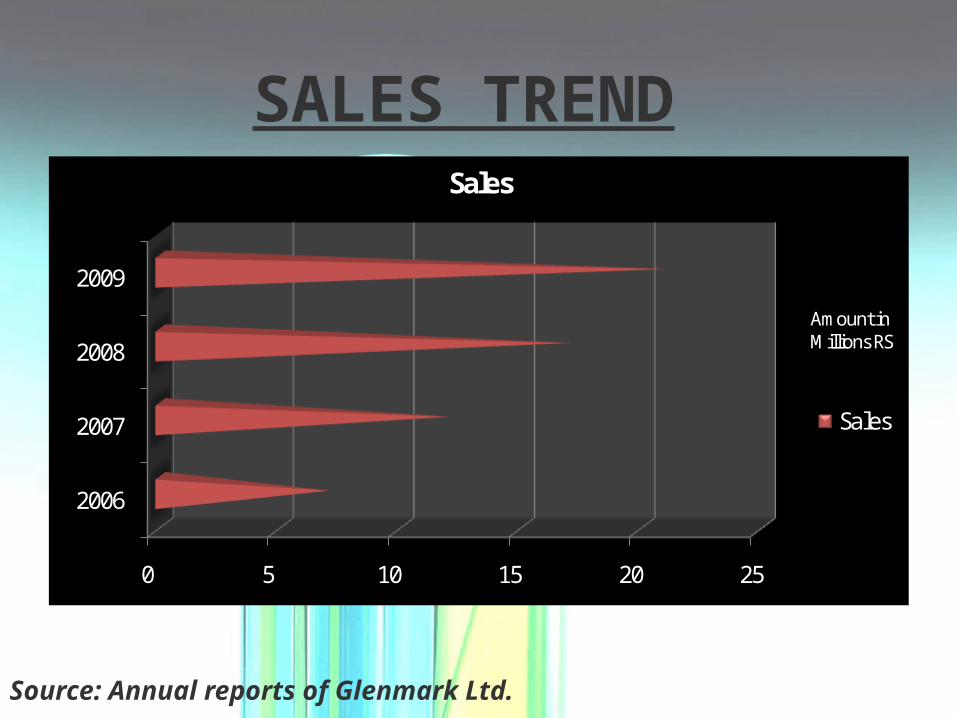
0 5 10 15 20 25
2006
2007
2008
2009
Sales
Sales
Amount in Millions RS
SALES TREND
Source: Annual reports of Glenmark Ltd.
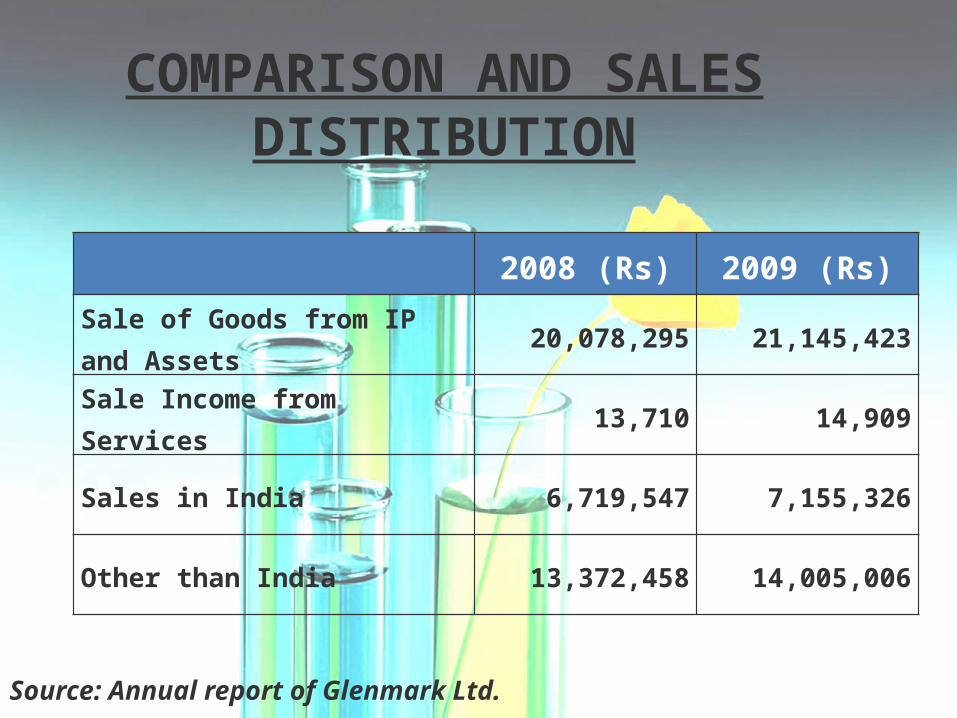
COMPARISON AND SALES DISTRIBUTION
2008 (Rs) 2009 (Rs)
Sale of Goods from IP and Assets 20,078,295 21,145,423
Sale Income from Services 13,710 14,909
Sales in India 6,719,547 7,155,326
Other than India 13,372,458 14,005,006
Source: Annual report of Glenmark Ltd.
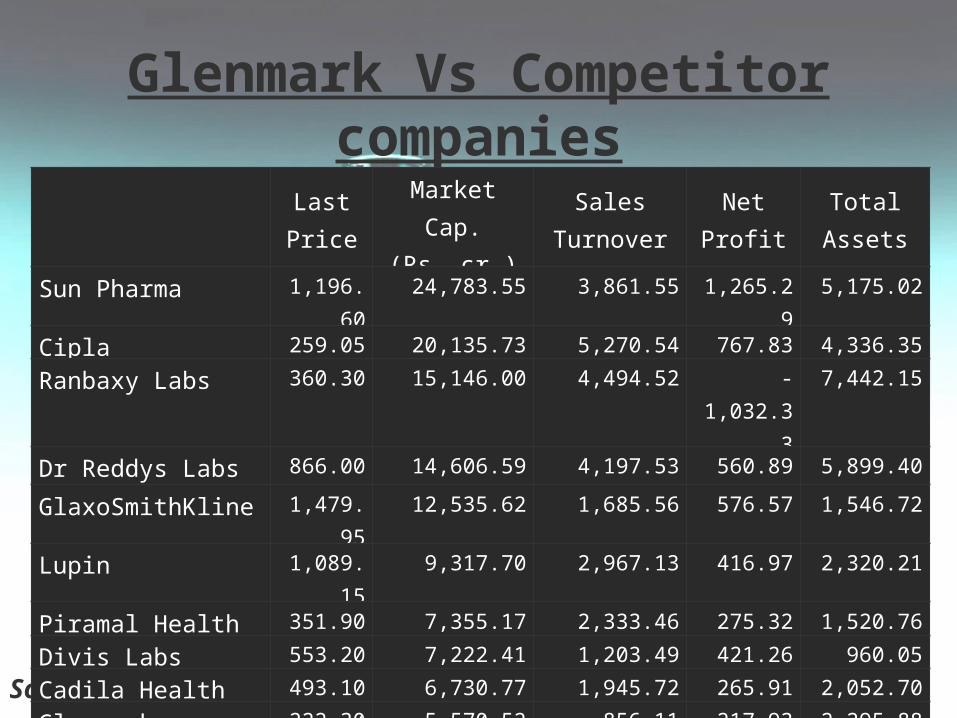
Glenmark Vs Competitor companies
Source: Annual report of Glenmark Ltd.
Last Price
Market Cap.(Rs. cr.)
SalesTurnover
Net Profit
Total Assets
Sun Pharma 1,196.60 24,783.55 3,861.55 1,265.29 5,175.02
Cipla 259.05 20,135.73 5,270.54 767.83 4,336.35
Ranbaxy Labs 360.30 15,146.00 4,494.52 -1,032.33 7,442.15
Dr Reddys Labs 866.00 14,606.59 4,197.53 560.89 5,899.40
GlaxoSmithKline 1,479.95 12,535.62 1,685.56 576.57 1,546.72
Lupin 1,089.15 9,317.70 2,967.13 416.97 2,320.21
Piramal Health 351.90 7,355.17 2,333.46 275.32 1,520.76
Divis Labs 553.20 7,222.41 1,203.49 421.26 960.05
Cadila Health 493.10 6,730.77 1,945.72 265.91 2,052.70
Glenmark 222.30 5,570.52 856.11 217.93 2,295.88
Recent news of Glenmark
Source: Equity Bulls
• Glenmark to issue shares to large investors
• Glenmark Pharmaceuticals allots 198560 Shares
• Glenmark Pharmaceuticals to set Plant at Argentina
• Glenmark Confirms Patent Challenge on Atovaquone & Proguanil Hydrochloride tablets
Conclusion
Source: Equity Bulls
The pharmaceutical industry is such a reliable industry that even an obstacle like recession just helped boost its growth....as per our group analysis it is an industry which is evergreen and everlasting. It is one of the strongest industries which has survived the global meltdown.
PHARMACISTS
Devansh Mehta
THANK YOU!


