
India’s Pulp & Paper Fiber
Sources
Presenter: Jeremy Williams
Forest Trends /UK Aid
Pulp and Paper Legality Validation
March 19 – 20, 2014
India: Key Forest Statistics
• India has 1.85% the world’s forest area; 17%
of its population and 18% of its livestock
• Of 76 million ha classed as forest, 2005 SOF
report concluded only 68 million ha had forest
cover
• 41% of forest classed as “degraded”
• There is heavy use pressure on the forest
2
India: Key Forest Statistics
• 275 million people live in forest areas, including 88 million “tribals” (94%)
• 100 million cattle graze in forests, well above the sustainable level of 31 million
• 175 – 200 million tonnes of green fodder also collected from forests annually
• Fuel wood harvest = 300 million m3/yr versus industrial harvest of 23 million m3/yr
• Key sources of degradation – fuel & cattle
3
India: Key Industry Statistics
• Industry grew in last 20 years off small base
• Avg paper consumption was 4 kg/person/yr in 2000, versus global avg of 45 kg/person/yr
• In 2000, India produced 1.25% of world supply
• Significant proportion of pulp and paper from bagasse (33%), agri-fiber (8%), recycled (21%) and wood & bamboo (38%)
• Many small players – largest company 85-th in industry as measured by sales
• Much of industry is traditional /inefficient
4
India: Wood Supply & Demand
• Timber demand estimated at 58 - 64 million
m3 circa 2000; forecast to reach 153 million
m3 in 2020
• Timber supply estimated at 29 million m3 in
2000, rising to 60 million m3 in 2020
• Wood supply gap now 30 million m3, rising to
93 million m3 in 2020
• Industry desperate for fiber
5
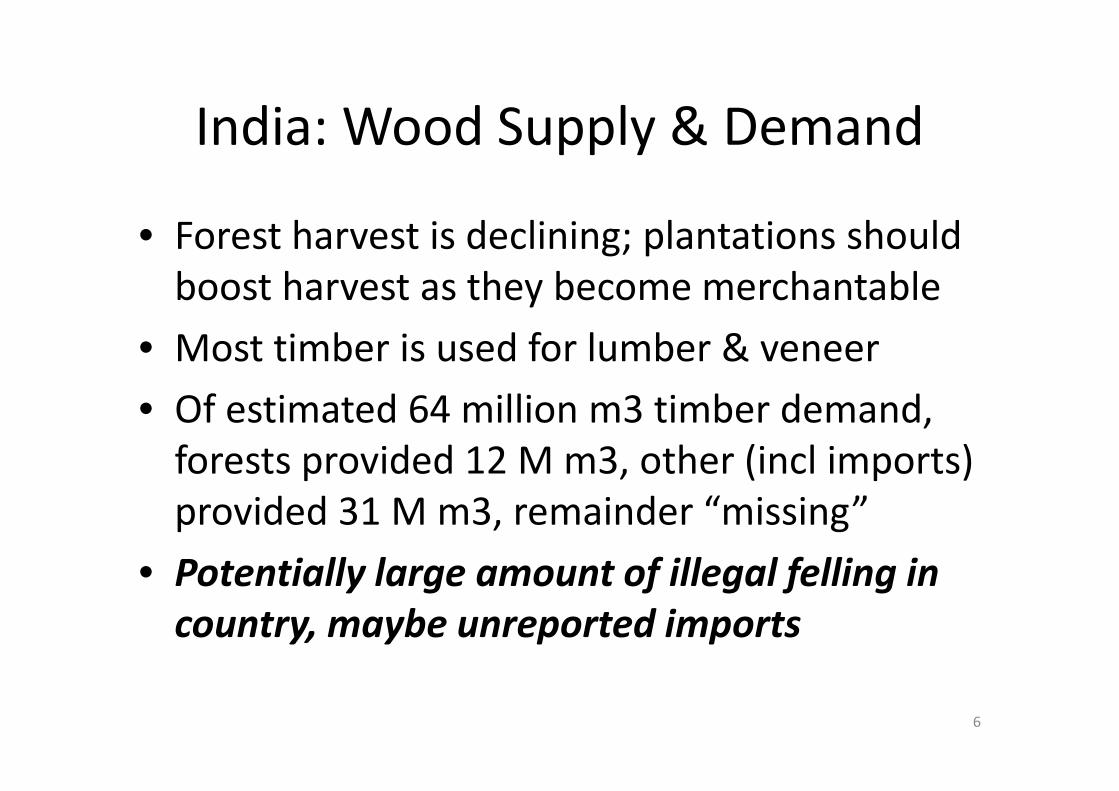
India: Wood Supply & Demand
• Forest harvest is declining; plantations should
boost harvest as they become merchantable
• Most timber is used for lumber & veneer
• Of estimated 64 million m3 timber demand,
forests provided 12 M m3, other (incl imports)
provided 31 M m3, remainder “missing”
• Potentially large amount of illegal felling in
country, maybe unreported imports
6
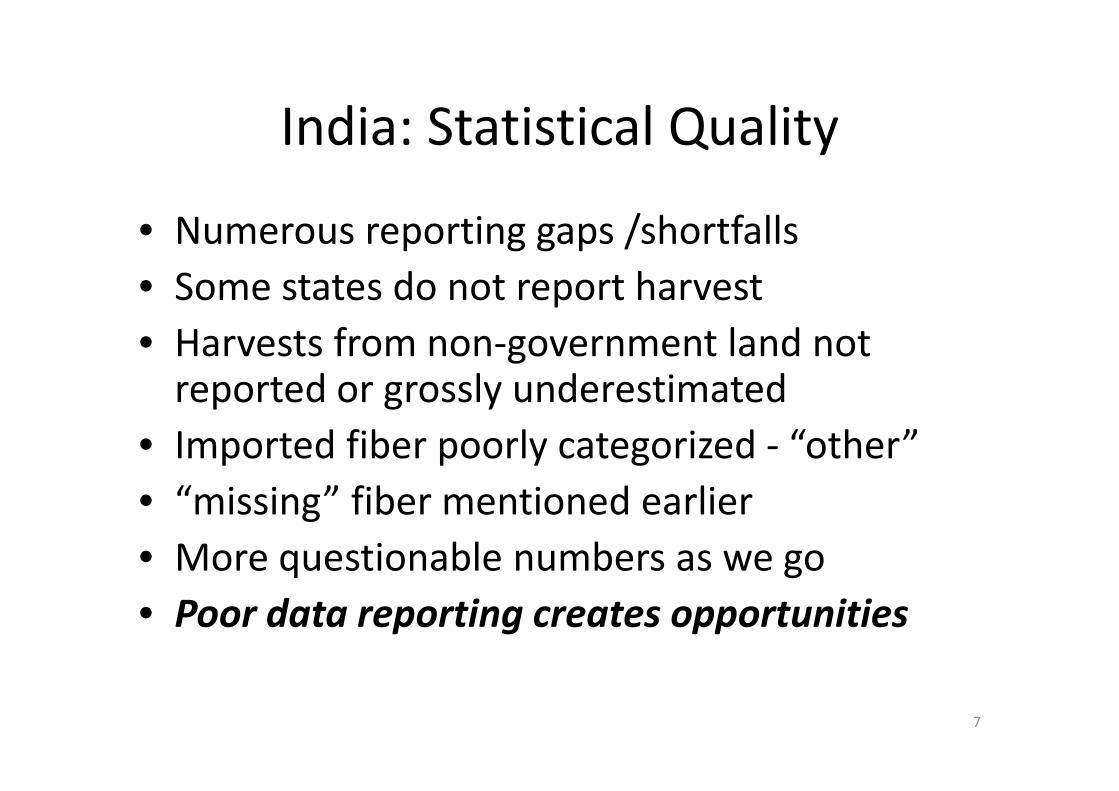
India: Statistical Quality
• Numerous reporting gaps /shortfalls
• Some states do not report harvest
• Harvests from non-government land not reported or grossly underestimated
• Imported fiber poorly categorized - “other”
• “missing” fiber mentioned earlier
• More questionable numbers as we go
• Poor data reporting creates opportunities
7
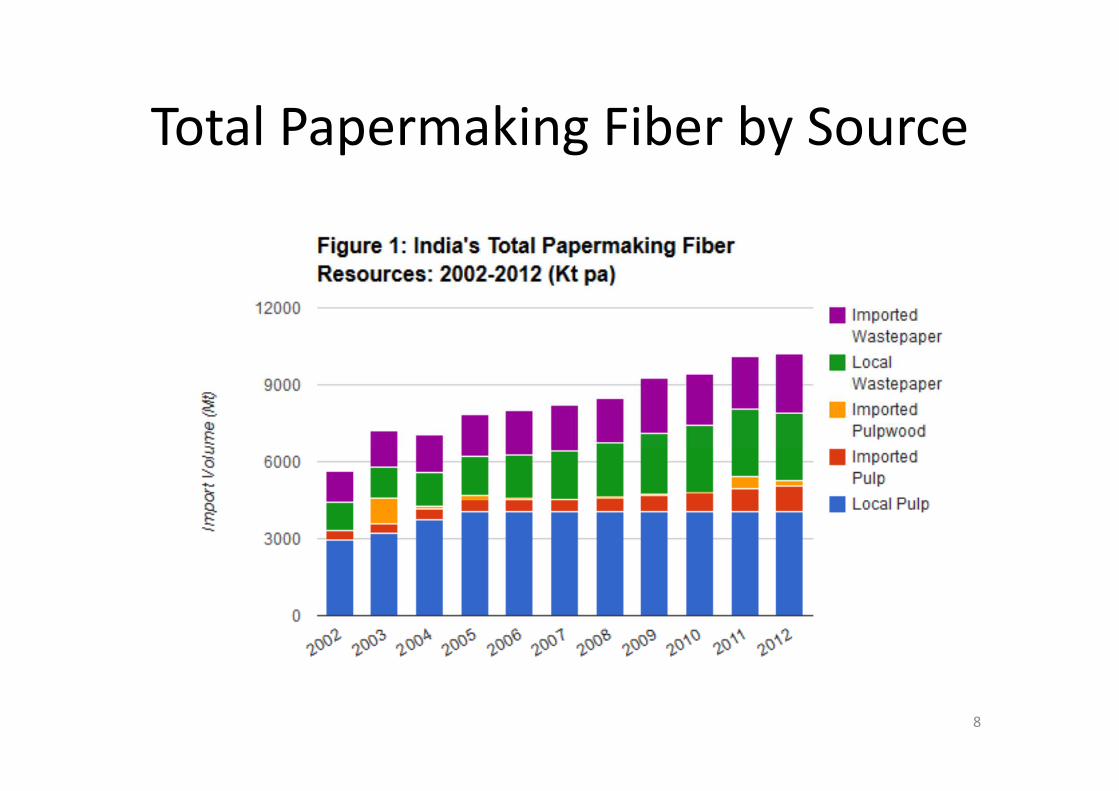
Total Papermaking Fiber by Source
8
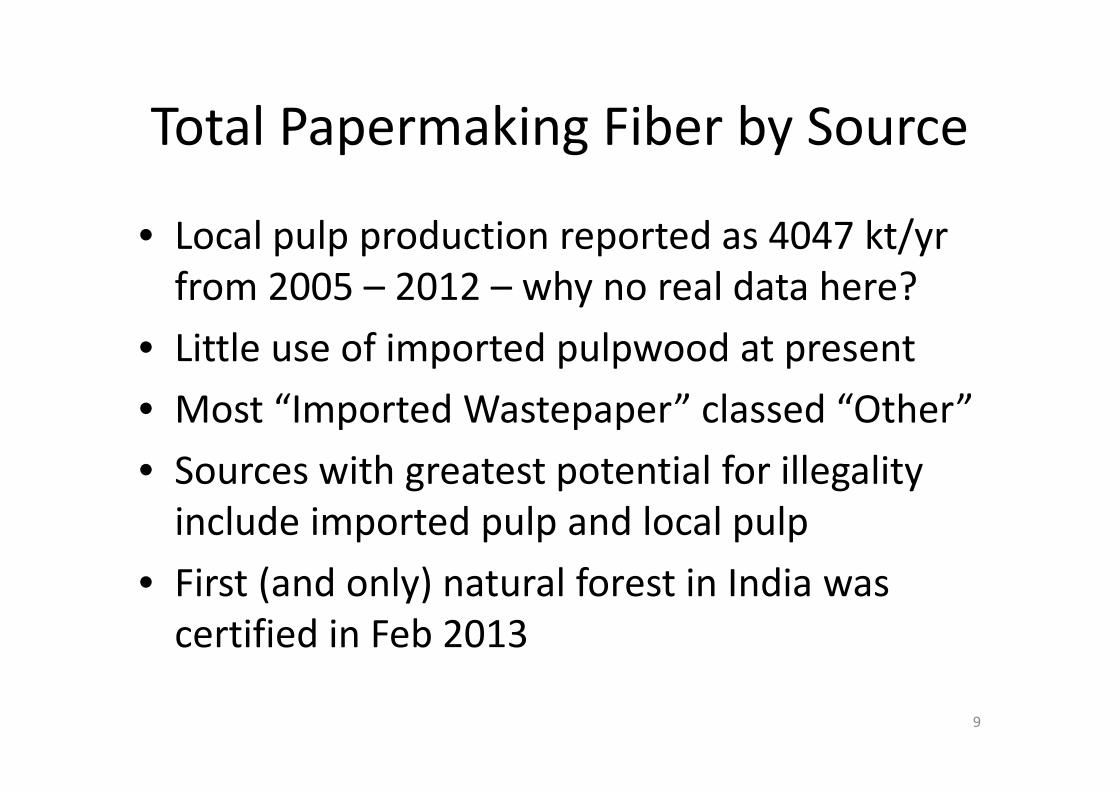
Total Papermaking Fiber by Source
• Local pulp production reported as 4047 kt/yr
from 2005 – 2012 – why no real data here?
• Little use of imported pulpwood at present
• Most “Imported Wastepaper” classed “Other”
• Sources with greatest potential for illegality
include imported pulp and local pulp
• First (and only) natural forest in India was
certified in Feb 2013
9
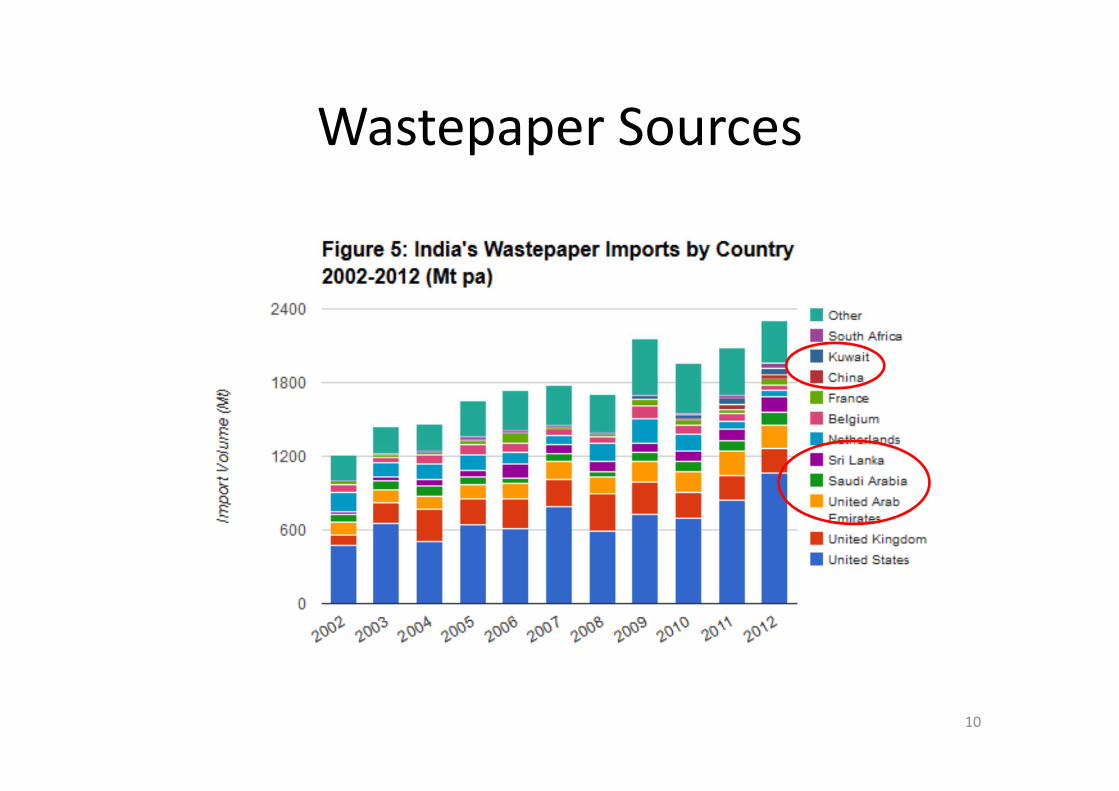
Wastepaper Sources
10
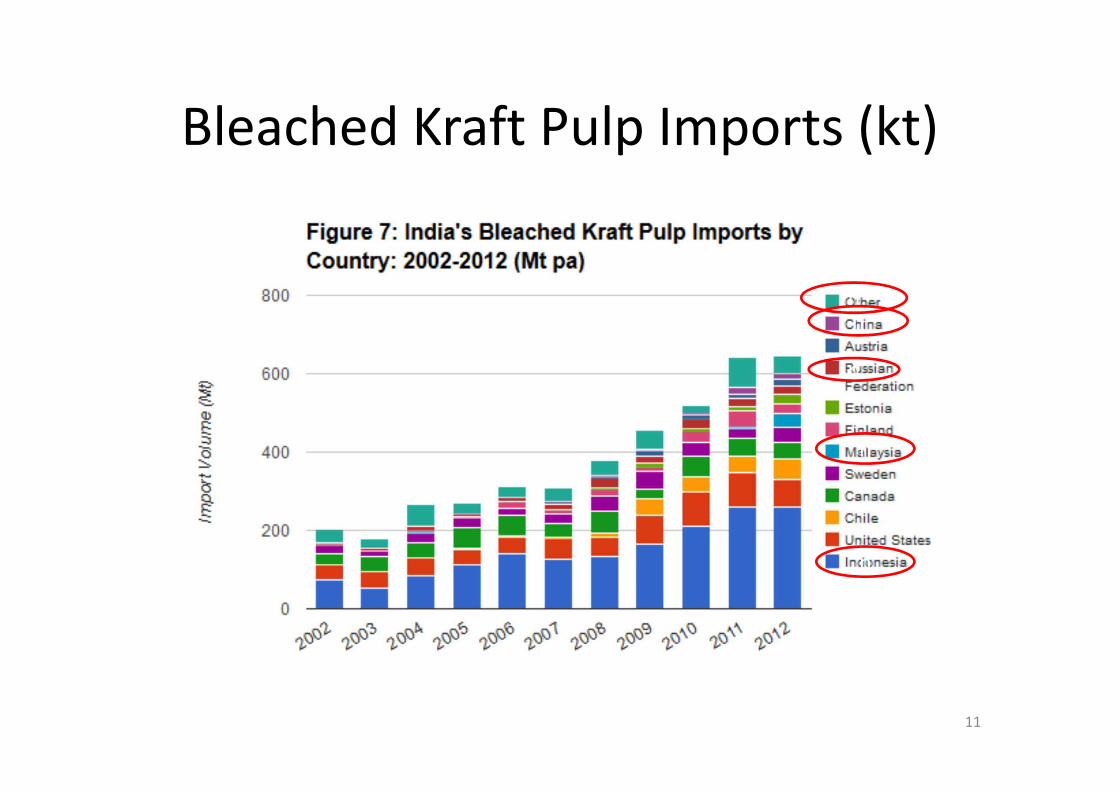
Bleached Kraft Pulp Imports (kt)
n
n
n
n
n
11
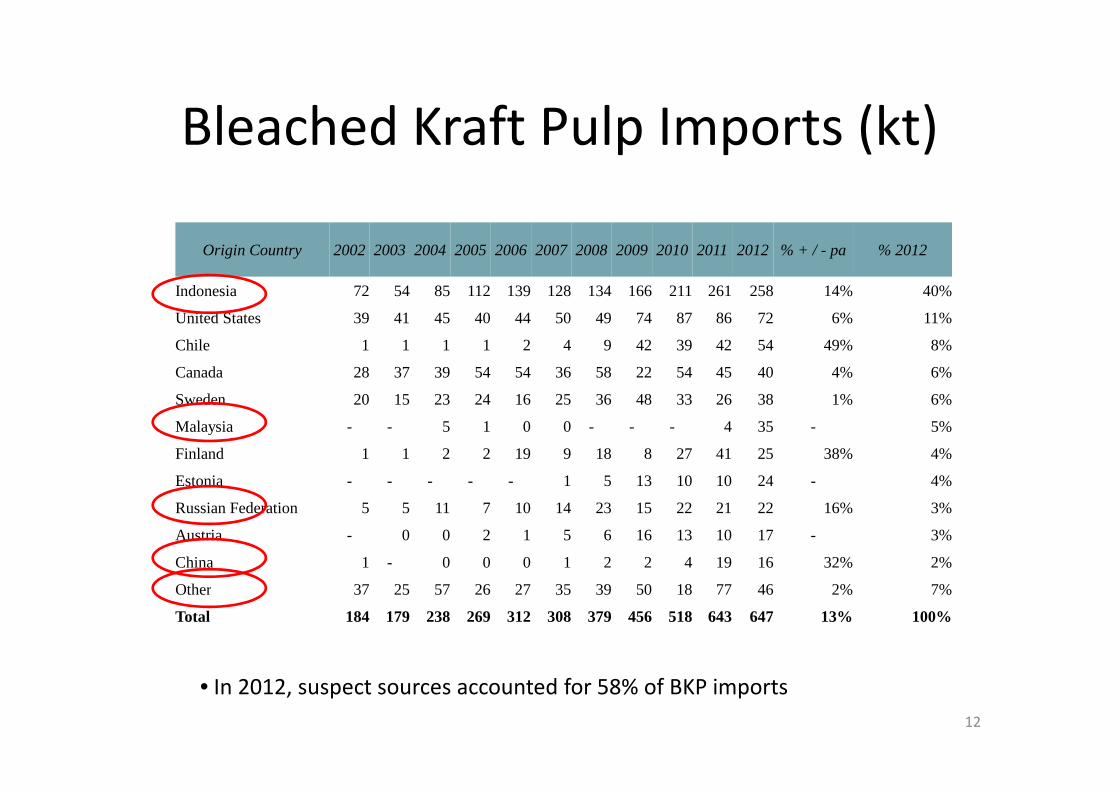
Origin Country 2002 2003 2004 2005 2006 2007 2008 2009 2010 2011 2012 % + / - pa % 2012
Indonesia 72 54 85 112 139 128 134 166 211 261 258 14% 40%
United States 39 41 45 40 44 50 49 74 87 86 72 6% 11%
Chile 1 1 1 1 2 4 9 42 39 42 54 49% 8%
Canada 28 37 39 54 54 36 58 22 54 45 40 4% 6%
Sweden 20 15 23 24 16 25 36 48 33 26 38 1% 6%
Malaysia - - 5 1 0 0 - - - 4 35 - 5%
Finland 1 1 2 2 19 9 18 8 27 41 25 38% 4%
Estonia - - - - - 1 5 13 10 10 24 - 4%
Russian Federation 5 5 11 7 10 14 23 15 22 21 22 16% 3%
Austria - 0 0 2 1 5 6 16 13 10 17 - 3%
China 1 - 0 0 0 1 2 2 4 19 16 32% 2%
Other 37 25 57 26 27 35 39 50 18 77 46 2% 7%
Total 184 179 238 269 312 308 379 456 518 643 647 13% 100%
Bleached Kraft Pulp Imports (kt)
• In 2012, suspect sources accounted for 58% of BKP imports
12
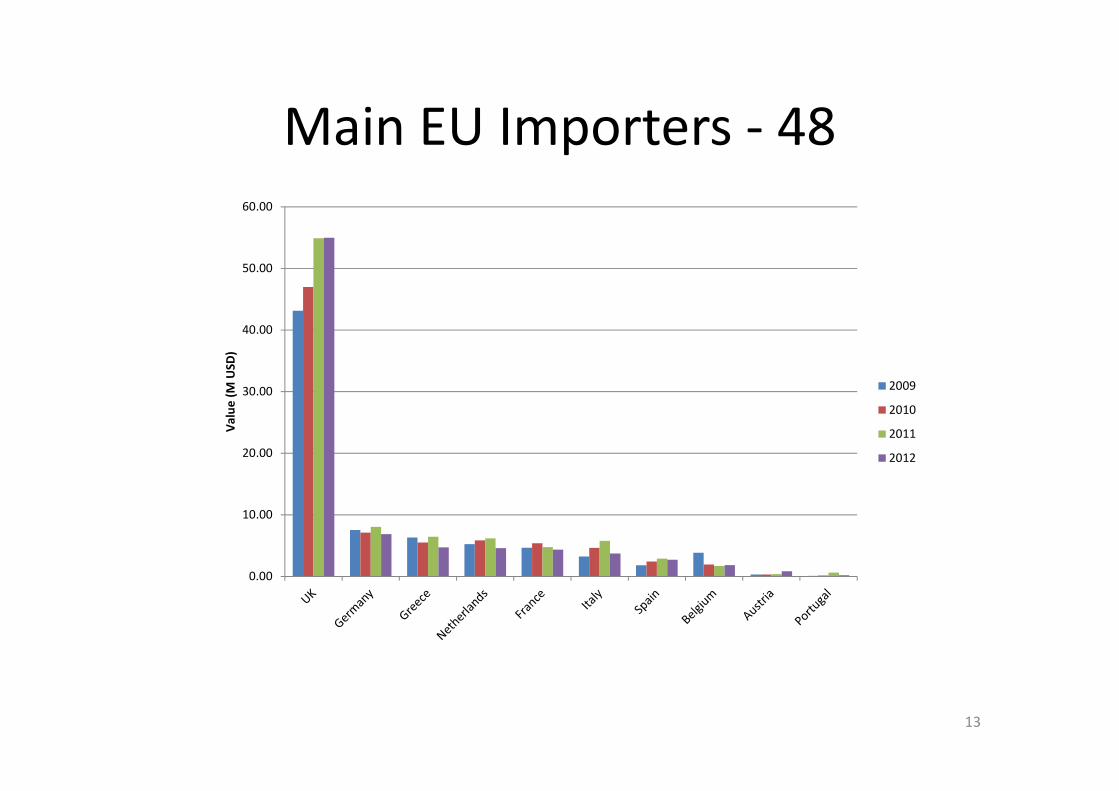
Main EU Importers - 48
13
0.00
10.00
20.00
30.00
40.00
50.00
60.00
Va
lue
(M
US
D)
2009
2010
2011
2012
Conclusions
• Key potential sources of illegal wood are the
domestic harvest and imported pulp
• Estimate local wood based pulp production at
say 33% of 4047 kt/year
• Amount of pulp from suspect source countries
was 377 kt in 2012
• Estimated amount of fiber at risk of illegality is
1712 kt, or 17% of wood fibre
14
Conclusions
• In addition to traditional paper fiber, there is a
significant import of tropical hardwoods for
lumber, especially teak
• Major suppliers in 2000 were Malaysia,
Indonesia, Ivory Coast, Nigeria, and Myanmar
• Chips, sawdust and other by-products may
end up in supply, another potential source of
illegal fiber in the pulp & paper supply chain
15

16
Questions ??


