1
In a Placebo Controlled 36 Week Phase 2 Trial, Treatment with MGL-3196 Compared to Placebo Results in Significant Reductions in Hepatic Fat (MRI-PDFF), Liver Enzymes, Fibrosis Biomarkers, Atherogenic Lipids, and Improvement in NASH on Serial Liver Biopsy
Dr. Stephen A. Harrison, Dr. Cynthia D. Guy, Dr. Mustafa Bashir, Dr. Juan Pablo Frias, Dr. Naim Alkhouri, Dr. Seth Baum, Dr. Rebecca Taub, Dr. Cynthia A. Moylan, Dr. Meena B. Bansal, Dr. Brent A. Neuschwander-Tetri, Dr. Sam Moussa
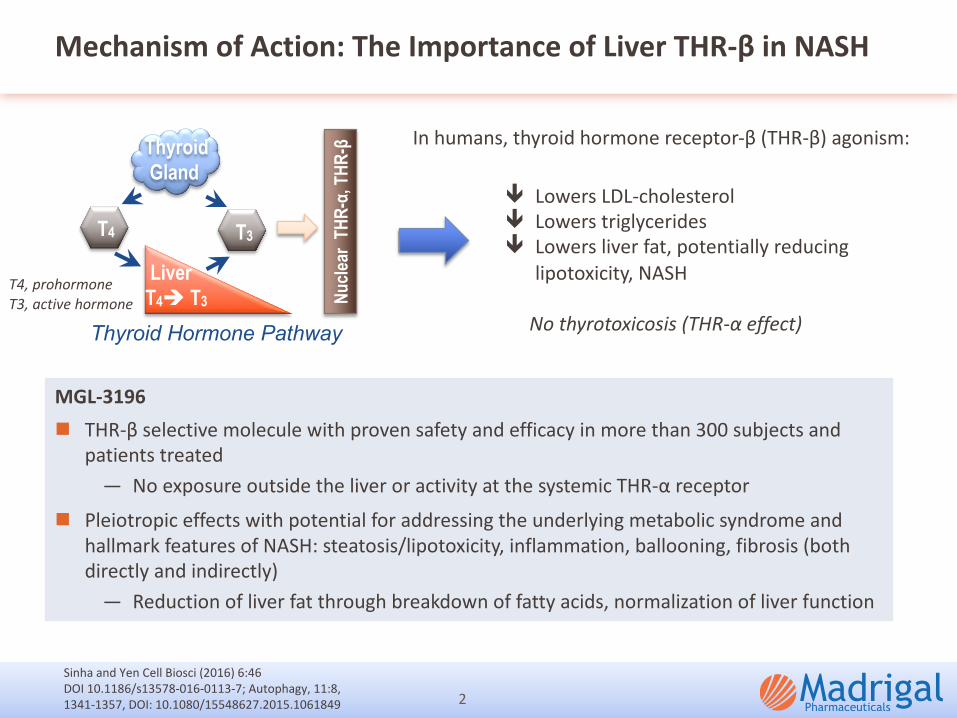
Mechanism of Action: The Importance of Liver THR-β in NASH
2
ê Lowers LDL-cholesterol
ê Lowers triglycerides
ê Lowers liver fat, potentially reducing
lipotoxicity, NASH
No thyrotoxicosis (THR-α effect)
In humans, thyroid hormone receptor-β (THR-β) agonism:
Sinha and Yen Cell Biosci (2016) 6:46
DOI 10.1186/s13578-016-0113-7; Autophagy, 11:8,
1341-1357, DOI: 10.1080/15548627.2015.1061849
MGL-3196n THR-β selective molecule with proven safety and efficacy in more than 300 subjects and
patients treated
— No exposure outside the liver or activity at the systemic THR-α receptor
n Pleiotropic effects with potential for addressing the underlying metabolic syndrome and
hallmark features of NASH: steatosis/lipotoxicity, inflammation, ballooning, fibrosis (both
directly and indirectly)
— Reduction of liver fat through breakdown of fatty acids, normalization of liver function
Thyroid Gland
Liver T4è T3
T3
Nucl
ear
THR-
α, T
HR-β
Thyroid Hormone Pathway
T4T4
T4, prohormoneT3, active hormone
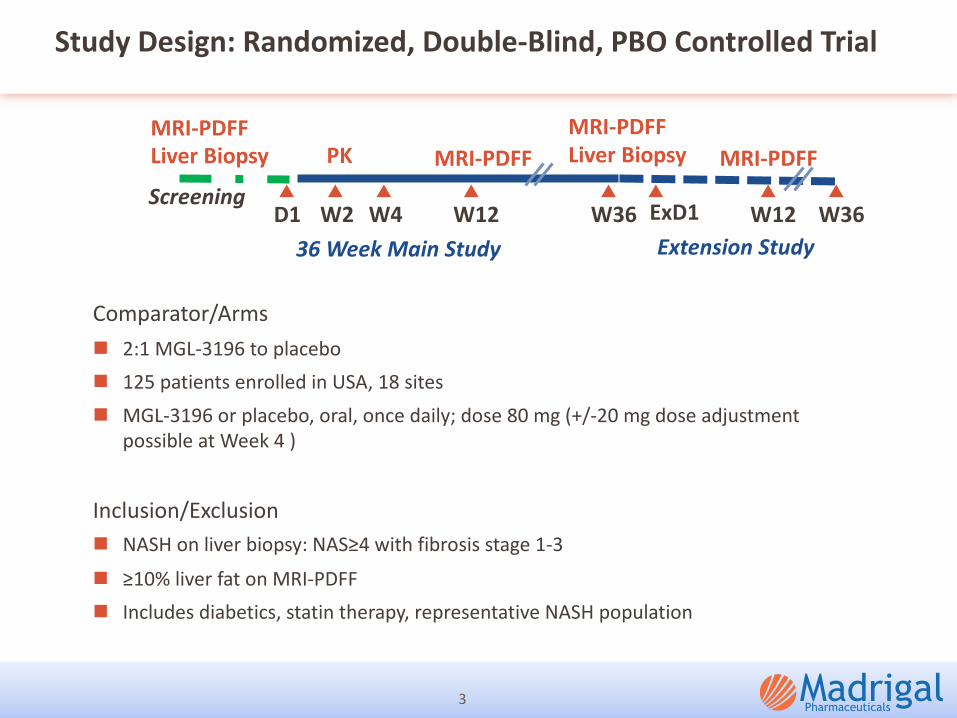
Study Design: Randomized, Double-Blind, PBO Controlled Trial
3
Extension Study
Screening
MRI-PDFFLiver Biopsy
MRI-PDFFLiver BiopsyMRI-PDFF MRI-PDFFPK
Comparator/Armsn 2:1 MGL-3196 to placebon 125 patients enrolled in USA, 18 sitesn MGL-3196 or placebo, oral, once daily; dose 80 mg (+/-20 mg dose adjustment
possible at Week 4 )
Inclusion/Exclusion n NASH on liver biopsy: NAS≥4 with fibrosis stage 1-3
n ≥10% liver fat on MRI-PDFFn Includes diabetics, statin therapy, representative NASH population
D1 W2 W4 W12 W36 W12 W36ExD136 Week Main Study
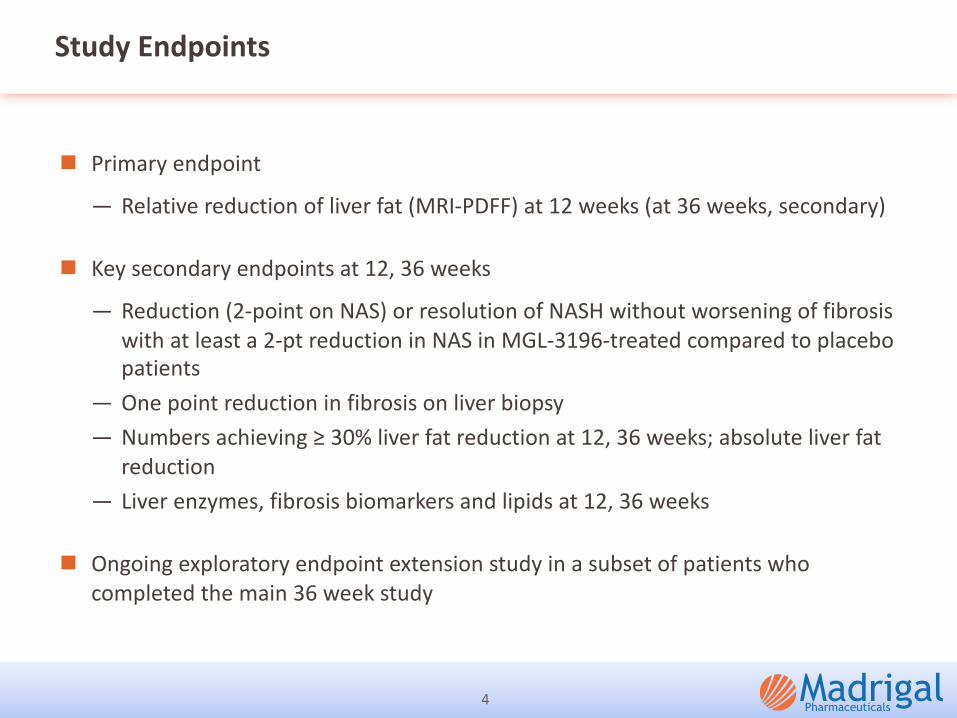
Study Endpoints
n Primary endpoint
— Relative reduction of liver fat (MRI-PDFF) at 12 weeks (at 36 weeks, secondary)
n Key secondary endpoints at 12, 36 weeks
— Reduction (2-point on NAS) or resolution of NASH without worsening of fibrosis with at least a 2-pt reduction in NAS in MGL-3196-treated compared to placebo patients
— One point reduction in fibrosis on liver biopsy— Numbers achieving ≥ 30% liver fat reduction at 12, 36 weeks; absolute liver fat
reduction— Liver enzymes, fibrosis biomarkers and lipids at 12, 36 weeks
n Ongoing exploratory endpoint extension study in a subset of patients who completed the main 36 week study
4
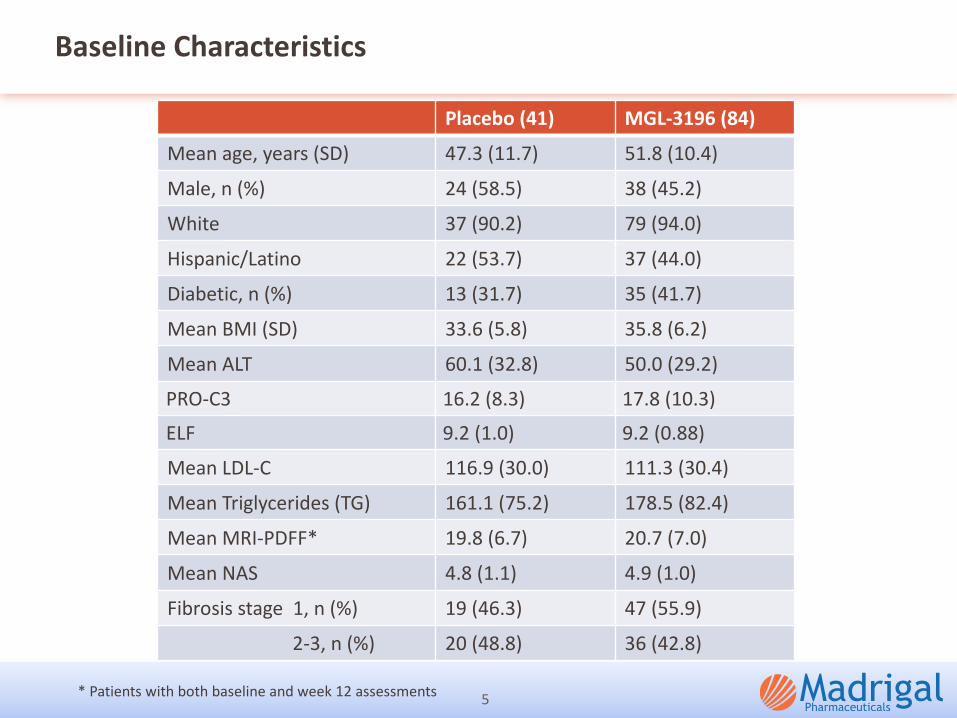
Baseline Characteristics
Placebo (41) MGL-3196 (84)Mean age, years (SD) 47.3 (11.7) 51.8 (10.4)
Male, n (%) 24 (58.5) 38 (45.2)
White 37 (90.2) 79 (94.0)
Hispanic/Latino 22 (53.7) 37 (44.0)
Diabetic, n (%) 13 (31.7) 35 (41.7)
Mean BMI (SD) 33.6 (5.8) 35.8 (6.2)
Mean ALT 60.1 (32.8) 50.0 (29.2)
PRO-C3 16.2 (8.3) 17.8 (10.3)
ELF 9.2 (1.0) 9.2 (0.88)
Mean LDL-C 116.9 (30.0) 111.3 (30.4)
Mean Triglycerides (TG) 161.1 (75.2) 178.5 (82.4)
Mean MRI-PDFF* 19.8 (6.7) 20.7 (7.0)
Mean NAS 4.8 (1.1) 4.9 (1.0)
Fibrosis stage 1, n (%) 19 (46.3) 47 (55.9)
2-3, n (%) 20 (48.8) 36 (42.8)
5* Patients with both baseline and week 12 assessments
18
6075
11
61
30
68 77
22
68
0
20
40
60
80
100
12 36 12 36 12 36 12 36 12 36p<0.0001 p<0.0001 ND p=0.009
>= 30% Fat Reduction (% )
F2/F3
Week
-1.6
-7.6 -8.8
-2.3
-8.5 -9.4
-11
-9
-7
-5
-3
-1
p<0.0001 p<0.0001
Absolute Change MRI-PDFF (% )
Week 12 36 12 36 12 36
-10
-36-42
-8
-37-49
-50
-40
-30
-20
-10
0
p<0.0001 p<0.0001
Relative Change MRI-PDFF (% )
Week 12 36 12 36 12 36
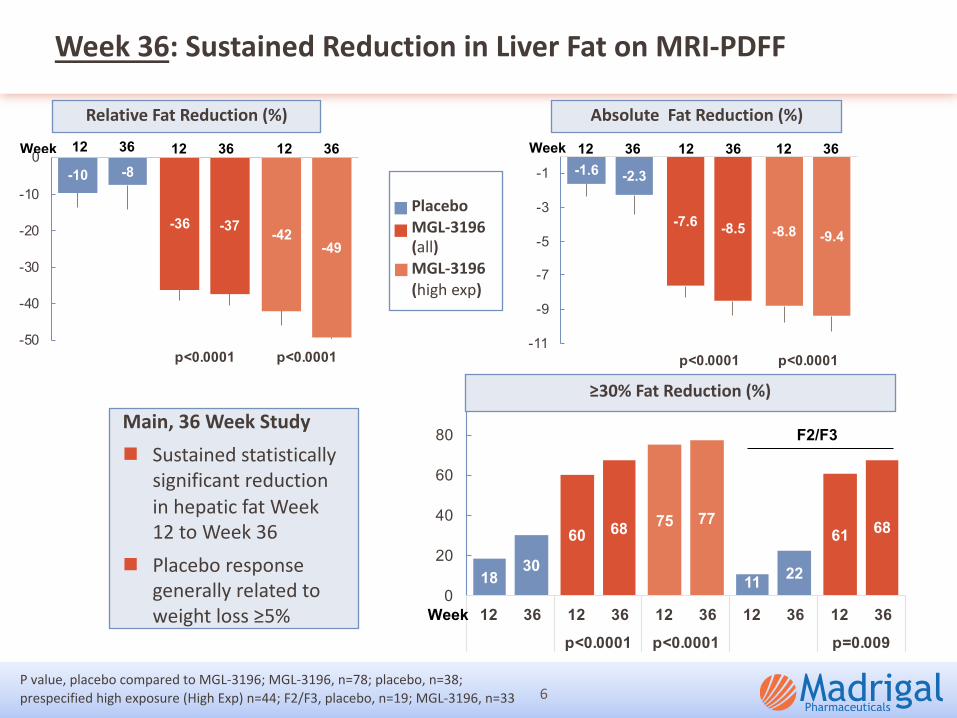
Week 36: Sustained Reduction in Liver Fat on MRI-PDFF
6
Relative Fat Reduction (%)
≥30% Fat Reduction (%)
Main, 36 Week Studyn Sustained statistically
significant reduction in hepatic fat Week 12 to Week 36
n Placebo response generally related to weight loss ≥5%
P value, placebo compared to MGL-3196; MGL-3196, n=78; placebo, n=38; prespecified high exposure (High Exp) n=44; F2/F3, placebo, n=19; MGL-3196, n=33
PlaceboMGL-3196 (all)MGL-3196 (high exp)
Absolute Fat Reduction (%)
0.6
-10
-14
-12
-10
-8
-6
-4
-2
0
2
7
87
0
20
40
60
80
100-1.9
-50
-60
-50
-40
-30
-20
-10
0
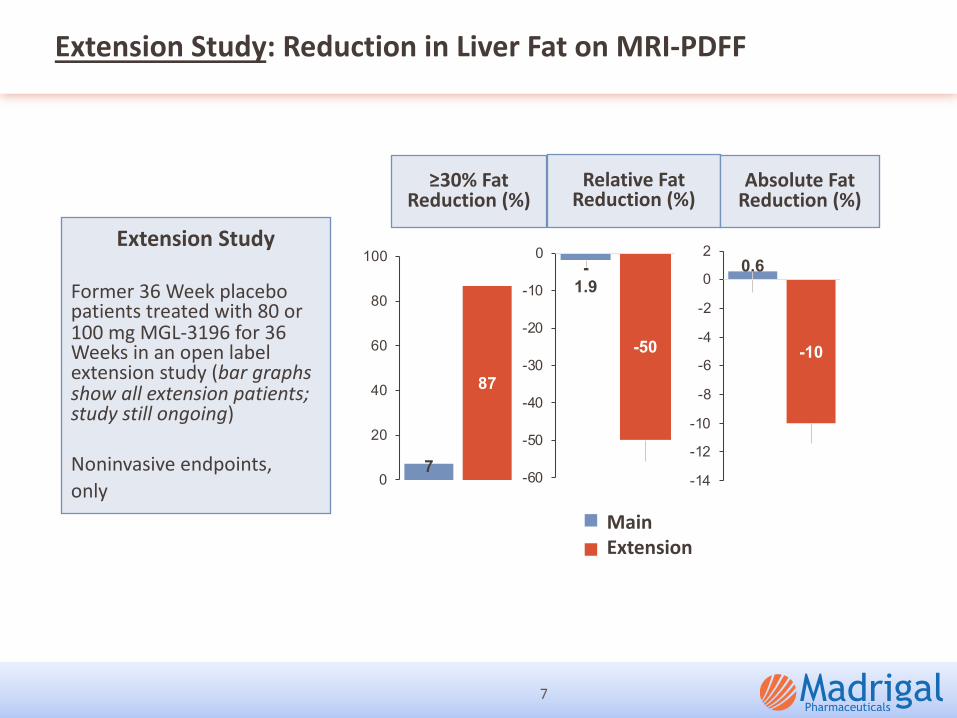
Extension Study: Reduction in Liver Fat on MRI-PDFF
7
≥30% Fat Reduction (%)
Relative Fat Reduction (%)
Absolute Fat Reduction (%)
Extension Study
Former 36 Week placebo patients treated with 80 or 100 mg MGL-3196 for 36 Weeks in an open label extension study (bar graphs show all extension patients; study still ongoing)
Noninvasive endpoints,only
Main Extension
-22.3 -21.9
-36 -36.8 -36.5
-50
-40
-30
-20
-10
0
LDL-C(BL>100)
ApoB TGs Lp(a)(BL>=10)
ApoCIII
p<0.0001 p<0.0001 p<0.0001 p<0.001 p<0.0001
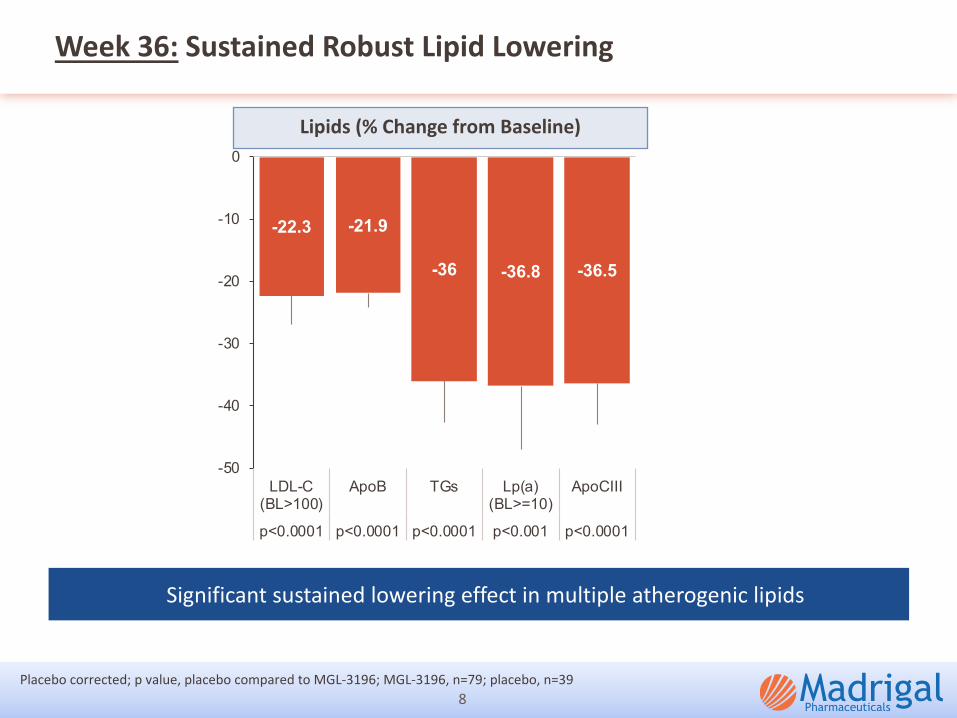
Week 36: Sustained Robust Lipid Lowering
Significant sustained lowering effect in multiple atherogenic lipids
8
Lipids (% Change from Baseline)
Placebo corrected; p value, placebo compared to MGL-3196; MGL-3196, n=79; placebo, n=39
-20
-10
0
10
20
0 12 36 38
% C
hang
e
Week
0
10
20
30
40
50
60
0 12 36 38
U/L
Week
01020304050607080
0 12 36 38
U/L
Week
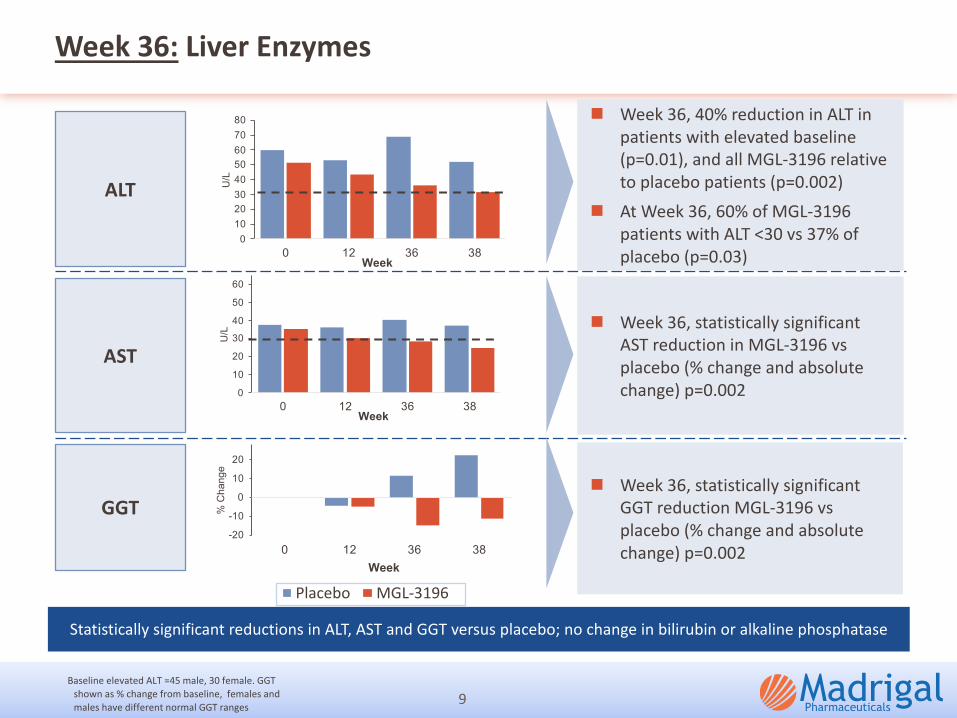
Week 36: Liver Enzymes
ALT
AST
GGT
Statistically significant reductions in ALT, AST and GGT versus placebo; no change in bilirubin or alkaline phosphatase
(10.0)
0.0
10.0
20.0
30.0
0 12 24 36 38
U/L
WeekPlacebo MGL-3196
9Baseline elevated ALT =45 male, 30 female. GGT
shown as % change from baseline, females and males have different normal GGT ranges
n Week 36, 40% reduction in ALT in patients with elevated baseline (p=0.01), and all MGL-3196 relative to placebo patients (p=0.002)
n At Week 36, 60% of MGL-3196 patients with ALT <30 vs 37% of placebo (p=0.03)
n Week 36, statistically significant AST reduction in MGL-3196 vs placebo (% change and absolute change) p=0.002
n Week 36, statistically significant GGT reduction MGL-3196 vs placebo (% change and absolute change) p=0.002
3251
65 61
18
47
0
10
20
30
40
50
60
70
p=0.09 p=0.006 p=0.02 p=0.02
% o
f bio
psie
s <5% Weight loss
6
2739
2537
05
1015202530354045
p=0.02 p=0.001 p=0.03 p=0.003
% o
f bio
psie
s
no fibrosis worsening
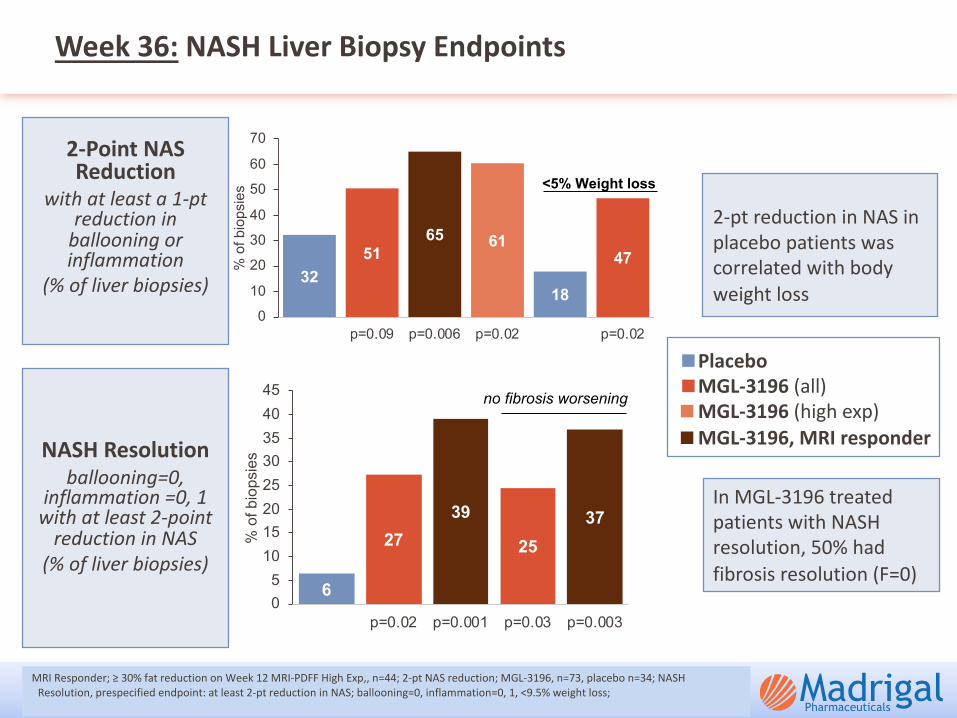
Week 36: NASH Liver Biopsy Endpoints
10
2-pt reduction in NAS in placebo patients was correlated with body weight loss
MRI Responder; ≥ 30% fat reduction on Week 12 MRI-PDFF High Exp,, n=44; 2-pt NAS reduction; MGL-3196, n=73, placebo n=34; NASH Resolution, prespecified endpoint: at least 2-pt reduction in NAS; ballooning=0, inflammation=0, 1, <9.5% weight loss;
PlaceboMGL-3196 (all)MGL-3196 (high exp)MGL-3196, MRI responder
In MGL-3196 treated patients with NASH resolution, 50% had fibrosis resolution (F=0)
2-Point NAS Reduction
with at least a 1-pt reduction in
ballooning or inflammation
(% of liver biopsies)
NASH Resolutionballooning=0,
inflammation =0, 1 with at least 2-point
reduction in NAS(% of liver biopsies)
-100-80
-60-40-20
02040
60
-3 -2 -1 0 1 2% C
hang
e in
MR
I-PD
FF (W
eek
12)
Change in Ballooning Plus Inflammation
MGL-3196
37
405
10152025303540
p=0.001
MRI-PDFFResponder
MRI-PDFFNon-
Responder
MGL-3196-treated
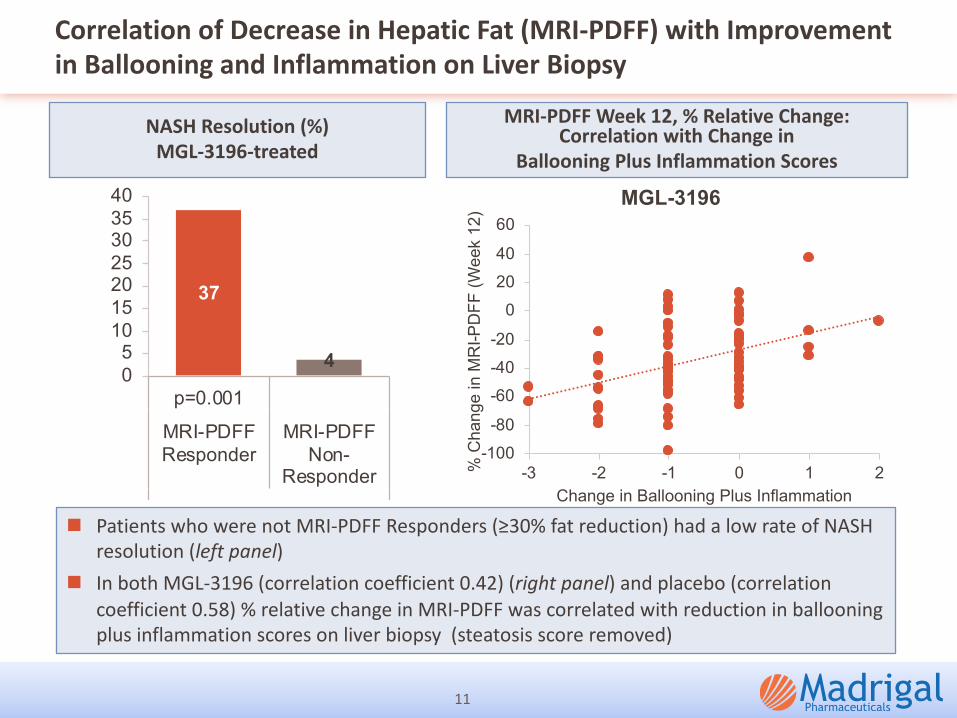
NASH Resolution (%)
Correlation of Decrease in Hepatic Fat (MRI-PDFF) with Improvement
in Ballooning and Inflammation on Liver Biopsy
11
n Patients who were not MRI-PDFF Responders (≥30% fat reduction) had a low rate of NASH resolution (left panel)
n In both MGL-3196 (correlation coefficient 0.42) (right panel) and placebo (correlation coefficient 0.58) % relative change in MRI-PDFF was correlated with reduction in ballooning plus inflammation scores on liver biopsy (steatosis score removed)
NASH Resolution (%)
MGL-3196-treated
MRI-PDFF Week 12, % Relative Change: Correlation with Change in
Ballooning Plus Inflammation Scores
-0.40-0.48
-0.62 -0.63
-1.00
-0.80
-0.60
-0.40
-0.20
0.00
12 36 36 36
p=0.009 p=0.02 p=0.007 p=0.05
-59
-171-230
-363
-600
-500
-400
-300
-200
-100
0
12 36 36 36
NS p=0.003 p=0.0004 p=0.02
NA -25% -33% -38%
-2.7 -7.7 -8.6
-21.4
-32.1
-50.0
-40.0
-30.0
-20.0
-10.0
0.0
12 36 12 36 36
p=0.08 p=0.007 p=0.02 p=0.003 p=0.01
-18% -38% -41% -88% -119%
Baseline >= 17.5 ng/ml
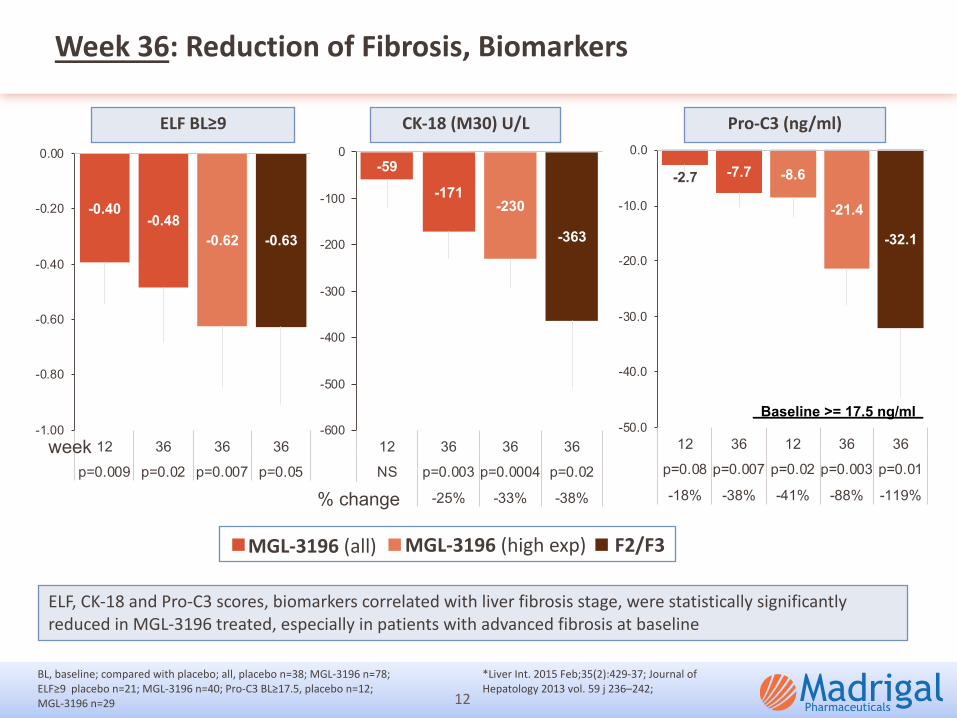
Week 36: Reduction of Fibrosis, Biomarkers
12
ELF, CK-18 and Pro-C3 scores, biomarkers correlated with liver fibrosis stage, were statistically significantly
reduced in MGL-3196 treated, especially in patients with advanced fibrosis at baseline
BL, baseline; compared with placebo; all, placebo n=38; MGL-3196 n=78;
ELF≥9 placebo n=21; MGL-3196 n=40; Pro-C3 BL≥17.5, placebo n=12;
MGL-3196 n=29
*Liver Int. 2015 Feb;35(2):429-37; Journal of
Hepatology 2013 vol. 59 j 236–242;
MGL-3196 (all) MGL-3196 (high exp) F2/F3
ELF BL≥9 CK-18 (M30) U/L Pro-C3 (ng/ml)
week
% change
120
32
47
0
10
20
30
40
50
All F3
p=0.03 p=0.05
% b
iops
ies
Placebo MGL-3196
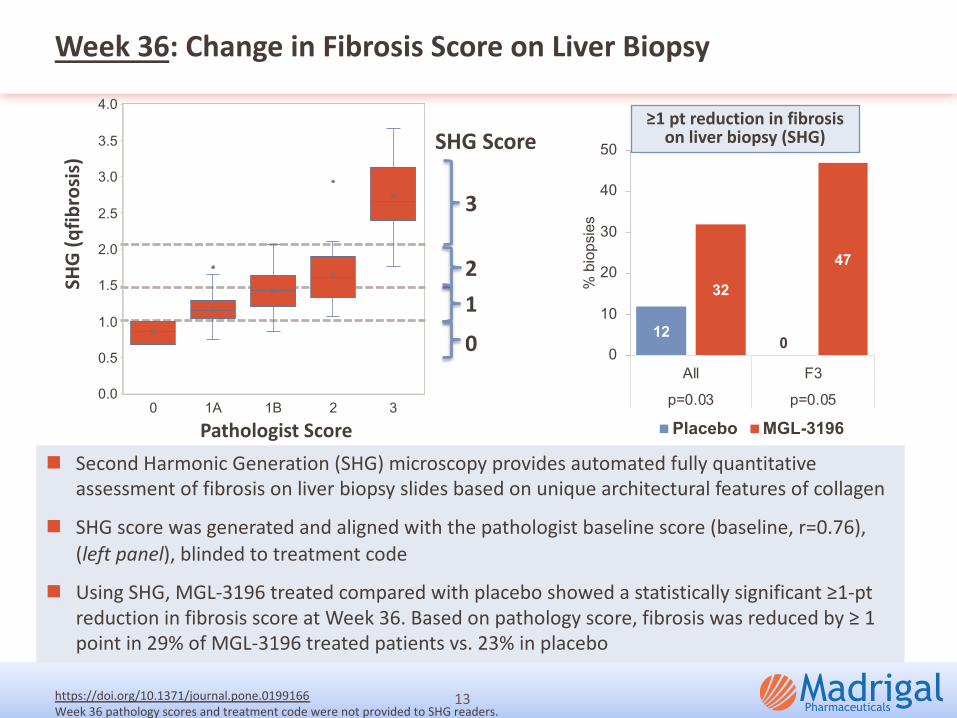
Week 36: Change in Fibrosis Score on Liver Biopsy
13
n Second Harmonic Generation (SHG) microscopy provides automated fully quantitative
assessment of fibrosis on liver biopsy slides based on unique architectural features of collagen
n SHG score was generated and aligned with the pathologist baseline score (baseline, r=0.76),
(left panel), blinded to treatment code
n Using SHG, MGL-3196 treated compared with placebo showed a statistically significant ≥1-pt
reduction in fibrosis score at Week 36. Based on pathology score, fibrosis was reduced by ≥ 1
point in 29% of MGL-3196 treated patients vs. 23% in placebo
≥1 pt reduction in fibrosis on liver biopsy (SHG)
Pathologist Score
SHG
(qfib
rosi
s)
https://doi.org/10.1371/journal.pone.0199166
Week 36 pathology scores and treatment code were not provided to SHG readers.
3
21
0
SHG Score
0 1A 1B 2 30.0
0.5
1.0
1.5
2.0
2.5
3.0
3.5
4.0
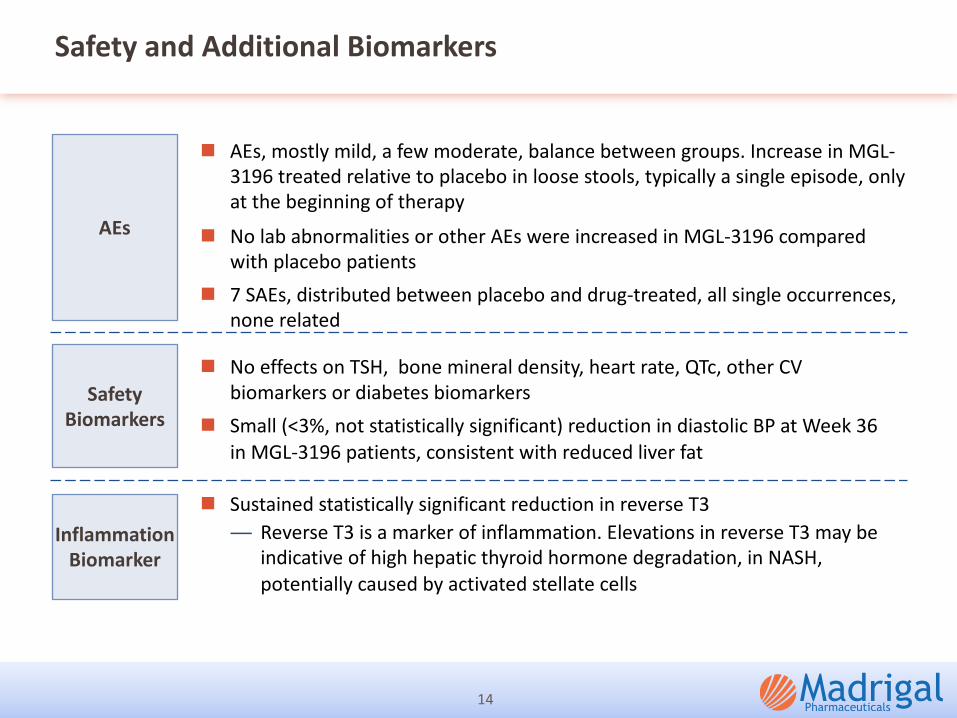
Safety and Additional Biomarkers
14
n AEs, mostly mild, a few moderate, balance between groups. Increase in MGL-3196 treated relative to placebo in loose stools, typically a single episode, only at the beginning of therapy
n No lab abnormalities or other AEs were increased in MGL-3196 compared with placebo patients
n 7 SAEs, distributed between placebo and drug-treated, all single occurrences, none related
AEs
Inflammation Biomarker
Safety Biomarkers
n No effects on TSH, bone mineral density, heart rate, QTc, other CV biomarkers or diabetes biomarkers
n Small (<3%, not statistically significant) reduction in diastolic BP at Week 36 in MGL-3196 patients, consistent with reduced liver fat
n Sustained statistically significant reduction in reverse T3 — Reverse T3 is a marker of inflammation. Elevations in reverse T3 may be
indicative of high hepatic thyroid hormone degradation, in NASH, potentially caused by activated stellate cells
Conclusions
In a Phase 2 36 week serial liver biopsy study in patients with NASH fibrosis stage 1-3, patients treated with MGL-3196 as compared with placebo showed
� Sustained statistically significant reduction in liver fat on MRI-PDFF in MGL-3196 treated as compared with placebo patients
� Sustained statistically significant lowering of multiple atherogenic lipids including LDL-C, ApoB, triglycerides, ApoCIII and Lp(a)
� Statistically significant lowering and normalization of liver enzymes; overall safety
� Statistically significant resolution of NASH that is correlated with reduction in liver fat on MRI-PDFF and provides evidence for efficacy at a registrational endpoint for Phase 3 development in NASH
15
Acknowledgements
We are grateful to the patients and staff who made this study possible.
16


