
5
Imaging in Sarcoidosis
M. Reza Rajebi1, Nicole A. Zimmerman1, Roozbeh Sharif2,
Ernest M. Scalzetti1, Stuart A. Groskin3 and Rolf A. Grage1
1SUNY Upstate Medical University,
2University of Texas Health Science Center at Houston,
3Crouse Hospital,
USA
1. Introduction
Sarcoidosis is an enigmatic systemic granulomatous disease of unknown etiology. It was
first described in 1877 by Jonathon Hutchinson, an English physician (Hutchinson, 1877).
Caesar Boeck used the term sarkoid originally in 1899 because he felt that the lesions
resembled sarcoma (Boeck, 1899). Kuznitsky and Bittorf reported the cardinal patient with
enlarged hilar nodes and pulmonary infiltrates on chest radiograph, describing the principle
case of sarcoidosis (Kuznitsky & Bittorf, 1915).
Sarcoidosis primarily affects the lung and lymphatic system. The patients are usually young
to middle-aged adults, appearing more commonly in individuals of African descent.
Bilateral hilar lymphadenopathy, pulmonary involvement, and ocular and cutaneous lesions
are classic findings, however sarcoidosis can affect many other organs. Clinical and imaging
findings are helpful in establishing the diagnosis. Histologic demonstration of noncaseating
epithelioid cell granulomas is confirmatory for diagnosis. In 1958, Wurm and colleagues
proposed a radiographic staging system, which still remains in widespread clinical use
(Table 1) (Wurm et al., 1958).
Stage Radiographic findings
0 Normal
1 Bilateral hilar adenopathy
2 Bilateral hilar adenopathy with parenchymal opacities
3 Parenchymal opacities
4 Advanced lung disease with fibrosis
Table 1. Radiographic stages of pulmonary sarcoidosis as defined by chest radiograph.
This chapter reviews the imaging findings of sarcoidosis based on the involved organ
systems and recommends the principle imaging study contingent upon the diagnostic
capabilities of different modalities. Options for radiologic evaluation of sarcoidosis
include plain radiography, ultrasonography, scintigraphy, computed tomography (CT),
and magnetic resonance imaging (MRI). Until the 1970s, evaluation of sarcoidosis was
limited to plain chest radiographs. Radionuclide imaging is occasionally used to assess
lymphatic, cardiac, and musculoskeletal involvement. With the development of CT in the
www.intechopen.com

Sarcoidosis Diagnosis and Management
72
early 1970s, cross-sectional imaging became available. The multiplanar and
multisequential capabilities of MRI have enhanced the characterization of sarcoid lesions
involving different organs.
2. Thoracic sarcoidosis
Classically, thoracic involvement of sarcoidosis presents as bilateral hilar adenopathy which
may occur in combination with parenchymal opacities. The chest roentgenogram is still the
most commonly used method for detecting lung involvement, however various other
modalities are being used with increased frequency. Pulmonary involvement is present in
90% of patients with sarcoidosis.
(a) (b)
(c) (d)
Fig. 1. Radiographic stages of pulmonary sarcoidosis. (a) Stage 1: A 32-year-old female with
hilar and right paratracheal lymphadenopathy. (b) Stage 2: A 61-year-old male with bilateral
hilar adenopathy and parenchymal opacities. (c) Stage 3: A 54-year-old female with
parenchymal opacities in the right lower lung. (d) Stage 4: A 51-year-old female with
extensive increased interstitial markings.
www.intechopen.com

Imaging in Sarcoidosis
73
2.1 Radiography Simple radiographs are sufficient for diagnosing and follow-up of sarcoidosis, although high-
resolution CT without intravenous contrast is helpful in characterizing interstitial lung disease
and the extent of adenopathy. It is also suitable in determining the lung involvement stage,
amount and type of reversible versus irreversible lung damage, and the overall prognosis.
Pulmonary involvement can be categorized into five radiographic stages (Figure 1)
(Silzbach, 1967). Pulmonary function test findings such as restrictive pattern and decreased
carbon monoxide diffusing capacity worsen as the disease progresses from stages zero to
four (Criado et al., 2010).
Lymphadenopathy is the most common finding in patients with pulmonary sarcoidosis; it is
seen in 80% of patients. Bilateral hilar lymphadenopathy is the typical pattern of
involvement. Additionally, right paratracheal lymphadenopathy is also common. Lymph
nodes can be of different sizes ranging from subtle enlargement to conglomerate masses.
In 20% of patients, parenchymal infiltration can be identified on radiographs.
Reticulonodular opacities are the most common findings and are primarily seen in the
upper lung zones. Large nodules are seen in patients with alveolar sarcoidosis. In cases
with advanced disease and fibrosis, honeycombing and traction bronchiectasis may be seen.
The upper lobes and superior segments of the lower lobes are usually involved in this
presentation. Occasionally, cavitary lesions and pleural effusion can be demonstrated.
2.2 Computed tomography High-resolution CT is more sensitive in detecting adenopathy and parenchymal involvement
as well as differentiating reversible inflammatory features from irreversible fibrotic changes.
The most common CT findings of pulmonary sarcoidosis are symmetric lymphadenopathy,
micronodules with lymphagitic spread, fibrotic changes, and bilateral perihilar opacities.
Reversible inflammatory changes consist of nodules and uncommonly, alveolar densities and
patchy ground-glass opacities. Irreversible changes due to pulmonary fibrosis include
honeycombing, architectural distortion, bullae formation and tractional bronchiectasis.
Fig. 2. A 56-year-old female with hilar lymphadenopathy.
Typically, hilar and right paratracheal lymph nodes are enlarged (Figure 2). Furthermore, as
the disease progresses to a chronic state, nodes can become calcified (Figure 3). A symmetric
bilateral perilymphatic micronodular distribution, commonly referred to as lymphangitic
spread, is the most common pattern in patients with parenchymal involvement in
pulmonary sarcoidosis (Lynch et al., 1997). Lymphangitic spread can include
peribronchovascular, subpleural, and interlobular septal distribution of the nodules (Figure
www.intechopen.com
Sarcoidosis Diagnosis and Management
74
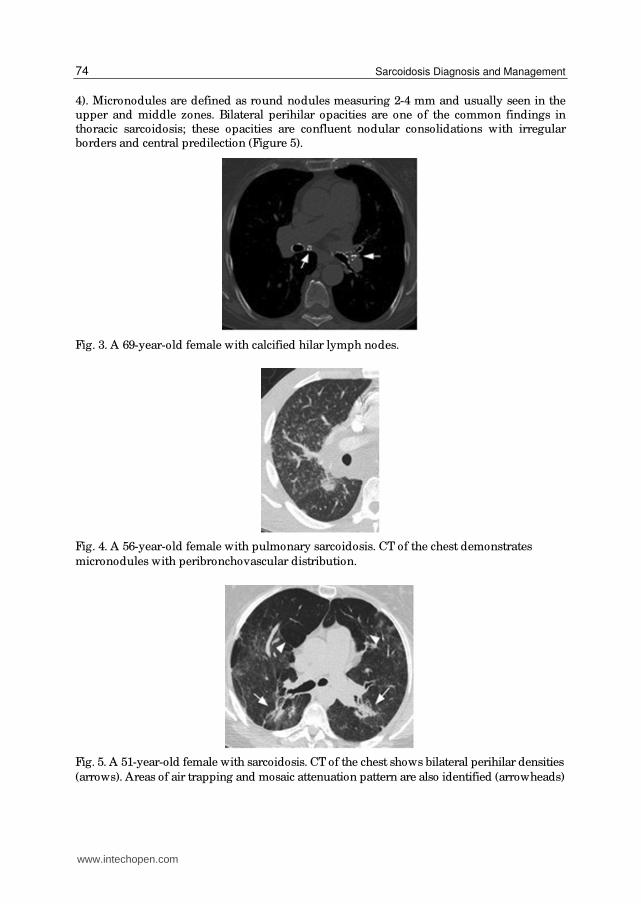
4). Micronodules are defined as round nodules measuring 2-4 mm and usually seen in the
upper and middle zones. Bilateral perihilar opacities are one of the common findings in
thoracic sarcoidosis; these opacities are confluent nodular consolidations with irregular
borders and central predilection (Figure 5).
Fig. 3. A 69-year-old female with calcified hilar lymph nodes.
Fig. 4. A 56-year-old female with pulmonary sarcoidosis. CT of the chest demonstrates
micronodules with peribronchovascular distribution.
Fig. 5. A 51-year-old female with sarcoidosis. CT of the chest shows bilateral perihilar densities
(arrows). Areas of air trapping and mosaic attenuation pattern are also identified (arrowheads)
www.intechopen.com

Imaging in Sarcoidosis
75
In 20% of patients, the initial inflammatory phase leads to fibrotic changes such as
honeycombing, linear densities, architectural distortion and secondary traction
bronchieactasis (Figure 6). Honeycombing refers to “destroyed and fibrotic lung tissue
containing numerous cystic airspaces with thick fibrous walls, representing the late stage of
various lung diseases, with complete loss of acinar architecture" (Hansell et al., 2008). Upper
and middle zones are usually involved in a patchy distribution. Abehsera et al described
three major patterns of pulmonary involvement in patients with fibrosis: bronchial
distortion in 47% of patients; honeycombing in 29% of patients; and diffuse linear opacities
in 24% of patients (Abehsera et al., 2000).
(a) (b)
(c) (d)
Fig. 6. Fibrotic changes in advanced sarcoidosis. (a) A 29-year-old female with sarcodidosis.
CT of the chest demonstrates multiple cystic lesions within the left upper lobe, representing
areas of honeycombing. (b) A 34-year-old male with sarcoidosis. CT of the chest shows areas
of linear densities (arrow) in the left lower lobe compatible with linear scarring. (c) A 49-
year-old male with sarcoidosis. CT of the chest demonstrates architectural distortion in the
right lung apex (arrow). (d) A 54 year-old female with sarcoidosis. CT of the chest shows
bronchiectasis in the right upper lobe.
www.intechopen.com

Sarcoidosis Diagnosis and Management
76
Atypical features of pulmonary involvement include unilateral lymphadenopathy, unusual
location of lymphadenopathy, nodules and masses, patchy airspace, ground-glass, and
linear opacities, airway involvement, fibrocystic changes, miliary opacities, and pleural
disease. Unusual manifestations of mediastinal lymphadenopathy in a minority of patients
may contribute to challenging diagnostic dilemmas.
(a) (b)
Fig. 7. Pulmonary macronodules and masses in sarcoidosis. (a) A 34-year-old male. CT of
the chest shows a 12 mm nodule in the left upper lobe. (b) A 39-year-old male. CT of the
chest demonstrates a large soft tissue mass in the left upper lobe. Biopsy confirmed non-
caseating granulomatous disease in both patients.
Nodules and masses are predominantly bilateral and multiple (Figure 7). Nevertheless,
these lesions can occasionally present in varying manners. “Galaxy sign” refers to multiple
small nodules around a larger mass (Figure 8). A conglomerate of multiple micronodules is
called a “sarcoid cluster”. Acinar or alveolar sarcoidosis refers to alveolar opacities, which
are composed of multiple nodules causing adjacent alveoli compression and can easily be
mistaken as pneumonia, tuberculosis, or cryptogenic organizing pneumonitis (Figure 9).
Patchy ground-glass opacities are more commonly seen as compared to diffuse ground-
glass opacities (Figure 10). Interlobular and intralobular septal thickening may lead to a
linear reticular pattern (Figure 11). Honeycomb-like cysts, cavitations and mycetoma
formations are considered fibrocystic changes.
Airway involvement is indicative of a poor prognosis (Handa et al., 2006). It can present as
mosaic attenuation pattern, air trapping (Figure 5), tracheobronchial abnormalities, and
atelectasis. Miliary pattern is a rare presentation of pulmonary sarcoidosis, found in less
than one percent of cases (Figure 12). Pleural effusion, hemorrhagic or chylous pleural
effusion, pneumothorax (Figure 12), pleural thickening, plaque-like opacities and pleural
calcification occur in 1-4% of patients (Soskel & Sharma, 1992).
www.intechopen.com

Imaging in Sarcoidosis
77
Fig. 8. “Galaxy sign”. A 49-year-old female. CT of the chest shows a 7 mm nodule in the left
lower lobe (arrow) as well as multiple adjacent 2 mm nodules (arrowhead).
Fig. 9. A 54-year-old female with sarcoidosis. CT of the chest shows a large alveolar density
in the right middle lobe
www.intechopen.com

Sarcoidosis Diagnosis and Management
78
Fig. 10. A 54-year-old female with sarcoidosis. CT of the chest shows an area of patchy
groundglass opacity (arrow) in the right upper lobe. A confluent opacity (arrowhead) lateral
to this area is also identified.
Fig. 11. A 56-year-old female with sarcoidosis. CT of the chest demonstrates intralobular
septal thickening in the right upper lobe.
www.intechopen.com

Imaging in Sarcoidosis
79
Fig. 12. A 66-year-old male. CT of chest reveals innumerable micronodules with a miliary
pattern. A small right-sided pneumothorax (arrow) is also noted.
One study compared the high-resolution CT and pulmonary function test findings of
smokers and nonsmokers with pulmonary sarcoidosis. 46 patients (23 smokers and 23
lifelong nonsmokers) with histologically proven sarcoidosis were included. Air trapping
and small nodules were the most common findings. The extent of emphysema was greater
in smokers although no significant difference was seen in the extent of airway involvement
between smokers and nonsmokers (Terasaki et al., 2005).
2.3 Nuclear medicine Gallium-67 (67Ga) scintigraphy shows a relatively specific pattern of abnormal
radiopharmaceutical uptake in thoracic lymph nodes of patients with pulmonary
sarcoidosis referred to as “ lambda sign” . This is a distinctive pattern of increased 67Ga
uptake in the hilar and right paratracheal lymph nodes resembling the Greek letter lambda
(λ). Sulivak et al evaluated 65 patients with sarcoidosis and compared 67Ga scintigraphy
findings in these patients with 540 patients with other disorders. Lambda sign was seen in
72% of patients with sarcoidosis and none of the patients in the comparison group (Sulavik
et al., 1990).
2.4 Ultrasonography Endobronchial ultrasound (EBUS) with transbronchial needle aspiration (TBNA) is a
promising minimally invasive technique, which recently has been used for diagnosis of a
wide variety of pulmonary disorders ranging from sarcoidosis to lung cancer. In one study,
EBUS-TBNA is performed for diagnosis of sarcoidosis in 50 patients with suspected
pulmonary sarcoidosis. Non-caseating granuloma was demonstrated in 41 of 48 patients
(85%) with a final diagnosis of sarcoidosis (Garwood et al., 2007).
In summary, plain radiographs are sufficient for diagnosis of pulmonary sarcoidosis and
subsequent follow-up. High resolution CT without intravenous contrast may be helpful to
characterize interstitial lung disease and the extent of adenopathy.
www.intechopen.com

Sarcoidosis Diagnosis and Management
80
3. Cardiac sarcoidosis
Although clinical cardiac involvement in sarcoidosis is uncommon, it is still a major
contributing factor in disease prognosis (Perry & Vuitch, 1995). Acute cardiac failure,
ventricular arrhythmias, heart blockage, and sudden cardiac death are several complications
of sarcoidosis in the cardiovascular system. Myocardial involvement is more common than
pericardial disease. The basal and lateral walls of the left ventricle as well as the septum are
typically involved, while the endocardium is usually spared. As with any other organ,
cardiac sarcoidosis can be divided into three stages including initial edema, granulomatous
infiltration and scarring.
3.1 Nuclear medicine Resting Thallium-201 and Tc-99m-methoxyisobutylisonitrile (Tc-99m-MIBI) scintigraphy
demonstrate segmental regions of decreased radiopharmaceutical uptake in the
myocardium although these foci do not correspond to histologic findings for an unknown
reason. Reverse distribution has been described in patients with cardiac sarcoidosis as
indicated by increased uptake in Thallium-201 on stress images. 67Ga scintigraphy is useful for diagnosis of the active inflammatory phases of cardiac
sarcoidosis including the initial edema and granulomatous infiltration phases. Presence of
areas of increased uptake in 67Ga scintigraphy correlates with a favorable response to
corticosteroid treatment.
18F-fluorodeoxyglucose (FDG) accumulates in inflammatory cells and although it is
nonspecific, FDG-Positron Emission Tomography (PET) may be a useful modality for
detecting inflammatory processes such as sarcoidosis. Okumura et al (Okumura et al., 2004)
described that fasting FDG-PET can detect cardiac sarcoidosis in earlier stages in
comparison to other radiopharmaceuticals.
Fig. 13. Short-axis gadolinium-enhanced T1-weighted image shows an area of diffuse
enhancement (arrows) in the lateral wall of the left ventricle representing edema in the early
stage of cardiac sarcoidosis. (Courtesy of Prof. Olivier Vignaux, University René Descartes,
Paris, France)
www.intechopen.com
Imaging in Sarcoidosis
81
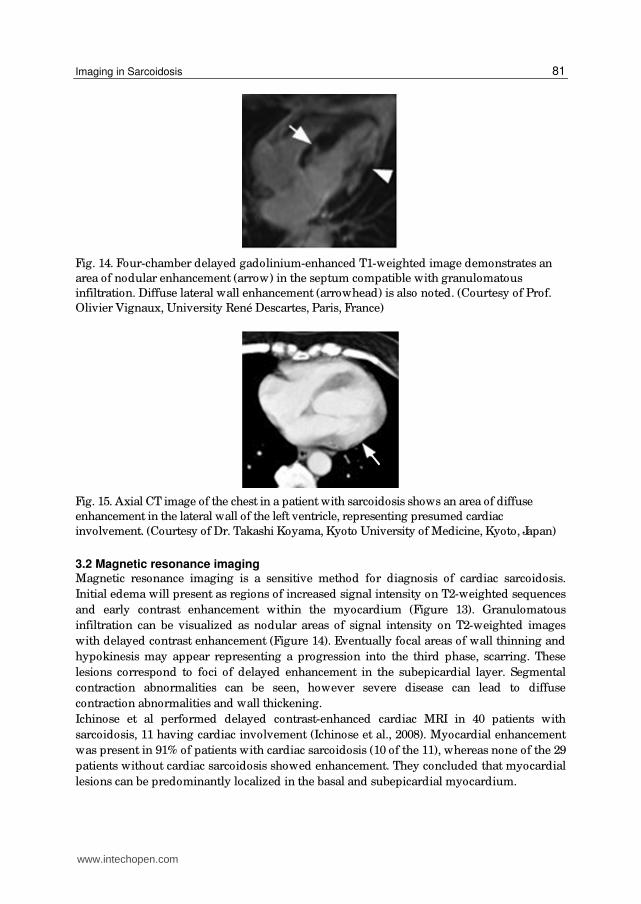
Fig. 14. Four-chamber delayed gadolinium-enhanced T1-weighted image demonstrates an
area of nodular enhancement (arrow) in the septum compatible with granulomatous
infiltration. Diffuse lateral wall enhancement (arrowhead) is also noted. (Courtesy of Prof.
Olivier Vignaux, University René Descartes, Paris, France)
Fig. 15. Axial CT image of the chest in a patient with sarcoidosis shows an area of diffuse
enhancement in the lateral wall of the left ventricle, representing presumed cardiac
involvement. (Courtesy of Dr. Takashi Koyama, Kyoto University of Medicine, Kyoto, Japan)
3.2 Magnetic resonance imaging Magnetic resonance imaging is a sensitive method for diagnosis of cardiac sarcoidosis.
Initial edema will present as regions of increased signal intensity on T2-weighted sequences
and early contrast enhancement within the myocardium (Figure 13). Granulomatous
infiltration can be visualized as nodular areas of signal intensity on T2-weighted images
with delayed contrast enhancement (Figure 14). Eventually focal areas of wall thinning and
hypokinesis may appear representing a progression into the third phase, scarring. These
lesions correspond to foci of delayed enhancement in the subepicardial layer. Segmental
contraction abnormalities can be seen, however severe disease can lead to diffuse
contraction abnormalities and wall thickening.
Ichinose et al performed delayed contrast-enhanced cardiac MRI in 40 patients with
sarcoidosis, 11 having cardiac involvement (Ichinose et al., 2008). Myocardial enhancement
was present in 91% of patients with cardiac sarcoidosis (10 of the 11), whereas none of the 29
patients without cardiac sarcoidosis showed enhancement. They concluded that myocardial
lesions can be predominantly localized in the basal and subepicardial myocardium.
www.intechopen.com

Sarcoidosis Diagnosis and Management
82
Clinically, cardiac sarcoidosis is found in five percent of patients, however it is present in
approximately 20-30% of autopsy studies indicating that often it can be asymptomatic. In
those patients that display clinical symptoms, cardiac sarcoidosis can be life-threatening and
detection by MRI becomes increasingly important. MRI with gadolinium is the forefront
modality in following cardiac sarcoidosis (Vignaux, 2005). CT is not a commonly used
modality for evaluation of cardiac sarcoidosis. Nevertheless, in a few case reports, CT
reveals a similar pattern of myocardial enhancement as in MRI (Figure 15).
4. Abdominal sarcoidosis
Abdominal visceral involvement is frequently reported in autopsy series of patients with
sarcoidosis (Iwai et al., 1988). Nonetheless, most of these patients are asymptomatic and
organ dysfunction is uncommon. Abdominal lymphadenopathy as well as genitourinary,
pancreatic, and gastrointestinal sarcoidosis have been documented with the liver and spleen
being the most frequently affected abdominal organs.
4.1 Liver and spleen Hepatomegaly is the most common imaging finding of hepatic sarcoidosis. Liver
dysfunction is occasionally seen; however end stage liver disease manifesting as cirrhosis or
portal hypertension is rarely reported. On ultrasonography, hepatic sarcoidosis could
represent as diffuse or patchy areas of increased echogenicity although the enlarged liver
might remain homogenous. Another frequently seen pattern of involvement presents as
multiple low-density lesions throughout the liver. These lesions can range from 1-2
millimeters to several centimeters. Sarcoidosis nodules could present as hypoechoic or
hyperechoic lesions on sonographic examination. These nodules remain unenhanced on
contrast-enhanced CT (Figure 16) and present as low signal intensity nodules with no
evidence of enhancement on MRI. Rarely, cirrhosis can be seen with involvement of
intrahepatic biliary ducts. When involvement includes the extrahepatic ducts,
granulomatous infiltration can lead to obstructive jaundice.
Splenomegaly is a common finding of sarcoidosis, reported in up to 33% of patients
(Warshauer & Lee, 2004). Hypodense nodular disease is frequently seen while calcified
lesions have also been reported (Figure 17). Nodular splenic disease has similar imaging
characteristic as hepatic nodular disease (Figure 18).
Fig. 16. A 41-year-old female with upper abdominal pain. Axial contrast-enhanced CT image
of the abdomen at the level of the T11 vertebra reveals low attenuating geographic lesions
(arrows) in the liver and spleen. Splenomegaly is also present. Biopsy confirmed non-
caseating granulomas.
www.intechopen.com
Imaging in Sarcoidosis
83
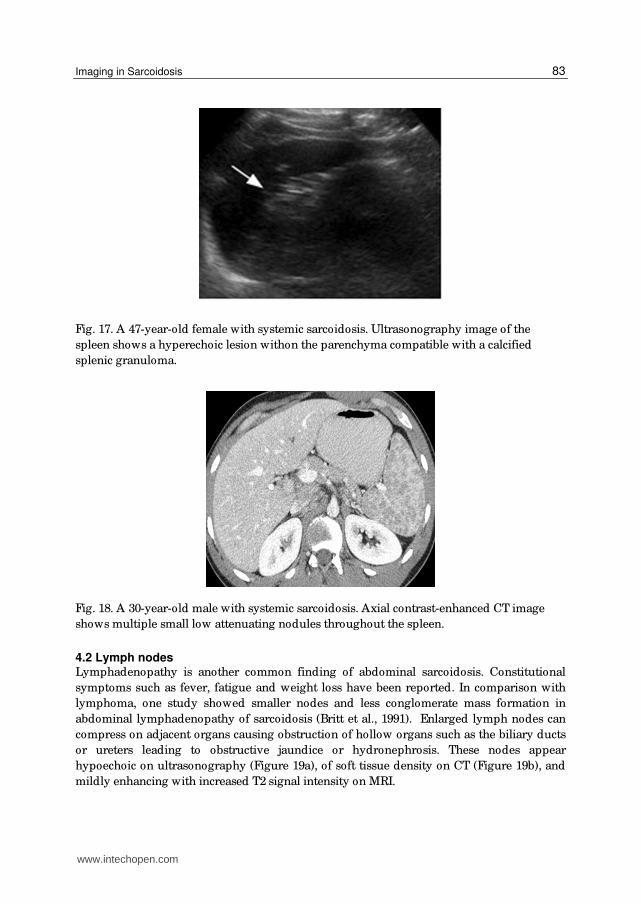
Fig. 17. A 47-year-old female with systemic sarcoidosis. Ultrasonography image of the
spleen shows a hyperechoic lesion withon the parenchyma compatible with a calcified
splenic granuloma.
Fig. 18. A 30-year-old male with systemic sarcoidosis. Axial contrast-enhanced CT image
shows multiple small low attenuating nodules throughout the spleen.
4.2 Lymph nodes Lymphadenopathy is another common finding of abdominal sarcoidosis. Constitutional
symptoms such as fever, fatigue and weight loss have been reported. In comparison with
lymphoma, one study showed smaller nodes and less conglomerate mass formation in
abdominal lymphadenopathy of sarcoidosis (Britt et al., 1991). Enlarged lymph nodes can
compress on adjacent organs causing obstruction of hollow organs such as the biliary ducts
or ureters leading to obstructive jaundice or hydronephrosis. These nodes appear
hypoechoic on ultrasonography (Figure 19a), of soft tissue density on CT (Figure 19b), and
mildly enhancing with increased T2 signal intensity on MRI.
www.intechopen.com
Sarcoidosis Diagnosis and Management
84
(a) (b)
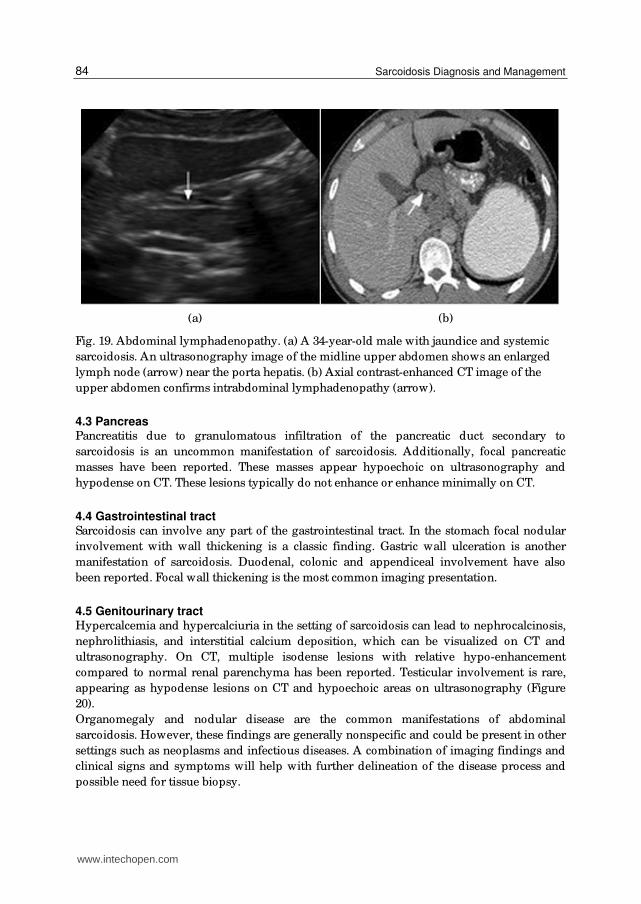
Fig. 19. Abdominal lymphadenopathy. (a) A 34-year-old male with jaundice and systemic
sarcoidosis. An ultrasonography image of the midline upper abdomen shows an enlarged
lymph node (arrow) near the porta hepatis. (b) Axial contrast-enhanced CT image of the
upper abdomen confirms intrabdominal lymphadenopathy (arrow).
4.3 Pancreas Pancreatitis due to granulomatous infiltration of the pancreatic duct secondary to
sarcoidosis is an uncommon manifestation of sarcoidosis. Additionally, focal pancreatic
masses have been reported. These masses appear hypoechoic on ultrasonography and
hypodense on CT. These lesions typically do not enhance or enhance minimally on CT.
4.4 Gastrointestinal tract Sarcoidosis can involve any part of the gastrointestinal tract. In the stomach focal nodular
involvement with wall thickening is a classic finding. Gastric wall ulceration is another
manifestation of sarcoidosis. Duodenal, colonic and appendiceal involvement have also
been reported. Focal wall thickening is the most common imaging presentation.
4.5 Genitourinary tract Hypercalcemia and hypercalciuria in the setting of sarcoidosis can lead to nephrocalcinosis,
nephrolithiasis, and interstitial calcium deposition, which can be visualized on CT and
ultrasonography. On CT, multiple isodense lesions with relative hypo-enhancement
compared to normal renal parenchyma has been reported. Testicular involvement is rare,
appearing as hypodense lesions on CT and hypoechoic areas on ultrasonography (Figure
20).
Organomegaly and nodular disease are the common manifestations of abdominal
sarcoidosis. However, these findings are generally nonspecific and could be present in other
settings such as neoplasms and infectious diseases. A combination of imaging findings and
clinical signs and symptoms will help with further delineation of the disease process and
possible need for tissue biopsy.
www.intechopen.com

Imaging in Sarcoidosis
85
(a) (b)
Fig. 20. A 30-year-old male with sarcoidosis. (a) Axial contrast-enhanced CT image
incidentally shows hypodense lesions within the testes. (b) Subsequent sagittal
ultrasonography image of the testes show multiple small round hypoechoic lesions
(arrow).
5. Neurosarcoidosis
Symptomatic involvement of the nervous system is reported in 5% of patients with
sarcoidosis. However, asymptomatic neurosarcoidosis has been reported in up to 25% of
cases in postmortem studies (Johns & Michele, 1999). Isolated neurosarcoidosis is rarely
seen. Although sarcoidosis can involve the entire nervous system and its supportive tissues,
Central Nervous System (CNS) involvement is far more common. Clinical symptoms of
neurosarcoidosis are nonspecific; the involved region of the CNS determines the presenting
symptoms. Vision loss, facial nerve involvement, headache, neck stiffness and seizure have
all been described as correlated symptoms. Imaging characteristics of neurosarcoidosis are
nonspecific so a lesion biopsy is occasionally performed to reach a definite diagnosis.
5.1 Leptomeningeal involvement Enhancing thickened leptomeninges on contrast-enhanced T1-weighted sequences are the
most common imaging finding of CNS involvement with sarcoidosis; it has been reported in
40% of patients with neural involvement (Nowak & Widenka, 2001). Nodular and diffuse
patterns have been described with the basilar meninges being most commonly involved
(Figure 21). Some authors have hypothesized that parenchymal involvement is an extension
of leptomeningeal disease via the perivascular spaces (Junger et al., 1993). In the spinal cord
linear and nodular enhancing extramedullary lesions are also common. Hydrocephalus
secondary to adhesions or abnormal CSF resorption can be seen in patients with
leptomeningeal sarcoidosis.
5.2 Parenchymal disease Multiple high signal intensity lesions on T2-weighted sequences are the most common
finding in patients with parenchymal involvement. In the brain, these lesions are mainly
located in the periventricular white matter. Although non-enhancing lesions are typical,
contrast enhancement can also be seen (Figure 22). Occasionally, low signal intensity masses
on T2-weighted sequences have been reported.
www.intechopen.com

Sarcoidosis Diagnosis and Management
86
(a) (b)
Fig. 21. Leptomeningeal sarcoidosis. (a) A gadolinium-enhanced axial T1-weighted image in
a 27-year-old male and (b) a gadolinium-enhanced sagittal T1-weighted image in a 38-year-
old male with systemic sarcoidosis show curvilinear areas of abnormal enhancement along
the sulci and basal cisterns, representing leptomeningeal sarcoidosis.
In the spinal cord, intramedullary sarcoidosis presents as fusiform high T2-signal intensity
segmental lesions with decreased signal intensity on T1-weighted sequences. Patchy
enhancement on contrast-enhanced T1-weighted sequences is common (Figure 23). One
study evaluated clinical, laboratory, and MRI profiles in 31 patients with spinal cord
sarcoidosis (Cohen-Aubart et al., 2010). Spinal cord MRIs performed in 26 patients with
spinal cord involvement revealed intramedullary T2-hyperintensities that were extensive
and heterogeneous with a central distribution in axial slides. They concluded that a spinal
cord MRI study may be a useful tool in the diagnosis of spinal cord sarcoidosis.
Cranial nerve involvement is another feature of parenchymal sarcoidosis with contrast
enhancing nerve enlargement being typical. Optic nerve involvement is frequently seen and
can be bilateral or unilateral (Figure 24). In MRI scans of 15 patients with orbital or optic
pathway involvement, eight patients had MR evidence of optic nerve involvement by
sarcoid granuloma (Carmody et al., 1994). Optic chiasmal involvement, periventricular
white matter abnormalities, perineural enhancement, and optic nerve enlargement were
commonly identified. Less frequently, optic nerve atrophy, increased T2 signal intensity in
the optic radiations, and orbital masses with MR signal characteristics similar to a
pseudotumor were reported.
Additionally, other orbital structures such as orbital fat, muscles, globe and lacrimal glands
can be involved (Figure 25). Mass-like lacrimal and muscle infiltration, pseudotumor-like
intraorbital masses and rarely uveal and scleral nodularity have been reported. Facial nerve
paralysis can be seen with facial nerve (VII) involvement. Nevertheless, there is no
correlation between imaging findings and clinical presentation.
www.intechopen.com

Imaging in Sarcoidosis
87
(a) (b)
(c) (d)
Fig. 22. A 40-year-old male with memory loss, confusion, disorientation and
multisystemic sarcoidosis. (a) Axial T1-weighted MR image at the level of the basal
ganglia is unremarkable. (b) Axial T2 and (c) axial FLAIR images show areas of increased
signal intensity within the white matter of the medial frontal lobes, left being greater than
right. (d) Axial gadolinium-enhanced image shows minimal enhancement in the medial
frontal lobes.
www.intechopen.com

Sarcoidosis Diagnosis and Management
88
(a)
(b) (c)
Fig. 23. Intramedullary sarcoidosis. (a) A 27-year-old male with sarcoidosis. Axial T2-
weighted image at the level of the conus medullaris shows an area of increased signal
intensity within the conus (arrow) representing intramedullary involvement. (b) A 27-
year-old male with systemic sarcoidosis presented with paraplegia. A T2-weighted
sagittal image shows patchy increased signal intensity within the spinal cord at the C7-T2
level as well as T6-T7 level (arrows) and (c) a sagittal gadolinium-enhanced T1-weighted
image shows abnormal enhancement of these lesions (arrows), representing
intramedullary involvement.
www.intechopen.com

Imaging in Sarcoidosis
89
(a) (b)
Fig. 24. A 39-year-old male with vision loss and systemic sarcoidosis. (a) T1-weighted image
shows thickened pituitary infundibulum (arrow). (b) Gadolinium-enhanced T1-weighted
image shows enhancement of the optic nerves (arrowheads) and pituitary infundibulum
(arrow).
(a) (b)
(c) (d) (e)
Fig. 25. A 44-year-old male with pulmonary sarcoidosis, left eye pain and sixth nerve palsy.
(a) Axial T1-weighted image shows a low signal intensity lesion in the left orbital apex
(arrow). (b) Gadolinium-enhanced fat suppressed T1-weighted image shows enhancement
of the previously seen lesion (arrow). Slight enlargement of the left lacrimal gland is noted
(arrowhead). (c) Coronal fat suppressed T2-weighted image shows diffuse increased signal
intensity with in the left intraconal fat, representing an inflammatory process (arrow). (d)
and (e) 67Gallium SPECT images show increased radiopharmaceutical activity in the
lacrimal and parotid glands respectively.
www.intechopen.com

Sarcoidosis Diagnosis and Management
90
5.3 Dural Involvement Diffuse thickening of the dura and focal nodular dural masses are common manifestations
of dural sarcoidosis. Dural involvement with sarcoidosis is much more commonly found in
the brain rather than in the spine. In the brain, these lesions appear dark on T2-weighted
sequences and enhance diffusely on contrast-enhanced T1-weighted sequences (Figure 26).
Unlike in leptomeningeal disease, involvement of the basal cisterns and perivascular spaces
are not seen. When seen in the spine, dural-based high signal intensity masses on T2-
weighted sequences are characteristic (Figure 27).
(a) (b)
(c) (d)
Fig. 26. A 66-year-old male with worsening headaches and sarcoidosis. (a) A T2-weighted
image shows diffuse low signal intensity in the dura. (b), (c), and (d) Axial, sagittal and
coronal gadolinium-enhanced images demonstrate diffuse and nodular enhancement of the
dura respectively (arrows).
www.intechopen.com

Imaging in Sarcoidosis
91
(a)
(b)
(c)
Fig. 27. A 27-year-old male with confusion and thoracic sarcoidosis. (a) T2-weighted image
shows irregular areas of increased signal intensity (arrow) at the surface of the cauda
equina. (b) Axial and (c) sagittal gadolinium enhanced T1-weighted images show nodular
enhancement (arrows) compatible with dural involvement.
www.intechopen.com

Sarcoidosis Diagnosis and Management
92
Refractory and recurrent CNS sarcoidosis is common (Christoforidis et al., 1999). Imaging
characteristics of neurosarcoidosis are nonspecific and correlation between a response to
treatment and resolution of imaging findings is not well established. Nonetheless, imaging
can be useful for follow-up in patients with known CNS sarcoidosis. Lexa et al evaluated the
role of MRI in the diagnosis and treatment of 24 patients with neurosarcoidosis. White
matter and periventricular high signal intensity on T2-weighted sequences, leptomeningeal
enhancement, parenchymal mass, lacrimal gland mass, hydrocephalus, ventriculomegaly,
periventricular enhancement, extraaxial mass, optic chiasmal enhancement, nerve root
enhancement, enlarged pituitary infundibulum, and pontine infarct were identified. They
concluded that enhancement was a useful clue to the diagnosis in 15 of 17 cases in which
gadolinium was used (88%). Additionally, it was shown that MRI is useful in the evaluation
of treatment response in patients with neurosarcoidosis particularly in the leptomeningeal
and parenchymal lesions (Lexa & Grossman, 1994).
Symptomatic neurosarcoidosis may be present in 3%-5% of patients with sarcoidosis.
Although imaging findings are nonspecific, recognition of common patterns may be helpful
in the planning for further diagnostic tests and disease surveillance. MRI with gadolinium is
the study of choice for initial diagnosis as well as follow-up evaluation of neurosarcoidosis.
6. Musculoskeletal sarcoidosis
Although sarcoidosis can involve any organ, symptomatic musculoskeletal involvement is
uncommon. More specifically, muscular, articular and osseous sarcoidosis can be seen.
Imaging findings are nonspecific in most cases.
6.1 Muscular involvement Symptomatic myopathy is an extremely rare manifestation of sarcoidosis, which is seen in
less than 0.5% of patients (Douglas et al., 1973). However, asymptomatic granulomatous
disease is seen commonly in up to 80% of patients (Baydur et al., 1993). Chronic myopathy,
palpable lesions and acute myositis are different presentations of symptomatic muscular
involvement with sarcoidosis. Typically, sarcoid myopathy has a symmetrical pattern with
bilateral involvement of the proximal muscles of the extremities. Nevertheless, any
muscular structure including the respiratory muscles can be involved.
Oval nodules with a central area of low signal intensity surrounded by an area of increased
signal intensity in T2-weighted images are characteristic for nodular sarcoidosis. Evaluation
of sonographic and MRI findings in three cases of the nodular type of muscular sarcoidosis
revealed intramuscular hypoechoic well-defined nodules in all three patients (Tohme-Noun
et al., 2004). On MRI, the nodules were iso- or hyperintense on T1-weighted sequences. On
T2-weighted images and STIR sequences, intramuscular nodules of homogeneous high
signal intensity were observed. Homogeneous enhancement in all nodules on gadolinium-
enhanced T1-weighted sequences was characteristic.
In chronic myopathy, MRI and CT occasionally show muscle atrophy. With acute myositis,
on MR imaging diffuse increased T2 signal intensity of involved muscles may be noted. CT
may show thickening of the involved musculature (Figure 28). 67Ga scintigraphy reveals
nonspecific diffuse increased radiopharmaceutical uptake in the involved musculature in
both acute myositis and chronic myopathy.
www.intechopen.com

Imaging in Sarcoidosis
93
Fig. 28. A 44-year-old male with left eye pain and sarcoidosis. Axial CT image shows mild
thickening of the left lateral rectus muscle (arrow) compatible with granulomatous
infiltration.
6.2 Joint involvement Arthralgia with polyarticular involvement of the distal joints of the extremities is a common
early finding of sarcoidosis. Additionally, MRI findings such as synovitis, bursitis,
tenosynovitis, and tendonitis have been reported in patients with sarcoidosis (Figure 29).
Tissue biopsy might be necessary for definite diagnosis as these findings are nonspecific.
Fig. 29. Posteroanterior radiograph of the right hand shows sausage-like dactylitis of the
second to fifth digits in a patient with sarcoidosis, representing synovitis. Multiple classic
osteolytic bony lesions (arrows) as well as sclerotic foci at the base of the middle phalanges
of the forth and fifth digits (arrowheads) are also noted. (Courtesy of Drs. Shipley,
Weinstein and Wissman. University of Cincinnati, Ohio, USA)
6.3 Osseous involvement Osseous sarcoidosis has been reported in about 5% of patients (Johns & Michele, 1999). Plain
radiographs are the first imaging modality for diagnosis of osseous sarcoidosis. Osteolysis
with a lacy trabecular pattern is the characteristic findings on radiographs (Figure 30).
www.intechopen.com

Sarcoidosis Diagnosis and Management
94
Typically, small bones of the hand and foot are involved although the vertebral body
(Figure 31), skull, and long bones may also be affected rarely. Cyst formation with a
“punched out” pattern appearing as well-circumscribed lytic lesions with nonsclerotic
margins is also common. Pathologic fractures secondary to extensive bony erosion have
been reported (Figure 32). Periosteal reaction is usually not present. Furthermore, osseous
sarcoidosis can also present as osteosclerosis, as evidenced by nodular opacities in the
medullary cavity on plain radiographs (Figure 29). 99mTc-pyrophosphate scintigraphy is more sensitive in detecting osseous sarcoidosis in
comparison to plain radiographs. Areas of increased radiopharmaceutical activity correspond
to active granulomatous infiltration. Nuclear imaging findings are nonspecific for sarcoidosis;
however 99mTc bone scintigraphy can be used effectively for monitoring disease activity.
MRI is the most sensitive imaging modality for detecting osseous sarcoidosis. Typically,
sarcoid bony lesions appear hypointense on T1-weighted sequences and hyperintense on
T2-weighted, inversion-recovery, and fat-saturated proton-density–weighted MR sequences.
Occasionally, the lesions can have low signal intensity.
Occult lesions, soft tissue involvement and cortical disruption may also be identified with
MR imaging in osseous sarcoidosis. In the long bones, sarcoidosis can be seen as well-
defined discrete masses, infiltrative marrow lesions and ill-defined mass-like lesions, which
may enhance after administration of contrast. These lesions can be replaced with fat or
fibrotic tissues, indicating the chronicity of the disease.
In vertebral bodies lytic lesions with sclerotic margins are typical which may extend into the
pedicles. Sclerotic or mixed lytic and sclerotic involvement as well as disc involvement is all
relatively rare. In the skull, sarcoid lesions are usually well-defined expansile lytic areas
with a “punched out” pattern, which can be visualized on CT. Skull lesions are seldom seen
alone and are customarily associated with other bony lesions when osseous involvement of
sarcoidosis is present (Yaghmai, 1983).
Fig. 30. Coned-down posteroanterior radiograph of the right hand in a patient with
sarcoidosis shows osteolytic lesions with a lacy pattern within the middle phalanx of the
second digit. (Courtesy of Drs. Shipley, Weinstein and Wissman, University of Cincinnati,
Cincinnati, Ohio, USA)
www.intechopen.com
Imaging in Sarcoidosis
95
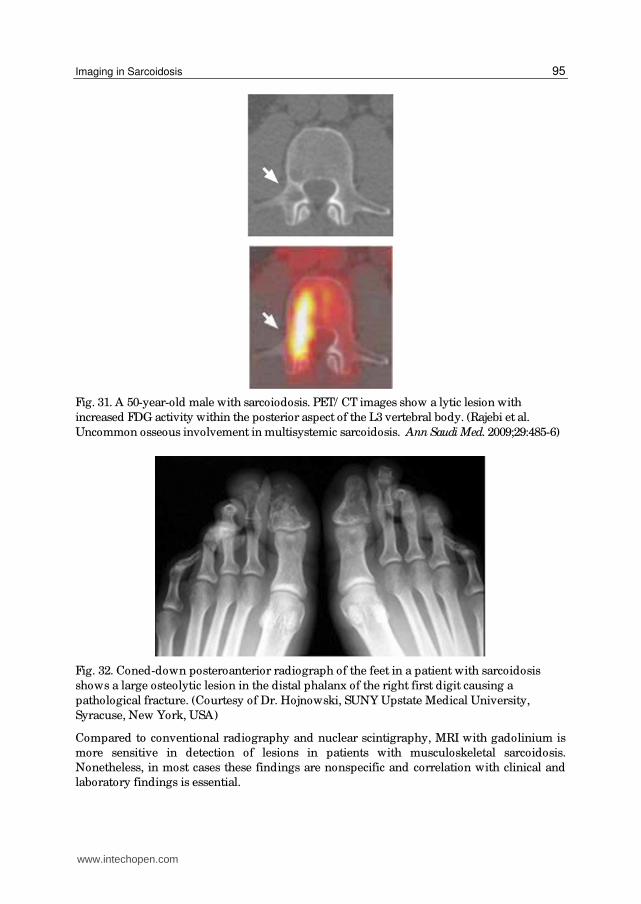
Fig. 31. A 50-year-old male with sarcoiodosis. PET/ CT images show a lytic lesion with
increased FDG activity within the posterior aspect of the L3 vertebral body. (Rajebi et al.
Uncommon osseous involvement in multisystemic sarcoidosis. Ann Saudi Med. 2009;29:485-6)
Fig. 32. Coned-down posteroanterior radiograph of the feet in a patient with sarcoidosis
shows a large osteolytic lesion in the distal phalanx of the right first digit causing a
pathological fracture. (Courtesy of Dr. Hojnowski, SUNY Upstate Medical University,
Syracuse, New York, USA)
Compared to conventional radiography and nuclear scintigraphy, MRI with gadolinium is
more sensitive in detection of lesions in patients with musculoskeletal sarcoidosis.
Nonetheless, in most cases these findings are nonspecific and correlation with clinical and
laboratory findings is essential.
www.intechopen.com

Sarcoidosis Diagnosis and Management
96
7. FDG-PET and PET/CT
FDG-PET and PET/ CT identify areas of abnormally increased glucose transport and
metabolism. This capability makes FDG-PET imaging a suitable modality in conditions with
increased glucose metabolism such as cancer and inflammatory disease. However, pattern
and intensity of FDG uptake are nonspecific in multisystemic disorders such as sarcoidosis
and can be mistaken with lymphoma and diffuse metastatic diseases (Figure 31 and 33)
(Rajebi et al., 2009). Despite this, FDG uptake value can decrease after treatment of
sarcoidosis and FDG-PET and PET/ CT can be useful for monitoring the disease and efficacy
of the treatment (Brundin et al., 1994).
Fig. 33. A 37-year-old female with mediastinal lymphadenopathy on chest radiograph (not
shown). An FDG-PET/ CT shows extensive FDG-avid hilar, mediastinal, intrabdominal and
inguinal lymphadenopathy. Biopsy confirmed the diagnosis of sarcoidosis. (Courtesy of Dr.
McGrath, SUNY Upstate Medical University, Syracuse, New York, USA)
www.intechopen.com

Imaging in Sarcoidosis
97
It has been shown that persistent retention of FDG correlates with refractory disease. Umeda
et al evaluated the prognostic value of dual time point FDG-PET in patients with pulmonary
sarcoidosis. In this study, twenty-one patients with pulmonary sarcoidosis underwent an
early FDG-PET at 60 minutes and a delayed FDG-PET scan at 180 minutes after the injection
of FDG. Standardized uptake values (SUVs) at the two time points and the retention index
(RI-SUV) calculated from these were assessed. To evaluate disease progression, all patients
underwent chest CT one year after the initial FDG-PET. RI-SUV was significantly higher in
patients with increased or unchanged pulmonary lesions at follow-up CT than in patients
with improved pulmonary lesions indicating that RI-SUV can be a good indicator of disease
progression (Umeda et al 2011).
With FDG-PET/ CT, it is postulated that the addition of typical CT findings in patients with
multisystemic disease such as hilar and paratracheal lymphadenopathy and parenchymal
involvement in pulmonary sarcoidosis, can increase usefulness of this modality in
evaluation of treatment response in sarcoidosis.
8. Conclusion
Sarcoidosis is a multisystemic disease, which can involve any organ in the body. Similar
to presenting signs and symptoms, imaging findings of sarcoidosis are diverse.
Conventional radiography is useful in initial evaluation of pulmonary and
musculoskeletal sarcoidosis. Ultrasonography is playing an emerging role in the diagnosis
of pulmonary involvement. The modality of choice for evaluation of the parenchymal
lung disease is CT. MRI findings in cardiac sarcoidosis are relatively specific and
advantageous in diagnosis. Furthermore, MRI is an extremely invaluable tool for initial
diagnosis and treatment response in neurosarcoidosis. Extent of musculoskeletal
sarcoidosis is also best evaluated with MRI. Although the imaging findings in abdominal
sarcoidosis are nonspecific, CT and ultrasonography are helpful in evaluation of organ
involvement and lymphadenopathy. FDG-PET/ CT may be useful in evaluating disease
progress and treatment efficacy.
Clinicians and radiologists should be familiar with typical as well as atypical imaging
findings of sarcoidosis. This may decrease the unnecessary workup and prevent needless
patient discomfort.
9. References
Abehsera M, Valeyre D, Grenier P, Jaillet H, Battesti JP, & Brauner MW. (2000). Sarcoidosis
with pulmonary fibrosis: CT patterns and correlation with pulmonary function.
AJR Am J Roentgenol, Vol. 174, No. 6, (June 2000), pp. 1751-7, ISSN 0361-803X
Baydur A, Pandya K, Sharma OP, Kanel GC, & Carlson M. (1993). Control of ventilation,
respiratory muscle strength, and granulomatous involvement of skeletal muscle in
patients with sarcoidosis. Chest, Vol. 103, No. 2, (February 1993), pp. 396-402, ISSN
0012-3692
Boeck, C. (1899). Multiple benign sarkoid of the skin. J. Cutan. Genitourinary Dis, Vol. 17, pp.
543–550
www.intechopen.com

Sarcoidosis Diagnosis and Management
98
Britt AR, Francis IR, Glazer GM, & Ellis JH.(1991). Sarcoidosis: abdominal manifestations at
CT. Radiology, Vol.178, No. 1, (January 1991), pp. 91–94, ISSN 0033-8419
Brudin LH, Valind SO, Rhodes CG, Pantin CF, Sweatman M, Jones T, & Hughes JM. (1994).
Fluorine-18 deoxyglucose uptake in sarcoidosis measured with positron emission
tomography. Eur J Nucl Med, Vol. 21, No. 4, (April 1994), pp. 297-305, ISSN 0340-
6997
Carmody RF, Mafee MF, Goodwin JA, Small K, & Haery C. (1994). Orbital and optic
pathway sarcoidosis: MR findings. AJNR Am J Neuroradiol, Vol. 15, No. 4, (April
1994), pp. 775-83, ISSN 0195-6108
Christoforidis GA, Spickler EM, Reccio MV, & Mehta BM. (1999). MR of CNS sarcoidosis:
correlation of imaging features to clinical symptoms and response to treatment.
AJNR Am J Neuroradiol, Vol. 20, No. 4, (April 1999), pp. 655–669, ISSN 0195-6108
Cohen-Aubart F, Galanaud D, Grabli D, Haroche J, Amoura Z, Chapelon-Abric C, Lyon-
Caen O, Valeyre D, & Piette JC.(2010). Spinal cord sarcoidosis: clinical and
laboratory profile and outcome of 31 patients in a case-control study. Medicine
(Baltimore), Vol. 89, No. 2, (March 2010), pp. 133-40, ISSN 0025-7974
Criado E, Sánchez M, Ramírez J, Arguis P, de Caralt TM, Perea RJ, & Xaubet A.(2010).
Pulmonary sarcoidosis: typical and atypical manifestations at high-resolution CT
with pathologic correlation. Radiographics, Vol. 30, No. 6, (October 2010), pp.1567-
86, ISSN 1527-1323
Douglas AC, Macleod JG, & Matthews JD. (1973). Symptomatic sarcoidosis of skeletal
muscle. J Neurol Neurosurg Psychiatry, Vol. 36, No. 6, (December 1973), pp. 1034-40,
ISSN 0022-3050
Garwood S, Judson MA, Silvestri G, Hoda R, Fraig M, & Doelken P. (2007). Endobronchial
ultrasound for the diagnosis of pulmonary sarcoidosis. Chest, Vol. 132, No. 4,
(October 2007), pp. 1298-304, ISSN 0012-3692
Handa T, Nagai S, Fushimi Y, et al. (2006). Clinical and radiographic indices associated with
airflow limitation in patients with sarcoidosis. Chest, Vol. 130, No. 6, (December
2006), pp. 1851–1856, ISSN 0012-3692
Hansell DM, Bankier AA, MacMahon H, McLoud TC, Muller NL, & Remy J. (2008).
Fleischner Society: glossary of terms for thoracic imaging. Radiology, Vol. 246, No. 3,
(March 2008), pp. 697-722, ISSN 1527-1315
Hutchinson, J. (1877). Case of livid papillary psoriasis. In Illustrations of Clinical Surgery, Vol.
1, pp. 42–43, J&A Churchill, London, UK
Ichinose A, Otani H, Oikawa M, Takase K, Saito H, Shimokawa H, & Takahashi S. (2008).
MRI of cardiac sarcoidosis: basal and subepicardial localization of myocardial
lesions and their effect on left ventricular function. AJR Am J Roentgenol, Vol. 191,
No. 3, (September 2008), pp.862-9, ISSN 1546-3141
Iwai K, Tachibana T, Hosoda Y, & Matsui Y. (1988). Sarcoidosis autopsies in Japan:
frequency and trend in the last 28 years. Sarcoidosis, Vol. 5, No. 1, (March 1988), pp.
60–65, ISSN 0393-1447
Johns CJ & Michele TM. (1999). The clinical management of sarcoidosis. A 50-year
experience at the Johns Hopkins Hospital. Medicine (Baltimore), Vol. 78, No. 2,
(March 1999), pp. 65-111, ISSN 0025-7974
www.intechopen.com

Imaging in Sarcoidosis
99
Junger SS, Stern BJ, Levine SR, Sipos E, & Marti-Masso JF. (1993). Intramedullary spinal
sarcoidosis: clinical and magnetic resonance imaging characteristics. Neurology, Vol.
43, No. 2, (February 1993), pp. 333–337, ISSN 0028-3878
Kuznitsky, E. & A. Bittorf. (1915). Sarkoid mit Beteiligung innerer Organe. Munch. Med.
Wochenschr, pp.1349–1353
Lexa FJ & Grossman RI. (1994). MR of sarcoidosis in the head and spine: spectrum of
manifestations and radiographic response to steroid therapy. AJNR Am J
Neuroradiol, Vol. 15, No. 5, (May 1994), pp. 973-82, ISSN 0195-6108
Lynch JP 3rd, Kazerooni EA, & Gay SE. (1997). Pulmonary sarcoidosis. Clin Chest Med, Vol.
18, No. 4, (December 1997), pp. 755–785, ISSN 0272-5231
Nowak DA & Widenka DC. (2001). Neurosarcoidosis: a review of its intracranial
manifestation. J Neurol, Vol. 248, No. 5, (May 2001), pp. 363–372, ISSN 0340-5354
Okumura W, Iwasaki T, Toyama T, Iso T, Arai M, Oriuchi N, Endo K, Yokoyama T, Suzuki
T, & Kurabayashi M. (2004). Usefulness of fasting 18F-FDG PET in identification of
cardiac sarcoidosis. J Nucl Med, Vol. 45, No. 12, (December 2004), pp. 1989-98, ISSN
0161-5505
Perry A & Vuitch F. (1995). Causes of death in patients with sarcoidosis: a morphologic
study of 38 autopsies with clinicopathologic correlations. Arch Pathol Lab Med, Vol.
119, No. 2, (February 1995), pp. 167–172, ISSN 0003-9985
Rajebi MR, Shahrokni A, & Chaisson M. (2009). Uncommon osseous involvement in
multisystemic sarcoidosis. Ann Saudi Med, Vol 29, No. 6, (Nov-Dec 2009), pp. 485-6,
ISSN 0975-4466
Siltzbach LE. (1967). Sarcoidosis: clinical features and management. Med Clin North Am, Vol.
51, No. 2, (March 1967), pp. 483–502, ISSN 0025-7125
Soskel NT & Sharma OP. (2000). Pleural involvement in sarcoidosis. Curr Opin Pulm Med,
Vol. 6, No. 5, (September 2000), pp. 455-468, ISSN 1070-5287
Sulavik SB, Spencer RP, Weed DA, Shapiro HR, Shiue ST, & Castriotta RJ.(1990).
Recognition of distinctive patterns of gallium-67 distribution in sarcoidosis. J Nucl
Med, Vol. 31, No. 12 (December 1990), pp. 1909-14, ISSN 0161-5505
Tohme-Noun C, Le Breton C, Sobotka A, Boumenir ZE, Milleron B, Carette MF, & Khalil A.
(2004). Imaging findings in three cases of the nodular type of muscular sarcoidosis.
AJR Am J Roentgenol, Vol. 183, No. 4, (October 2004) pp. 995-9, ISSN 0361-803X
Terasaki H, Fujimoto K, Müller NL, Sadohara J, Uchida M, Koga T, Aizawa H, & Hayabuchi
N. (2005). Pulmonary sarcoidosis: comparison of findings of inspiratory and
expiratory high-resolution CT and pulmonary function tests between smokers and
nonsmokers. AJR Am J Roentgenol, Vol. 185, No. 2, (August 2005), pp. 333-8, ISSN
0361-803X
Umeda Y, Demura Y, Morikawa M, Ameshima S, Tsuchida T, Fujibayashi Y, Okazawa H,
Ishizaki T. (2011) Prognostic value of dual time point (18) F-fluorodeoxyglucose
positron emission tomography in patients with pulmonary sarcoidosis. Respirology,
“Accepted Article” ; doi: 10.1111/ j.1440-1843.2011.01966.x
Warshauer DM & Lee JK. (2004). Imaging manifestation of abdominal sarcoidosis. AJR Am J
Roentgenol, Vol. 182, No. 1, (January 2004), pp. 15-28, ISSN 0361-803X
www.intechopen.com
Sarcoidosis Diagnosis and Management
100
Wurm, K., H. Reindell, & L. Heilmeyer. (1958). Der Lungenboeck im Röntgenbild. Thieme,
Stuttgart, Germany.
Vignaux O. (2005). Cardiac sarcoidosis: spectrum of MRI features. AJR Am J Roentgenol, Vol.
184, No. 1, (January 2005), pp. 249-54, ISSN 0361-803X
Yaghmai I.(1983). Radiographic, angiographic and radionuclide manifestations of osseous
sarcoidosis. Radiographic, Vol. 3, No. 3, (September 1983), pp. 375-396, ISSN 1527-
1323
www.intechopen.com

Sarcoidosis Diagnosis and ManagementEdited by Prof. Mohammad Hosein Kalantar Motamedi
ISBN 978-953-307-414-6Hard cover, 280 pagesPublisher InTechPublished online 17, October, 2011Published in print edition October, 2011
InTech EuropeUniversity Campus STeP Ri Slavka Krautzeka 83/A 51000 Rijeka, Croatia Phone: +385 (51) 770 447 Fax: +385 (51) 686 166www.intechopen.com
InTech ChinaUnit 405, Office Block, Hotel Equatorial Shanghai No.65, Yan An Road (West), Shanghai, 200040, China
Phone: +86-21-62489820 Fax: +86-21-62489821
Sarcoidosis is a type of inflammation that occurs in various locations of the body for no known reason.Normally, when foreign substances or organisms enter the body, the immune system will fight back byactivating an immune response. Inflammation is a normal part of this immune response, but it should subsideonce the foreign antigen is gone. In sarcoidosis, the inflammation persists, and some of the immune cells formabnormal clumps of tissue called granulomas. The disease can affect any organ in the body, but it is mostlikely to occur in the lungs. It can also affect the skin, eyes, liver, or lymph nodes. Although the cause ofsarcoidosis is not known, research suggests that it may be due to an extreme immune response or extremesensitivity to certain substances. It also seems to have a genetic component as well, and tends to run infamilies. Sarcoidosis most commonly develops in people between 20 and 50 years of age. African Americansare somewhat more likely to develop sarcoidosis than Caucasians, and females are somewhat more likely todevelop sarcoidosis than males. The symptoms of sarcoidosis depend on the organ involved. This book dealswith the diagnosis and treatment of this mysterious disease of unknown etiology.
How to referenceIn order to correctly reference this scholarly work, feel free to copy and paste the following:
M. Reza Rajebi, Nicole A. Zimmerman, Roozbeh Sharif, Ernest M. Scalzetti, Stuart A. Groskin and Rolf A.Grage (2011). Imaging in Sarcoidosis, Sarcoidosis Diagnosis and Management, Prof. Mohammad HoseinKalantar Motamedi (Ed.), ISBN: 978-953-307-414-6, InTech, Available from:http://www.intechopen.com/books/sarcoidosis-diagnosis-and-management/imaging-in-sarcoidosis

© 2011 The Author(s). Licensee IntechOpen. This is an open access articledistributed under the terms of the Creative Commons Attribution 3.0License, which permits unrestricted use, distribution, and reproduction inany medium, provided the original work is properly cited.


