I li ti A lInclination AnalysInclination AnalysySignals of ESignals of ESignals of Eg
Al P hk (Ad d S t A lAlena Puchkova (Advanced Systems Anale a uc o a ( d a ced Syste s a
Arkady Kryazhimskiy (AdArkady Kryazhimskiy (Ad
Ulf Dieckmann (EvUlf Dieckmann (Ev
R iti E l 2000 iRecognition: Early 2000s recessionRecognition: Early 2000s recession
• At this stage theAt this stage theN b 2001)November 2001).)
W id th• We consider threAverage) and the FAverage) and the Fpreceding the recespreceding the reces
• We identify some• We identify someoccur close to the toccur close to the t
li i d “earlier periods as “pp p
R iti f th “ ” dRecognition of the “-” andg“+” patterns hidden in the+ patterns hidden in thedata series gives us andata series gives us an
INVERSE PROBLEMINVERSE PROBLEM
• We define a binary encoding rule that transforms short data patterns i• We define a binary encoding rule that transforms short data patterns i
• Thus at the recognition stage we have the methodology for finding s• Thus, at the recognition stage, we have the methodology for finding stransforms the real data series into a binary sequence which identifietransforms the real data series into a binary sequence, which identifiean early-warning signal as a large number of subsequent minuses.an early warning signal as a large number of subsequent minuses.
SStatistical analysisStatistical analysisy• To identify the random process we use a long data series for 195• To identify the random process we use a long data series for 195(preceding the early 1990s recession) and the function found at the(preceding the early 1990s recession) and the function found at thestage for the given parameters set.stage for the given parameters set.
• We compute the frequencies of the “-” and “+” signals following theWe compute the frequencies of the and signals following thei l f i l th (th l tt ti t )signal sequences of a given length (the latter acting as a parameter).g q g g ( g p )
Matrix of transition probabilMatrix of transition probabil
RANDOM PROCESSRANDOM PROCESSRANDOM PROCESS• We treat the frequencies as transition probabilitiesWe treat the frequencies as transition probabilities.
• We organize the transition probabilities in a matrix which definesWe organize the transition probabilities in a matrix, which definesrandom process operating in the space of the binary windows.random process operating in the space of the binary windows.
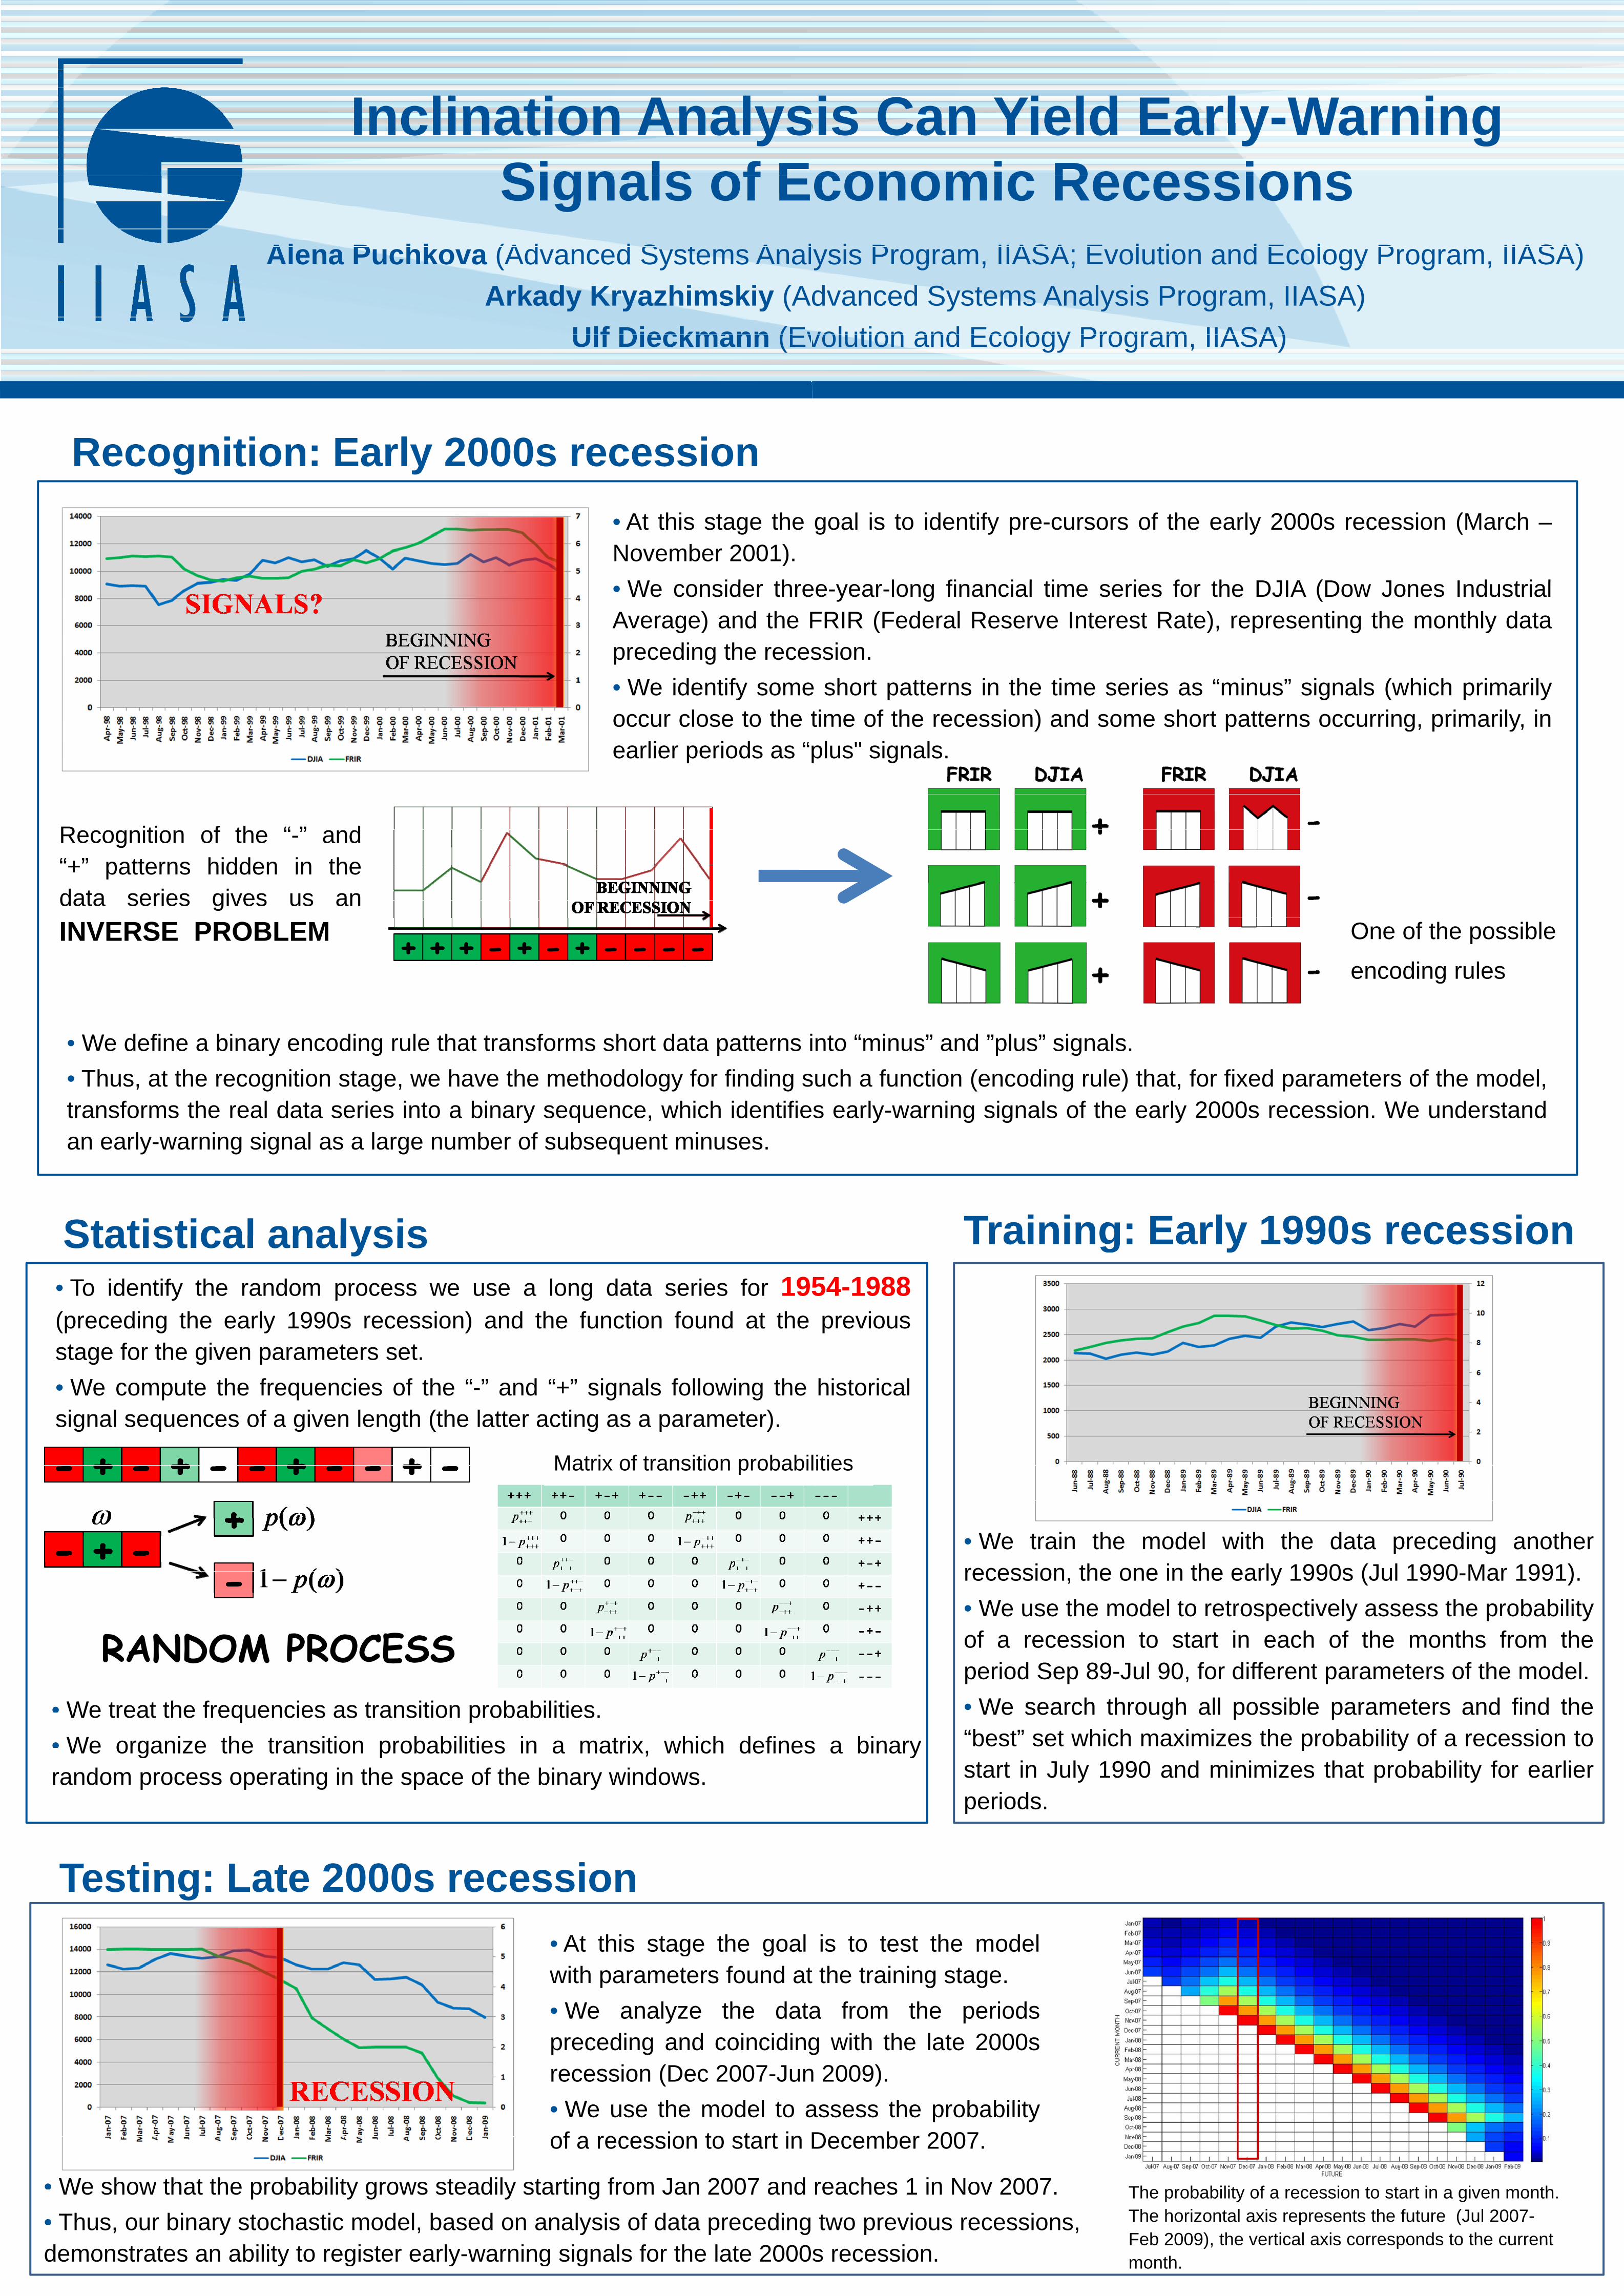
Testing: Late 2000s recessionTesting: Late 2000s recessionTesting: Late 2000s recession
• At this stage the goal• At this stage the goalwith parameters found atwith parameters found at
• We analyze the data• We analyze the datapreceding and coincidingpreceding and coinciding
i (D 2007 Jrecession (Dec 2007-Jun(
W th d l t• We use the model to aof a recession to start in Dof a recession to start in D
• We show that the probability grows steadily starting from Jan 2007 andWe show that the probability grows steadily starting from Jan 2007 and
• Thus our binary stochastic model based on analysis of data precedingThus, our binary stochastic model, based on analysis of data precedingdemonstrates an ability to register early-warning signals for the late 2000demonstrates an ability to register early warning signals for the late 2000
i C Yi ld E l W isis Can Yield Early-Warningsis Can Yield Early-Warning y gconomic Recessionsconomic Recessionsconomic Recessions
i P IIASA E l ti d E l P IIASA)ysis Program, IIASA; Evolution and Ecology Program, IIASA) ys s og a , S ; o ut o a d co ogy og a , S )
dvanced Systems Analysis Program IIASA)dvanced Systems Analysis Program, IIASA)
volution and Ecology Program IIASA)volution and Ecology Program, IIASA)
goal is to identify pre-cursors of the early 2000s recession (March –goal is to identify pre cursors of the early 2000s recession (March
l fi i l ti i f th DJIA (D J I d t i lee-year-long financial time series for the DJIA (Dow Jones Industrialy g (FRIR (Federal Reserve Interest Rate) representing the monthly dataFRIR (Federal Reserve Interest Rate), representing the monthly datassionssion.
e short patterns in the time series as “minus” signals (which primarilye short patterns in the time series as minus signals (which primarilytime of the recession) and some short patterns occurring primarily intime of the recession) and some short patterns occurring, primarily, inl " i lplus" signals.p g
One of the possibleOne of the possible
encoding rulesencoding rules
into “minus” and ”plus” signalsinto minus and plus signals.
such a function (encoding rule) that for fixed parameters of the modelsuch a function (encoding rule) that, for fixed parameters of the model,s early-warning signals of the early 2000s recession We understands early-warning signals of the early 2000s recession. We understand
T i i E l 1990 iTraining: Early 1990s recessionTraining: Early 1990s recession54-198854-1988previousprevious
historicalhistorical
litieslities
W t i th d l ith th d t di th• We train the model with the data preceding anotherp grecession the one in the early 1990s (Jul 1990 Mar 1991)recession, the one in the early 1990s (Jul 1990-Mar 1991).
• We use the model to retrospectively assess the probability• We use the model to retrospectively assess the probabilityof a recession to start in each of the months from theof a recession to start in each of the months from theperiod Sep 89-Jul 90, for different parameters of the model.period Sep 89 Jul 90, for different parameters of the model.
• We search through all possible parameters and find theWe search through all possible parameters and find the“b t” t hi h i i th b bilit f i ts a binary “best” set which maximizes the probability of a recession tos a binary p ystart in July 1990 and minimizes that probability for earlierstart in July 1990 and minimizes that probability for earlierperiodsperiods.
is to test the modelis to test the modelt the training staget the training stage.
a from the periodsa from the periodsg with the late 2000sg with the late 2000s
2009)n 2009).)
th b bilitassess the probabilityp yDecember 2007December 2007.
reaches 1 in Nov 2007 The probability of a recession to start in a given monthreaches 1 in Nov 2007. The probability of a recession to start in a given month.
two previous recessions The horizontal axis represents the future (Jul 2007-two previous recessions, p (Feb 2009) the vertical axis corresponds to the current
s recession.Feb 2009), the vertical axis corresponds to the current months recession. month.


