Hydrogen for Internal Combustion Engines?
Roger Cracknell, Harold Walmsley - Shell Global Solutions
H2NET Meeting 25th April
Acknowledgement to Shell Hydrogen for support.
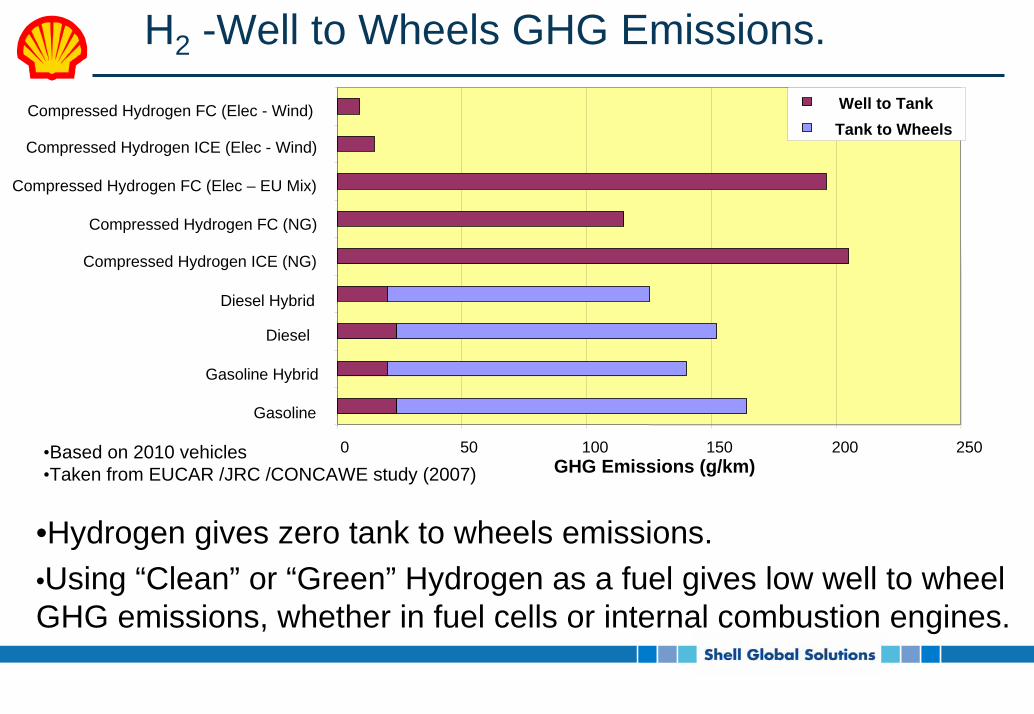
H2 -Well to Wheels GHG Emissions. Well to TankTank to Wheels
Compressed Hydrogen FC (Elec - Wind)
Compressed Hydrogen ICE (Elec - Wind)
Compressed Hydrogen FC (Elec – EU Mix)
Compressed Hydrogen FC (NG)
Compressed Hydrogen ICE (NG)
Diesel Hybrid
Diesel
Gasoline Hybrid
Gasoline
•Based on 2010 vehicles •Taken from EUCAR /JRC /CONCAWE study (2007)
0 50 100 150GHG Emissions (g/km)
200 250
•Hydrogen gives zero tank to wheels emissions.•Using “Clean” or “Green” Hydrogen as a fuel gives low well to wheel GHG emissions, whether in fuel cells or internal combustion engines.

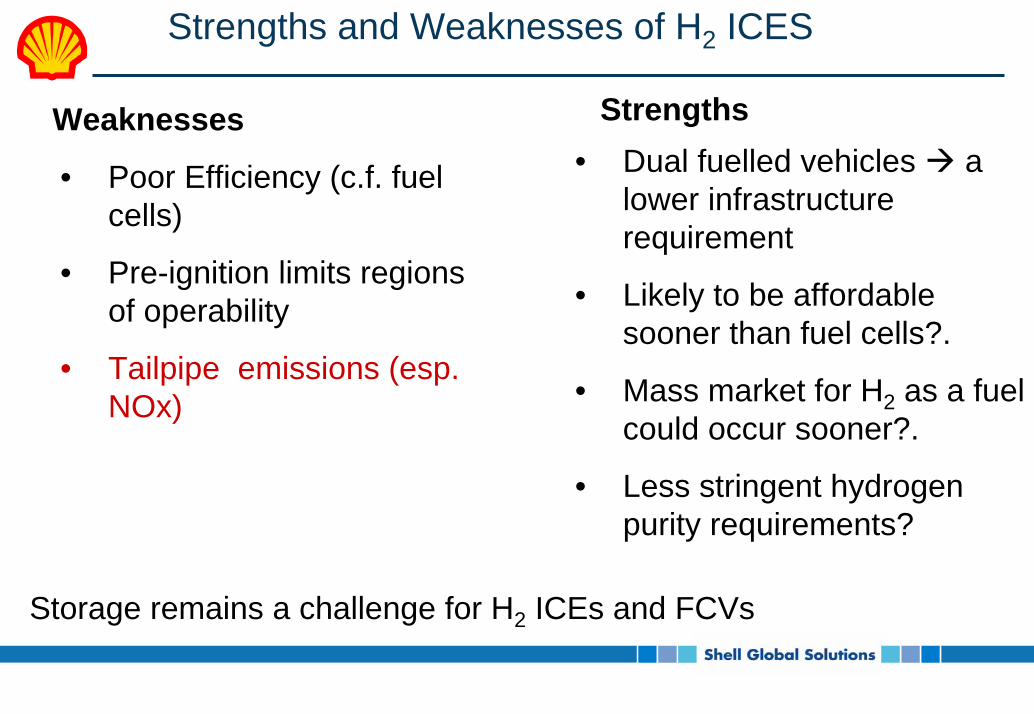
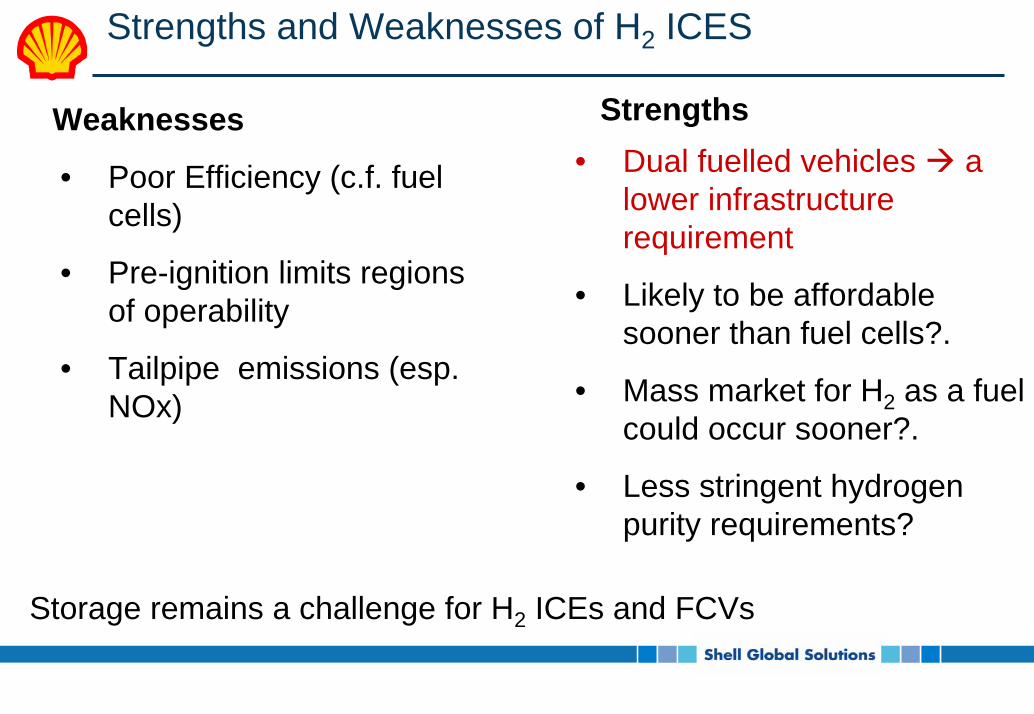
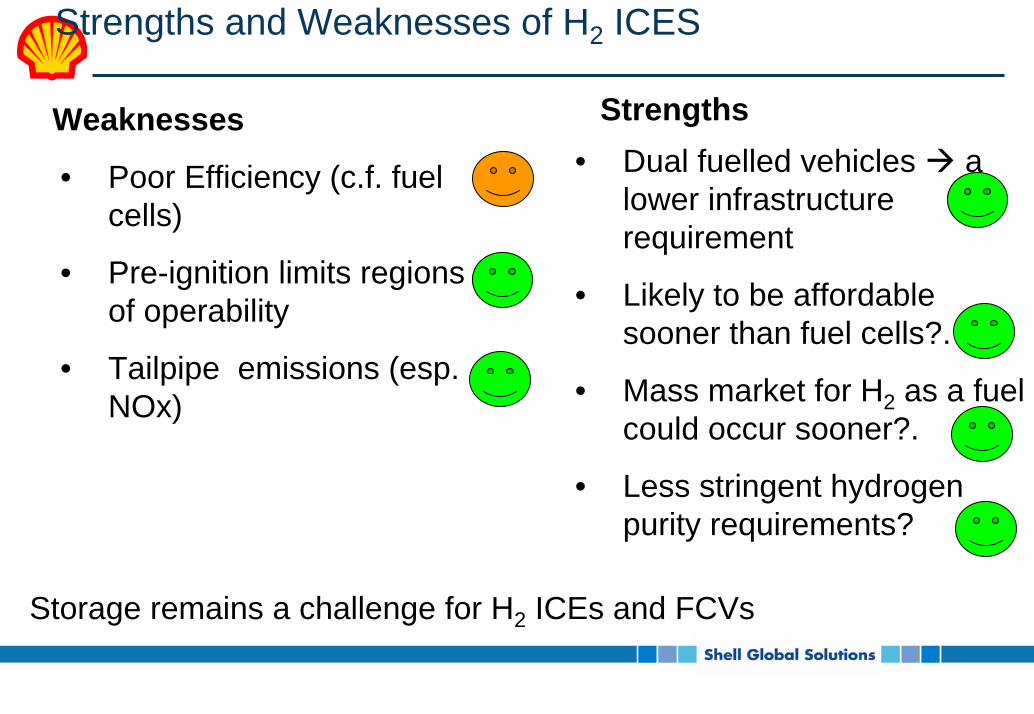
Strengths and Weaknesses of H2 ICES
……some commonly held viewsStrengthsWeaknesses
• Dual fuelled vehicles a lower infrastructure requirement
• Likely to be affordable sooner than fuel cells?.
• Mass market for H2 as a fuel could occur sooner?.
• Less stringent hydrogen purity requirements?
• Poor Efficiency (c.f. fuel cells)
• Pre-ignition limits regions of operability
• Tailpipe emissions (esp. NOx)
Storage remains a challenge for H2 ICEs and FCVs

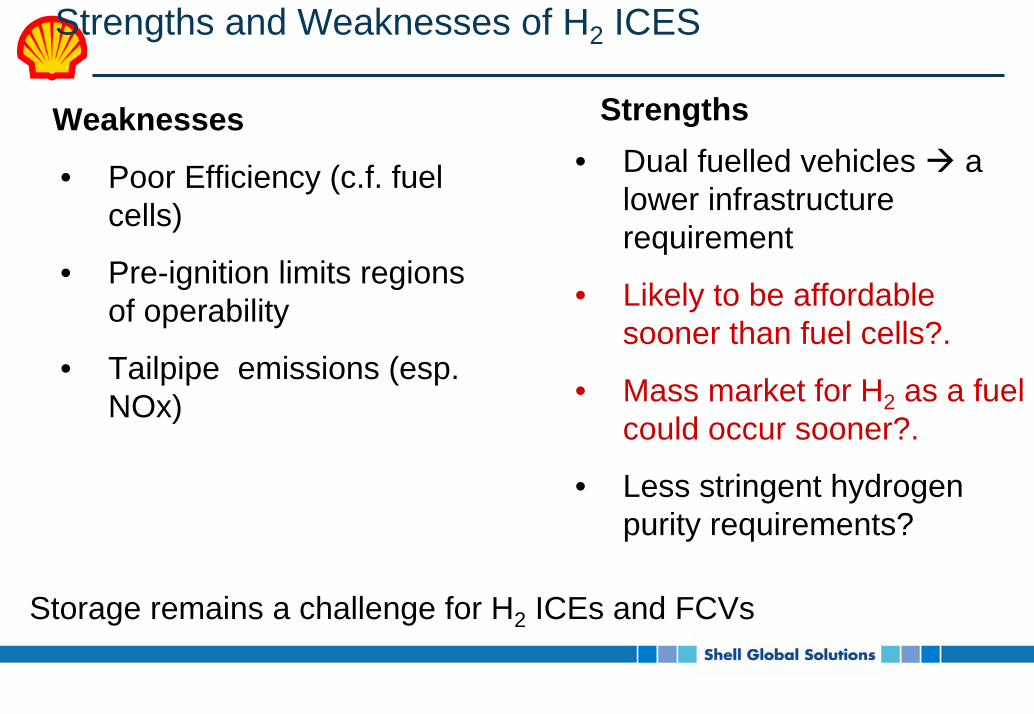
Strengths and Weaknesses of H2 ICES
StrengthsWeaknesses• Dual fuelled vehicles a
lower infrastructure requirement
• Likely to be affordable sooner than fuel cells?.
• Mass market for H2 as a fuel could occur sooner?.
• Less stringent hydrogen purity requirements?
• Poor Efficiency (c.f. fuel cells)
• Pre-ignition limits regions of operability
• Tailpipe emissions (esp. NOx)
Storage remains a challenge for H2 ICEs and FCVs
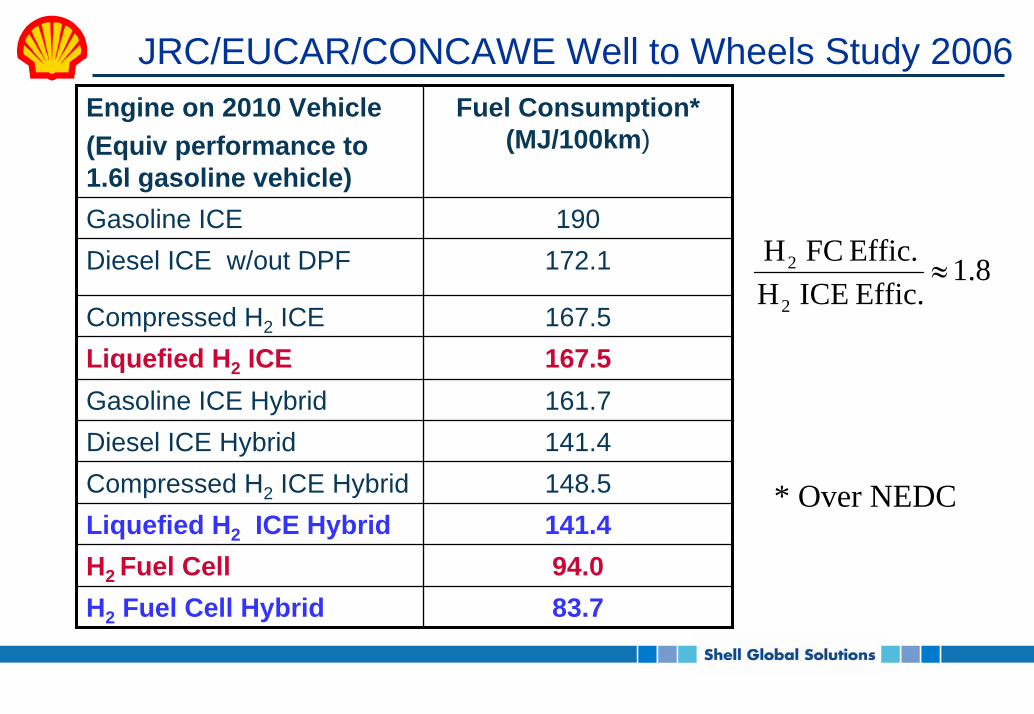
JRC/EUCAR/CONCAWE Well to Wheels Study 2006Engine on 2010 Vehicle(Equiv performance to 1.6l gasoline vehicle)
Fuel Consumption* (MJ/100km)
Gasoline ICE 190Diesel ICE w/out DPF 172.1
Compressed H2 ICE 167.5Liquefied H2 ICE 167.5Gasoline ICE Hybrid 161.7Diesel ICE Hybrid 141.4Compressed H2 ICE Hybrid 148.5Liquefied H2 ICE Hybrid 141.4H2 Fuel Cell 94.0H2 Fuel Cell Hybrid 83.7
8.1Effic. ICE HEffic. FC H
2
2 ≈
* Over NEDC

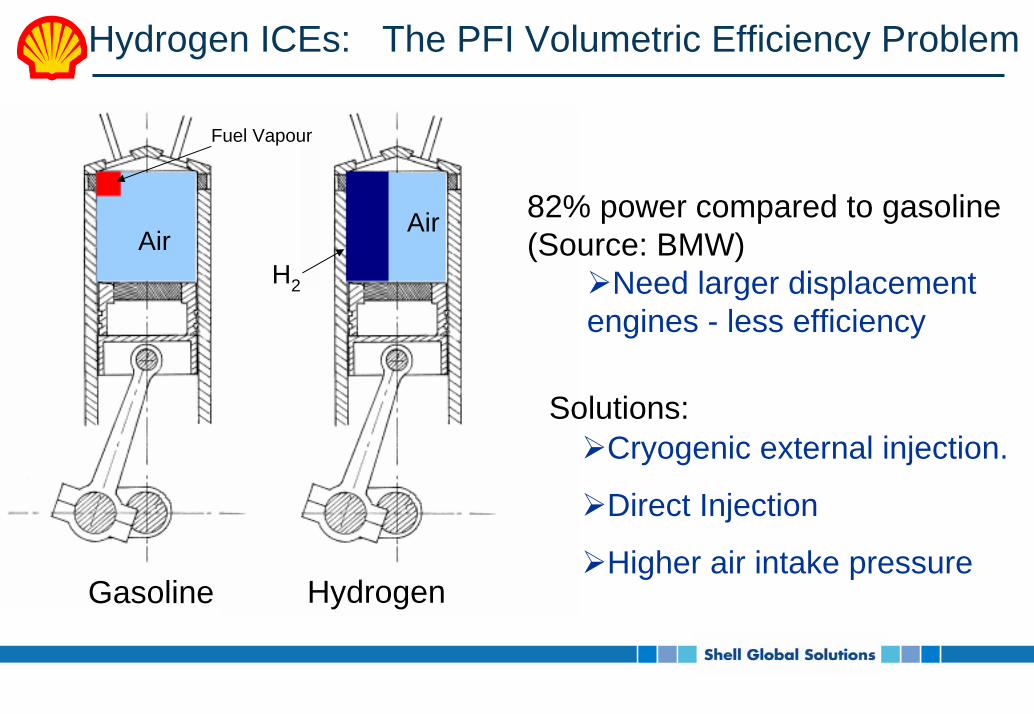
Hydrogen ICEs: The PFI Volumetric Efficiency Problem
82% power compared to gasoline (Source: BMW)
Need larger displacement engines - less efficiency
Cryogenic external injection.
Direct Injection
Higher air intake pressure
Solutions:
Gasoline Hydrogen
Air
Fuel Vapour
Air
H2
Hydrogen ICEs: The PFI Volumetric Efficiency Problem
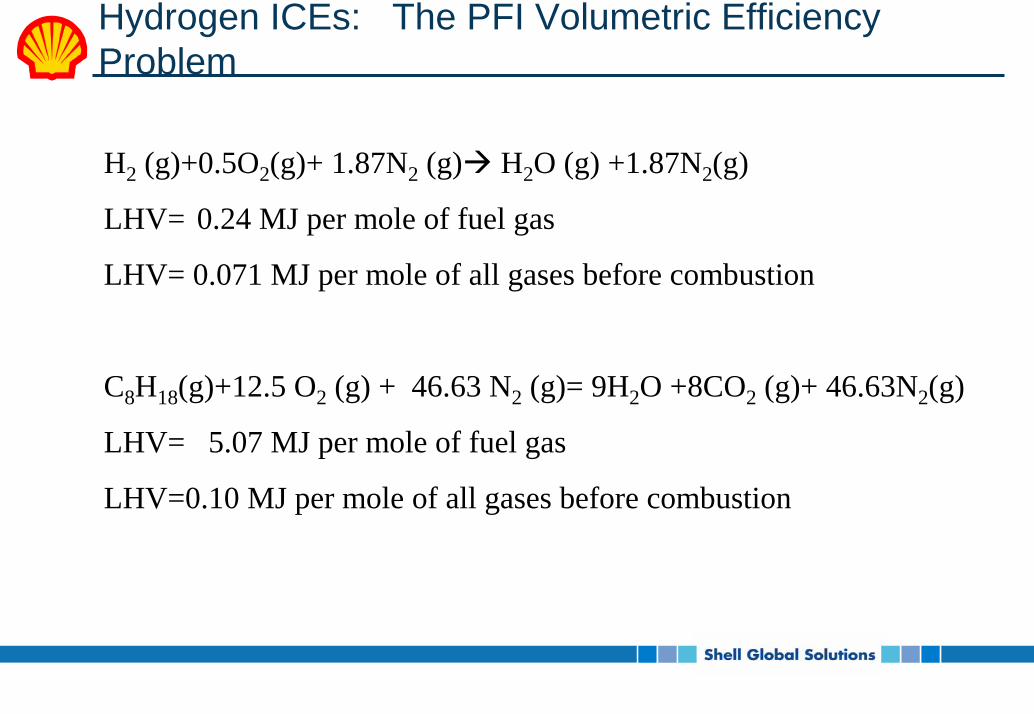
H2 (g)+0.5O2(g)+ 1.87N2 (g) H2O (g) +1.87N2(g)
LHV= 0.24 MJ per mole of fuel gas
LHV= 0.071 MJ per mole of all gases before combustion
C8H18(g)+12.5 O2 (g) + 46.63 N2 (g)= 9H2O +8CO2 (g)+ 46.63N2(g)
LHV= 5.07 MJ per mole of fuel gas
LHV=0.10 MJ per mole of all gases before combustion
Hydrogen ICEs: The PFI Volumetric Efficiency Problem
82% power compared to gasoline (Source: BMW)
Need larger displacement engines - less efficiency
Cryogenic external injection.
Direct Injection
Higher air intake pressure
Solutions:
Gasoline Hydrogen
Air
Fuel Vapour
Air
H2

Optimistic Views on Hydrogen ICEs from OEMs
BMW: Gerbig et al (2004) Fisita F2004V113
"we expect to achieve overall [ICE] drivetrain efficiency of 50% in the best point of operation".
Ford:
Natkin et al (2003) SAE 2003-01-0631(Ford Zetec 2.0L engine5000RPM)
0
0.1
0.2
0.3
0.4
0.5
0.6
0 0.2 0.4 0.6 0.8φ
Ther
mal
Effi
cien
cy
BrakeIndicated
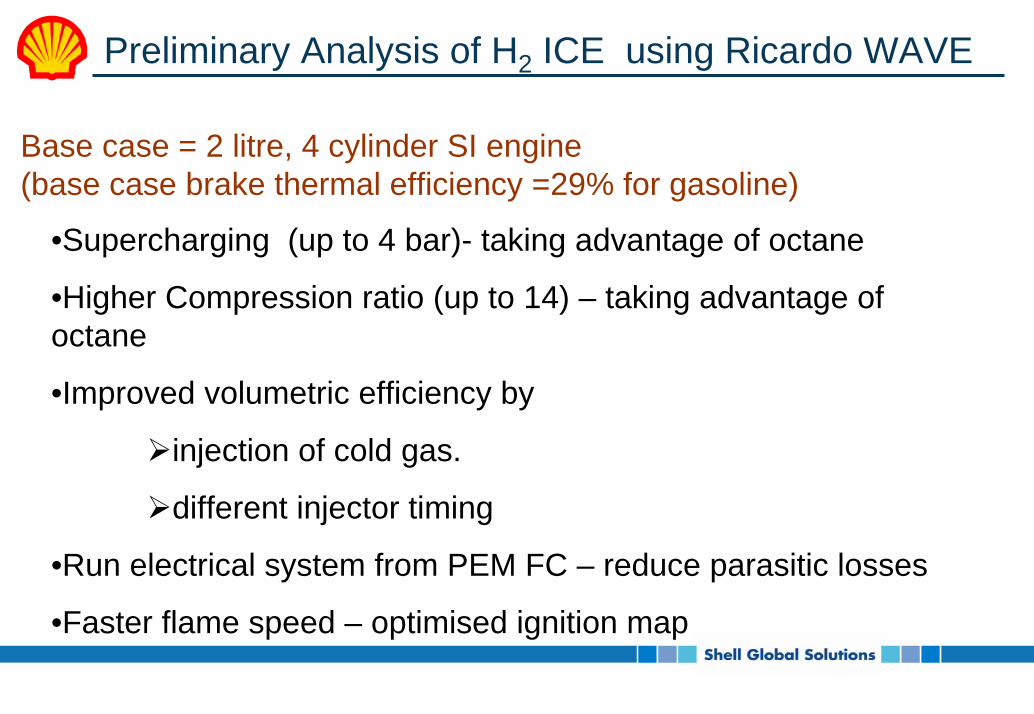
Preliminary Analysis of H2 ICE using Ricardo WAVE
Base case = 2 litre, 4 cylinder SI engine (base case brake thermal efficiency =29% for gasoline)
•Supercharging (up to 4 bar)- taking advantage of octane
•Higher Compression ratio (up to 14) – taking advantage of octane
•Improved volumetric efficiency by
injection of cold gas.
different injector timing
•Run electrical system from PEM FC – reduce parasitic losses
•Faster flame speed – optimised ignition map
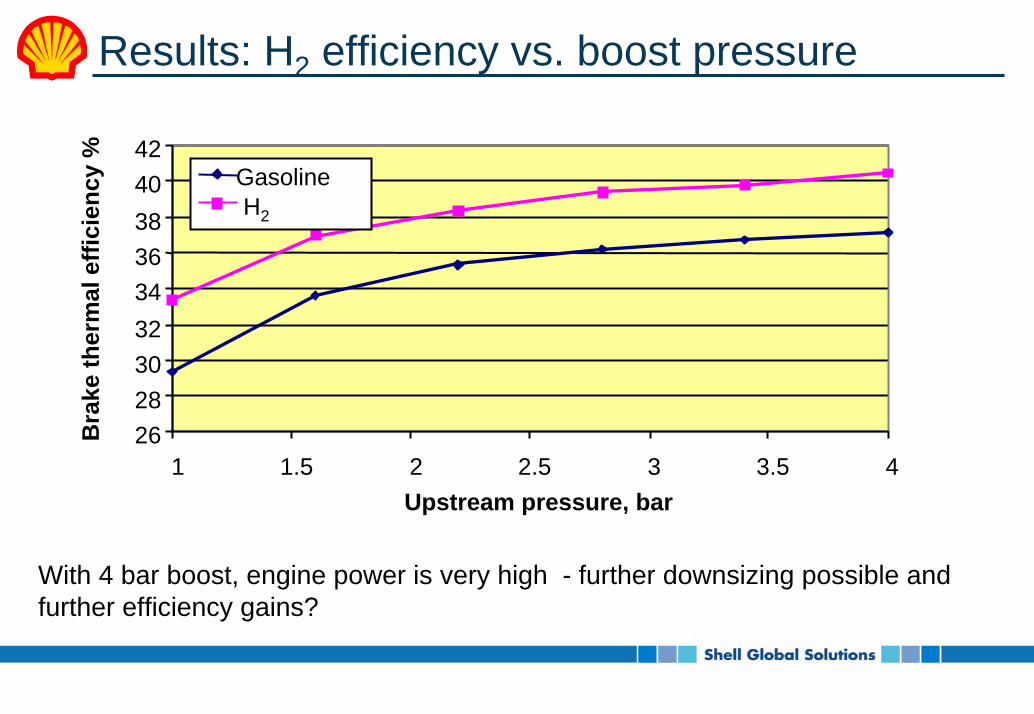
Results: H2 efficiency vs. boost pressure
262830323436384042
1 1.5 2 2.5 3 3.5 4Upstream pressure, bar
Bra
ke th
erm
al e
ffici
ency
%
Gasoline H2
With 4 bar boost, engine power is very high - further downsizing possible and further efficiency gains?

Strengths and Weaknesses of H2 ICES
StrengthsWeaknesses• Dual fuelled vehicles a
lower infrastructure requirement
• Likely to be affordable sooner than fuel cells?.
• Mass market for H2 as a fuel could occur sooner?.
• Less stringent hydrogen purity requirements?
• Poor Efficiency (c.f. fuel cells)
• Pre-ignition limits regions of operability
• Tailpipe emissions (esp. NOx)
Storage remains a challenge for H2 ICEs and FCVs
Pre-ignition
Pre-ignition is autoignition occurring before the spark. It can be very damaging.
Differs from conventional spark knock because it can not be eliminated by retarding the spark timing.
Thought to be due to “hot spots” or catalytic combustion.
Hydrogen is very susceptible because of wide flammability range and low ignition energy.
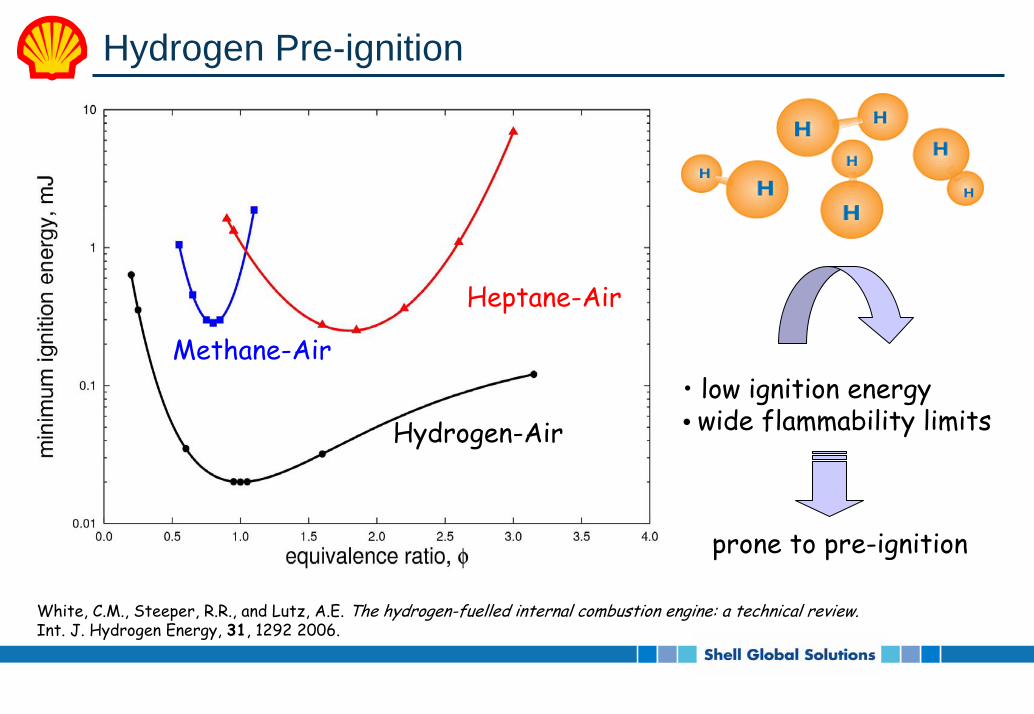
Hydrogen Pre-ignition
• low ignition energy• wide flammability limits
prone to pre-ignition
Hydrogen-Air
Methane-Air
Heptane-Air
White, C.M., Steeper, R.R., and Lutz, A.E. The hydrogen-fuelled internal combustion engine: a technical review.Int. J. Hydrogen Energy, 31, 1292 2006.
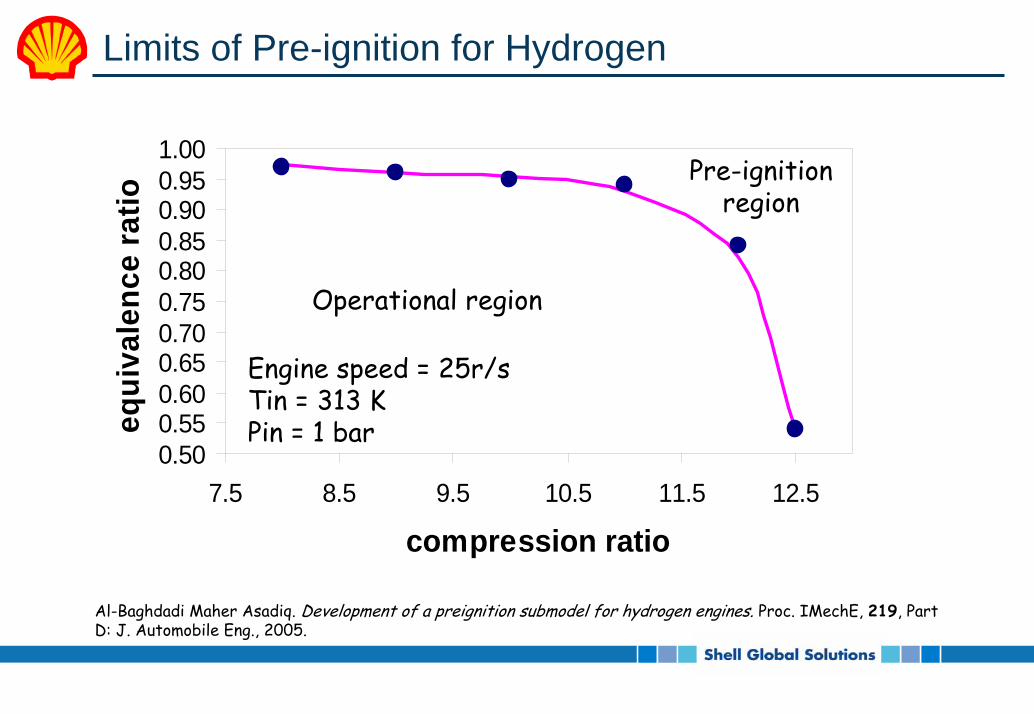
Limits of Pre-ignition for Hydrogen
0.500.550.600.650.700.750.800.850.900.951.00
7.5 8.5 9.5 10.5 11.5 12.5
compression ratio
equi
vale
nce
ratio
Pre-ignitionregion
Operational region
Engine speed = 25r/sTin = 313 KPin = 1 bar
Al-Baghdadi Maher Asadiq. Development of a preignition submodel for hydrogen engines. Proc. IMechE, 219, Part D: J. Automobile Eng., 2005.
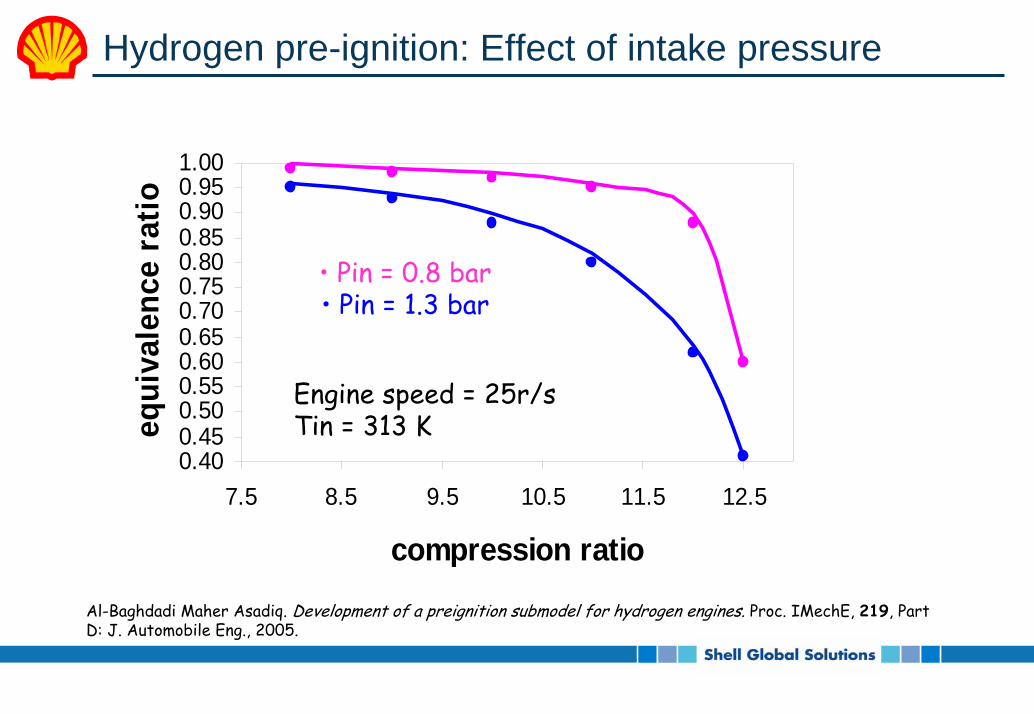
Hydrogen pre-ignition: Effect of intake pressure
0.400.450.500.550.600.650.700.750.800.850.900.951.00
7.5 8.5 9.5 10.5 11.5 12.5
compression ratio
equi
vale
nce
ratio
Al-Baghdadi Maher Asadiq. Development of a preignition submodel for hydrogen engines. Proc. IMechE, 219, Part D: J. Automobile Eng., 2005.
• Pin = 0.8 bar• Pin = 1.3 bar
Engine speed = 25r/sTin = 313 K

Hydrogen pre-ignition: Effect of Intake temperature
0.400.450.500.550.600.650.700.750.800.850.900.951.00
7.5 8.5 9.5 10.5 11.5 12.5
compression ratio
equi
vale
nce
ratio
Engine speed = 25r/sPin = 1 bar
• Tin = 300 K• Tin = 328 K
Al-Baghdadi Maher Asadiq. Development of a preignition submodel for hydrogen engines. Proc. IMechE, 219, Part D: J. Automobile Eng., 2005.

Late injection avoids pre-ignition
0
10
20
30
40
50
Crank Angle (Deg CA)
Cyl
inde
r Pre
ssur
e (b
ar)
Early Injection Spark Late Injection
Gerbig et al: FISITA paper F2004V113
Strengths and Weaknesses of H2 ICES
StrengthsWeaknesses• Dual fuelled vehicles a
lower infrastructure requirement
• Likely to be affordable sooner than fuel cells?.
• Mass market for H2 as a fuel could occur sooner?.
• Less stringent hydrogen purity requirements?
• Poor Efficiency (c.f. fuel cells)
• Pre-ignition limits regions of operability
• Tailpipe emissions (esp. NOx)
Storage remains a challenge for H2 ICEs and FCVs
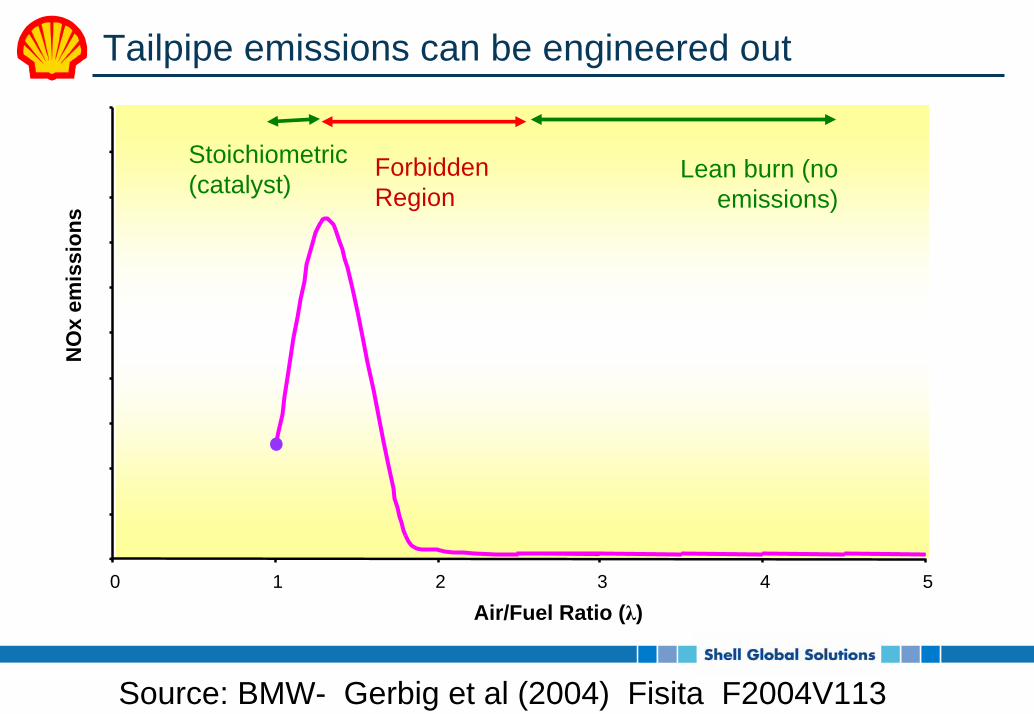
Tailpipe emissions can be engineered out
0 1 2 3 4 5
Air/Fuel Ratio (λ)
NO
xem
issi
ons
Stoichiometric(catalyst) Lean burn (no
emissions)Forbidden Region
Source: BMW- Gerbig et al (2004) Fisita F2004V113
Strengths and Weaknesses of H2 ICES
StrengthsWeaknesses• Dual fuelled vehicles a
lower infrastructure requirement
• Likely to be affordable sooner than fuel cells?.
• Mass market for H2 as a fuel could occur sooner?.
• Less stringent hydrogen purity requirements?
• Poor Efficiency (c.f. fuel cells)
• Pre-ignition limits regions of operability
• Tailpipe emissions (esp. NOx)
Storage remains a challenge for H2 ICEs and FCVs

Lower Infrastructure Requirements than Fuel Cell Vehicles?
•Hydrogen introduced first in “lighthouse projects” taking advantage of local hydrogen availability.
•Shell/GM study showed that economics of hydrogen roll-out requires smaller number of highly utilised retail stations.
•But customers also want to use vehicle to go away at weekends.
•Assume that IC engine calibrated and optimised for hydrogen, but can also operate on gasoline if required.
•Bi-fuel capacity ensures customers can go anywhere they want.
Strengths and Weaknesses of H2 ICES
StrengthsWeaknesses• Dual fuelled vehicles a
lower infrastructure requirement
• Likely to be affordable sooner than fuel cells?.
• Mass market for H2 as a fuel could occur sooner?.
• Less stringent hydrogen purity requirements?
• Poor Efficiency (c.f. fuel cells)
• Pre-ignition limits regions of operability
• Tailpipe emissions (esp. NOx)
Storage remains a challenge for H2 ICEs and FCVs

Likely to be affordable sooner than fuel cells?
US DOE target for fuel cells
‘By 2010, develop a 60% peak-efficient, durable, direct hydrogen fuel cell power system for transportation at a cost of $45/kW; by 2015, a cost of $30/kW.’
Current costs for conventional ICE vehicles: 25$-35$/kW
(Slightly higher costs for H2 ICESs)
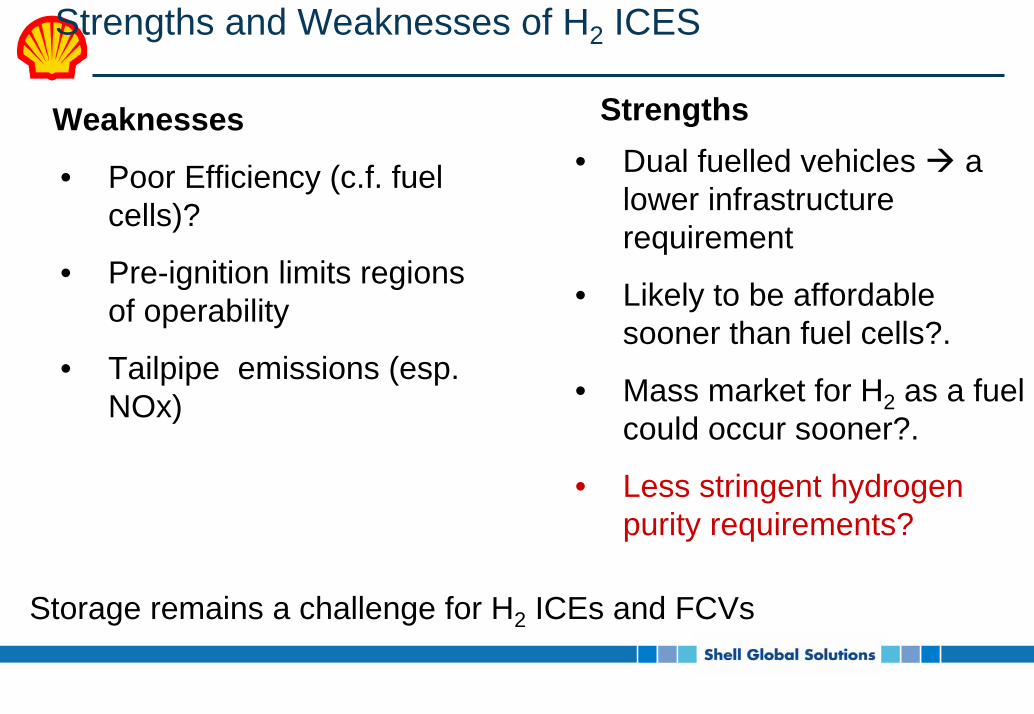
Strengths and Weaknesses of H2 ICES
StrengthsWeaknesses• Dual fuelled vehicles a
lower infrastructure requirement
• Likely to be affordable sooner than fuel cells?.
• Mass market for H2 as a fuel could occur sooner?.
• Less stringent hydrogen purity requirements?
• Poor Efficiency (c.f. fuel cells)?
• Pre-ignition limits regions of operability
• Tailpipe emissions (esp. NOx)
Storage remains a challenge for H2 ICEs and FCVs
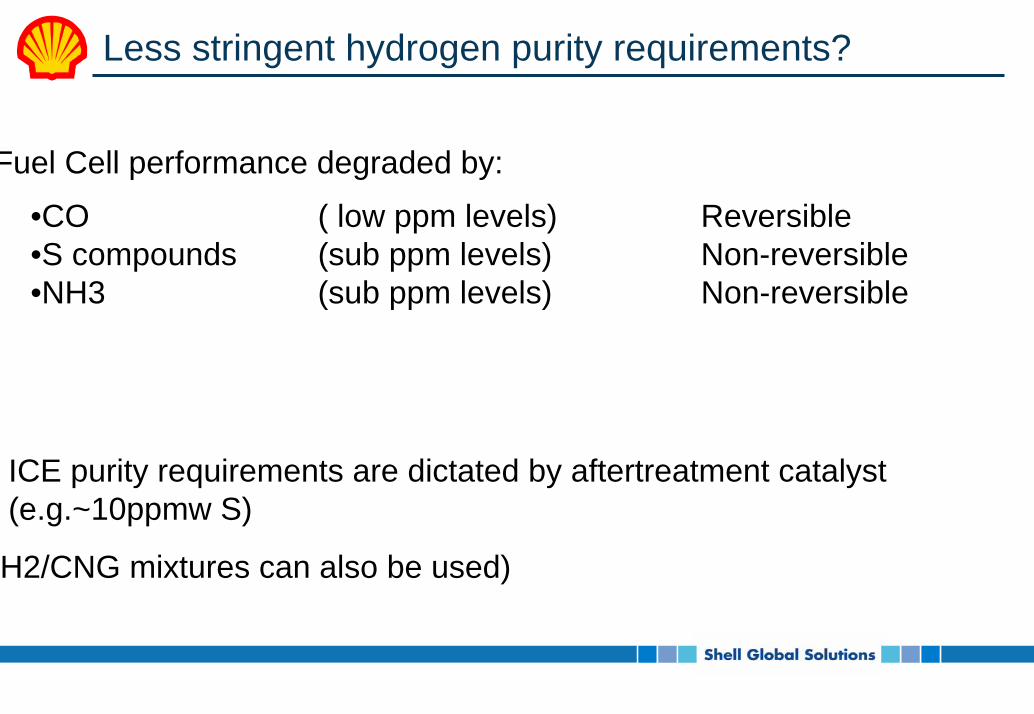
Less stringent hydrogen purity requirements?
Fuel Cell performance degraded by:
•CO ( low ppm levels) Reversible•S compounds (sub ppm levels) Non-reversible•NH3 (sub ppm levels) Non-reversible
ICE purity requirements are dictated by aftertreatment catalyst (e.g.~10ppmw S)
(H2/CNG mixtures can also be used)
Strengths and Weaknesses of H2 ICES
StrengthsWeaknesses• Dual fuelled vehicles a
lower infrastructure requirement
• Likely to be affordable sooner than fuel cells?.
• Mass market for H2 as a fuel could occur sooner?.
• Less stringent hydrogen purity requirements?
• Poor Efficiency (c.f. fuel cells)
• Pre-ignition limits regions of operability
• Tailpipe emissions (esp. NOx)
Storage remains a challenge for H2 ICEs and FCVs
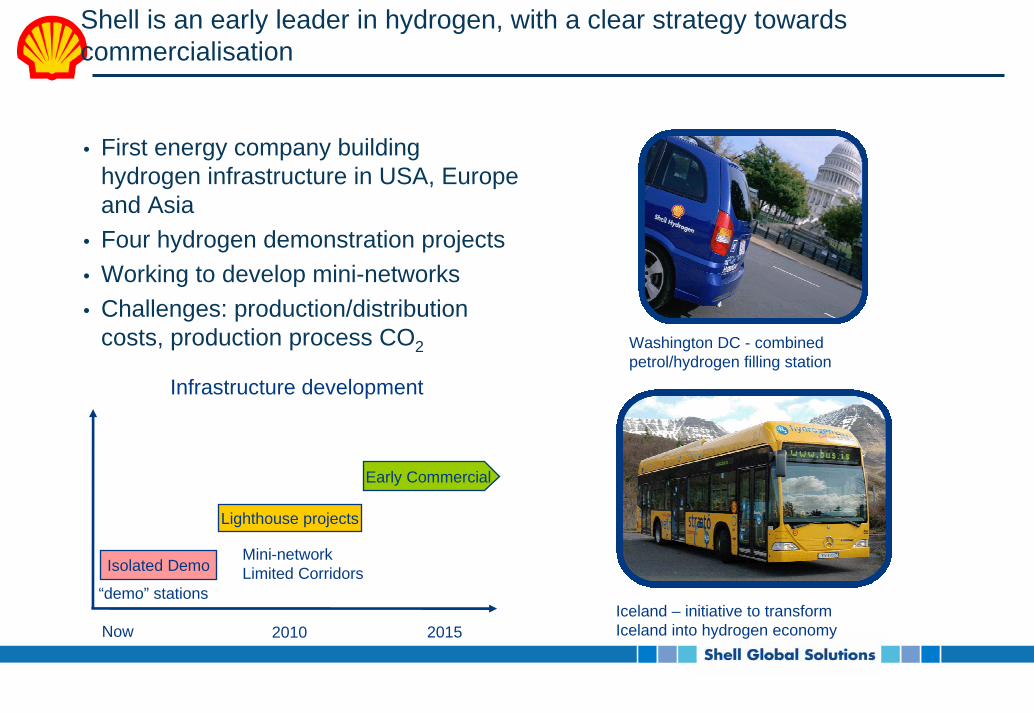
Shell is an early leader in hydrogen, with a clear strategy towards commercialisation
• First energy company building hydrogen infrastructure in USA, Europe and Asia
• Four hydrogen demonstration projects• Working to develop mini-networks • Challenges: production/distribution
costs, production process CO2
Iceland – initiative to transformIceland into hydrogen economy
Washington DC - combined petrol/hydrogen filling station
Isolated Demo
“demo” stations
2015
Early Commercial
Mini-networkLimited Corridors
Now
Lighthouse projects
2010
Infrastructure development
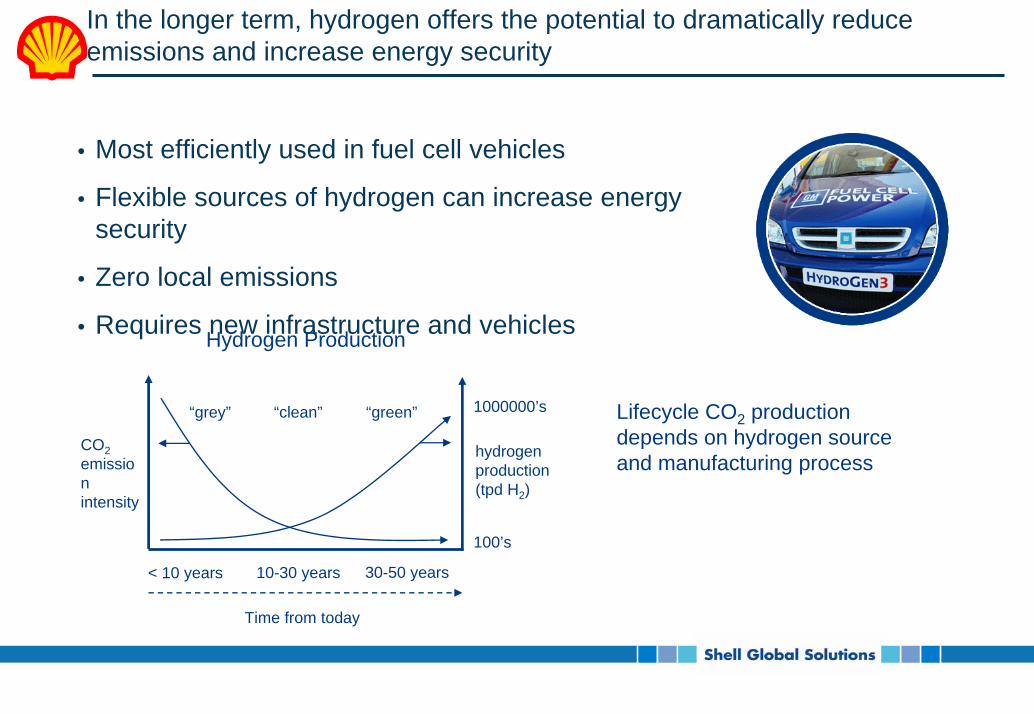
In the longer term, hydrogen offers the potential to dramatically reduce emissions and increase energy security
• Most efficiently used in fuel cell vehicles
• Flexible sources of hydrogen can increase energy security
• Zero local emissions
• Requires new infrastructure and vehicles
Lifecycle CO2 production depends on hydrogen source and manufacturing process
Hydrogen Production
“grey” “clean” “green”
CO2 emission intensity
1000000’s
100’s
hydrogen production (tpd H2)
< 10 years 10-30 years 30-50 years
Time from today


