Broad Lane, Sheffield, S3 7HQTelephone:+44 (0)114 289 2000Facsimile: +44 (0)114 289 2500
HEALTH AND SAFETY LABORATORYAn agency of the Health and Safety Executive
1
Wood dust survey 1999/2000.
FINAL REPORT
Environmental Measurement Group
Martin Dilworth
Martin DilworthProject Leader:

Distribution
Health & Safety Executive
Mr G Bungay, Agriculture and Wood SectorMr N Summers, Agriculture and Wood SectorMr N Black Midlands Specialist GroupMr R Tarry, OHEUMr A D Griffin, FSU 1Mr P Evans,TD3Dr C Elliot-Minty, HD D3Ms L Whitford HD C CRAU1 Mr A Maxey, HDC WRMUBand 2 SG Occupational HygienistsMs K Parkinson, London and South East Specialist GroupLibrary Information Services
Health & Safety Laboratory
Dr A Jones, Operations DirectorMr I Price, Explosion ControlMs H Chambers, FSSUMr AR Forth, FSSUFSSU Field ScientistsMr C Keen, Organic Measurement SectionMr M Hemingway, Field Measurement SectionMr RDR Clark, Field Measurement Section
Library Information Services (9 copies)File copy
HSE Authorising officer: Mr N Summers
Date of issue: 27th September, 2000Job Number: JS20001349Registry File: FS/RE/19/1999Document Filename: K:/FSSU/WoodSurvey/Wdfinalreport.lwp
HEALTH AND SAFETY LABORATORYAn agency of the Health and Safety Executive
© Crown copyright 20002
Available to the public.

SUMMARY
Objectives
w To obtain a picture of current occupational exposure to wood dust by
measuring levels of exposure in a representative range of tasks and
processes across the woodworking industry.
w To assess compliance with the maximum exposure limits (MELs) for
wood dust and certain aspects of the Control of Substances Hazardous to
Health (COSHH) Regulations.
w To compare the exposure data with the results of the 1988/9 Technical
Development Survey (TDS) to identify any changes in patterns of
exposure, and to identify any differences in exposure resulting from the
impact of the COSHH Regulations and the MELs for wood dust.
Main Findings
A nationwide survey was carried out to determine personal exposures to wood dust
and to assess compliance with certain aspects of the Control of Substances
Hazardous to Health Regulations. A total of 386 personal air samples were collected
at 47 different woodworking sites representative of the industry as a whole.
Most samples were below the maximum exposure limit (MEL) of 5 mg/m3 for wood
dust, but a significant amount (27.2%) were in excess of the MEL. Circular sawing
and sanding were identified as processes giving rise to particularly high exposures.
Only 34% of sites could produce a written COSHH assessment, and a significant
percentage of the sites visited did not carry out either weekly or 14 monthly checking
of local exhaust ventilation systems.
HEALTH AND SAFETY LABORATORYAn agency of the Health and Safety Executive
© Crown copyright 20003

The air sampling results from this survey were compared with those obtained in a
1988/9 survey. The comparison suggests that there has been an overall decrease in
the proportion of samples exceeding the MEL. In 1988/9 fixed position mechanical
sanding and circular sawing were the processes leading to the highest exposures,
and this is consistent with the findings of this survey.
Main Recommendations
This is a factual report, and as such there are no recommendations.
HEALTH AND SAFETY LABORATORYAn agency of the Health and Safety Executive
© Crown copyright 20004

CONTENTS
1. INTRODUCTION
2. OBJECTIVES
3. METHODOLOGY
3.1 Scope
3.2 Air sampling and analysis procedure
3.3 Assessment of compliance with COSHH Regulations
3.4 Comparison of results with those obtained in 1988/9 TDS
4. RESULTS
4.1 Air sampling results
4.2 Compliance with MEL’s for wood dust
4.3 Compliance with COSHH Regulations
4.3.1 Availability of COSHH assessments
4.3.2 Control measures used in the woodworking industry
4.3.3 Maintenance of control measures
4.3.4 Other relevant information
5. COMPARISON OF RESULTS FROM THIS SURVEY WITH THOSE OBTAINED IN THE 1988/9 TDS
6. CONCLUSIONS
7. ACKNOWLEDGEMENTS
8. APPENDICES
9. REFERENCES
HEALTH AND SAFETY LABORATORYAn agency of the Health and Safety Executive
© Crown copyright 20005

1. INTRODUCTION
A Control Limit of 5 mg/m3 for total inhalable hardwood dust measured as an 8 hour
time weighted average (8hr TWA) came into effect in April 1988. This followed a
proposal by the Advisory Committee on Toxic Substances (ACTS) which was based
on the findings of HSE surveys carried out in 1976 and 1983. The Control Limit was
replaced by a maximum exposure limit (MEL) of the same value when the Control of
Substances Hazardous to Health Regulations (COSHH) came into force in October
1989.
To coincide with the implementation of COSHH, and in order to assess the standard
of control of hardwood dust being achieved, a nationwide Technical Development
Survey (TDS) was carried out during 1988/9 (HSE, 1990). A total of 363 personal air
samples were collected at 41 factories. Approximately 60% of exposures were found
to be below 5 mg/m3.
The 1988/9 TDS found that very few premises worked solely with hardwoods and
there was substantial processing of softwoods using the same machinery. It was
considered reasonable to use the 1988/9 data as a guide to exposures to softwood
dusts. The findings of the TDS were therefore used by ACTS in the process of
setting an occupational exposure limit for softwood dust (HSE, 1996). A MEL for
softwood dust of 5 mg/m3 (8hr TWA) came into force in January 1997.
Since the 1988/9 TDS, the use of composite materials, particularly medium density
fibreboard (MDF), has become more prevalent. Although the amount of dust gener-
ated when sawing MDF is similar to that generated when sawing pure woods, the
amount of dust generated when sanding MDF may be higher (HSE, 1999).
At the request of FOD’s Agriculture and Wood Sector (AWS), the Health and Safety
Laboratory (HSL) undertook a nationwide study of exposure to wood dust in the
woodworking industry. The purpose was to update the information collected in the
1988/9 TDS. In the 1999/2000 survey, exposures to hardwoods, softwoods and
composite materials were measured. The impact of the MELs for wood dust and the
HEALTH AND SAFETY LABORATORYAn agency of the Health and Safety Executive
© Crown copyright 20006

requirements of the COSHH Regulations on exposures was also assessed by
comparing the results of this survey with those obtained in 1988/9.
HEALTH AND SAFETY LABORATORYAn agency of the Health and Safety Executive
© Crown copyright 20007

2. AIMS AND OBJECTIVES.
The aim of the project was to provide information on occupational exposure to wood
dust to determine any changes in patterns of exposure since a previous survey in
1988/9.
The objectives of this project were threefold:
w To obtain a picture of current occupational exposure to wood dust by
measuring levels of exposure in a representative range of tasks and
processes across the woodworking industry.
w To assess compliance with the maximum exposure limits (MELs) for
wood dust and certain aspects of the Control of Substances Hazardous to
Health (COSHH) Regulations.
w To compare the exposure data with the results of the 1988/9 Technical
Development Survey (TDS) to identify any changes in patterns of
exposure, and to identify any differences in exposure resulting from the
impact of the COSHH Regulations and the MELs for wood dust.
In addition to the above, two other related HSL projects were carried out concurrently
and are detailed elsewhere:
w Visualisation of exposure to wood dust (at a site visited during this
survey). Mr RDR Clark, Field Measurement Section, HSL (video available
from Mr RDR Clark)
w Field trials of a passive dust sampler in the woodworking industry. Dr M
Hemingway, Field Measurement Section, HSL. Project FMS/00/02
(Available from Library Information Services)
HEALTH AND SAFETY LABORATORYAn agency of the Health and Safety Executive
© Crown copyright 20008
3. METHODOLOGY.
3.1 Scope
In order to obtain data representative of the woodworking industry as a whole, the
AWS selected a wide range of premises to be visited. These premises were identi-
fied from the FOCUS database and covered:
w Different types of woodworking industries (sawmilling, furniture
manufacture, joineries, shop fitters etc).
w Different types of wood worked. (Exposure to dust from both
hardwoods and softwoods were measured. Also included in the survey
were exposures to dust from composite materials such as medium
density fibreboard (MDF), plywood, and chipboard)
w Different numbers of employees.
No particular effort was made to include or exclude those premises previously visited
during the 1988/9 TDS.
Some 60 sites were identified by the AWS and passed to HSL’s Field Scientific
Support Unit (FSSU) who selected 47 suitable sites to visit. After informing the
relevant FOD Principal Inspector of the intention to visit, a letter was sent to the
occupier giving notice of the intended visit (See Appendix 1 for copy of letter). FSSU
scientists then visited the premises to collect data during the period January-July
2000.
Field Scientists visited the selected premises and collected a total of 386 personal
samples (ie an average of 8 personal air samples were collected at each site). Static
samples were not collected, as the main objective of the project was to compare the
air sampling results with the MELs for wood dust, and the results of static sampling
cannot be compared to a MEL.
HEALTH AND SAFETY LABORATORYAn agency of the Health and Safety Executive
© Crown copyright 20009

Once the air sampling results had been collated, they were passed to the relevant
FOD PI for input into the FOCUS database, and to be passed onto the occupier of
the premises visited. The air sampling results were also passed to Technology
Division 3 for input into the National Exposure Database (NEDB).
An analysis of the data collected was performed to determine:
w The mean, median, 95th percentile value, range and distribution of air
sampling results
w The mean, median, 95th percentile value and range of results grouped by
type of woodworking process
3.2 Air sampling and analysis procedure
Personal air samples for wood dust were taken in accordance with MDHS 14/3
“General methods for the sampling and gravimetric analysis of respirable and
inhalable dust”. The method involves drawing air from the breathing zone of an
operator into an IOM cassette fitted with a 25mm diameter glass fibre filter at a flow
rate of 2 l/min. Gravimetric analysis of the samples was performed locally by the
FSSU scientist. Air sampling results were reported on BOHS/NEDB 1 forms as
measured results and as 8-hour time weighted averages in accordance with Part 3 of
EH40/2000.
3.3 Assessment of compliance with COSHH Regulations
To determine compliance with COSHH, a questionnaire was administered by the
FSSU scientist at each site. Information to accompany the air samples, such as
hours of work, shift patterns etc, was also recorded on the questionnaire. A copy of
the questionnaire is attached as Appendix 2 of this report.
HEALTH AND SAFETY LABORATORYAn agency of the Health and Safety Executive
© Crown copyright 200010

It is not possible to measure absolute compliance to the COSHH Regulations using a
questionnaire. To assess compliance, a detailed occupational hygiene survey would
need to be carried out at each site visited. The administration of the questionnaire
was intended to gain factual information on certain aspects of compliance with
COSHH. Factual information on the following topics was collected by the FSSU
scientist:
w The types of control measures used
w The maintenance of those controls
w The welfare facilities available to employees
w The availability and content of any COSHH assessment
w The cleaning methods employed by the occupier
w The provision and frequency of any health surveillance
w The availability and use of HSE and AWS guidance
This report contains no analysis of the more subjective information collected, such as
the efficiency of any control measures and the adequacy of any COSHH
assessment.
3.4 Comparison of results with those obtained from 1988/9 TDS
Despite the similar number of personal samples collected, a direct comparison of the
results from the TDS and the results from this survey is not straightforward. Jones
and Smith (1989) performed a similar comparison with data collected from surveys in
1976/7 and 1983, but in their case the 2 surveys compared used the same sampling
and analytical techniques, and the same premises were visited in 1976/7 and 1983.
A comparison between the data collected in this survey and the data collected in the
1988/9 TDS needs to take the following into account:
HEALTH AND SAFETY LABORATORYAn agency of the Health and Safety Executive
© Crown copyright 200011

w The TDS collected data on exposure to hardwood dust only. This survey
collected information on exposure to hardwoods, softwoods and
composite materials.
w A different measurement method was employed to take air samples in the
TDS. This survey uses the current recommended method for collecting
wood dust samples (the IOM sampler), whereas the modified UKAEA
“7-hole” sampler was used in the TDS. There is evidence to suggest that
there are differences in performance between different samplers for
inhalable dust (Mark and Vincent (1986) and Chung et al (1987)) .
w The 1988/9 TDS survey report groups together results by woodworking
process where possible. The 9 process groups chosen are different from
those detailed in this report. In itself, this is not a significant problem, as
the data collected during this survey can be regrouped. However, a
statistical analysis (mean, median, range, number of samples taken, 95th
percentile value) of the data within each process group was not fully
detailed in 1988/9, making a comparison by process possible in only 4
woodworking processes (saws, spindle moulders/routers,
tenoners/morticers and fixed position sanders).
A comparison between the 2 surveys was performed by firstly examining the distribu-
tion of the sampling results, and identifying any change in that distribution. A
comparison was also made with respect to the percentage of samples exceeding the
MEL. Also the numerical difference between the mean exposures for the 4 process
categories detailed above was calculated.
The differences between the 2 sets of results are likely to have large errors associ-
ated with them. These errors are not easily quantifiable, for example the difference
attributable to using two different sampling methods is not constant and will vary with
the particle size distribution of the sampled dust.
HEALTH AND SAFETY LABORATORYAn agency of the Health and Safety Executive
© Crown copyright 200012

4. RESULTS
The air sampling results presented in this section are all expressed as 8-hr TWA’s.
4.1 Air sampling results
A total of 386 personal air samples for wood dust were collected at 47 different sites.
The 47 sites visited were categorised by their 1992 Standard Industrial Classification
codes (SICs) and are shown in Table 1.
Table 1 Breakdown of sites visited by SIC code
2.11Manufacture of kitchenfurniture
36 1302.11Shopfitting36 120
2.11Manufacture of otherwooden products
20 510
6.43Manufacture of palletsand packing cases
20 40012.86Sawmilling20 100
178Manufacture of chairsand seats
36 110
21.310Manufacture of otherfurniture
36 140
38.318Manufacture of build-ers’ carpentry andjoinery
20 300
Percentage oftotal sited visited
(%)
Number of sitesvisited
DescriptionSIC code
Most of the sites visited worked a mixture of hardwood, softwood and composite
materials (64%), 23% worked softwoods only, 8% worked composite materials only
and 4% worked exclusively with hardwood.
The survey was carried out nationwide and a geographical breakdown of the sites
visited, and the number of personal air samples collected is given in Table 2.
HEALTH AND SAFETY LABORATORYAn agency of the Health and Safety Executive
© Crown copyright 200013

Table 2. Breakdown of sites visited and samples collected by FOD Division
38647TOTAL426Scotland (SCO)527North East (NE)185North West (NW) 395Midlands (MID)183Wales and South West (WSW)
19619Home Counties (HC)152London and South East (LSE)
Number of samplescollected
Number of sitesvisited
FOD Division
The high proportion of sites in the Home Counties Division did not introduce any bias
to the results as the woodworking undertaken here was broadly similar to the rest of
the country.
A simple statistical analysis of the air sampling data shows the average personal
exposure for the 386 samples taken to be 6.57 mg/m3. The median for the 386
samples was 2.6 mg/m3 and the range of the results was from 0.05 to 157 mg/m3.
The 95th percentile value for all of the air samples taken was 25.1 mg/m3.
The distribution of the samples is shown in Table 3. The number of samples in each
range was determined, and the data was plotted as a frequency histogram in Figure
1.
HEALTH AND SAFETY LABORATORYAn agency of the Health and Safety Executive
© Crown copyright 200014

Table 3. Distribution of air sampling results
100.0100.0386TOTAL100.02.18>5098.20.3145 to <5097.90.3140 to <4597.60.0035 to <4097.60.5230 to <3597.12.1825 to <3095.01.8720 to <2593.12.61015 to <2090.56.02310 to <1584.511.7455 to <1072.872.8281<5
Relative cumula-tive frequency
(%)
Percentage oftotal samples
taken (%)
Number ofsamples
Range (mg/m3)
The distribution in Figure 1 is “skewed” towards the lower results with a “tail” contain-
ing a few extremely high results as is usual in a log-normal type distribution. Given
this, the arithmetic mean of 6.57 mg/m3 may be somewhat misleading, and the
median result of 2.6 mg/m3 may be more generally representative of exposure to
wood dust for the samples collected in this survey. The main purpose of calculating
arithmetic mean was to allow a comparison with the data collected from the 1988/9
TDS.
HEALTH AND SAFETY LABORATORYAn agency of the Health and Safety Executive
© Crown copyright 200015

Figure 1. Cumulative frequency plot of air sampling data
An analysis of the air sampling result was carried out to determine the range of
exposures on a “site by site” basis. Table 4 shows the results of this analysis.
Table 4 Site by site analysis of air sampling results
100.0100.047TOTAL
100.012.86 One or moresamples >50
87.24.22All samples<3583.06.43All samples<3076.612.86All samples <2563.84.32All samples<2059.517.08All samples <1542.58.54All samples <1034.034.016All samples <5
Cumulativepercentage (%)
Percentage ofpremises (%)
Number ofpremises
Range (mg/m3)
From Table 4 one can see that at 34% of the sites visited, all exposures were below
the MEL of 5 mg/m3. Conversely, at 66% of sites visited the MEL was exceeded in at
HEALTH AND SAFETY LABORATORYAn agency of the Health and Safety Executive
© Crown copyright 200016

least one case, and at 12.8% of sites the MEL was exceeded by a factor of 10 in at
least one case.
An analysis of the data by woodworking process was carried out to identify any
relationships between the task and exposure to wood dust. The 386 samples
collected were grouped into the 11 categories of woodworking task detailed in Table
5.
Table 5. Breakdown of air sampling results by process.
100.0386ALL PROCESSES
0.83Workers exclusively usingmortice or tenon machine
Mortice/tenoning
1.04Workers exclusively usingmachine planers
Planing
1.04Workers exclusively usinghand and fixed position drills
Drilling
1.04Workers putting togetherpieces to form woodenitems
Assembly
3.112Workers exclusively usingrouting machines
Routing
3.614Workers exclusively usingband saw
Bandsawing
4.617Workers exclusively usingcross-cut saw
Cross cutting
8.031Workers exclusively usingspindle moulding machines
Spindle moulding
14.255Workers undertaking allother forms of sawing,including that by hand
Circular sawing(except cross cut sawing)
1454Workers using fixed positionsanders, powered handsanders and manualsanding
Sanding
48.7188Those workers undertakingmore than one processduring the sampling period
Multitasking
Percentage oftotal samples (%)
Number ofsamplescollected
DescriptionProcess
A simple statistical analysis of the data from the 11 process categories was
performed to determine the arithmetic mean, median, range and 95th percentile
value for each process, and is presented in Table 6.
HEALTH AND SAFETY LABORATORYAn agency of the Health and Safety Executive
© Crown copyright 200017

Table 6: Breakdown of sampling results by woodworking process
0.05 - 15725.12.66.57386ALLPROCESSES
2.48 - 5.054.883.323.623*Mortice/tenoning
0.33 - 2.781.181.531.534*Planing0.96 - 8.217.321.743.164*Drilling0.29 - 2.071.971.161.174*Assembly1.18 - 48.729.11.987.0212Routing0.18 - 22.819.72.165.2114Bandsawing
0.25 - 15.76.01.192.3417Crosscutting
0.05 - 13.510.02.153.0031Spindlemoulding
0.28 - 15723.49.4610.1155Circularsawing
0.21 - 10149.13.1310.5754Sanding0.07 - 85.225.12.976.46188Multitasking
RANGE OF RESULTS(mg/m3)
95thPERCENTILE
(mg/m3)
MEDIANEXPOSURE
(mg/m3)
MEAN EXPOSURE
(mg/m3)
SAMPLESTAKEN
PROCESS
*These results are shown for completeness: Due to the relatively small sample sizes
for these process categories, an analysis of the data may not be meaningful.
4.2 Compliance with MELs for wood dust
A total of 386 personal samples were collected for the survey. 105 of these 386
samples, or 27.2% of the total, exceeded the MELs for wood dust of 5 mg/m3. At
least one person at 31 of the 47 sites visited (66%) had an exposure to wood dust in
excess of the MEL.
A breakdown of those samples exceeding the MEL by woodworking process is
shown in Table 7. The samples are broken down into the same 11 woodworking
categories shown in Table 6.
HEALTH AND SAFETY LABORATORYAn agency of the Health and Safety Executive
© Crown copyright 200018

Table 7: Breakdown of samples exceeding MEL by process
N/A105386TOTAL0.004Assembly0.004Planing5.9117Cross cutting
14.3214Bandsawing
16.0531Spindlemoulding
25.0312Routing25.014Drilling33.313Mortice/tenoning25.41455Circular sawing37.02054Sanding31.158188Multitasking
PERCENTAGEEXCEEDING BY
PROCESS
NUMBEREXCEEDING MEL
SAMPLESTAKEN
PROCESS
There were 20 air samples in excess of 25 mg/m3, or 5 times the MEL. These
samples were selected for further analysis to identify any common features which
would explain such particularly high exposures. The first stage of this analysis was to
identify at which premises these samples were taken, and whether these sites had
factors in common causing high exposures. The 20 samples in excess of 25 mg/m3
originated from 13 different sites or 27.7% of the total number of sites visited. One
site had 4 exposures in excess of 25 mg/m3, one site had 3 exposures in excess of
25 mg/m3 and two sites had two exposures in excess of 25 mg/m3. The remaining 9
sites had one exposure each in excess of 25 mg/m3.
No site-specific factors could be identified to explain why the high exposures
occurred. The type of wood worked at the 13 sites, the availability of a COSHH
assessment, the undertaking of weekly and 14 monthly checking of LEV were similar
to the other 34 sites visited during the survey.
The 20 high exposures came from the following processes: Multitasking 10 (50%),
hand sanding 6 (30%), circular sawing 3 (15%), and routing 1 (5%). It was not
HEALTH AND SAFETY LABORATORYAn agency of the Health and Safety Executive
© Crown copyright 200019

possible to determine whether LEV was installed and working on all the machines
that were operated by workers who were multitasking. None of the 6 hand sanders
had LEV installed and operational, but all of the saws and the router did.
In summary, from the data collected during the survey, it was not possible to identify
any site- or process-specific factors that led to exposures in excess of 5 times the
MEL.
4.3 Compliance with COSHH Regulations
4.3.1 Availability of COSHH assessments
A written COSHH assessment as described in COSHH Regulation 6 (1) was avail-
able at 16 (34%) of the sites visited. 10 companies had carried out their own assess-
ment, and 6 were carried out by an external organization. Comment on the quality of
the assessments seen is not passed, as this was outside the remit of the survey.
Information was collected on whether the assessment covered the following topics:
production, maintenance, cleaning and dermal contact. All of the assessments
covered production, 4 (25%) covered maintenance, 3 (19%) covered cleaning and 2
(12%) considered dermal contact.
4.3.2 Control measures used in the woodworking industry
All of the 47 sites visited during the survey used local exhaust ventilation (LEV) to
control emissions of wood dust from at least some woodworking machines. These
systems were either one system ducted to a series of machines, or an individual
system dedicated to a single machine, or a mixture of both in one workplace. At 30
(64%) of the sites visited a recirculating LEV system was in place, returning filtered
air to the workplace.
Respiratory protective equipment (RPE) was used to control exposure to wood dust
at 40 of the 47 sites. At the 40 sites using RPE as a control measure, a variety of
respirators were observed in use. The list below details the types of RPE used:
HEALTH AND SAFETY LABORATORYAn agency of the Health and Safety Executive
© Crown copyright 200020

w FFP1 orinasal disposable masks were used at 15 (32%) of the sites
visited
w FFP2 orinasal disposable masks were used at 20 (42%) of the sites
visited
w FFP3 orinasal disposable masks were used at 13 (28%) of the sites
visited
w Powered RPE was used at 5 (11%) of the sites visited
w Unmarked RPE (“nuisance dust masks”) were used at 8 (17%) of the
sites visited
It should be noted that at some sites more than one type of RPE was used, and as a
result the percentage values do not add up to 100. At 76% of the sites where RPE
was used, the use of RPE was task-specific in that RPE was worn for the duration of
particularly dusty tasks. At the remaining 24% of sites, RPE was worn for the
duration of the working shift. Comment on the effectiveness of the RPE in use is not
covered in this report, but the incorrect use of RPE (worn with facial hair, worn
upside down etc) was noted at many sites. Training and instruction on the correct
use of RPE had been administered at only 3 of the 40 sites where RPE was in use,
but only one site kept records of the training and instruction provided. At 20 (50%) of
the sites where RPE was used, there were inadequate storage facilities, such as
personal lockers, for the storage of RPE.
None of the sites visited had an RPE face-fitting program in place.
An assessment of the welfare facilities available to employees was carried out at
each site. This included: washing facilities, eating facilities, eating and drinking
policies, and smoking policy. 40 of the 47 sites (85%) had at least an acceptable
standard of washing facilities available to their employees. An acceptable standard
was defined as a clean washing area, with running hot and cold water, an appropri-
ate number of wash basins for the size of workforce, and clean towels.
HEALTH AND SAFETY LABORATORYAn agency of the Health and Safety Executive
© Crown copyright 200021

33 of the 47 sites (70%) had no policy (written or otherwise) regarding the consump-
tion of food and drink whilst working, or in the vicinity of woodworking machinery. 17
of the 47 sites (36%) had no designated area, separate from the workroom for their
workforce to take eating and rest breaks.
4.3.3 Maintenance of control measures
All 47 sites had some form of LEV installed as a control measure. At 10 sites (21%)
a 14 month maintenance, examination and testing of the LEV system (as described
in COSHH Regulation 9(2)(a)) had been performed. At 6 of the 10 sites, the proce-
dure was undertaken by an external organization such as an occupational hygiene
consultancy or an insurance company. At the remaining 4 sites it was carried out by
the employer, and all 10 sites had written records of the testing procedure and the
results obtained. A 14 monthly maintenance, examination and testing scheme was
not in place at 37 of the 47 sites visited.
A weekly check of the LEV system was carried out in 17 of the 47 sites visited (36%)
and in all cases was carried out by in-house personnel. The remaining 30 sites did
not perform a weekly check of the LEV system.
At all the 30 sites with a recirculating LEV system there was no monitoring of the
quality of the air returned to the workplace.
4.3.4 Other relevant information
A health surveillance program was in place at 6 of the 47 sites (13%). In all of these
cases written records of the results of the surveillance were kept. All 6 health surveil-
lance schemes incorporated lung function testing and skin inspection.
30 of the 47 sites visited (64%) had no copies of any HSE publications. No further
analysis of the types of HSE guidance used by the 17 sites was done, but the most
commonly encountered guidance were the HSE Woodworking Information Sheets.
HEALTH AND SAFETY LABORATORYAn agency of the Health and Safety Executive
© Crown copyright 200022

Brush cleaning of wood dust was witnessed at 45 of the 47 sites visited (96%). The
use of compressed air lines to clean machinery or contaminated clothing was
witnessed at 30 of the 47 sites visited (64%). 37 of the 47 sites (79%) had a vacuum
cleaner available for use.
40 of the 47 sites had a policy forbidding smoking in the vicinity of woodworking
machinery.
HEALTH AND SAFETY LABORATORYAn agency of the Health and Safety Executive
© Crown copyright 200023

5. Comparison of results from this survey with those obtained from the
1988/89 TDS
The purpose of this section of the report is to study the data from 2 separate studies
and identify any changes in the magnitude and distribution of exposure to wood dust.
A direct comparison between the air sampling data collected from this survey and the
data collected from the 1988/9 TDS is not straightforward. The reasons for this are
detailed in section 3.4 of this report.
The first stage of the comparison exercise was to study the distribution of the air
sampling results obtained from the 2 surveys. Table 8 shows the distributions of the
air sampling data from the 2 surveys which is plotted as Figure 2.
Table 8: Comparison of distributions of air sampling results
100.0386100.0363TOTAL2.182.59>500.310.3145 to <500.310.5240 to <450.000.5235 to <400.521.4530 to <352.181.9725 to <301.872.5920 to <252.6104.71715 to <206.0239.43410 to <15
11.74516.8615 to <1072.828159.5216<5
Percentage oftotal samples
taken (%)
Number ofsamples
Percentage oftotal samples
taken (%)
Number ofsamples
1999/2000 SURVEY1988/9 TDS Range
HEALTH AND SAFETY LABORATORYAn agency of the Health and Safety Executive
© Crown copyright 200024

Figure 2 Distributions of air sampling results
The distributions of air sampling results shown in Figure 2 are of similar shape with
the peak frequency of occurrence well to the left of center and a long “tail” of
exposures extending to the highest value. The most noticeable difference between
the 2 distributions is the difference in the percentage of samples <5mg/m3. In 1988/9,
only 59.5% of air samples taken were below 5mg/m3, but in 1999/2000 the proportion
below 5mg/m3 had increased to 72.8%.
The data from the 1988/9 TDS was broken down and analyzed by woodworking
process. The categories chosen then were different from those used in this report
(shown in Table 5). The data from this survey were reorganized into the categories
chosen in 1988/9, but due to a lack of detail in the 1988/9 report, a comparison
could only be made for 4 woodworking processes : Sawing, spindle moulding/routing,
tenoning/morticing, and fixed position mechanical sanding.
HEALTH AND SAFETY LABORATORYAn agency of the Health and Safety Executive
© Crown copyright 200025

Table 9: Collation and comparison of air sampling results by process
0.21-40.2115.64<1-66418.8Fixed positionmechanicalsanders
2.48-5.0533.62<1-<8193.3Tenoners/morticers
0.05-48.7434.12<1-703911.8Spindle moulders /routers
0.18-157866.14<1-77928.9Saws
RangeNumberMean(mg/m3)
RangeNumberMean(mg/m3)
2000 Survey1988/9 TDSPROCESS
There is a small decrease in the mean exposures for sawing and fixed position
mechanical sanders of 2.8 and 3.2 mg/m3 respectively. These decreases in average
exposures are relatively small, and as previously discussed will have measurement
error associated with them. As a result it is not possible to establish whether any real
reduction in exposure has occurred. There is a significant decrease in the mean
exposure for spindle moulding and routing of 7.68 mg/m3. As only 3 morticer and
tenoner samples were collected in the 2000 survey, any comparison with the 19
samples collected in 1988/9 is likely to be unreliable and the figures are shown for
interest only.
The results of the site by site data analysis shown earlier in Table 3 were compared
with the results obtained from the 1988/9 TDS. The comparison is shown in Table
10.
HEALTH AND SAFETY LABORATORYAn agency of the Health and Safety Executive
© Crown copyright 200026

Table 10: Site by site comparison of air sampling results
100.0100.0100.0100.04741TOTAL
100.0100.012.814.666 One or moresamples >50
87.285.44.214.626All samples <5083.070.86.42.431All samples <3076.668.412.89.864All samples <2563.858.64.312.225All samples <2059.546.417.014.686All samples <1542.531.88.519.648All samples <1034.012.234.012.2165All samples <5
20001988/920001988/920001988/9
Cumulativepercentage (%)
Percentage ofpremises (%)
Number ofpremises
Range (mg/m3)
One can see from Table 10 that in 1988/9, only 12.8% of premises had all
exposures below the MELs of 5mg/m3, whereas in 1999/2000 this had increased
almost threefold to 34%. This trend is also seen when comparing the percentage of
sites where all exposures are below 10, 15, 20, 25, 30 and 50 mg/m3. For example,
in 1988/9 only 70.8% of sites had all exposures below 30 mg/m3, but in 2000 this had
increased to 83%. There is a small decrease of 1.8% in the number of premises
where at least one exposure is in excess of the MELs by a factor of 10 , but more
importantly 12.8% of premises in 2000 had at least one exposure of more than 50
mg/m3.
HEALTH AND SAFETY LABORATORYAn agency of the Health and Safety Executive
© Crown copyright 200027

6. CONCLUSIONS
w 386 samples were taken at 47 sites. 105 of these samples were in excess
of the MEL of 5 mg/m3 (8hr TWA) for wood dust.
w Only 16 of the 47 sites visited controlled all exposures to below the MEL.
w No site or process specific factors were identified from the survey data to
explain results in excess of 5 times the MEL.
w Circular sawing and sanding were identified as processes giving rise to
the highest exposures to wood dust.
w Only 34% of sites could produce a written COSHH assessment
w All 47 sites had some form of LEV as a control measure. A weekly check
was carried out at 36% of sites, and only 10 carried out a 14-monthly
maintenance, examination and testing of the system.
w 40 sites used RPE as a control measure. Training and instruction on the
use of RPE had been administered at only 3 of those 40 sites. There
were inadequate storage facilities at 20 sites. No site had an RPE
face-fitting programme in place.
w 85% of sites had adequate welfare facilities for their employees. 70% had
no policy on eating and drinking in the workplace. 36% had no designated
dust-free area for rest and eating breaks. 85% had a policy forbidding
smoking in the vicinity of woodworking machinery.
w 13% had a health surveillance scheme in place.
w 64% did not have copies of any HSE publication.
HEALTH AND SAFETY LABORATORYAn agency of the Health and Safety Executive
© Crown copyright 200028

w Brush cleaning was observed at 96% of sites, and the use of compressed
air lines for cleaning contaminated clothing and machinery was witnessed
at 64% of sites.
A comparison exercise was also undertaken comparing the results from this survey
with those obtained in 1988/9. The comparison is complicated by several factors
which are explained in section 3.4 of this report. Given these difficulties, it is not
possible to draw absolute conclusions when comparing the two sets of results.
However, it is reasonable to state that the following changes are at least suggestive:
w There has been a change in the distribution of the 2 sets of air sampling
results. Both are of similar shape, with most of the results being under 5
mg/m3 with a long “tail” of higher results. However, a substantial change
in the proportion of samples below the MEL of 5 mg/m3 was observed. In
1988/9 only 59.5% of results were below 5 mg/m3, whereas in 1999/2000
this had increased to 72.8%.
w A “site by site” analysis of air sampling results is also suggestive of
change. In 1988/9 only 12.2% of sites controlled all exposures to wood
dust to below the MEL. In 1999/2000 this figure had increased almost
threefold to 34.0%.
w The number of premises with at least one exposure in excess of 50
mg/m3 is similar (14.6% in 1988/9, 12.8% in 1999/2000)
w A “process by process” comparison shows that, as in 1988/9, circular
sawing and sanding are still the two processes giving rise to the highest
exposures to wood dust.
HEALTH AND SAFETY LABORATORYAn agency of the Health and Safety Executive
© Crown copyright 200029
7. ACKNOWLEDGEMENTS
This work was sponsored by the Field Operations Directorate of HSE. I am particu-
larly grateful to Mr N Summers (AWS), Mr N Black (MRSG) and Dr H Wolfson
(NWSG) for their input during the planning, operational and reporting stages of this
project.
I am also grateful to my FSSU colleagues who were responsible for undertaking the
visits to the nominated sites and collecting air samples and related information,
namely: Mr V Sandys (East Grinstead), Mr D Bagon (Luton), Ms J Helps (Cardiff), Mr
S Cottrell (Birmingham), Mr P Baldwin (Leeds), Mr R Atkinson (Edinburgh) and Ms E
Wallace (Edinburgh).
HEALTH AND SAFETY LABORATORYAn agency of the Health and Safety Executive
© Crown copyright 200030

8. APPENDICES
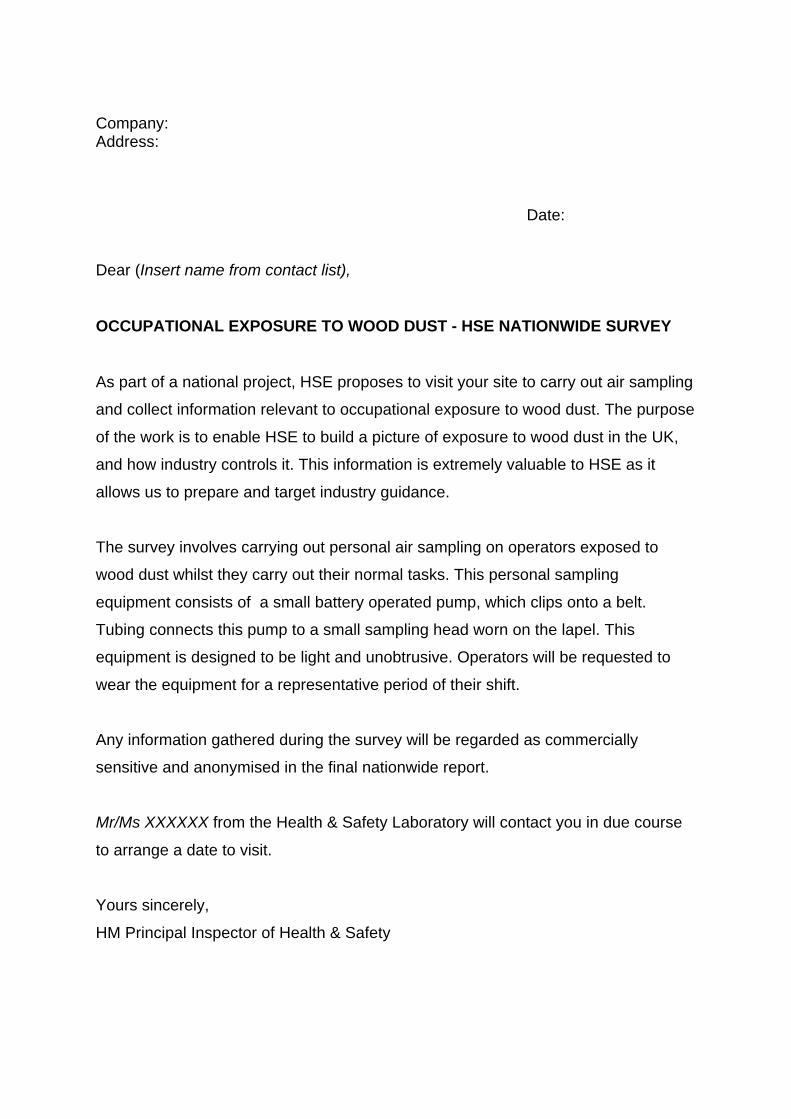
Appendix 1: Letter to occupier giving notice of intention to visit
HEALTH AND SAFETY LABORATORYAn agency of the Health and Safety Executive
© Crown copyright 200031
Company:Address:
Date:
Dear (Insert name from contact list),
OCCUPATIONAL EXPOSURE TO WOOD DUST - HSE NATIONWIDE SURVEY
As part of a national project, HSE proposes to visit your site to carry out air sampling
and collect information relevant to occupational exposure to wood dust. The purpose
of the work is to enable HSE to build a picture of exposure to wood dust in the UK,
and how industry controls it. This information is extremely valuable to HSE as it
allows us to prepare and target industry guidance.
The survey involves carrying out personal air sampling on operators exposed to
wood dust whilst they carry out their normal tasks. This personal sampling
equipment consists of a small battery operated pump, which clips onto a belt.
Tubing connects this pump to a small sampling head worn on the lapel. This
equipment is designed to be light and unobtrusive. Operators will be requested to
wear the equipment for a representative period of their shift.
Any information gathered during the survey will be regarded as commercially
sensitive and anonymised in the final nationwide report.
Mr/Ms XXXXXX from the Health & Safety Laboratory will contact you in due course
to arrange a date to visit.
Yours sincerely,
HM Principal Inspector of Health & Safety

Appendix 2: Survey questionnaire
HEALTH AND SAFETY LABORATORYAn agency of the Health and Safety Executive
© Crown copyright 200032

CONTROL OF EXPOSURE TO WOOD DUST SURVEY 1999/2000
d. Contact name(s)/Position(s)
c. FOD Inspector/location
b. Name of surveyor
a. Date of survey
1. INTRODUCTION
e Shift pattern and length
d. Number of employees exposed to wood dust
c. Number of employees (total)
b. Nature of business
a. Company name and address
2. SITE DETAILS

3. PROCESS DETAILS (Full description of the process including volume and type of material used.
List types of machines used eg circular saw, router)
4. WORK ENVIRONMENT (Details of workroom layout, inc photos, details ofgross wood dust accumulation, cleaning regime, housekeeping)

YES / NO Comment:e Is there a maintenaceschedule specifically forthe return air system ?
d If yes, then describe(individual sock filter, returned air viaducting etc)
YES / NO c Is the systemrecirculating ?
b Does the systemcapture and remove wooddust effectively ? (usejudgement/smoke/dustlamp/anemometer). Use aseparate sheet if there ismore than one system
a Overall description (LEVand/or GEV, one system?,capture-transport-fan-filter-exhaust
5. VENTILATION CONTROLS

YES / NO Comment:e Is there a system formonitoring the quality ofreturned air ? (alarm, divert etc)

e Is any other PPE worn ? (safetyfootwear, safety specs etc)
YES / NO Comment:d.Is the RPE worn correctly?
YES / NO Comment:c.Have the workers been trained inhow to use and maintain RPE ?
b.Respirator manufacturer, type(s)and size (eg 3M 8835 S/M to EN 149)
a.Which employees use RPE ?
6. PERSONAL PROTECTIVE EQUIPMENT

YES / NO Comment:c Is there a policy on eating anddrinking in the vicinity of machines ?
YES / NO Comment:b Is there a dust-free rest and eatingarea ?
YES / NO Comment:a Are the washing facilities adequate ?(clean/soap/hotwater/washbasin/towels etc)
7. WELFARE FACILITIES
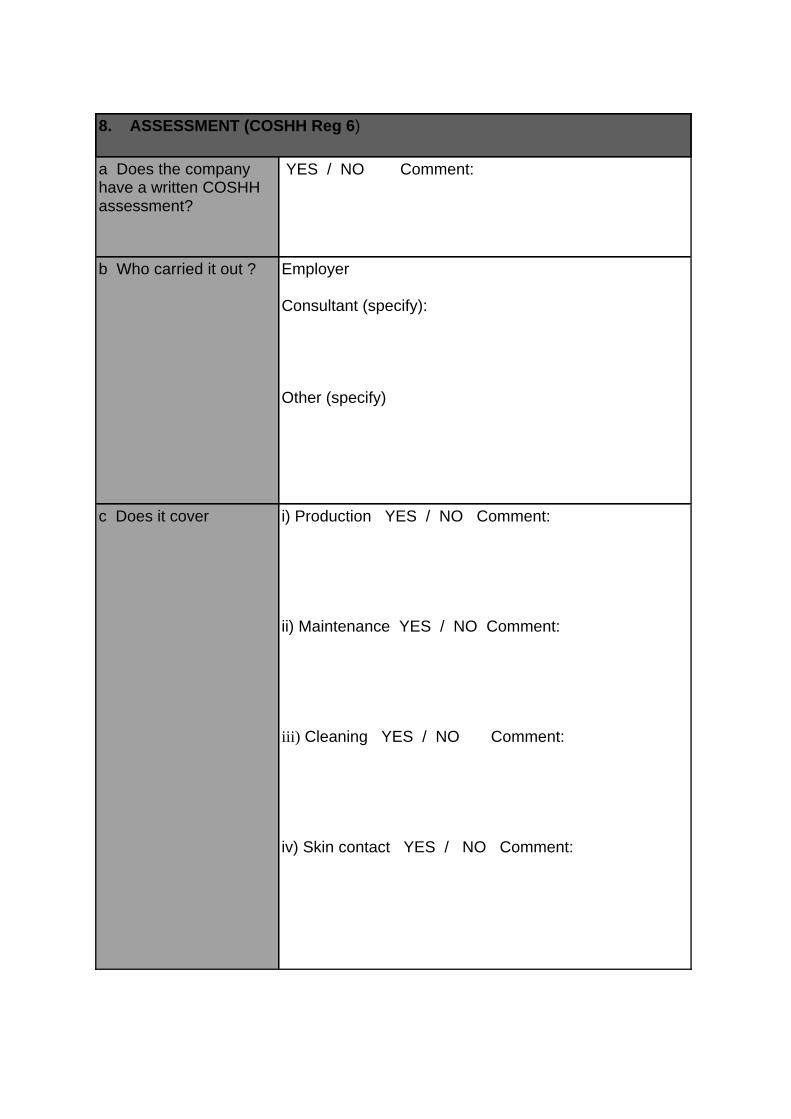
i) Production YES / NO Comment:
ii) Maintenance YES / NO Comment:
iii) Cleaning YES / NO Comment:
iv) Skin contact YES / NO Comment:
c Does it cover
Employer
Consultant (specify):
Other (specify)
b Who carried it out ?
YES / NO Comment:a Does the companyhave a written COSHHassessment?
8. ASSESSMENT (COSHH Reg 6)

What control measures are inplace to reduce exposure towood dust ? (eg PPE, LEV, jobrotation)
9. CONTROL OF EXPOSURE (COSHH Reg 7)
a Are the controls identified in 9a used correctly (eg is PPE worn, are goodhygiene standards practiced/enforced, isLEV used as intended?)
10. USE OF CONTROLS (COSHH Reg 8)

LEV
PPE
f Are maintenance records kept for:
e Is the RPE stored in a clean area ?
d Is the RPE provided examined,and where appropriate tested, atsuitable intervals ?
Weekly check:
14 month MET:
c Who carries out the checks:
b Is a weekly visual check ofengineering controls carried out ?
a Are engineering controls (eg LEV)examined and tested at least every14 months ?
11. MAINTENANCE, EXAMINATION AND TESTING (COSHH Reg 9)

b If so, are records kept?
a Are any health checks carried out onthose exposed to wood dust ? (eg
questionnaire, lung function testing, skin inspection)
12. HEALTH SURVEILLANCE (COSHH Reg 11)
ii)The precautions that should be takento prevent / reduce exposure ?
i)The risks to health as a result ofexposure to wood dust (asthma, dermatitis &
cancer)
Has sufficient information, instruction and training been provided to employees toensure they know:
13 INFORMATION, INSTRUCTION AND TRAINING (COSHH Reg 12)

Any other observations(is the site suitable forvideo-visualisation,confounding factorsetc)
14. OTHER INFORMATION

9. REFERENCES
CHUNG KYK, OGDEN TL and VAUGHAN NP. (1987). Wind effects on personalsamplers. J. Aerosol Sci. 18, 159-174.
HSE (1990). Technical Development Survey Report. Exposure to hardwood dust.HSE Internal Report.
HSE (1996). Softwood dusts: Criteria for an occupational exposure limit. HSE Books
HSE (1999). Medium density fibreboard. Hazard assessment document. EH 75/1.HSE Books
HSE (2000). Methods for the determination of hazardous substances MDHS 14/3.General methods for the sampling and gravimetric analysis of respirable andinhalable dust. HMSO, London.
JONES PA and SMITH LC (1989). Personal exposures to wood dust of woodworkersin the furniture industry in the High Wycombe area: A statistical comparison of 1983and 1976/7 survey results. Ann. Occup. Hyg. 30 (2). 171-184
MARK D and VINCENT JH (1986). A personal sampler for airborne total dust in theworkplace. Ann. Occup. Hyg. 30, 89-102.
HEALTH AND SAFETY LABORATORYAn agency of the Health and Safety Executive
© Crown copyright 200033

![HSL-3 EXPANSION ANCHOR · 2020. 10. 15. · Updated: Oct-20 4 HSL-3-SH / HSL-3-SKa) Shear V Rec HSL-3 / HSL-3-B [kN] 14,3 17,8 17,8 20,1 29,3 34,6 24,5 36,9 50,8 HSL-3-G 14,3 14,9](https://cdn.vdocuments.site/doc/165x107/61188027c3aeb93d607a5cb7/hsl-3-expansion-anchor-2020-10-15-updated-oct-20-4-hsl-3-sh-hsl-3-ska-shear.jpg)


