
How Retail Markets Can Optimize Electricity Distribution
D. P. ChassinPacific Northwest National Laboratory
Overview
Introduction to real-time capacity marketsPurpose, theory, basic examples, issues
Examine Olypen market design/results– Objectives, implementation, results, insights
• Preview AEP NE Columbus RTP-DA rate– Rate design and valuation process

Purpose of Retail Real-Time Pricing
• Discover retail price of energy– Time-varying value of (constrained) supply– Incorporates time-varying value of demand response– Addresses 3 major distribution issues:
Load growth, distributed resource control, demand response

Markets as optimizers
• Auctions solve allocation problem – Computationally efficient (parallelizable)– Equilibrium assignment of buyers and sellers– Interative (either explicit or implicit)
• Linear program discovers price– Maximizes total benefit (primal)– Minimize local costs (dual)
• Price solution is Pareto optimal
See DP Bertsekas , Linear Network Optimization: Algorithms and Codes, MIT Press, 1991

Buyer surplus
Seller surplus
Retail Capacity Market
Power [MW]
Energy price [$/MWh]
Cleared price
Cleared load

Incorporate Day-Ahead Schedule
Day-aheadPrice is low
Real-timeprice is high
RTP customers’actual response
Retail price between DA and RT
Load (MW)
Pric
e ($
/MW
h)
ScheduledLoad
MaximumLoad
UnresponsiveLoad
Cleared price
Some potential issues/FAQs
• Should utility be allowed to own/coordinate distributed resources (analog to generation/transmission conflict)?
• How to ensure costs are not double-embedded?• How is seller surplus from feeder congestion used?• How does utility fairly compensate consumers?• Are there any subsidies built into the rate scheme?• How is misbid/misresponse handled?• What kind of security is really needed?• How is rebound managed?

Rebound peaks occur with load control
0
200
400
600
800
1000
1200
0 2 4 6 8 10 12 14 16 18 20 22 24
Tota
l Hou
rly
Ener
gy C
onsu
mpti
on (
kWh)
Hour of Day
Load Shape for Single-Family (Gas) Homes on 7-18-2006
Fixed_A TOU_A_Group_1Fixed price Time-of-use price

Complex pricing strategies mitigate rebound
0
200
400
600
800
1000
1200
0 2 4 6 8 10 12 14 16 18 20 22 24
Tota
l Hou
rly
Ener
gy C
onsu
mpti
on (k
Wh)
Hour of Day
Load Shape for Single-Family (Gas) Homes on 7-18-2006
TOU_A_Group_1 TOU_A_Group_2 TOU_A_Group_3
TOU_A_Group_4 TOU_A_Group 5 TOU_A_Group 6
Time-of-use group 1Time-of-use group 4
Time-of-use group 2Time-of-use group 5
Time-of-use group 3Time-of-use group 6

At some point a capacity market is easier
0
100
200
300
400
500
600
700
800
900
1000
0 1 2 3 4 5 6 7 8 9 10 11 12 13 14 15 16 17 18 19 20 21 22 23 24
Tota
l Hou
rly En
ergy
Con
sum
ption
(kW
h)
Hour of Day
Load Shapes for Single-Family (Gas) Homes on 7-18-2006
Fixed TOU/CPPReal-time priceFixed price

11
GridWise Testbed ParticipantsBonneville Power Administration IBMPacificorp Whirlpool/Sears KenmorePortland General Electric Clallum County Public Utility DistrictCity of Port Angeles Municipal Utility
Pacific NW GridWise™ Testbed Projects

Virtual Distribution Utility Operation
12
Invensys
JohnsonControls
IBM
$
MW
MarketMarket
Internet broadband communications

Olympic Peninsula RTP Market

Customer participation
$35
ComfortEconomy

15
Economic Cooling Response
k
TmaxTmin
k
Temperature
Pri
ce
Tcurrent
Pbid
Pavg
Pclear
Tset Tdesired
User sets: Tdesired, comfort (based on occupancy calendar)
These imply: Tmax, Tmin, k (price response parameters)
Price is expressed as std. deviation from mean (over a short period, e.g., 24 hrs)

16
Managing Constraints
DG required above feeder limit
Market failed to cap demand for one 5-min. interval in 12 months of operation
Price ($/MWh)
Load (kW)
Hour
17
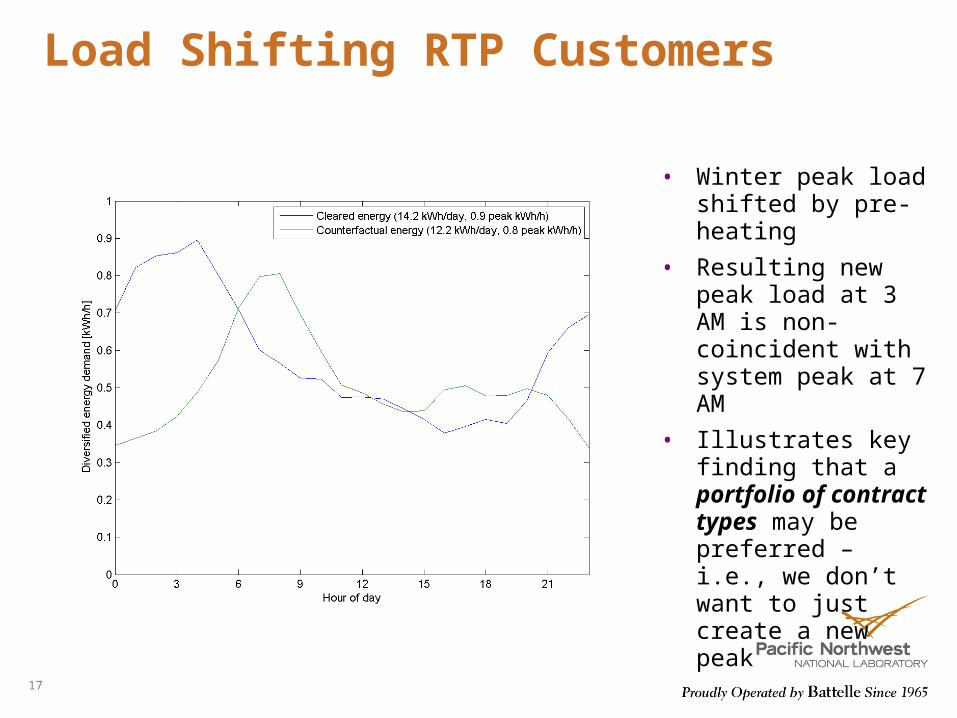
Load Shifting RTP Customers
• Winter peak load shifted by pre-heating
• Resulting new peak load at 3 AM is non-coincident with system peak at 7 AM
• Illustrates key finding that a portfolio of contract types may be preferred – i.e., we don’t want to just create a new peak

Mixing rates also manages uncertainty
18
It is impossible to choose a portfolioin this white region because no combinationof contracts can yield such risk/return

Peak energy uncertainty
19

Gross margin volatility
20

21
Response Manages New Resources
normal fluctuations in loadDemand management to a capacity cap with real-time prices eliminated load fluctuations for 12 hours!
Regulation: one or more fast-responding power plants continually throttle to match normal fluctuations in load
• Highest cost generation in markets (zero net energy sales, wear & tear, fuel consumption)
• Intermittency of wind output can exceed regulation capability and reduces cost effectiveness of wind
Hour
Load (kW)

AEP NE Columbus Project
• Many tariffs are planned• Fixed Rate (standard)• Interruptible Tariff (direct load control)• 2-Tier Time of Use (2-TOU)• 3-Tier Time of Use (3-TOU)
• Real Time Price Double Auction (RTPDA)
• Each tariff enable a difference kind of response
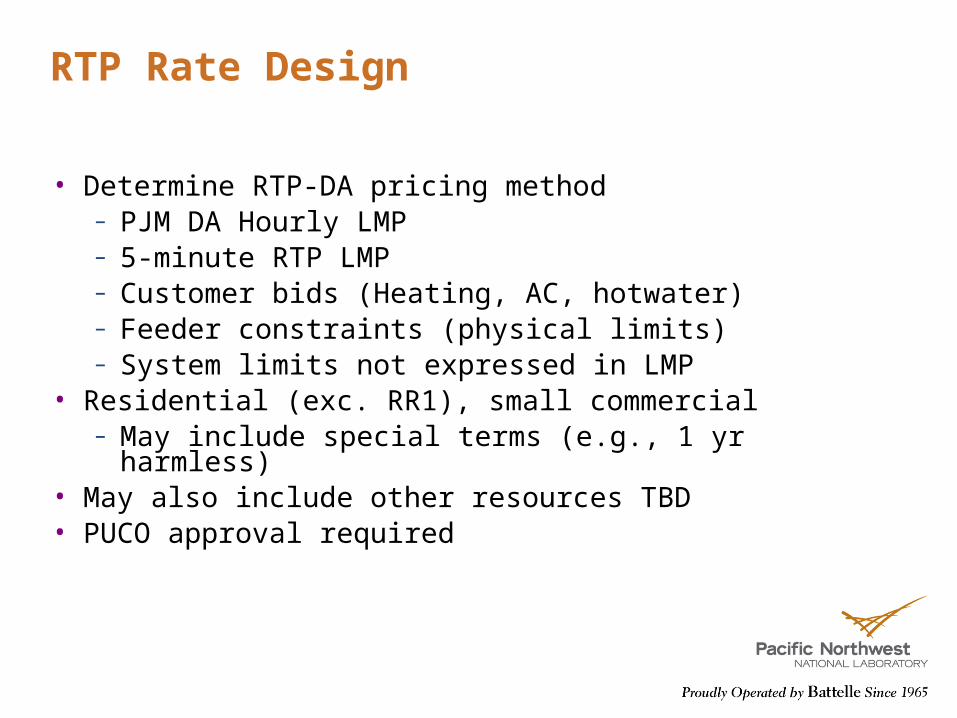
RTP Rate Design
• Determine RTP-DA pricing method– PJM DA Hourly LMP– 5-minute RTP LMP– Customer bids (Heating, AC, hotwater)– Feeder constraints (physical limits)– System limits not expressed in LMP
• Residential (exc. RR1), small commercial– May include special terms (e.g., 1 yr harmless)
• May also include other resources TBD• PUCO approval required

System requirements
• Advanced Metering Infrastructure (AMI)• Home Energy Manager (HEM)• Advanced equipment controls
– Heating systems (electric only)– Air-conditioning system– Hotwater heaters (electric only)
• Resource control (e.g., CES strategies)• Smart Grid Dispatch engine
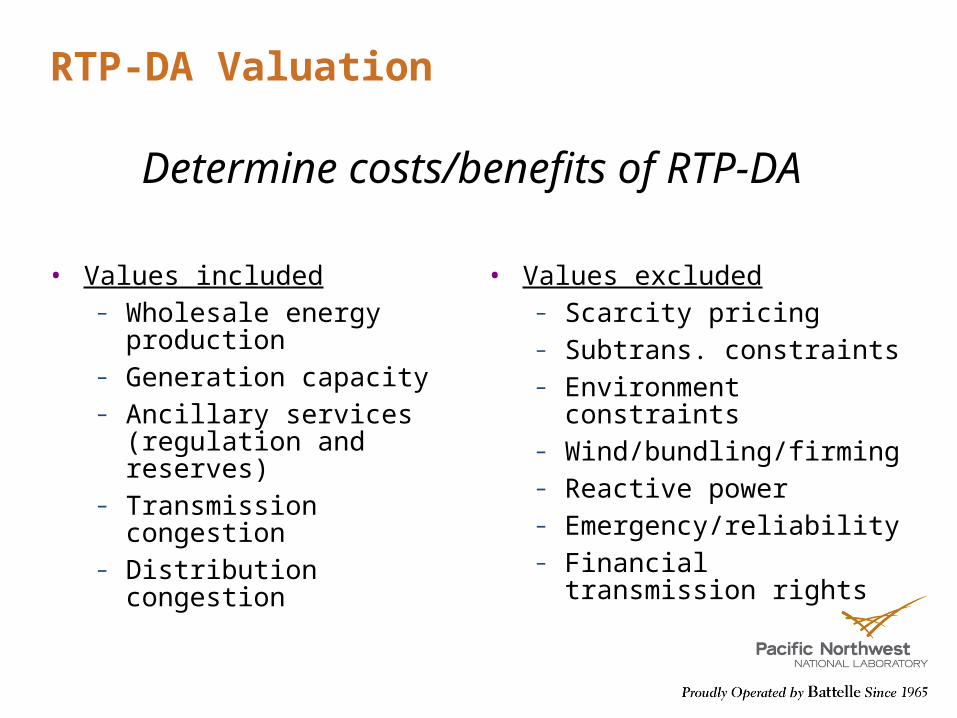
RTP-DA Valuation
• Values included– Wholesale energy
production– Generation capacity– Ancillary services (regulation
and reserves)– Transmission congestion– Distribution congestion
• Values excluded– Scarcity pricing– Subtrans. constraints– Environment constraints– Wind/bundling/firming– Reactive power– Emergency/reliability– Financial transmission rights
Determine costs/benefits of RTP-DA

How Does RTPDA work?
MDM
MACSS MAINFRAME
CustomerAEP.COM
AEP OHIO BATTELLE RTP PROJ ECT
ccs
CALCULATIONWATCHDOG
ENGINE
Send Register Reads
2/23/2010
BATTELLEApplication
Circuit loads(80) Usage Summarized
Da
ily S
et-
Up
File
Da
ta
Send Bill Trigger Data & Retrieve Summary Level
Changes
Data Store
Interval Usage
Interval Rate
Interval Amount* =
Interval Usage
Interval Amount
Cirucuit Loads
Detail View for each
5 minute interval
Summary View Marginal Energy
Cost
Circuit Load View
Appliance Loads
Appliance Load View
DynamicPrices
Repository
Dynamic Prices Repository
Summary Detail
RTP Display Data
Graph
RTP Display Data
AEP - DAS
M
M
PJM LMP
Transm. Node
ApplianceLoad
(14 Nodes)
DISTLMP
D Nodes(80 Nodes)
H
AMIHead-END Interval Data
Demand Input
Home AreaNetwork
Meter
Enterprise Integration (EI)
Deliver AEP Zone LMP’s
Source ServicesEI Broker
Day Ahead
Real Time(Both 5 Min & Hourly)
Daily Settled
Target Services
Day Ahead
5 Min RT
Hourly RT
Settled
GuaranteedDelivery
Real TimeReal TimeRetrieve Real Time
LMP Prices
Retrieve Day Ahead (Projected) LMP Prices
Retrieve Daily (Settled) LMP Prices
OPC Scheduler(Mainframe)
OPC Scheduler(Mainframe)
ftp://ftp.pjm.com/pub/account/lmp InvokeSettled
InvokeDay Ahead
CSP Web Services
Daily Settled
Hourly RT
5 Min RT
Day Ahead
Day Ahead
5 Min RT
Hourly RT
SettledAEP Firewall
Internet
RT
DA
S
FTP Server
DA
eDataFeed (XML API)
eMarket (XML API)
Common SolutionPlatform (CSP)
Integ
Key: DA=Day Ahead, RT=Real Time, S=Settled
Interval Data
Send RTP
Prices

Conclusions
• Retail capacity markets – Energy price of Pareto-optimal allocation
• Olypen project a simple/full example– Demonstrated basic concept– Showed important of enabling technology
• AEP NE Columbus project – Significant scaling up of implementation– Stronger integration into wholesale operations


