
How is Relative Performance Evaluation Incorporated in CEO
Compensation Contracts?*
David De Angelis
Rice University
Yaniv Grinstein
Cornell University and IDC
February 3rd 2014
Abstract
We examine how relative performance evaluation (RPE) is incorporated in CEO compensation
contracts. We find common features across contracts. First, firms tend to base the awards on the
ranking of the CEO relative to peers. Second, the relation between performance and awards is
highly non-linear. And third, the award is based on a performance horizon of around three years.
Once these features are incorporated in a panel regression framework, there is strong evidence of
RPE in CEO compensation of U.S. firms in the last 21 years. With this framework we revisit different
theories for the use of RPE and shed new light on the relevance of RPE in CEO contracts.
* We thank David Aboody, Kerry Back, Andrew Ellul (discussant), Ronen Israel, Ron Kaniel, and Kevin Murphy for helpful discussions, and seminar participants at University of Amsterdam, IDC Herzliya, and the Bar Ilan University Ackerman conference on executive compensation for helpful comments and suggestions. All remaining errors are our own.
2
Relative performance evaluation (RPE) is the practice of evaluating performance of an agent
relative to an observed benchmark, such as the performance of peer firms, the performance of the
industry, or the performance of the market as a whole. According to contracting theory, RPE leads
to more efficient contractual terms because it allows the firm to contract over a more precise
measure of the agent’s performance (e.g. Holmstrom, 1979, 1982).
One of the puzzling characteristics of executive compensation is the apparent lack of use of
RPE in the CEO compensation contract. For example, Gibbons and Murphy (1990) find some
support for the use of RPE in CEO compensation in a sample of large firms in the 1970s and 1980s,
but Aggarwal and Samwick (1999a) find little support for the presence of RPE in CEO compensation
in a sample of large US firms in the 1990s.1
In 2006, the Securities and Exchange Commission (SEC) has issued new disclosure rules on
executive compensation, requiring enhanced disclosure of the contractual terms of CEO pay. Among
the disclosed items are the measures used to assess CEO performance and the extent of reliance on
RPE. Examining the disclosed items, studies such as Gong, Li, and Shin (2011) and De Angelis and
Grinstein (2011) find that the use of RPE is quite prevalent. For example, De Angelis and Grinstein
find that as many as 34% of S&P 500 firms explicitly state that they tie CEO compensation to
relative performance measures.
The stark difference between the evidence regarding the mass use of RPE appearing from
the contractual terms and the lack of evidence appearing from regressing compensation on
industry performance is puzzling, requiring a closer look at how exactly RPE is used in the CEO
compensation contract.2
1 These findings extend to RPE in fund manager compensation. For example, Coles, Suay and Woodbury (2000) and Dass, Massa, and Patgiri (2008) find little support for the use of RPE in contracts of fund advisors. More recently, Albuquerque (2009), Gong, Li, and Shin (2011) and Lewellen (2013) find some support for the use of RPE when using more refined peer group classification. 2 See Albuquerque (2009) for a review of the empirical evidence regarding the use of RPE.
3
In this study we take a closer look at the contractual terms that govern RPE. Our first goal is
to better understand the functional relation between CEO compensation and CEO relative
performance with respect to peers and to model this relation empirically.
Our data is similar to De Angelis and Grinstein (2011). We gather data on CEO
compensation contracts of S&P500 firms after the rule to examine the prevalence of RPE in such
firms in the year 2007. As documented in De Angelis and Grinstein about 34% of the firms in our
sample state the use of RPE to determine CEO awards. For each firm we read the contractual terms
of the RPE award to determine how exactly firms tie CEO compensation to RPE.
We first examine the peers. We find that firms benchmark CEO performance to that of peers
(about 64% of the cases), to that of industry indexes (24%) or to that of market indexes such as the
S&P500 (21% of the firms). The sum of these occurrences is more than one because a few firms use
more than one measure (8% of the firms).
Second, we find that the way firms benchmark CEO performance to peers is by
compensating the CEO based on the ranking of the CEO compared to the peer group rather than
actual performance of the CEO relative to peers. For example, a CEO will receive a maximum bonus
if his performance is better than 75% of his peers. This feature is in contrast to a bonus paid based
on how well the CEO did relative to the average performance of his peers.
Third, we examine the functional form between the ranking and the pay. We find a common
feature across contracts. Firms tend to place a threshold performance (usually 25 percentile
relative to peers), below which the CEO receives no award. Then, they place a maximum
performance (usually 75 percentile relative to peers) above which the CEO receives maximum
award. CEO award is increasing monotonically for any performance between the threshold
performance and the maximum performance. This pay-performance relation is reminiscent of the
80/120 plan found in managerial annual bonus contracts (Murphy, 1999).

4
Fourth, we find that the ranking itself is based on stock return for the majority of the sample
(70% of the firms that rely on RPE), and that for the majority of the contracts the performance is
measured over a three-year period.
We find that these features of the contract differ substantially from the common framework
used to examine RPE in empirical studies (e.g., Gibbons and Murphy, 1992, Aggarwal and Samwick,
1999, Bertrand and Mullainathan, 2001, Garvey and Milbourn, 2003, Gopalan, Milbourn and Song,
2010). First and foremost, existing empirical specifications that relate CEO compensation to relative
performance are based on the distance between CEO performance and that of peers rather than the
ranking relative to peers. Second, relation between pay and performance is assumed linear in all
empirical specifications. And third, the performance itself is measured over one year rather than
over three years.
It is also interesting to note that ranked-based performance evaluation found in practice
does not arise naturally in theoretical modeling of RPE.3 From a theoretical perspective, ranking is
considered an inferior way to benchmark performance (Holmstrom, 1982), because it is not
considered a sufficient statistic to efficiently take away unwanted noise from CEO performance.
Hence the presence of ranked-based RPE is somewhat puzzling. We offer several potential
explanations for the presence of ranked-based RPE rather than other form of RPE in our concluding
remarks.
Our second goal is therefore to revisit the main empirical specifications and their
conclusions using, a more precise specification of RPE, which is based on the observed features of
CEO contracts.
We start by illustrating the importance of including these features of the contract in the
empirical specification. To that end we run a simulation where we generate random firm and peer
performance, and we generate CEO compensation that is based on the ranking of CEO performance
3 Murphy (1999) makes a similar point. Using survey data, he finds that RPE tends to be ranked-based in annual bonus plans.

5
relative to peers. We then run a regression over these generated data but with a misspecified
relation between compensation and performance. We assume that, instead, the compensation is
based on the difference between CEO performance and industry performance. We find that this
misspecification has a substantial effect on the results. We find that the misspecified regression fails
to detect RPE in the data even though under the right specification RPE exists. Our results illustrate
that a wrong specification of the RPE could lead to substantially weaker results than the actual
results suggest.
Second, we form a new empirical specification where we include the main features of the
contracts observed in practice: ranked-based performance evaluation relative to peers; three-year
performance; and cap on relative pay in the range 25% and 75% of the ranking. We run this
specification over the entire Execucomp database (21 years of data, around 31,000 observations)
and compare it with the common linear specification used in previous studies. We find several
striking results. First, with the common linear specification we replicate the results in previous
studies that there is no RPE in CEO compensation. However, when we introduce the new
specification, we find that RPE exists and is both economically and statistically significant. Second,
the within-firm R square improves, from 18.6% to 20.5%, a relative increase of about 10%. These
findings suggest that introducing the features found in the contract has a substantial effect on both
the inferences regarding RPE and on the relative fit of the specification with the data.
We find that RPE has a substantial effect on CEO pay. A 1% increase in the CEO ranking
relative to peers leads to about 0.26% increase in CEO compensation. This means that over the
range 25%-75% relative to peers, CEO compensation increases by about 13%. This relation
between ranked performance evaluation and CEO compensation is robust and stable over time. We
find it in the earlier period of the sample (1993-1998), in the middle period of the sample (1999-
2005) and in the later period of the sample (2006-2012).

6
The new specification also allows us to disentangle the effect of industry performance on
CEO compensation. A common feature of CEO compensation is the tendency to benchmark CEO pay
to the pay of peers in the same industry (Faulkender and Yang, 2010). When the pay of peers goes
up, CEO compensation goes up as well. To the extent that industry performance is correlated with
average CEO compensation in the industry, introducing industry performance as an explanatory
variable has two opposing effects. On the one hand, higher industry performance means that
average CEO compensation increases and therefore CEO compensation should also increase (Oyer,
2004). On the other hand, higher industry performance means, ceteris paribus, that CEO
performance relative to the industry decreases, which could lead to a reduction in CEO
compensation if CEO compensation is tied to RPE. These conflicting effects of industry performance
on CEO compensation could be one of the reasons why prior literature found little effect of industry
performance on CEO compensation.
We find that, once we introduce both the ranking of the CEO relative to the industry and
industry performance in the regression, both have a significant and positive effect on CEO
compensation. This means that the CEO is compensated both for her performance relative to the
industry and for the fact that the industry overall does better. More interestingly, perhaps, is the
fact that once industry performance and ranked-based performance are introduced, firm-specific
performance has a very little effect on CEO compensation, especially in recent years.
Finally, we revisit existing explanations for introducing RPE using our new specification.
Studies like Aggarwal and Samwick (1999), Bertrand and Mullainathan (2001), Garvey and
Milbourn (2003), Gopalan, Milbourn and Song (2010) and Cremers and Grinstein (2013), all
introduce explanations for the lack of RPE. We find that, in general, explanations related to
monitoring and CEO talent specificity have support in the data, whereas other explanations have
little support.

7
Our study continues as follows. In Section I we discuss the contractual terms governing RPE.
In Section II we introduce the data and variables. Section III has the empirical analysis and Section
IV concludes.
I. RPE in CEO Compensation Contracts
In December 2006, the SEC issued new disclosure requirements concerning CEO
compensation. The purpose of these requirements was “… to provide investors with a clearer and
more complete picture of compensation to principal executive officers” (see Background and
Overview Section in the SEC Release Nos. 33-8732A). Unless firms can show that revealing this
information would result in competitive harm, they are required to disclose the performance
measures employed in compensating the CEO as well as target goals. Thanks to this new
information, we can identify how firms employ RPE in the compensation contract and the fraction
of CEO awards tied to RPE rather than to absolute performance. We provide an illustration of our
data collection methodology and examples of the use of RPE in the appendix. More detailed
explanations about the 2006 disclosure rules and the data collection methodology can be found in a
companion paper (De Angelis and Grinstein, 2012).4
Our sample consists of 494 firms that belonged to the Standard and Poor’s (S&P) 500 index
as of December 2007.5 We collect information about the RPE terms in CEO compensation from
firms’ proxy statements in fiscal year 2007. We use the Compustat definition of fiscal year 2007,
which means that firms are included in our sample if their fiscal year ends between ends between
06/01/2007 and 05/31/2008.
Firms in the sample can grant both performance-based and non-performance-based
awards. Performance-based awards vest conditional on achieving a pre-specified performance goal
4 Notably, in a companion paper, De Angelis and Grinstein (2011) show that before the disclosure rules, for most firms this information was either not available or vague. 5 There are six firms that belonged to the S&P500 for which we are not able to retrieve proxy statements.

8
while non-performance-based awards are granted to the CEO at the discretion of the board. For the
performance-based awards, firms disclose the amount that is likely to be paid in the future
(referred to as “target payment”). This value is the amount expensed by the company (i.e. the target
value for non-equity awards and the fair value for the equity awards—see the appendix for more
details). In our sample, 90% of the firms granted some type of performance-based award in 2007.
The average value of the awards is 4.8 million dollars.
[Insert Table I here]
We summarize the findings regarding the use of RPE in Table I. Panel A shows that 34% of
the firms in the sample that grant performance-based awards state explicitly that they tie CEO
compensation to firm performance relative to industry or market performance (i.e. RPE).6 On
average, RPE users tie 49% of the value of performance-based award to RPE. Among RPE users,
there are large variations in the use of RPE across firms: the standard deviation of RPE weight is
24% and the range of RPE weight is 90% (minimum is 10%, and maximum is 100%).
We are particularly concerned about whether the contractual terms are actually held once
the performance is realized. We therefore examine the actual compensation that the CEO receives
in the years 2008-2009 for a subsample of the firms to ensure that the CEO receives compensation
according to the RPE terms. We find complete compliance with the terms of the contract.
We note that while all firms that declare use of RPE indeed give compensation based on
RPE, there could be other firms that give RPE but do not disclose it in the contract. For example,
firms can tie a discretionary part of the compensation to relative performance evaluation or the
CEO can hedge part of his compensation exposure to effectively get a RPE (Garvey and Milbourn,
2003).7 We do not capture these aspects in the contract. However, our empirical analysis later on
6 As a comparison, in the UK, Carter et al. (2009) find in their sample that 51% of the firms are RPE users. On the other hand, in the US, Gong et al. (2011) find that 25% of their sample firms are RPE users. 7 The board of directors could also consider peer performance in the CEO replacement decision. Jenter and Kanaan (2010) show that CEOs are fired after bad firm performance related to factors beyond their control.

9
will consider the relation between the entire compensation and relative performance, including all
aspects of the compensation.
A. Performance measure
In general, firms can tie different measure of firm performance to that of peers.8 Panel C
shows that the most common performance measure used in RPE is market based. e.g. stock price
performance compared to index returns, or stock price performance compared to that of a peer
group. We observe that 75% of the RPE users associate RPE with market-based measures whereas
only 36% associate it to accounting-based measures. (These numbers do not add up to one because
some firms employ both market-based and accounting-based performance measures.) This finding
is consistent with Carter et al. (2009) and Gong et al. (2011) who find that most RPE users employ
total shareholder returns (TSR) as their measure of performance.
Panel C of Table I shows that among the accounting-based measures, 20% of RPE users tend
to use accounting return measures such as return on equity relative to peers. They tie on average
12% of the value of the award to that measure (Figure 1). A total of 17% of the RPE users use
income growth measures compared to peers, and they tie on average 11% of the award to that
measure. Sales growth measures compared to peers is the third most popular among accounting
measures. A total of 9% of RPE users employ this measure and they tie about 5% of the value of the
award to that measure.
In other words, their findings suggest that, on average, firms do not filter out peer performance when considering CEO retention decisions. 8 Most firms disclose the weights assigned to each performance measure. When these weights are not disclosed, we assume that the payoff is divided equally among each performance measure. We use this assumption since most firms that disclose their weights, indeed, use equal weights. Of the firms in our sample, 106 do not disclose their weights for performance-based cash compensation, and 30 do not disclose their weights for performance-based stock compensation (see De Angelis and Grinstein, 2011, for more details).

10
B. Performance horizon
Panel D of Table I describes the performance horizon associated with RPE. Firms provide in
the proxy statement the performance horizon by which they examine CEO performance against that
of peers. We find that on average the performance horizon associated to RPE is 2.6 years, and 67%
of the RPE users associate RPE to a performance horizon of 3 years or more.
C. Use of RPE across industries
Panel E of Table I examines the use of RPE across sectors. We observe large variation in the
use of RPE across industry sectors. It is therefore possible that firms in different sectors use RPE to
align with sector norms. Interestingly, firms that are more likely to have lower uncertainty
regarding the effect of common shocks on performance, such as energy companies and utility
companies, tend to tie a larger fraction of the award to RPE. This result stands in sharp contrast that
of Bertrand and Mullainathan (2001), who find that energy companies tend to be paid for corporate
luck rather than for relative performance. One possible reason for the differences in the contracts is
the different time periods. The stronger scrutiny over compensation practices in the last decade
could have contributed to the changes in these contracts.
We also report two measures of the dispersion of the use of RPE within a sector: standard
deviation and range of the RPE weight across firms within the same sector. We find that both
measures of dispersion in the RPE weight are large for almost all sectors, which suggest that even
within a particular sector there is large heterogeneity in the way firms rely on RPE to compensate
their CEO.
D. Types of peers
In Panel F we report the types of benchmarks used in RPE. Firms can benchmark
performance to a market index (e.g. S&P500), an industry index (e.g. Dow Jones US

11
Pharmaceuticals, or S&P1500 Aerospace & Defense), or to a “home-made” peer group. 9 While most
firms construct their own peer group (64% of the sample firms), we also find that many firms use
indexes (23% of the sample firms use a market index and 22% an industry index).10
E. Rank-based RPE vs. Distance-based RPE
Firms in our sample measure the performance of the CEO compared to peers in two main
ways. One way is measuring the performance relative to the average performance of the peers. The
larger the distance between the CEO performance and that of the peers the higher the
compensation. About 12% of the firms that use RPE measure relative performance with this
methodology. The other way is measuring the performance through the rank of the performance
relative to the peers. With that methodology, the closer the CEO to the top of distribution across
peers the higher the compensation. The vast majority of the RPE (88% of the sample) is based on
the rank of the performance.
F. Functional relation between RPE and compensation
We find that across all firms the functional relation between RPE and compensation is about
the same. Across all contracts, the CEO receives no performance compensation if she does not
achieve a threshold performance relative to peers. Then, once the threshold is achieved, the CEO
receives a minimum amount. This amount increases monotonically as CEO performance relative to
peers increases. Finally, at some performance there is a cap, above which CEO compensation is not
going to increase if the maximum performance is met. Firms also report target performance, which
is somewhere in between minimum performance threshold and maximum performance cap. The
target performance is the expected performance of the CEO.
9 Many firms use two different “home-made” peer-groups, one for the level of compensation, and one to benchmark performance. We study the latter one. 10 These proportions do not add up to 100% because some firms attach multiple types of benchmarks to the use of RPE.

12
Since most contracts are based on the rank of the CEO relative to peers, the minimum
performance threshold, the target performance and the maximum performance cap are given in the
form of a rank. For example, a CEO can start receiving awards if her performance is higher than the
performance of 10% of the peers, and her awards will increase if her performance ranking is
higher, until reaching the performance that is at the top 90% of all her peers. A higher performance
will not provide the CEO with more compensation.
[Insert Figure 1 here]
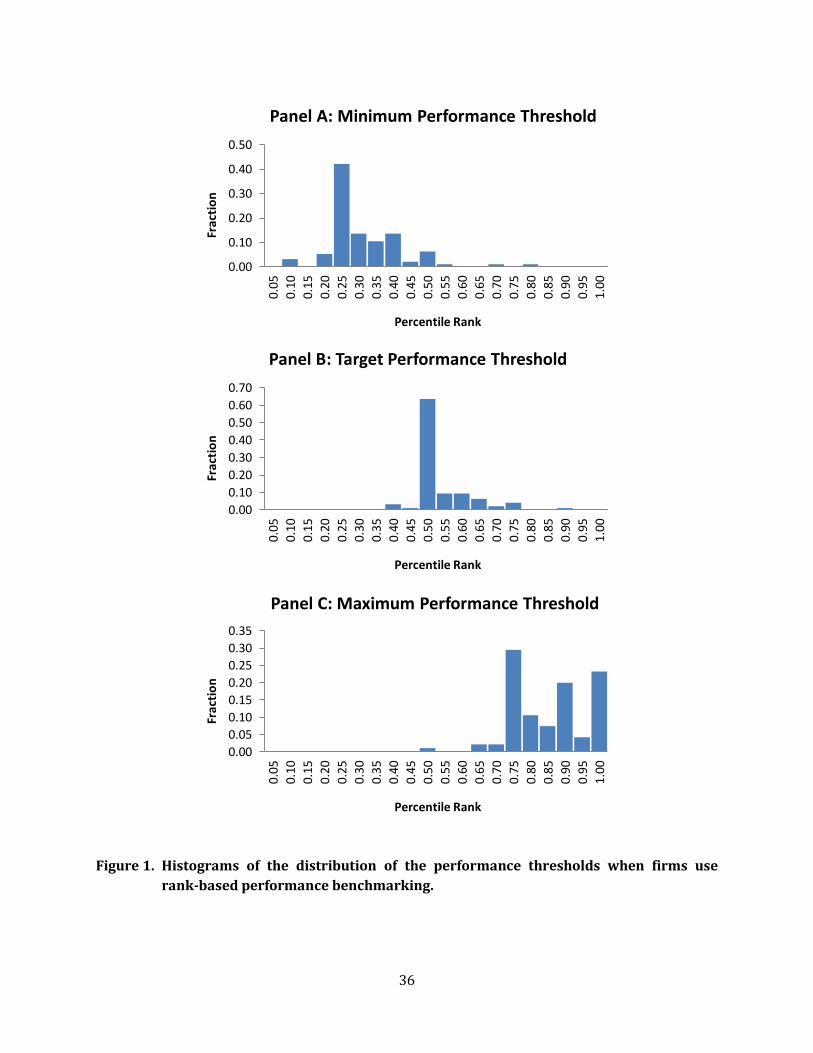
Figure 1 shows the distribution of the minimum, target, and maximum performance
thresholds across the ranked-based contracts in our sample. The table shows that most firms set
the minimum performance threshold at 25% (about 40% of the firms with ranked-based RPE
contracts). This means that if the CEO performance is better than that of 25% of the peers, the CEO
will start receiving an award. The table also shows that some firms put the performance threshold
at higher levels. The table also shows that most firms set the target performance at 50% (about
60% of the firms). The maximum performance cap is more dispersed. About 30% of the firm puts it
at the 75%, another 20% put it at 90% and another 25% put it at 100%.
G. Discussion
There are common threads across the contractual terms that govern RPE in CEO
compensation. First, firms benchmark CEO performance to peers by compensating the CEO based
on the ranking of the CEO compared to the peer group rather than actual performance of the CEO
relative to peers. Second, the pay-performance relation is non-linear: firms tend to place a
threshold performance (usually 25 percentile relative to peers), below which the CEO receive no
award. Then, they place a maximum performance threshold (usually 75 percentile relative to peers)
above which the CEO receives maximum award. CEO award is increasing monotonically for any
performance between the threshold performance and the maximum performance. Third, ranking

13
itself is based on stock return for the majority of the sample and that for the majority of the
contracts the performance is measured over a three-year period.
These contractual terms are interesting because they differ quite substantially from the
specification used in past empirical studies for RPE. Over the years, studies that examined whether
CEO compensation is based on RPE have assumed across the board a linear (or log-linear) relation
between relative CEO performance and CEO compensation. Moreover, these studies often assumed
one-year performance horizon as the explanatory variable, and they implicitly assumed that the
compensation is based on the distance between CEO performance and industry performance rather
than on the ranking of CEO performance.
Is there a potential misspecification in previous studies? And if so, is the misspecification
severe? These questions are important but are also hard to answer, mostly because we have very
limited access to the contractual terms of CEO compensation contracts until recently, and we
cannot tell whether contracts in previous years were based on RPE, whether they were linear or
whether they relied on one-year performance or on distance. Nevertheless, we can shed some light
on these questions by asking related questions. First, if we changed the empirical specification for
the use of RPE over the years based on the observed contractual terms, would we change any of the
conclusions in previous studies regarding the use of RPE? Second, would our new specification
explain a larger portion of the cross sectional variation in CEO compensation than the original
specification?
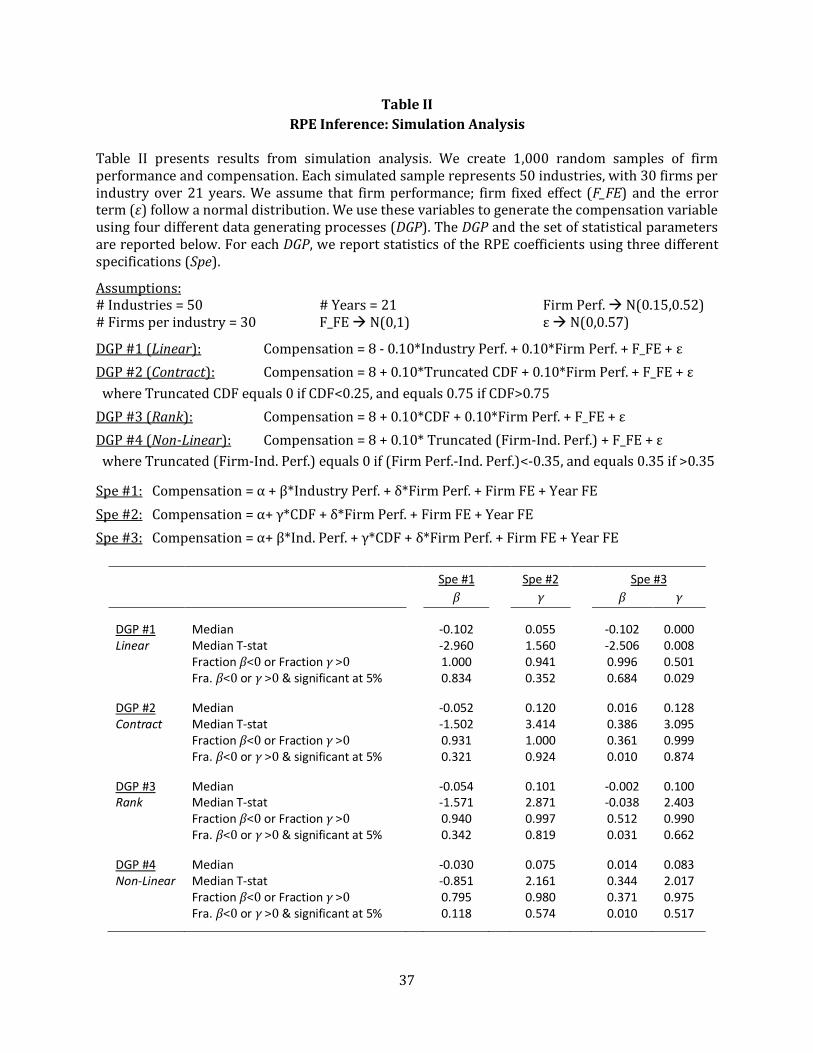
This is the aim of our study. But before examining these questions, we form the following
exercise. We run a simulation where we create 1,000 random samples of firm performance and
compensation and study how different empirical specifications capture the extent of RPE when the
model is not correctly specified. We calibrate the statistical parameters of our simulation in order
to approach the statistical characteristics of our sample. Each simulated sample represents 50
industries, with 30 firms per industry over 21 years. Hence each simulated sample consists of

14
31,500 firm-year observations, which is size-wise similar to the sample we study in the next
section. Consistent with the stock-return summary statistics of our sample (see Table III), we
assume that firm performance follows a normal distribution with a mean of 15% and a standard
deviation of 52%. We generate four different compensation variables via data generating processes
that relate compensation to firm performance and that capture diverse ways to incorporate RPE in
the compensation contract. The first data generating process (DGP #1) assumes the presence of
strong-form distance-based RPE. The functional form in DGP #2 aims to capture the non-linearity
and ranking features of the observed contractual terms: RPE is based on the cumulative
distribution function (CDF) of firm performance relative to industry performance and exhibits a
performance threshold corresponding to the 25th percentile of the performance distribution and a
performance cap at the 75th percentile. In DGP #3, RPE is strictly based on the relative ranking,
while in DGP #4 RPE is distance-based but in a non-linear fashion by imposing a performance
threshold and a performance cap (given our statistical parameters, we use -0.35% and +0.35%,
which approximately equal to the 25th and 75th percentile of the relative performance distribution).
In all the DGPs, we assume an error term that follows a normal distribution with a mean of 0% and
a standard deviation of 57%, which is similar to the distribution of the residual obtained in our
main specifications in the next section. We also assume a firm fixed effect that follows a standard
normal distribution.
We then test for RPE using different regression specifications: the first specification
assumes that RPE is based on the distance between CEO performance and industry performance
(Spe #1) and is reminiscent of the original specification employed in Gibbons and Murphy (1990),
the second specification assumes that RPE is based on the relative ranking (Spe #2), and the third
specification allows a combination of both types of RPE (Spe #3). Table II summarizes our
methodology and presents the results of our simulation.
[Insert Table II here]
15
We report the median RPE coefficient and the median RPE coefficient T-statistics for each
specification data-generating process combination. We also report the fraction of RPE coefficients
(out of the 1,000 estimated RPE coefficients) exhibiting a sign consistent with the presence of RPE
(as well as the ones exhibiting a sign consistent with the presence of RPE and being significant at
5% using a two-tailed t-test). When RPE is linear and distance-based (DGP #1), the traditional
specification (Spe #1) detects the presence of RPE in 83% of the simulated samples, whereas the
ranking-based specification only detects it in 35%. On the other hand, when RPE is similar to the
observed contractual terms (DGP #2), the median coefficient of industry performance is
insignificant in Spe #1, suggesting that there is no RPE (in only 32% of the simulated samples, Spe
#1 detects RPE). In contrast, when using ranking-based specification (Spe #2), the median CDF
coefficient is statistically significant, which indicates the presence of RPE. In addition, in 92% of the
simulated samples, Spe #2 detects RPE. In DGP #2, when we include both the CDF and the industry
performance (Spe #3), the industry performance coefficient is insignificant in most of the simulated
samples while the CDF coefficient is significant in most of them. We reach similar conclusions when
we assume separately that the RPE is rank-based (DGP #4) or non-linear (DGP #4). Thus, this small
illustration suggests that misspecification problems can be important and that both the ranking and
the non-linearity feature of the compensation contract can significantly affect RPE inferences.
II. Methodology
A. Database Construction
We retrieve the entire Execucomp database between 1992-2012. The Execucomp database
contains compensation information for top executives in firms that belong to S&P 500, MidCap 400,
and SmallCap 600 indexes. The database includes also firms that used to belong to these indexes
but do not belong to them anymore. We include in the sample compensation of the Chief Executive
Officer. Our sample consists of roughly 33,000 firm-year CEO compensation observations. We use

16
the variables TDC1 from Execucomp as our main measure of the annual compensation that the CEO
receives in a given year. The variable TDC1 includes the salary, bonuses, value of stock awards,
Black-Scholes value of option awards, as well as other awards given to the CEO in a given year. We
follow the literature and use the natural log of the compensation as our dependent variable. For
performance measures we use the three-year total shareholder return (TSR), the one-year TSR, the
return on assets (ROA), which is the annual net income of the firm divided by the total assets.11 We
include the natural log of total assets to control for size and the natural log of CEO tenure to
measure the tenure of the CEO. Assets and compensation variables are expressed in 2012 dollars.
Table III shows summary statistics of firms in our sample. The median log compensation is
8.053, which corresponds to total compensation of $3.1 million. The 25 percentile of the
distribution of the log compensation corresponds to $1.5 million and the 75 percentile corresponds
to $6.5 million. The median annual TSR for a firm is 9% and the median three-year TSR is 27%. The
log size of the median firm is 7.767 which corresponds to $2.4 billion.
B. Empirical Specification
We employ two main specifications to determine RPE in CEO compensation. The first
specification follows the literature (e.g., Gibbons and Murphy, 1990):
Log(TDC1ijt)= Log(ATit) + TSRit + Industry_Returnjt + Log(CEO tenureit) + ROAit + ηi + ϑt + εit (1)
where firm is indexed by i, industry is indexed by j, and time is indexed by t. Industry is defined at
the 2-digit SIC code. Industry_Returnjt is the equal-weighted average TSR return of Execucomp firms
that belong to the same industry.12 We also include firm fixed effects, ηi, and year fixed effects, ϑt, to
control for unobserved heterogeneity across firms and over the years.
11 TSR is defined as the stock return over the fiscal year assuming that the dividend payments are reinvested. 12 Because the Execucomp universe includes larger firms and thus is likely to be more representative of the actual peer groups, we use the Execucomp universe to compute industry returns and ranking. However, our

17
Using this specification, the literature tests whether, on average, firm use RPE. Holding CEO
performance constant, a negative coefficient of the industry return would suggest that CEO
compensation increases the lower industry performance.
The second specification follows the observed contractual terms:
Log(TDC1ijt)= Log(ATit) + TSR_3Yearit + CDFijt + Log(CEO tenureit) + ROAit + ηi + ϑt + εit (2)
In specification (2) we replace the industry performance with the cumulative distribution
function (CDF) of the three-year TSR relative to the three-year TSR of firms that belong to the same
2-digit SIC code. We also examine several variants of this specification where we cap the
distribution at the 75% percentile and at the 25% percentile. (i.e., if the CDF is lower than 0.25 then
we replace the CDF with 0 and if the CDF is higher than 0.75 we replace the CDF with 0.75).
III. Empirical Results
A. RPE in CEO Compensation – Comparison of specifications
Table IV column 4 shows the results of regression 1, the basic regression analysis as being
used in the prior literature. The results are consistent with the findings in the literature.
Compensation is positively related to firm’s stock return and to firm accounting return. However,
the coefficient of the industry return is not statistically significant from zero. These results imply
that, under the prevailing specification, we reject the hypothesis that CEO compensation is tied to
RPE.
[Insert Table IV here]
When we run specification 1 using three-year return instead of one-year return as the
explanatory variable, the conclusion is the same. The coefficients of the three-year stock return and
the three- year accounting return are both positive and significant, but the coefficient of the three-
main results are similar if we use the Compustat universe (instead of the Execucomp one) to compute Industry TSR and the CDF.
18
year industry return is not negative significant. In fact, the coefficient is positive and significant, in
contrast to the RPE hypothesis.
Column 2 shows the regression result of specification 2. Like before, the coefficients of the
three-year TSR and the ROA are positive and significant. However, here the CDF (rank of the CEO
performance relative to the industry) is strongly significant and in a direction consistent with the
use of RPE. The coefficient suggests also economic significance. A 1% increase in the rank of the
CEO performance compared to the industry is associated with 0.26% increase in log compensation,
(or roughly 0.26% in total compensation). This means that a movement from the 25% of the
distribution to the 75% of the distribution (a 50% increase) is associated with about 50%x0.26 =
13% in compensation.
It is interesting to contrast the sensitivity of compensation to relative performance with the
sensitivity of compensation to absolute performance. The coefficient of the three-year TSR is 0.048.
A movement from 25% to 75% of three-year return (Table IV) is associated with 98% return. This
means that a movement from the 25% to the 75% is associated with 0.048x98% = 5% increase in
compensation. This means that the ranked performance is at least as important as firm
performance in the determination of the awards and the bonuses.
It is also interesting to compare the R-square of the regression in column 4 to that of the
specification in column 2. The within-firm R-square of the regression in column 4 is 0.186, while the
R-square of the regression in column 2 is 0.205. This means that the regression in column 2
explains better the variation in CEO compensation than that of column 4. The increase in
explanatory power is 0.293/0.275 – 1 = 10%.
The new specification also allows us to disentangle the effect of industry performance on
CEO compensation. It is a well-known fact that CEO compensation is benchmarked against that of
the industry (Faulkender and Yang, 2010). It is therefore possible that CEOs receive higher
compensation when the industry does better, regardless of how they do relative to the industry.

19
Column 3 in Table IV shows the compensation of the CEO once we include also the industry return.
The column shows that the CEO receives higher compensation when the industry does better. More
interesting is the fact that the coefficient of the CDF variable increases by 33% from 0.262 to 0.348,
which is consistent with the results from our simulation exercise in which we find that the CDF
coefficient increases when we add the industry performance variable in the regression (see DGP #2,
in Table II). In addition, the coefficient of the 3-year firm-level return decreases by 48% from
0.048% to 0.025%. This means that firm-level performance has very little effect on the amount that
the CEO receives, while industry performance as well as the rank of the CEO performance relative
to the industry has a large effect on the level of compensation.
We should note that the lack of sensitivity between firm performance and compensation
does not mean that CEO compensation is not related to pay performance. The reason is that the
awards that the CEO receives are themselves tied to performance. Most importantly, the holdings of
the CEO in unvested options and stock awards as well as the CEO personal holdings of stock provide
additional incentives to the CEO to maximize share value.
Columns 5 and 6 in Table IV show the results when we introduce regression (2) but over a
one-year horizon. Here also the CDF coefficient is positive and significant.
[Insert Table V here]
In Table V we introduce variations of the specifications to examine the robustness of our
results. Column 1 includes a truncated CDF specification where we truncate the CDF at the 25% and
the 75%. In column 2 we introduce a dummy variable for whether the firm is in the first, second,
third, or fourth performance quartile relative to the industry. In column 3 we introduce only the
top and bottom quartile dummy variables. We repeat these specifications for one-year performance
horizon in columns 4-6. The results across all these specifications are similar to those in the original
specifications in Table IV. We also employ median regressions and find similar regressions (see
results in Table VI).

20
[Insert Table VI here]
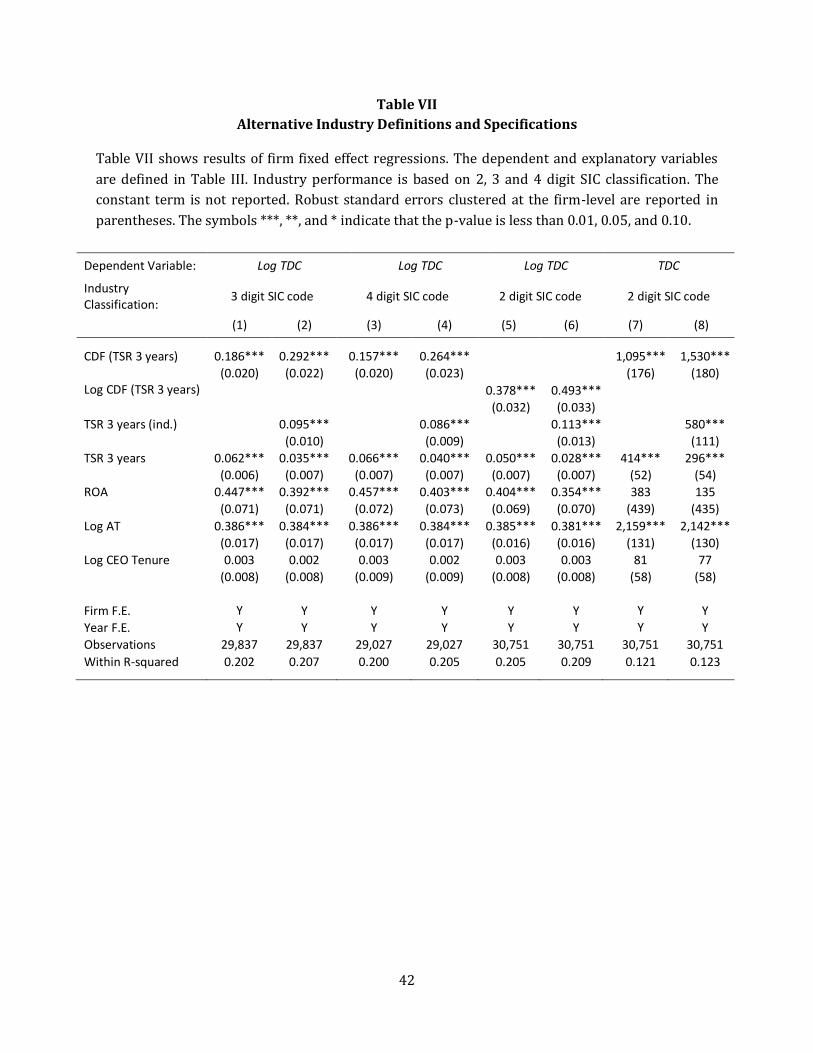
We further alternate the original specification by using alternative industry definitions:
three-digit SIC code and four-digit SIC code industries. We also examine the use of Log (CDF)
instead of CDF and the use of TDC1 as the explanatory variable instead of Log (TDC1). We present
the results in Table VII. All these alternative industry classifications and specifications lead to the
same conclusion: a higher ranking of CEO performance relative to the industry increases CEO
compensation.13
[Insert Table VII here]
Our conclusion from the results so far is that the change in the specification of RPE leads to
significant changes in the inferences regarding the use of RPE in CEO compensation. Moreover, the
change in specification leads to better fit with the data.
C. RPE across Sample Periods
Our results so far are based on a regression specification between 1992-2012. It is possible
that our results are driven by the latter part of the sample. Firms were required to disclose the
contractual terms of their CEO compensation only since 2006, and it is possible that this
requirement led to a change in the terms relative to previous periods.
We therefore repeat our analysis above, but this time we divide our sample into three seven
year periods. The first period is between 1992 and 1998, the second period is between 1999 and
2005 and the third period is between 2006 and 2012. We run regression (2) for each of the periods
and show the results in Table VIII.
[Insert Table VIII here]
The results show that the use of RPE has been stable over time. The coefficient of the CDF is
0.302 in the period 1992-1998, it is 0.237 in the period 1999-2005 and it is 0.235 in the period
13 We also obtain similar results if we use more refined peer group classification and group firms by industry and size as in Albuquerque (2009).
21
2006-2012. The results remain the same once we introduce the three-year industry return. We
conclude that the use of RPE is not a recent-year phenomenon but exist in the sample across all
periods.
As another test of the use of RPE, we interact the CDF coefficient with year dummies and we
plot the point estimates of this coefficient between 1992 and 2012. We show the results in Figure
2.A. The results show that the coefficient is quite stable over time, and ranges between 0.2 and 0.4
for the majority of the years. We also compare the coefficients to those of the 3-year TSR in Figure
2.B.
D. Re-examining existing explanations for the lack of RPE
D1. Lack of RPE and agency conflicts
Bertrand and Mullainathan (2001), provide an argument for the lack of use of RPE, based on
an agency conflict between management and shareholders. They consider a CEO who sets her own
compensation and her primary worry in setting pay is that outrageous skimming may cause
otherwise passive investors to stand up and take notice. Their argument is based on the assumption
that in bad times managers face more scrutiny from the market than in good times. Therefore,
managers will be able to capture more of the firm value in the form of compensation in good times
than in bad times. This suggests a natural correlation between positive luck and performance. The
implication of Bertrand and Mullainathan’s argument is that in firms where shareholder monitoring
is weak, the manager has more power to influence her compensation contract and will therefore
choose less RPE.
We test for Bertrand and Mullainathan’s hypothesis, using the specification we developed
earlier. We follow Bertrand and Mullainathan and define firms with weak shareholder monitoring
as firms with dispersed ownership structure. When firms have dispersed ownership structure,
shareholders face the free rider problem and have little incentives to monitor management

22
(Grossman and Hart, 1980, Shleifer and Vishny, 1986). Our measure of concentrated ownership
structure is a dummy variable which equals 1 if the number of block holders (i.e., holders of more
than 5% of the shares) is larger than the median number of block holders per firm in the sample.
We interact each of the explanatory variables CDF, TSR, TSR3 in regression (2) with the dummy
variable Large Shareholders. We also include this dummy variable on its own. The results appear in
Table IX.
[Insert Table IX here]
The results show that when a firm has more than two block holders (i.e. the median number
of block holders in our sample) the compensation of the CEO is tied more strongly to RPE. The
interaction of the block holder dummy with the CDF is positive and significant. The coefficient of
CDF is 0.203, and the interaction term is 0.082.14 This means that when the firm has more than two
block holders the sensitivity of CEO compensation to relative performance increases by about 40%
(from 0.203 to 0.285). Moreover, the sensitivity of compensation to firm performance decreases by
about 40% (from 0.053 to 0.032). These results suggest that when the firm has strong shareholder
monitors the evaluation of the CEO shifts from absolute performance evaluation to RPE. These
results are in line with those of Bertrand and Mullainathan.15 However, we should also note that
even when the firm does not have large block holders there is still RPE.
D2. Lack of RPE and specificity of CEO talent
Cremers and Grinstein (2013) argue that RPE is less useful if industry performance has little
correlation with firm performance or when uncertainty regarding the level of correlation between
industry performance and firm performance is large. They use the measure of firm-specific CEO
14 If we use median regressions, the coefficient of the interaction term would be larger and significant at 1%. 15 To stay consistent across all our cross-sectional analysis, we use the median number of block holders to classify the strength of the monitoring. If we use the number of block holders (as in Bertrand and Mullainathan, 2001) instead of the dummy Large Shareholders , the coefficient of its interaction with the CDF variable would be positive and significant at 5% in the first specification (i.e. column 1 in Table IX), and would be positive but not significant at the usual level in the second specification (i.e. column 2 in Table IX).

23
talent which is the percentage of new CEOs in a given industry who have been replaced by insider
CEOs (rather than by outsider CEOs). In Table X we test Cremers and Grinstein’s hypothesis, using
the specification we developed earlier. We follow Cremers and Grinstein and define industries with
little correlation between firm performance and industry performance as industries whose
percentage of CEO replacements from outside the industry were above median across all industries.
We call them industries with less firm-specific skills. This measure can be derived from Cremers
and Grinstein (2013) for the 48 industry classification of Fama and French (1997).
[Insert Table X here]
The results in Table X column 1 show that firms in industries with less firm-specific skills
tend to have 45% stronger relation between CEO compensation and RPE than firms in industries
with more firm-specific skills. The coefficient of the interaction term is 0.095 and the coefficient of
the CDF variable itself is 0.213.16 Moreover, firms with less firm-specific skills tend to reduce pay-
performance sensitivity with respect to firm-level return by 47%. The coefficient reduces from
0.064 to 0.034. Column 2 shows the results once we also introduce industry return. The results hold
when introducing this variable.
D3. Lack of RPE and industry concentration
RPE could provide adverse incentives for the manager to start a price war in order to
minimize competitors’ returns. Aggarwal and Samwick (1999b) show that in a Bertrand
competition setting, the higher the level of competition, the lower the use of RPE will be. We
examine this possibility by using a measure of industry concentration, the Herfindahl Index (HHI),
16 If we use median regressions, the coefficient of the interaction term would be larger and significant at 1%. In addition, the coefficient of the interaction term between mean industry performance and the dummy variable would be positive and significant, suggesting that firms also tend to consider more CEO outside opportunities in the same industry when skills are less firm-specific (and thus executive movements across firms are more likely).

24
and classify industries as more concentrated if HHI is above median in 2002. We look separately at
manufacturing and non-manufacturing firms.
[Insert Table XI here]
Results reported in Table XI do not support the industry concentration argument. The
coefficient of the interaction term is non-significant in all specifications. In addition, the sign of the
coefficient is not consistent across manufacturing and non-manufacturing firms.
D4. Lack of RPE and CEO wealth
Another argument for the lack of RPE is proposed by Garvey and Milbourn (2003) who
argue that managers can hedge the risk themselves. Firms should use RPE, only when it is less
costly for them to hedge CEO wealth. It would be less costly for wealthy CEOs to hedge against
market or industry risk, and thus in that case firms are less likely to use RPE. Garvey and Milbourn
also empirically investigate this argument and provide evidence supporting that channel.
[Insert Table XII here]
We explore that argument using three different measures for CEO wealth, respectively CEO
shareholdings, the fraction of CEO shares to shares outstanding and CEO age. We classify CEOs as
more wealthy if the CEO wealth measure is above the median. Results are reported in Table XII. Our
results do not support the hedging constraints argument. The coefficient of the interaction term is
non-significant in 5 out of the 6 different specifications. In column 2 the coefficient is positive and
significant, indicating that firms with more wealthy CEOs tend to rely more on RPE, which is
inconsistent with the prediction.
D5. Lack of RPE and Strategic Flexibility
Finally, in a recent study Gopalan, Milbourn and Song (2010) propose an additional
explanation for the lack of RPE: the need for strategic flexibility. In their model, the strategy chosen
25
by the CEO determines firm’s exposure to sector risk. As a consequence, the presence of RPE would
lead to sub-optimal incentives regarding the strategy selection. One implication of their study is
that firms with more strategic flexibility, such as multisegment firms, would avoid the use RPE. We
revisit their argument using our framework and explore whether multisegment firms use less RPE.
Results are reported in Table XIII.
[Insert Table XIII here]
The results do not support their argument. The coefficient of the interaction term is non-
significant in all specifications. Furthermore, the coefficient is positive, which is inconsistent with
the prediction.
IV. Concluding Remarks
Existing empirical studies find little evidence for the use of RPE in CEO contracts. This result
is puzzling given the recent findings that CEO compensation contracts do include clauses for RPE.
We examine the contractual terms that govern RPE in CEO compensation contracts in 2007. We find
several common features of these contracts: the payment to the CEO is based on the performance
rank of the CEO relative to peers, the performance is measured for the most part over three-year
period, the performance itself is firm stock return and the payment is capped from above and from
below (most often at the 25% and 75%).
We incorporate these features into the regression model and find strong evidence of RPE in
CEO compensation. The evidence is robust across different time periods and is stable over time. We
conclude that lack of evidence of RPE in previous studies was the result of misspecified empirical
models.
Using our new specification, we find support for Bertrand and Mullainathan (2001)
hypothesis that firms which lack monitoring tend to pay the CEO for luck and therefore avoid RPE.
We also find support to Cremers and Grinstein (2013) hypothesis that firms which are less affected

26
by industry shocks tend to use less RPE. On the other hand, our results do not support arguments
related to industry concentration (Aggarwal and Samwick, 1999b), CEO hedging constraints
(Garvey and Milbourn, 2003) and strategic flexibility (Gopalan, Milbourn and Song, 2010).
Our finding that RPE is measured using ranking is somewhat puzzling given the contracting
literature on how to use RPE. The general practice in past studies has been to model RPE as the
relation between CEO compensation and the (linear) distance between firm performance and
industry performance. This practice has followed theoretical models such as Holmstrom and
Milgrom (1987) which show that such statistic is optimal under certain restrictions to the
distribution of outcomes and on the utility function of the agent. Instead, we find that firms are
compensating the CEO based on his performance rank relative to other firms in the industry.
Theoretically, rank-based contracts are inferior to distance-based contracts because they are not
sufficient statistics (Holmstrom, 1982). To illustrate this point suppose that there are only two
firms in the industry. If the CEO of one firm is compensated based on its ranking relative to the
other firm (i.e., whether he is first or second), then the CEO will receive similar compensation
regardless of whether his performance is slightly better or much better than the performance of the
other CEO. The information conveyed by the difference between the performances between the two
CEOs is lost when using rank-based RPE.
We offer several arguments that could potentially explain the use of rank-based RPE. First,
it might be the case that the primary use of firm performance is to reveal CEO’s type as opposed to
induce effort (Oyer, 2004). Under this possibility, rank-based RPE might be more optimal than a
distance-based form since it better captures CEO relative advantage (and market value) compared
to other CEOs. Our cross-sectional results regarding the positive relation between rank-based RPE
and the specificity of CEO talent support that argument. Second, some bounded rationality notions
could explain the use of ranking performance. For instance, to use the RPE offered in the theory,
firms need to know the distributions of firm performance and CEO performance. In reality, these

27
distributions are hard to estimate. By using the ranking, firms can more easily relate CEO output to
other firms’ output without making cumbersome calculations to estimate the distributions.. Still,
our findings regarding the contractual terms governing RPE are puzzling and we think that
examining why firms choose this form of RPE rather than other form of RPE is an interesting
avenue for future research.

28
Appendix: Illustration of our Data Collection Methodology
In this appendix, we illustrate our data collection methodology using the 2008 Proxy
Statement of the company Teco Energy Inc. (TE). We start by looking at the Grants of Plan-Based
Awards Table to identify the performance-based awards granted to CEO Sherrill W. Hudson in fiscal
year 2007.
In 2007, TE granted to CEO Hudson non-equity and equity performance-based awards:
respectively the Annual Incentive Plan (AIP) and the Performance Shares (PS). The amount of AIP
and PS that will be paid to the CEO is conditional on performance; thus, according to the SEC
definition, AIP and PS are performance-based awards. Performance-based awards are tied to pre-
specified performance targets. For these awards, we consider the amount that is likely to be
expensed by the company (i.e. the target value for non-equity awards and the fair value for the
equity awards).

29
We then identify the performance measures used in the performance-based awards and
their respective weights. This information is usually located in the Compensation Discussion and
Analysis Section, but sometimes one can also find it in the footnotes of Grants of Plan-Based Awards
Table or of the Summary Compensation Table.
We copy below one paragraph and a table of the Compensation Discussion and Analysis
Section in which we find information about the procedure to award AIP and the performance
measures used with their respective weights and performance targets. We also copy a paragraph
that is located below the Grants of Plan-Based Awards Table in which we find information about the
procedure to award PS and the performance measures used with their respective weights and
performance targets.

30
Given this information, we can now compute the proportion of performance-based awards
tied to relative performance evaluation (RPE). We identify the weight of RPE in the AIP from the
above table; we need to look at the component weighting for TECO energy officers and thus observe
that 15% of AIP is tied explicitly to RPE. The performance measures associated with RPE in AIP are
earnings per share (EPS) and return on equity (ROE), and the performance horizon is one year.
Concerning PS, all the value is tied to RPE, the performance measure is stock price, and the
performance horizon is three years.
Therefore, we can now compute the proportion of the value of performance awards tied to
RPE (RPE weight):
RPE weight
on Equity Performance based Awards
on Equity Perf. based Awards Equity Perf. based Awards on Equity Performance based Awards
Equity Performance based Awards
on Equity Perf. based Awards Equity Perf. based Awards Equity Performance based Awards
Moreover, we can also compute the weight of the type of performance measure associated
to RPE:

31
Weight of Type of Performance X associated to RPE
on Equity) on Equity Performance based Awards
on Equity on Equity Perf. based Awards Equity Equity Perf. based Awards
Equity Equity Performance based Awards
on Equity on Equity Perf. based Awards Equity Equity Perf. based Awards
We obtain the following weights for accounting-based and market-based performance:
RPE Weight tied to Accounting-based Performance =
RPE Weight tied to Market-based Performance =
Finally, we are also interested in the performance horizon associated to RPE:
Performance Horizon associated to RPE
on Equity on Equity Performance based Awards
on Equity on Equity Perf. based Awards Equity Equity Perf. based Awards on Equity)
Equity Equity Performance based Awards
on Equity on Equity Perf. based Awards Equity Equity Perf. based Awards Equity)
=
32
REFERENCES
Aggarwal, Rajesh K., and Andrew A. Samwick, 1999a, The other side of the trade-off: The impact of risk on executive compensation, Journal of Political Economy 107, 65-105.
Aggarwal, Rajesh K., and Andrew A. Samwick, 1999b, Executive compensation, strategic competition, relative performance evaluation: Theory and evidence, Journal of Finance 54, 1999-2043.
Albuquerque, Ana, 2009, Peer firms in relative performance evaluation, Journal of Accounting & Economics 48, 69-89.
Bertrand, Marianne and Sendhil Mullainathan, 2001, Are CEOS rewarded for luck? The ones without principals are, Quarterly Journal of Economics 116, 901-932.
Carter, Mary Ellen, Christopher D. Ittner, and Sarah L. C. Zechman, 2009, Explicit relative performance evaluation in performance-vested equity grants, Review of Accounting Studies 14, 269-306.
Coles, Jeffrey L., Jose Suay, and Denise Woodbury, 2000, Fund advisor compensation in closed-end funds, Journal of Finance 55, 1385-1414.
Cremers, Martijn and Yaniv Grinstein, 2013, Does the market for CEO talent explain controversial CEO pay practices? Review of Finance, Forthcoming.
Dass, Nishant, Massimo Massa, and Rajdeep Patgiri, 2008, Mutual funds and bubbles: The surprising role of contractual incentives, Review of Financial Studies 21, 51-99.
De Angelis, David, and Yaniv Grinstein, 2011, Relative performance evaluation in CEO compensation: Evidence from the 2006 disclosure rules, Working Paper, Cornell University.
De Angelis, David, and Yaniv Grinstein, 2012, Pay for the right performance, Working Paper, Rice University and Cornell University.
Faulkender, Michael and Jun Yang, 2010, Inside the Black Box: The Role and Composition of Compensation Peer Groups, Journal of Financial Economics 96, 257-270.
Garvey, Gerald, and Todd Milbourn, 2003, Incentive compensation when executives can hedge the market: Evidence of relative performance evaluation in the cross section, Journal of Finance 58, 1557-1581.
Garvey, Gerald, and Todd Milbourn, 2006, Asymmetric benchmarking in compensation: Executives are rewarded for good luck but not penalized for bad, Journal of Financial Economics 82, 197-226.
Gibbons, Robert and Kevin J. Murphy, 1990, Relative performance evaluation for chief executive officers, Industrial and Labor Relations Review 43, 30-51.
Gong, Guojin, Laura Yue Li, and Jae Yong Shin, 2011, Relative performance evaluation and related peer groups in executive compensation contracts, Accounting Review 86, 1007-1044.

33
Gopalan, Radhakrishnan, Todd Milbourn and Fenghua Song, 2010, Strategic flexibility and the optimality of pay for sector performance, Review of Financial Studies 23, 2060-2098.
Holmstrom, Bengt, 1979, Moral hazard and observability, Bell Journal of Economics 10, 74-91.
Holmstrom, Bengt, 1982, Moral Hazard in Teams, Bell Journal of Economics 13, 324-340.
Holmstrom, Bengt, and Paul Milgrom, 1987, Aggregation and linearity in the provision of intertemporal incentives, Econometrica 55, 303-328.
Jenter, Dirk, and Fadi Kanaan, 2010, CEO turnover and relative performance evaluation, Journal of Finance, Forthcoming.
Lewellen, Stefan, 2013, Executive compensation and peer effects, Working Paper, Yale University.
Murphy, Kevin J., 1999, Executive Compensation, in Orley Ashenfelter and David Card (eds.), Handbook of Labor Economics Vol. 3b, Elsevier Science North Holland, Chapter 38, 2485-2563.
Oyer, Paul, 2004, Why do firms use incentives that have no incentive effects? Journal of Finance 59, 1619-1650.
Rajgopal, Shivaram, Terry Shevlin and Valentina Zamora, 2006, CEOs’ outside opportunities and the lack of relative performance evaluation in compensation contracts, Journal of Finance 61, 1813-1844.
Shleifer, Andrei, and Robert W. Vishny, 1986, Large shareholders and corporate control, Journal of Political Economy 94, 461-488.
U.S. Securities and Exchange Commission, 2006, Final rule: Executive Compensation Disclosure (Release Nos. 33-8732A), available online at http://www.sec.gov/rules/final/2006/33-8732a.pdf.
Zwiebel, Jeffrey, 1995, Corporate conservatism and relative compensation, Journal of Political
Economy 103, 1-25.

34
Table I
Examination of the Benchmarking Terms in CEO Compensation Contracts Table I provides information about the use of performance benchmarking in CEO compensation
contracts for a sample of 494 S&P500 members in 2007. In Panel A, we report the proportion of
firms that grant any type of performance-based awards. Then we report the proportion of firms
relying on performance benchmarking among firms that grant performance-based awards. In
italics, we provide basic statistics about the weight assigned to performance benchmarking for
firms that benchmark firm performance. In Panel B, we compare the proportion of firms relying on
ranking-based versus relative (linear) measures when benchmarking performance. In Panel C, we
report the proportions of firms relying on specific performance measures when benchmarking
performance. In Panel D, we provide basic statistics about the performance horizon when
benchmarking performance. In Panel E, we provide basic statistics about the use of performance
benchmarking across sectors. In Panel F, we report the proportions of firms relying on different
types of benchmarks.
Panel A: Performance Benchmarking
% of firms that grant performance-based awards 90% % of benchmark users among firms that grant performance-based awards 34%
Mean weight among users 49%
SD weight among users 24%
Median weight among users 43%
Min weight among users 10%
Max weight among users 100%
Panel B: Ranking-based and Relative (Linear) Measures when Benchmarking Performance
Among benchmark users, % of firms that use
Ranking performance 88% Relative linear performance 14%
Panel C: Performance Measures Associated with Relative Performance Evaluation
Among users of RPE, % of firms that benchmark performance by:
Market measure 75%
Accounting measure 36%
Accounting return measure 20%
Income growth measure 17%
Sales growth measure 9%
Other accounting measures (Margin, Cash flows growth …) 5%

35
Panel D: Performance Horizon Associated with Performance Benchmarking
Performance horizon associated to performance benchmarking (in years):
1 year 2 year 3 year 4 or higher
17% 15% 63%
4% Average
2.57
Panel E: The Use of Performance Benchmarking Across Sectors
Proportion of Weight among users
Industry users Mean SD Range
Non Durable Goods 36% 36% 15% 49% Durable Goods 22% 45% 24% 33% Manufacturing 37% 46% 27% 79% Energy 68% 60% 28% 80% Chemistry 47% 35% 15% 49% Business Equipment 17% 46% 23% 62% Telecom 38% 52% 32% 83% Utility 68% 55% 19% 60% Shops 15% 45% 17% 47% Health 23% 57% 20% 59% Money 37% 52% 27% 81% Other 24% 44% 25% 74%
Panel F: The Choice of Benchmarks
Market Index
Industry Index
“Home-made” Peer Group
Among benchmark users, % of firms that benchmark performance to: 23% 22% 64% Mean Weight 19% 20% 61%
36
Figure 1. Histograms of the distribution of the performance thresholds when firms use
rank-based performance benchmarking.
0.00
0.10
0.20
0.30
0.40
0.50
0.05
0.10
0.15
0.20
0.25
0.30
0.35
0.40
0.45
0.50
0.55
0.60
0.65
0.70
0.75
0.80
0.85
0.90
0.95
1.00
Fra
ctio
n
Percentile Rank
Panel A: Minimum Performance Threshold
0.00
0.10
0.20
0.30
0.40
0.50
0.60
0.70
0.05
0.10
0.15
0.20
0.25
0.30
0.35
0.40
0.45
0.50
0.55
0.60
0.65
0.70
0.75
0.80
0.85
0.90
0.95
1.00
Fra
ctio
n
Percentile Rank
Panel B: Target Performance Threshold
0.00
0.05
0.10
0.15
0.20
0.25
0.30
0.35
0.0
5
0.1
0
0.1
5
0.2
0
0.2
5
0.3
0
0.3
5
0.4
0
0.45
0.5
0
0.5
5
0.60
0.6
5
0.7
0
0.7
5
0.8
0
0.8
5
0.9
0
0.9
5
1.0
0
Fra
ctio
n
Percentile Rank
Panel C: Maximum Performance Threshold
37
Table II
RPE Inference: Simulation Analysis Table II presents results from simulation analysis. We create 1,000 random samples of firm performance and compensation. Each simulated sample represents 50 industries, with 30 firms per industry over 21 years. We assume that firm performance; firm fixed effect (F_FE) and the error term (ε) follow a normal distribution. We use these variables to generate the compensation variable using four different data generating processes (DGP). The DGP and the set of statistical parameters are reported below. For each DGP, we report statistics of the RPE coefficients using three different specifications (Spe).
Assumptions: # Industries = 50 # Firms per industry = 30
# Years = 21 F_FE N(0,1)
Firm Perf. N(0.15,0.52) ε N(0,0.57)
DGP #1 (Linear): Compensation = 8 - 0.10*Industry Perf. + 0.10*Firm Perf. + F_FE + ε
DGP #2 (Contract): Compensation = 8 + 0.10*Truncated CDF + 0.10*Firm Perf. + F_FE + ε
where Truncated CDF equals 0 if CDF<0.25, and equals 0.75 if CDF>0.75
DGP #3 (Rank): Compensation = 8 + 0.10*CDF + 0.10*Firm Perf. + F_FE + ε
DGP #4 (Non-Linear): Compensation = 8 + 0.10* Truncated (Firm-Ind. Perf.) + F_FE + ε
where Truncated (Firm-Ind. Perf.) equals 0 if (Firm Perf.-Ind. Perf.)<-0.35, and equals 0.35 if >0.35
Spe #1: Compensation = α + β*Industry Perf. + δ*Firm Perf. + Firm FE + Year FE
Spe #2: Compensation = α+ γ*CDF + δ*Firm Perf. + Firm FE + Year FE
Spe #3: Compensation = α+ β*Ind. Perf. + γ*CDF + δ*Firm Perf. + Firm FE + Year FE
Spe #1
Spe #2
Spe #3
β
γ
β γ
DGP #1 Median
-0.102
0.055
-0.102 0.000 Linear Median T-stat -2.960 1.560 -2.506 0.008
Fraction β<0 or Fraction γ >0 1.000 0.941 0.996 0.501
Fra. β<0 or γ >0 & significant at 5% 0.834 0.352 0.684 0.029
DGP #2 Median
-0.052
0.120
0.016 0.128 Contract Median T-stat -1.502 3.414 0.386 3.095
Fraction β<0 or Fraction γ >0 0.931 1.000 0.361 0.999
Fra. β<0 or γ >0 & significant at 5% 0.321 0.924 0.010 0.874
DGP #3 Median
-0.054
0.101
-0.002 0.100 Rank Median T-stat -1.571 2.871 -0.038 2.403
Fraction β<0 or Fraction γ >0 0.940 0.997 0.512 0.990
Fra. β<0 or γ >0 & significant at 5% 0.342 0.819 0.031 0.662
DGP #4 Median
-0.030
0.075
0.014 0.083 Non-Linear Median T-stat -0.851 2.161 0.344 2.017
Fraction β<0 or Fraction γ >0 0.795 0.980 0.371 0.975
Fra. β<0 or γ >0 & significant at 5% 0.118 0.574 0.010 0.517

38
Table III
Descriptive Statistics Table III provides basic statistics of the variables used in this study. The sample is composed of
firms present in the Execucomp database. The sample period is from fiscal year 1992 to fiscal year
2012. Log TDC is the natural logarithm of one plus CEO total direct compensation. TSR is the stock
return assuming that the dividend payments are reinvested. ROA is the ratio of net income to total
assets. Log AT is the natural logarithm of one plus total assets. Log CEO Tenure is the natural
logarithm of one plus the number of years the CEO has been in position. All variables are
winsorized at 1% in both tails. Compensation and asset variables are expressed in 2012 dollars.
Mean SD p25 p50 p75 N
Log TDC
8.053 1.057 7.318 8.041 8.776 33,562
TSR 3 years 0.555 1.277 -0.151 0.274 0.829 31,869
TSR
0.152 0.519 -0.145 0.094 0.346 33,088
ROA
0.031 0.109 0.010 0.040 0.080 33,670
Log AT
7.767 1.742 6.496 7.628 8.917 33,687
Log CEO Tenure 1.729 0.877 1.099 1.792 2.398 32,803

39
Table IV
Testing the Presence of RPE in CEO Compensation Table IV shows results of firm fixed effect regressions. The dependent and explanatory variables
are defined in Table III. Industry performance is based on 2 digit SIC classification. The constant
term is not reported. Robust standard errors clustered at the firm-level are reported in
parentheses. The symbols ***, **, and * indicate that the p-value is less than 0.01, 0.05, and 0.10.
Dependent Variable = Log TDC
Performance Horizon: 3 years 1 year
(1) (2) (3) (4) (5) (6)
CDF (TSR 3 years) 0.262*** 0.348*** (0.022) (0.023) TSR 3 years (ind.) 0.051*** 0.115***
(0.012) (0.013) TSR 3 years 0.083*** 0.048*** 0.025***
(0.006) (0.007) (0.007) CDF (TSR)
0.127*** 0.154***
(0.021) (0.025)
TSR (ind.) -0.023
0.060** (0.022)
(0.027)
TSR 0.118*** 0.059*** 0.040** (0.010) (0.015) (0.018)
ROA 0.515*** 0.416*** 0.367*** 0.719*** 0.704*** 0.701*** (0.070) (0.069) (0.070) (0.072) (0.072) (0.072)
Log AT 0.382*** 0.385*** 0.382*** 0.374*** 0.374*** 0.374*** (0.016) (0.016) (0.016) (0.016) (0.016) (0.016)
Log CEO Tenure 0.006 0.004 0.003 0.009 0.010 0.009 (0.008) (0.008) (0.008) (0.008) (0.008) (0.008)
Firm F.E. Y Y Y Y Y Y
Year F.E. Y Y Y Y Y Y
Observations 30,751 30,751 30,751 31,905 31,905 31,905
Within R-squared 0.200 0.205 0.209 0.186 0.188 0.188

40
Table V
Additional Specifications Table V shows results of firm fixed effect regressions. The dependent and explanatory variables are
defined in Table III. Industry performance is based on 2 digit SIC classification. The constant term is
not reported. Robust standard errors clustered at the firm-level are reported in parentheses. The
symbols ***, **, and * indicate that the p-value is less than 0.01, 0.05, and 0.10.
Dependent Variable = Log TDC
Performance Horizon: 3 years 1 year
(1) (2) (3) (4) (5) (6)
Truncated CDF (TSR 3 y.) 0.278*** (0.031)
Truncated CDF (TSR) 0.133***
(0.030)
Top 3 Quartile 0.038*** 0.008 (0.013) (0.012)
Top Quartile 0.177*** 0.066*** 0.082*** 0.041*** (0.016) (0.011) (0.015) (0.010)
Second Quartile 0.134*** 0.050*** (0.012) (0.012)
Third Quartile 0.071***
0.026** (0.012)
(0.011)
Last Quartile -0.098***
-0.036*** (0.011)
(0.011)
TSR 3 years 0.055*** 0.056*** 0.060*** (0.006) (0.006) (0.006) TSR 0.073*** 0.071*** 0.076***
(0.014) (0.014) (0.013)
ROA 0.426*** 0.430*** 0.438*** 0.710*** 0.711*** 0.710*** (0.070) (0.070) (0.070) (0.072) (0.072) (0.072)
Log AT 0.385*** 0.385*** 0.385*** 0.374*** 0.374*** 0.374*** (0.016) (0.016) (0.016) (0.016) (0.016) (0.016)
Log CEO Tenure 0.004 0.004 0.004 0.009 0.009 0.009 (0.008) (0.008) (0.008) (0.008) (0.008) (0.008)
Firm F.E. Y Y Y Y Y Y
Year F.E. Y Y Y Y Y Y
Observations 30,751 30,751 30,751 31,905 31,905 31,905
Within R-squared 0.205 0.204 0.203 0.187 0.187 0.187

41
Table VI
Median Regressions Table VI shows results of median regressions. The dependent and explanatory variables are defined
in Table III. Industry performance is based on 2 digit SIC classification. The constant term is not
reported. Bootstrapped standard errors based on 100 replications are reported in parentheses. The
symbols ***, **, and * indicate that the p-value is less than 0.01, 0.05, and 0.10.
Dependent Variable = Log TDC
Performance Horizon: 3 years 1 year
(1) (2) (3) (4) (5) (6)
CDF (TSR 3 years) 0.186*** 0.268*** (0.017) (0.023) TSR 3 years (ind.) 0.037*** 0.088***
(0.008) (0.009) TSR 3 years 0.086*** 0.058*** 0.036***
(0.004) (0.004) (0.006) CDF (TSR)
0.094*** 0.123***
(0.019) (0.020)
TSR (ind.) 0.002
0.072*** (0.022)
(0.025)
TSR 0.104*** 0.056*** 0.033** (0.010) (0.012) (0.015)
ROA 0.734*** 0.673*** 0.619*** 0.945*** 0.920*** 0.929*** (0.059) (0.048) (0.062) (0.064) (0.063) (0.058)
Log AT 0.381*** 0.382*** 0.382*** 0.367*** 0.367*** 0.367*** (0.010) (0.009) (0.009) (0.011) (0.010) (0.010)
Log CEO Tenure 0.028*** 0.029*** 0.025*** 0.035*** 0.036*** 0.036*** (0.005) (0.006) (0.005) (0.006) (0.006) (0.005)
Firm F.E. Y Y Y Y Y Y
Year F.E. Y Y Y Y Y Y
Observations 30,751 30,751 30,751 31,905 31,905 31,905
Pseudo R-squared 0.139 0.141 0.143 0.129 0.130 0.130
42
Table VII
Alternative Industry Definitions and Specifications Table VII shows results of firm fixed effect regressions. The dependent and explanatory variables
are defined in Table III. Industry performance is based on 2, 3 and 4 digit SIC classification. The
constant term is not reported. Robust standard errors clustered at the firm-level are reported in
parentheses. The symbols ***, **, and * indicate that the p-value is less than 0.01, 0.05, and 0.10.
Dependent Variable: Log TDC Log TDC Log TDC TDC
Industry Classification:
3 digit SIC code 4 digit SIC code 2 digit SIC code 2 digit SIC code
(1) (2) (3) (4) (5) (6) (7) (8)
CDF (TSR 3 years) 0.186*** 0.292*** 0.157*** 0.264*** 1,095*** 1,530*** (0.020) (0.022) (0.020) (0.023) (176) (180)
Log CDF (TSR 3 years) 0.378*** 0.493*** (0.032) (0.033)
TSR 3 years (ind.) 0.095***
0.086*** 0.113*** 580*** (0.010)
(0.009) (0.013) (111)
TSR 3 years 0.062*** 0.035*** 0.066*** 0.040*** 0.050*** 0.028*** 414*** 296*** (0.006) (0.007) (0.007) (0.007) (0.007) (0.007) (52) (54)
ROA 0.447*** 0.392*** 0.457*** 0.403*** 0.404*** 0.354*** 383 135 (0.071) (0.071) (0.072) (0.073) (0.069) (0.070) (439) (435)
Log AT 0.386*** 0.384*** 0.386*** 0.384*** 0.385*** 0.381*** 2,159*** 2,142*** (0.017) (0.017) (0.017) (0.017) (0.016) (0.016) (131) (130)
Log CEO Tenure 0.003 0.002 0.003 0.002 0.003 0.003 81 77 (0.008) (0.008) (0.009) (0.009) (0.008) (0.008) (58) (58)
Firm F.E. Y Y Y Y Y Y Y Y
Year F.E. Y Y Y Y Y Y Y Y
Observations 29,837 29,837 29,027 29,027 30,751 30,751 30,751 30,751
Within R-squared 0.202 0.207 0.200 0.205 0.205 0.209 0.121 0.123

43
Table VIII
RPE across Sample Periods
Table VIII shows results of firm fixed effect regressions. The dependent and explanatory variables
are defined in Table III. Industry performance is based on 2 digit SIC classification. The constant
term is not reported. Robust standard errors clustered at the firm-level are reported in
parentheses. The symbols ***, **, and * indicate that the p-value is less than 0.01, 0.05, and 0.10.
Dependent Variable = Log TDC
Period: [1992-1998] [1999-2005] [2006-2012]
(1) (2) (3) (4) (5) (6)
CDF (TSR 3 years) 0.302*** 0.331*** 0.237*** 0.336*** 0.235*** 0.269*** (0.041) (0.044) (0.038) (0.042) (0.030) (0.033)
TSR 3 years (ind.) 0.041*
0.100***
0.069*** (0.023)
(0.019)
(0.021)
TSR 3 years 0.035*** 0.028** 0.058*** 0.033*** 0.018* 0.007 (0.012) (0.013) (0.011) (0.012) (0.010) (0.011)
ROA 0.337** 0.321** 0.249** 0.204* 0.348*** 0.327*** (0.154) (0.154) (0.117) (0.117) (0.076) (0.077)
Log AT 0.306*** 0.307*** 0.395*** 0.385*** 0.352*** 0.355*** (0.034) (0.034) (0.030) (0.030) (0.026) (0.025)
Log CEO Tenure -0.044*** -0.044*** -0.030** -0.030** 0.028** 0.028** (0.014) (0.014) (0.014) (0.014) (0.011) (0.011)
Firm F.E. Y Y Y Y Y Y
Year F.E. Y Y Y Y Y Y
Observations 7,875 7,875 10,857 10,857 12,019 12,019
Within R-squared 0.166 0.167 0.079 0.083 0.089 0.090

44
Figure 2. The Extent of RPE over Years. Figure 2.A plots the CDF (TSR 3 years) coefficient along
with its 95% confidence interval over years using the second specification from Table IV.
Figure 2.B plots the CDF (TSR 3 years) coefficient and the TSR 3 years (ind.) along with
their 95% confidence interval over years using the third specification from Table IV.
-0.2
0
0.2
0.4
0.6
0.8
Figure 2.A - CDF (3 years) Coefficient over Years
-0.2
0
0.2
0.4
0.6
0.8
Figure 2.B - CDF (3 years) and TSR 3 years (Ind) Coefficient over Years

45
Table IX
Large Shareholders and RPE Table IX shows results of firm fixed effect regressions. The dependent and explanatory variables are
defined in Table III. Large Shareholders is a dummy variable that equals one if the number of block
holders is greater than the median (i.e. 2). Industry performance is based on 2 digit SIC
classification. The constant term is not reported. Robust standard errors clustered at the firm-level
are reported in parentheses. The symbols ***, **, and * indicate that the p-value is less than 0.01,
0.05, and 0.10.
Dependent Variable = Log TDC
(1) (2)
CDF (TSR 3 years) 0.203*** 0.289*** (0.028) (0.030)
CDF (TSR 3 years) * Large Shareholders 0.082** 0.080* (0.038) (0.044)
TSR 3 years (ind.) 0.111*** (0.016)
TSR 3 years (ind.) * Large Shareholders 0.001 (0.020)
TSR 3 years 0.053*** 0.031*** (0.009) (0.009)
TSR 3 years * Large Shareholders -0.021* -0.022 (0.011) (0.013)
ROA 0.558*** 0.507*** (0.098) (0.099)
ROA * Large Shareholders -0.023 -0.033 (0.126) (0.127)
Log AT 0.359*** 0.357*** (0.020) (0.020)
Log AT * Large Shareholders -0.004 -0.003 (0.008) (0.008)
Log CEO Tenure 0.011 0.010 (0.010) (0.009)
Log CEO Tenure * Large Shareholders -0.020 -0.021* (0.012) (0.012)
Large Shareholders 0.203*** 0.289*** (0.028) (0.030)
Firm F.E. Y Y
Year F.E. Y Y
Observations 25,458 25,458
Within R-squared 0.183 0.187

46
Table X
Specificity of CEO Talent and RPE Table X shows results of firm fixed effect regressions. The dependent and explanatory variables are
defined in Table III. Industry performance is based on 2 digit SIC classification. To study the market
for CEO talent, we use the proportion of insiders among all new CEOs for each Fama & French 48
industry between 1993 and 2005 (see Cremers and Grinstein, 2013). We classify the market for
CEO talent as less firm-specific in industries where the proportion of insiders among all new CEOs
is below the median. The constant term is not reported. Robust standard errors clustered at the
firm-level are reported in parentheses. The symbols ***, **, and * indicate that the p-value is less
than 0.01, 0.05, and 0.10.
Dependent Variable = Log TDC
(1) (2)
CDF (TSR 3 years) 0.213*** 0.294*** (0.029) (0.033)
CDF (TSR 3 years) * Less Firm-Specific 0.095** 0.100** (0.042) (0.047)
TSR 3 years (ind.) 0.102*** (0.016)
TSR 3 years (ind.) * Less Firm-Specific 0.019 (0.021)
TSR 3 years 0.064*** 0.040*** (0.009) (0.010)
TSR 3 years * Less Firm-Specific -0.030** -0.028** (0.012) (0.014)
ROA 0.798*** 0.742*** (0.128) (0.128)
ROA * Less Firm-Specific -0.522*** -0.511*** (0.150) (0.151)
Log AT 0.420*** 0.414*** (0.021) (0.021)
Log AT * Less Firm-Specific -0.058** -0.053* (0.028) (0.027)
Log CEO Tenure 0.027** 0.027** (0.011) (0.011)
Log CEO Tenure * Less Firm-Specific -0.047*** -0.048*** (0.016) (0.016)
Firm F.E. Y Y
Year F.E. Y Y
Observations 30,646 30,646
Within R-squared 0.208 0.212

47
Table XI
Industry Concentration and RPE Table XI shows results of firm fixed effect regressions. The dependent and explanatory variables are
defined in Table III. Industry performance is based on 2 digit SIC classification. We classify
industries as more concentrated the ones which HHI is above the median HHI in our sample. The
constant term is not reported. Robust standard errors clustered at the firm-level are reported in
parentheses. The symbols ***, **, and * indicate that the p-value is less than 0.01, 0.05, and 0.10.
Dependent Variable = Log TDC
Manufacturing
Firms Non-Manufacturing
Firms
(1) (2) (3) (4)
CDF (TSR 3 years) 0.273*** 0.370*** 0.281*** 0.353*** (0.050) (0.053) (0.044) (0.050)
CDF (TSR 3 years) * High HHI -0.001 -0.010 0.067 0.047 (0.073) (0.077) (0.062) (0.070)
TSR 3 years (ind.) 0.146*** 0.102*** (0.023) (0.025)
TSR 3 years (ind.) * High HHI -0.002 -0.012 (0.034) (0.034)
TSR 3 years 0.038*** 0.016 0.047*** 0.027* (0.014) (0.014) (0.013) (0.015)
TSR 3 years * High HHI 0.012 0.010 -0.027 -0.023 (0.019) (0.022) (0.018) (0.021)
ROA 0.550*** 0.493*** 0.307** 0.278** (0.138) (0.137) (0.139) (0.141)
ROA * High HHI -0.355* -0.344* 0.624** 0.622** (0.192) (0.193) (0.264) (0.266)
Log AT 0.330*** 0.326*** 0.380*** 0.384*** (0.031) (0.031) (0.029) (0.029)
Log AT * High HHI 0.051 0.050 -0.009 -0.021 (0.052) (0.051) (0.040) (0.040)
Log CEO Tenure -0.018 -0.020 -0.015 -0.017 (0.016) (0.016) (0.018) (0.017)
Log CEO Tenure * High HHI 0.020 0.021 0.054** 0.055** (0.026) (0.026) (0.024) (0.024)
Firm F.E. Y Y Y Y
Year F.E. Y Y Y Y
Observations 11,037 11,037 14,215 14,215
Within R-squared 0.215 0.220 0.189 0.192

48
Table XII
CEO Wealth and RPE Table XII shows results of firm fixed effect regressions. The dependent and explanatory variables
are defined in Table III. Industry performance is based on 2 digit SIC classification. We classify CEOs
as more wealthy when their CEO wealth measure is above the median in our sample. The constant
term is not reported. Robust standard errors clustered at the firm-level are reported in
parentheses. The symbols ***, **, and * indicate that the p-value is less than 0.01, 0.05, and 0.10.
Dependent Variable = Log TDC
CEO wealth measure: CEO shareholdings ($) # CEO shares
/ # total shares CEO Age
(1) (2) (3) (4) (5) (6)
CDF (TSR 3 years) 0.212*** 0.269*** 0.243*** 0.322*** 0.250*** 0.329*** (0.031) (0.032) (0.030) (0.033) (0.031) (0.033)
CDF (TSR 3 years)*CEO Wealth 0.049 0.096** 0.022 0.034 0.014 0.029 (0.040) (0.046) (0.040) (0.047) (0.042) (0.048)
TSR 3 years (ind.) 0.089*** 0.106*** 0.112*** (0.016) (0.016) (0.017)
TSR 3 years (ind.)*CEO Wealth 0.035* 0.014 0.007 (0.020) (0.020) (0.020)
TSR 3 years 0.045*** 0.029*** 0.050*** 0.026** 0.050*** 0.029*** (0.009) (0.010) (0.009) (0.011) (0.009) (0.010)
TSR 3 years*CEO Wealth 0.002 -0.009 -0.004 -0.003 -0.004 -0.010 (0.011) (0.013) (0.011) (0.014) (0.011) (0.013)
ROA 0.303*** 0.277*** 0.405*** 0.360*** 0.310*** 0.264*** (0.075) (0.075) (0.093) (0.093) (0.091) (0.092)
ROA*CEO Wealth 0.457*** 0.400*** 0.042 0.034 0.289** 0.281** (0.138) (0.137) (0.125) (0.126) (0.127) (0.128)
Log AT 0.357*** 0.354*** 0.382*** 0.378*** 0.380*** 0.376*** (0.017) (0.016) (0.017) (0.017) (0.017) (0.017)
Log AT*CEO Wealth 0.040*** 0.039*** -0.003 -0.003 0.025*** 0.025*** (0.009) (0.009) (0.011) (0.011) (0.008) (0.008)
Log CEO Tenure -0.020** -0.019** 0.005 0.005 -0.003 -0.004 (0.009) (0.009) (0.009) (0.009) (0.012) (0.012)
Log CEO Tenure*CEO Wealth 0.009 0.007 -0.018 -0.019 0.025 0.025 (0.014) (0.014) (0.016) (0.016) (0.015) (0.015)
CEO Wealth -0.274*** -0.298*** 0.072 0.057 -0.284*** -0.290*** (0.084) (0.084) (0.086) (0.086) (0.071) (0.072)
Firm F.E. Y Y Y Y Y Y
Year F.E. Y Y Y Y Y Y
Observations 29,553 29,553 29,838 29,838 29,416 29,416
Within R-squared 0.200 0.204 0.202 0.206 0.208 0.212

49
Table XIII
Strategic Flexibility and RPE Table XIII shows results of firm fixed effect regressions. The dependent and explanatory variables
are defined in Table III. Industry performance is based on 2 digit SIC classification. Multisegment
firms are firms that report positive sales and assets in more than one three digit code industry. The
constant term is not reported. Robust standard errors clustered at the firm-level are reported in
parentheses. The symbols ***, **, and * indicate that the p-value is less than 0.01, 0.05, and 0.10.
Dependent Variable = Log TDC
(1) (2)
CDF (TSR 3 years) 0.233*** 0.304*** (0.031) (0.033)
CDF (TSR 3 years) * Multisegment 0.006 0.049 (0.046) (0.055)
TSR 3 years (ind.) 0.101*** (0.017)
TSR 3 years (ind.) * Multisegment 0.026 (0.024)
TSR 3 years 0.056*** 0.038*** (0.008) (0.008)
TSR 3 years * Multisegment 0.011 -0.004 (0.015) (0.019)
ROA 0.350*** 0.310*** (0.086) (0.086)
ROA * Multisegment 0.381** 0.325* (0.177) (0.180)
Log AT 0.383*** 0.381*** (0.018) (0.018)
Log AT * Multisegment -0.006 -0.005 (0.015) (0.015)
Log CEO Tenure -0.021* -0.022* (0.012) (0.012)
Log CEO Tenure * Multisegment 0.057*** 0.055*** (0.016) (0.015)
Multisegment -0.058 -0.093 (0.127) (0.125)
Firm F.E. Y Y
Year F.E. Y Y
Observations 25,414 25,414
Within R-squared 0.214 0.218


