Wilson HTM Equities Research – Horizon Oil Limited
Issued by Wilson HTM Ltd ABN 68 010 529 665 - Australian Financial Services Licence No 238375, a participant of ASX Group and should be read in conjunction with the disclosures and disclaimer in this report. Important disclosures regarding companies that are subject of this report and an explanation of recommendations can be found at the end of this document.
05 September 2014
HORIZON OIL LIMITED (HZN)
ACTION & RECOMMENDATION
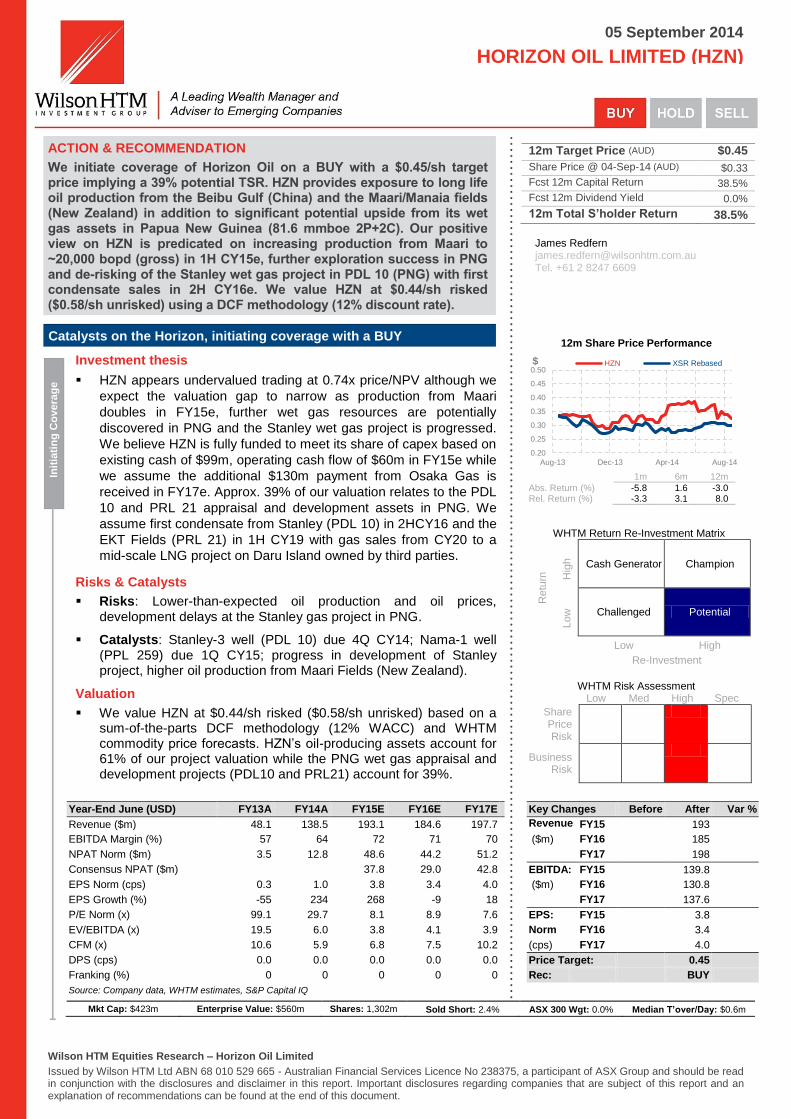
We initiate coverage of Horizon Oil on a BUY with a $0.45/sh target price implying a 39% potential TSR. HZN provides exposure to long life oil production from the Beibu Gulf (China) and the Maari/Manaia fields (New Zealand) in addition to significant potential upside from its wet gas assets in Papua New Guinea (81.6 mmboe 2P+2C). Our positive view on HZN is predicated on increasing production from Maari to ~20,000 bopd (gross) in 1H CY15e, further exploration success in PNG and de-risking of the Stanley wet gas project in PDL 10 (PNG) with first condensate sales in 2H CY16e. We value HZN at $0.44/sh risked ($0.58/sh unrisked) using a DCF methodology (12% discount rate).
Catalysts on the Horizon, initiating coverage with a BUY
Init
iati
ng
Co
vera
ge
Investment thesis
HZN appears undervalued trading at 0.74x price/NPV although we
expect the valuation gap to narrow as production from Maari
doubles in FY15e, further wet gas resources are potentially
discovered in PNG and the Stanley wet gas project is progressed.
We believe HZN is fully funded to meet its share of capex based on
existing cash of $99m, operating cash flow of $60m in FY15e while
we assume the additional $130m payment from Osaka Gas is
received in FY17e. Approx. 39% of our valuation relates to the PDL
10 and PRL 21 appraisal and development assets in PNG. We
assume first condensate from Stanley (PDL 10) in 2HCY16 and the
EKT Fields (PRL 21) in 1H CY19 with gas sales from CY20 to a
mid-scale LNG project on Daru Island owned by third parties.
Risks & Catalysts
Risks: Lower-than-expected oil production and oil prices,
development delays at the Stanley gas project in PNG.
Catalysts: Stanley-3 well (PDL 10) due 4Q CY14; Nama-1 well
(PPL 259) due 1Q CY15; progress in development of Stanley project, higher oil production from Maari Fields (New Zealand).
Valuation
We value HZN at $0.44/sh risked ($0.58/sh unrisked) based on a
sum-of-the-parts DCF methodology (12% WACC) and WHTM commodity price forecasts. HZN’s oil-producing assets account for 61% of our project valuation while the PNG wet gas appraisal and development projects (PDL10 and PRL21) account for 39%.
12m Target Price (AUD) $0.45
Share Price @ 04-Sep-14 (AUD) $0.33 Fcst 12m Capital Return 38.5%
Fcst 12m Dividend Yield 0.0%
12m Total S’holder Return 38.5%
James Redfern [email protected] Tel. +61 2 8247 6609
12m Share Price Performance
1m 6m 12m
Abs. Return (%) -5.8 1.6 -3.0 Rel. Return (%) -3.3 3.1 8.0
WHTM Return Re-Investment Matrix R
etu
rn
Hig
h
Cash Generator Champion
Low
Challenged Potential
Low High
Re-Investment
WHTM Risk Assessment Low Med High Spec
Share Price Risk
Business Risk
Year-End June (USD) FY13A FY14A FY15E FY16E FY17E
Revenue ($m) 48.1 138.5 193.1 184.6 197.7
EBITDA Margin (%) 57 64 72 71 70
NPAT Norm ($m) 3.5 12.8 48.6 44.2 51.2
Consensus NPAT ($m) 37.8 29.0 42.8
EPS Norm (cps) 0.3 1.0 3.8 3.4 4.0
EPS Growth (%) -55 234 268 -9 18
P/E Norm (x) 99.1 29.7 8.1 8.9 7.6
EV/EBITDA (x) 19.5 6.0 3.8 4.1 3.9
CFM (x) 10.6 5.9 6.8 7.5 10.2
DPS (cps) 0.0 0.0 0.0 0.0 0.0
Franking (%) 0 0 0 0 0
Source: Company data, WHTM estimates, S&P Capital IQ
Key Changes Before After Var %
Revenue:
FY15 193
($m) FY16 185
FY17 198
EBITDA: FY15 139.8
($m) FY16 130.8
FY17 137.6
EPS: FY15 3.8
Norm FY16 3.4
(cps) FY17 4.0
Price Target:
0.45
Rec:
BUY
Mkt Cap: $423m Enterprise Value: $560m Shares: 1,302m Sold Short: 2.4% ASX 300 Wgt: 0.0% Median T’over/Day: $0.6m
0.20
0.25
0.30
0.35
0.40
0.45
0.50
Aug-13 Dec-13 Apr-14 Aug-14
$ HZN XSR Rebased

05 September 2014
Energy
Horizon Oil Limited
Wilson HTM Equities Research – Horizon Oil Limited 2
Table of contents
Investment thesis ................................................................................................................ 3
Valuation ............................................................................................................................. 4
Company overview .............................................................................................................. 5
Reserves and resources ..................................................................................................... 6
Production ........................................................................................................................... 7
Key assets ........................................................................................................................... 8
Beibu Gulf, offshore China .................................................................................................. 8
Maari/Manaia Fields, New Zealand .................................................................................. 11
Papua New Guinea ........................................................................................................... 14
PDL 10, Stanley Gas/Condensate Project ................................................................. 15
PNG gas commercialisation options ........................................................................... 17
PRL 21 (Elevala/Ketu/Tingu) ...................................................................................... 18
Osaka Gas Strategic Alliance helps derisk projects ................................................... 20
Financial analysis .............................................................................................................. 21
Earnings ...................................................................................................................... 21
Cash flows .................................................................................................................. 21
Capex.......................................................................................................................... 22
Liquidity and debt ........................................................................................................ 22
Risks .................................................................................................................................. 26
Board of directors .............................................................................................................. 27
Management team ............................................................................................................ 28
Key shareholders .............................................................................................................. 28
Wilson HTM energy sector comps .................................................................................... 29

05 September 2014
Energy
Horizon Oil Limited
Wilson HTM Equities Research – Horizon Oil Limited 3
Investment thesis
We initiate coverage of HZN with a BUY rating and $0.45/sh target price, set broadly in
line with our risked valuation. We value HZN using a sum-of-the-parts DCF methodology
with a 12% discount rate (13% for Papua New Guinea reflecting increased country
risk). We also apply a risk factor to the company’s PNG appraisal and development
projects based on our view of the geological, commercial, development, regulatory and
funding risks.
In our view, HZN shares should appreciate in the coming year due to: 1) production from
the Maari oil fields in New Zealand doubling to ~20,000 bopd (gross) in 1H CY15;
2) further PNG wet gas resources potentially discovered with the Nama-1 well in PPL 259
(HZN 35%) targeting 400 Bcf of gas and 13 mmboe of condensate to be drilled around
November 2014; 3) construction of the Stanley wet gas project progressing, and 4) a final
investment decision for a development of the EKT Fields (PRL 21) reached early CY15.
We believe HZN is fully funded to meet its share of capex during the forecast period based on
existing cash of $99m and operating cash flow of $60m in FY15e. We assume the additional
$130m payment from Osaka Gas is received in FY17e while the company’s debt facilities
should also increase in FY16-17e. Gearing is forecast to peak at 38% in FY18e.
Approx. 39% of our valuation relates to the PDL 10 and PRL 21 appraisal and
development assets in PNG. We assume first condensate from the Stanley wet gas
development project (PDL 10) in 2H CY16 and EKT Fields (PRL 21) in 1H CY19 with gas
sales from CY20 to a mid-scale LNG project on Daru Island owned by third parties.
Existing oil production provides cash flows to fund appraisal and development
We forecast oil production of 1.83 mmbbl in FY15e (+28% versus pcp) from the
company’s 27% interest in the Beibu Gulf fields, offshore China, and 10% interest in the
Maari/Manaia fields, offshore New Zealand. We estimate the Beibu Gulf and
Maari/Manaia fields, with a significant reserve life of ~10 years and ~30 years
respectively, will generate operating cash flow of US$60m in FY15e to fund continuing
exploration, appraisal and development activities.
Significant potential upside from PNG wet gas acreage
HZN also provides significant potential upside through the successful development of its
interest in 7,900 km2 of wet gas acreage in the Western forelands of Papua New Guinea
containing net 2C resource of 78.1 mmboe. In May 2013 HZN sold a 40% interest to
Osaka Gas (Japan’s second largest gas company) for US$204m, while in May 2014 the
PNG government granted the Stanley gas project in PDL 10 (HZN 30%) with a
development licence.
Development of the Stanley gas/condensate project (PDL 10) is under way with first
condensate production forecast to commence in 2H CY16 while gas will be reinjected until
an end market user is established. We assume gas sales from Stanley (PDL 10) and the
EKT Fields (PRL 21) will commence in CY20 with the gas sold to a third party LNG project
on Daru Island on the coast of Papua.
We highlight that in the event HZN’s 81.6 mmboe of 2P + 2C were acquired at the
average recent transaction multiple of US$4.32/boe, the company’s PNG assets would be
valued at $0.34/sh, a significant premium to our current risked PNG valuation of $0.22/sh.
Near-term catalysts
Confirmation of higher production from Maari (New Zealand) in the Dec-14 quarterly.
Stanley-3 development well (PDL 10) in PNG, result due 4Q CY14.
Nama-1 exploration well (PPL 259) in PNG, result due 1Q CY15.
Progress in the construction of the Stanley gas development project in PDL 10.
Final investment decision for PRL 21 due early CY15.

05 September 2014
Energy
Horizon Oil Limited
Wilson HTM Equities Research – Horizon Oil Limited 4
Valuation
Our risked valuation for HZN is $0.44/sh ($0.58/sh unrisked) implying a 39% potential
TSR. We value HZN using a sum-of-the-parts DCF methodology and Wilson HTM
commodity price forecasts. We use a 12% discount rate for HZN’s China and New
Zealand projects and a 13% discount rate for PNG projects reflecting higher perceived
sovereign risk.
Please refer to the “Key assets” section of this report for a detailed discussion of our
modelling and valuation assumptions for each of the various assets.
TABLE 1: SUMMARY VALUATION
Source: Company data, Wilson HTM
As shown in figures 1 and 2, HZN’s producing assets in the Beibu Gulf (China) and
Maari/Manaia fields (New Zealand) account for 61% of our total project valuation.
The company’s PNG appraisal (PRL 21) and development projects (PDL 10) account for
approx. 39% of our project valuation. We have risked the Stanley wet gas development
project (PDL 10) at 75% and the EKT Fields project (PRL 21) at 50% reflecting our view of
the various development, regulatory, funding, geological and commercial risks.
FIGURE 1: VALUATION BY KEY PROJECT
Source: Company data, Wilson HTM
FIGURE 2: VALUATION BY DEVELOPMENT PHASE
Source: Company data, Wilson HTM
Working Unrisked Unrisked Risked Risked Risked
Project Interest $Amn A$/sh $Amn A$/sh A$/boe
Producing
China 246 0.22 246 0.22 5.8 42.4
Beibu Gulf Block 22/12 27.0% 246 0.22 100% 246 0.22 5.8 42.4
New Zealand 152 0.13 152 0.13 5.8 26.2
Maari/Manaia 10.0% 152 0.13 100% 152 0.13 5.8 26.2
Producing NAV 398 0.35 398 0.35
Risked
Development & Appraisal A$/boe
PNG
PDL 10 (Stanley) 30.0% 183 0.16 75% 137 0.12 24.2 5.6
PRL 21 (Elevala, Ketu, Tingu) 27.0% 230 0.20 50% 115 0.10 57.4 2.0
Development NAV 413 0.36 252 0.22
Cash on hand (30 June 2014) 99 0.09 99 0.09
Debt (30 June 2014) -187 -0.16 -187 -0.16
Net cash (debt) -89 -0.08 -89 -0.08
Corporate costs -62 -0.05 -62 -0.05
Net cash and other -151 -0.13 -151 -0.13
Total valuation 660 0.58 499 0.44
Risk
Weighting
2P Reserves
(mmboe)
2P+2C
Resource
Beibu Gulf Block 22/12
38%
Maari/Manaia 23%
PDL 10 (Stanley)
21%
PRL 21 (Elevala, Ketu, Tingu)
18%
Producing NAV61%
Development NAV39%

05 September 2014
Energy
Horizon Oil Limited
Wilson HTM Equities Research – Horizon Oil Limited 5
Company overview
Horizon Oil Limited (HZN) is an ASX-listed oil and gas exploration, development and
production company with assets located in China, New Zealand and Papua New Guinea.
At 30 June 2014, the company had 15.1 mmboe of net 2P reserves and 79.6 mmboe of
net 2C Contingent Resource. We forecast oil production of 1.8 mmbbl in FY15e (versus
1.4 mmbbl in FY14) from the company’s 26.95% interest in Block 22/12, located in the
Beibu Gulf of China and 10% interest in the Maari/Manaia oil fields (PMP 38160) in the
Taranaki Basin, offshore New Zealand.
We forecast HZN’s oil producing assets to provide operating cash flows of US$60m in
FY15e to fund continued exploration and development across the portfolio. OMV (as
operator of the Maari Fields) expects the Maari Growth Project to increase Maari oil
production to ~20,000 bopd (gross) in 1H CY15 versus 8,319 bopd (gross) in 1H CY14.
HZN also provides significant potential upside through the successful development of its
27-30% interest in 7,900 km2 of wet gas acreage in the Western forelands of PNG
containing a net 2C resource of 80 mmboe. In May 2013 HZN sold a 40% interest to
Osaka Gas (Japan’s second largest gas company) for US$204m, while in May 2014 the
PNG government granted a development licence for the Stanley gas field (PDL 10).
The Stanley gas/condensate project is under way with first condensate production
forecast to commence in 2H CY16 while the gas will be reinjected in to the reservoir until
an end market user is established. We currently assume gas sales from Stanley and the
EKT Fields (PRL 21) will commence in CY20 with the gas sold to a third party LNG project
on Daru Island on the coast of Papua or potentially a T3 expansion of PNG LNG.
FIGURE 3: ASSET LOCATION MAP
Source: Company presentation

05 September 2014
Energy
Horizon Oil Limited
Wilson HTM Equities Research – Horizon Oil Limited 6
Reserves and resources
HZN had 15.1 mmboe of net 2P reserves as at 30 June 2014, of which 77% related to
producing oil fields in the Beibu Gulf (China) and Maari/Manaia Fields (New Zealand)
while 23% consisted of condensate reserves at the Stanley project in PDL 10 (PNG).
Based on FY14e production, we calculate the Beibu Gulf and Maari/Manaia fields have a
reserve life of approx. 10 years and 30 years respectively.
In addition, at 30 June 2014, HZN had 79.6 mmboe of net 2C Contingent Resource
(94.7 mmboe 2P + 2C), of which 86% related to HZN’s PNG appraisal and development
assets in PDL 10 (Stanley) and PRL 21 (Elevala, Ketu and Tingu fields).
TABLE 2: HZN 2P RESERVES AND 2C CONTINGENT RESOURCE AS AT 1 JANUARY 2014
Source: Company data
FIGURE 4: 2P RESERVES BY COUNTRY (30 JUN-14)
Source: Company data
FIGURE 5: 2P + 2C BY COUNTRY (30 JUN-14)
Source: Company data
FIGURE 6: 2P RESERVES BY PRODUCT (30 JUN-14)
Source: Company data
FIGURE 7: 2P + 2C BY PRODUCT (30 JUN-14)
Source: Company data
Gas Condensate Oil Total Gas Condensate Oil Total
(Bcf) (mmbbl) (mmbbl) (mmboe) (Bcf) (mmbbl) (mmbbl) (mmboe)
New Zealand
PMP 38160 Maari/Manaia 5.8 5.8
China
Beibu Gulf (Block 22/12) 5.8 5.8
Block 22/12 WZ 12-8E 0.0 0.0 1.5 1.5
Papua New Guinea
PDL 10 (Stanley) 3.5 3.5 122.0 0.4 20.7
PRL 21 (Elevala, Ketu,Tingu) 264.0 13.4 57.4
Total 0.0 3.5 11.6 15.1 386.0 13.8 1.5 79.6
2P Reserves 2C Resources
China39%
New Zealand38%
Papua New Guinea
23%
PNG86%
China8%
New Zealand6%
Oil77%
Condensate23%
Oil & Condensate
32%
Gas68%

05 September 2014
Energy
Horizon Oil Limited
Wilson HTM Equities Research – Horizon Oil Limited 7
Production
We forecast oil production of 1.8 mmboe in FY15e, up 28% from 1.4 mmboe in FY14
driven by higher production from Maari/Manaia (New Zealand) following the Maari Growth
Project which is expected to increase production to ~20,000 bopd by 1H CY15 (versus
8,319 bopd in 1H CY14). The Maari Growth Project comprises four new production wells,
one new injection well and a workover of the existing MR2 dual lateral production well. We
forecast Maari production to peak at ~19,000 in 1H CY15. We also assume first
condensate from Stanley at 4,000 boepd (gross) in 2H CY16 (FY17e).
FIGURE 8: PRODUCTION BY PROJECT (MBOE)
Source: Company data, Wilson HTM
FIGURE 9: PRODUCTION BY PRODUCT (MBOE)
Source: Company data, Wilson HTM
FIGURE 10: FY15E PRODUCTION BY PROJECT
Source: Company data, Wilson HTM
FIGURE 11: FY17E PRODUCTION BY PROJECT
Source: Company data, Wilson HTM
0
500
1,000
1,500
2,000
2,500
FY12 FY13 FY14 FY15F FY16F FY17F
Maari/Manaia Beibu Stanley (PDL 10)
0
500
1,000
1,500
2,000
2,500
FY12 FY13 FY14 FY15F FY16F FY17F
Oil Condensate
Beibu (China)67%
Maari/Manaia (NZ)33%
Maari/Manaia29%
Beibu48%
Stanley -Condensate
23%
05 September 2014
Energy
Horizon Oil Limited
Wilson HTM Equities Research – Horizon Oil Limited 8
Key assets
Beibu Gulf, offshore China
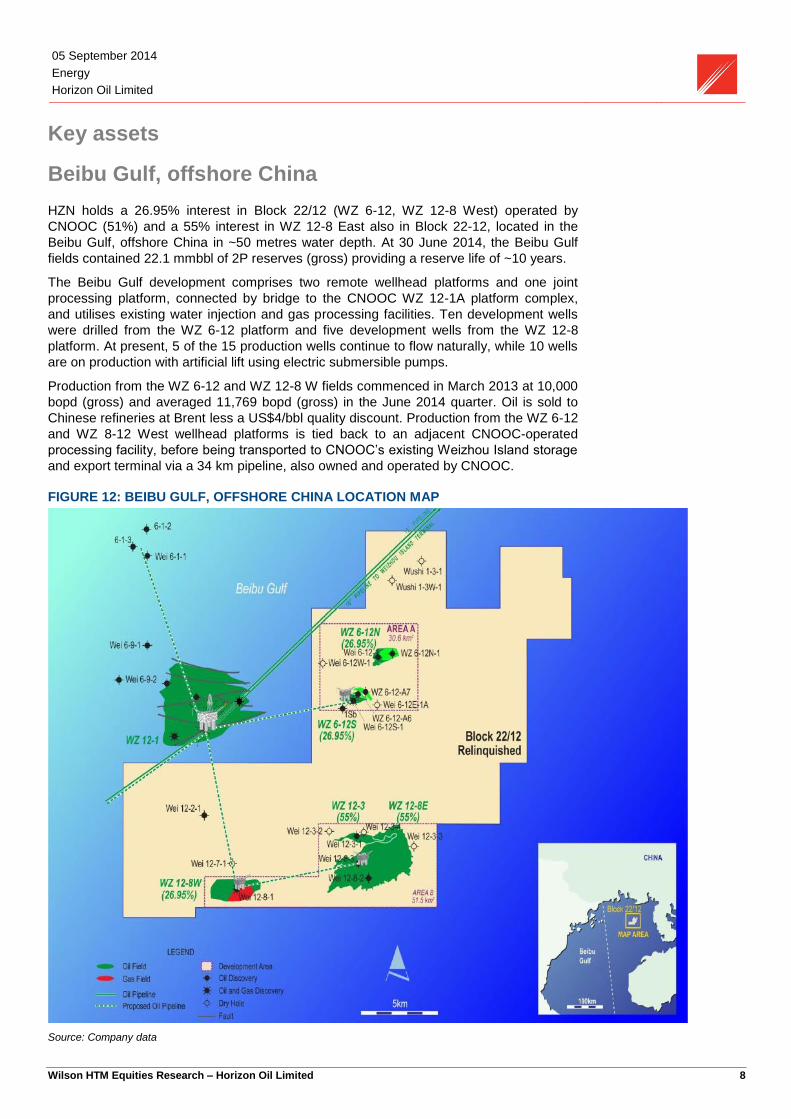
HZN holds a 26.95% interest in Block 22/12 (WZ 6-12, WZ 12-8 West) operated by
CNOOC (51%) and a 55% interest in WZ 12-8 East also in Block 22-12, located in the
Beibu Gulf, offshore China in ~50 metres water depth. At 30 June 2014, the Beibu Gulf
fields contained 22.1 mmbbl of 2P reserves (gross) providing a reserve life of ~10 years.
The Beibu Gulf development comprises two remote wellhead platforms and one joint
processing platform, connected by bridge to the CNOOC WZ 12-1A platform complex,
and utilises existing water injection and gas processing facilities. Ten development wells
were drilled from the WZ 6-12 platform and five development wells from the WZ 12-8
platform. At present, 5 of the 15 production wells continue to flow naturally, while 10 wells
are on production with artificial lift using electric submersible pumps.
Production from the WZ 6-12 and WZ 12-8 W fields commenced in March 2013 at 10,000
bopd (gross) and averaged 11,769 bopd (gross) in the June 2014 quarter. Oil is sold to
Chinese refineries at Brent less a US$4/bbl quality discount. Production from the WZ 6-12
and WZ 8-12 West wellhead platforms is tied back to an adjacent CNOOC-operated
processing facility, before being transported to CNOOC’s existing Weizhou Island storage
and export terminal via a 34 km pipeline, also owned and operated by CNOOC.
FIGURE 12: BEIBU GULF, OFFSHORE CHINA LOCATION MAP
Source: Company data
05 September 2014
Energy
Horizon Oil Limited
Wilson HTM Equities Research – Horizon Oil Limited 9
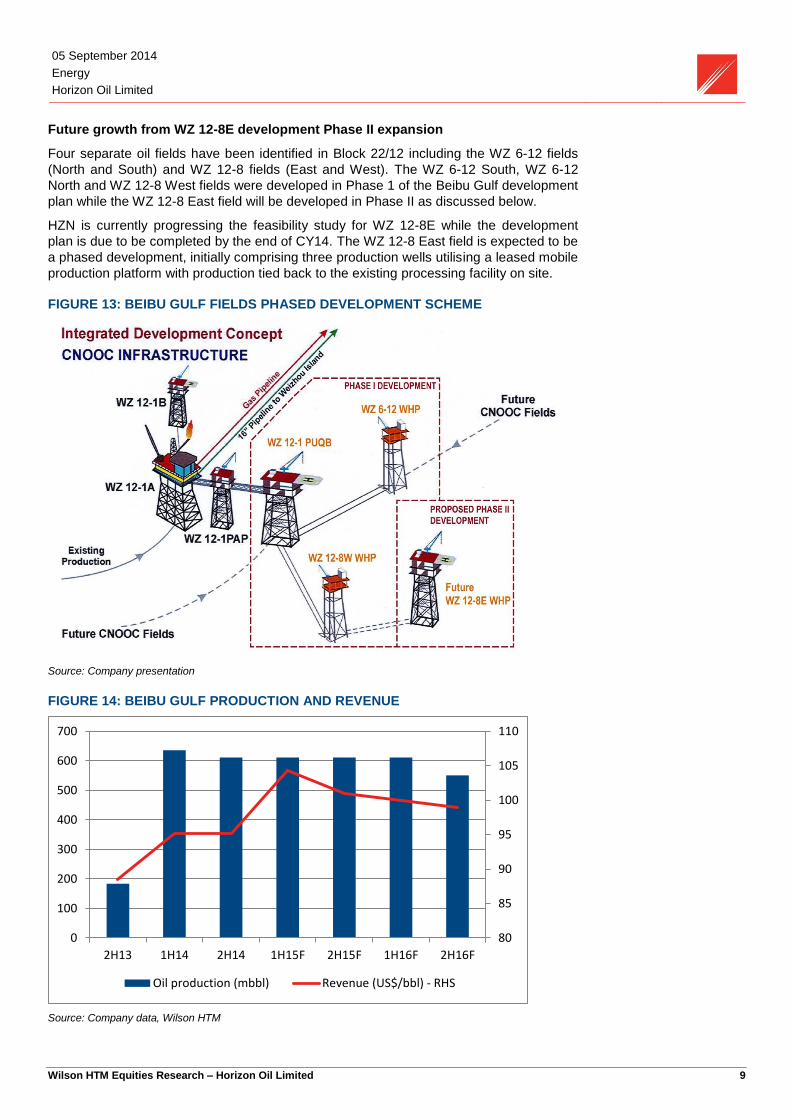
Future growth from WZ 12-8E development Phase II expansion
Four separate oil fields have been identified in Block 22/12 including the WZ 6-12 fields
(North and South) and WZ 12-8 fields (East and West). The WZ 6-12 South, WZ 6-12
North and WZ 12-8 West fields were developed in Phase 1 of the Beibu Gulf development
plan while the WZ 12-8 East field will be developed in Phase II as discussed below.
HZN is currently progressing the feasibility study for WZ 12-8E while the development
plan is due to be completed by the end of CY14. The WZ 12-8 East field is expected to be
a phased development, initially comprising three production wells utilising a leased mobile
production platform with production tied back to the existing processing facility on site.
FIGURE 13: BEIBU GULF FIELDS PHASED DEVELOPMENT SCHEME
Source: Company presentation
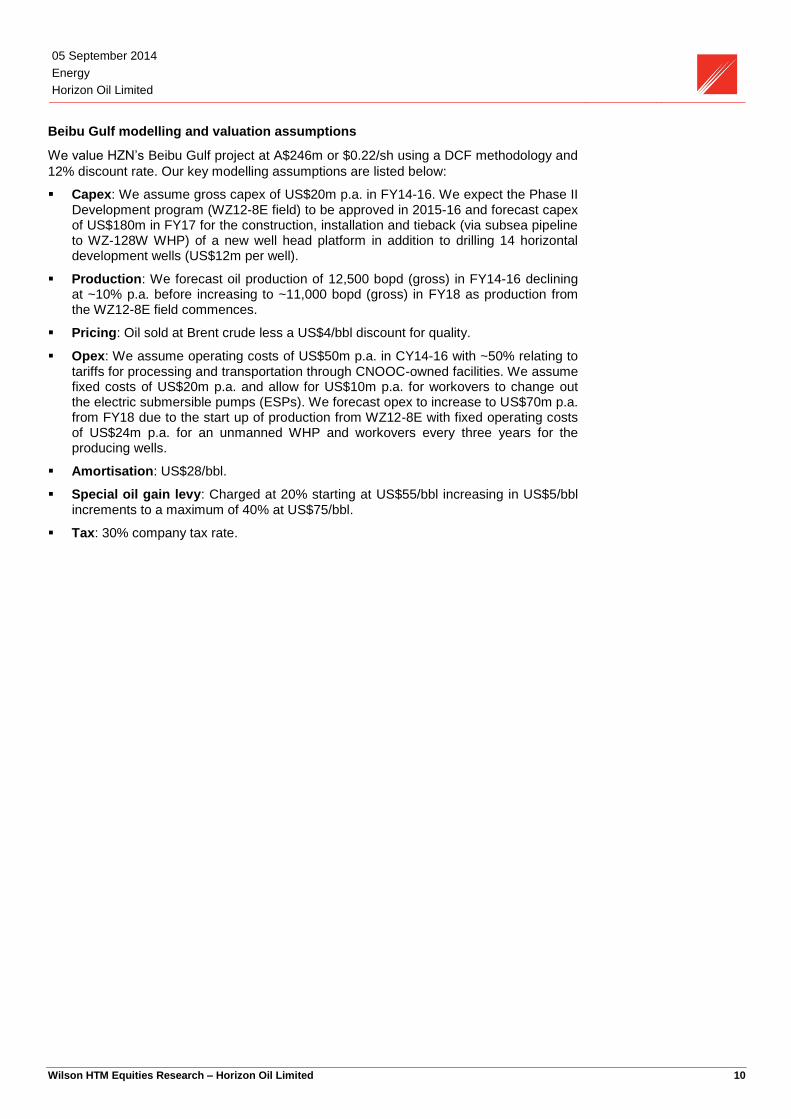
FIGURE 14: BEIBU GULF PRODUCTION AND REVENUE
Source: Company data, Wilson HTM
80
85
90
95
100
105
110
0
100
200
300
400
500
600
700
2H13 1H14 2H14 1H15F 2H15F 1H16F 2H16F
Oil production (mbbl) Revenue (US$/bbl) - RHS
05 September 2014
Energy
Horizon Oil Limited
Wilson HTM Equities Research – Horizon Oil Limited 10
Beibu Gulf modelling and valuation assumptions
We value HZN’s Beibu Gulf project at A$246m or $0.22/sh using a DCF methodology and
12% discount rate. Our key modelling assumptions are listed below:
Capex: We assume gross capex of US$20m p.a. in FY14-16. We expect the Phase II
Development program (WZ12-8E field) to be approved in 2015-16 and forecast capex of US$180m in FY17 for the construction, installation and tieback (via subsea pipeline to WZ-128W WHP) of a new well head platform in addition to drilling 14 horizontal development wells (US$12m per well).
Production: We forecast oil production of 12,500 bopd (gross) in FY14-16 declining
at ~10% p.a. before increasing to ~11,000 bopd (gross) in FY18 as production from the WZ12-8E field commences.
Pricing: Oil sold at Brent crude less a US$4/bbl discount for quality.
Opex: We assume operating costs of US$50m p.a. in CY14-16 with ~50% relating to
tariffs for processing and transportation through CNOOC-owned facilities. We assume fixed costs of US$20m p.a. and allow for US$10m p.a. for workovers to change out the electric submersible pumps (ESPs). We forecast opex to increase to US$70m p.a. from FY18 due to the start up of production from WZ12-8E with fixed operating costs of US$24m p.a. for an unmanned WHP and workovers every three years for the producing wells.
Amortisation: US$28/bbl.
Special oil gain levy: Charged at 20% starting at US$55/bbl increasing in US$5/bbl
increments to a maximum of 40% at US$75/bbl.
Tax: 30% company tax rate.
05 September 2014
Energy
Horizon Oil Limited
Wilson HTM Equities Research – Horizon Oil Limited 11
Maari/Manaia Fields, New Zealand
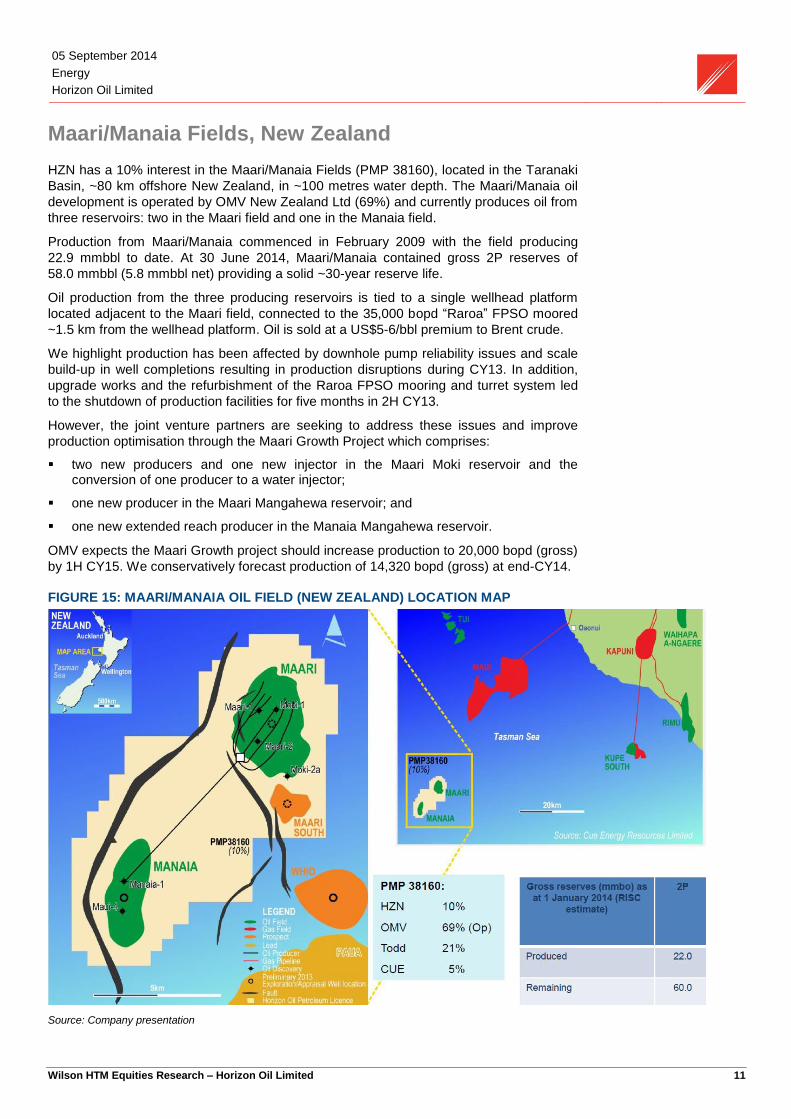
HZN has a 10% interest in the Maari/Manaia Fields (PMP 38160), located in the Taranaki
Basin, ~80 km offshore New Zealand, in ~100 metres water depth. The Maari/Manaia oil
development is operated by OMV New Zealand Ltd (69%) and currently produces oil from
three reservoirs: two in the Maari field and one in the Manaia field.
Production from Maari/Manaia commenced in February 2009 with the field producing
22.9 mmbbl to date. At 30 June 2014, Maari/Manaia contained gross 2P reserves of
58.0 mmbbl (5.8 mmbbl net) providing a solid ~30-year reserve life.
Oil production from the three producing reservoirs is tied to a single wellhead platform
located adjacent to the Maari field, connected to the 35,000 bopd “Raroa” FPSO moored
~1.5 km from the wellhead platform. Oil is sold at a US$5-6/bbl premium to Brent crude.
We highlight production has been affected by downhole pump reliability issues and scale
build-up in well completions resulting in production disruptions during CY13. In addition,
upgrade works and the refurbishment of the Raroa FPSO mooring and turret system led
to the shutdown of production facilities for five months in 2H CY13.
However, the joint venture partners are seeking to address these issues and improve
production optimisation through the Maari Growth Project which comprises:
two new producers and one new injector in the Maari Moki reservoir and the
conversion of one producer to a water injector;
one new producer in the Maari Mangahewa reservoir; and
one new extended reach producer in the Manaia Mangahewa reservoir.
OMV expects the Maari Growth project should increase production to 20,000 bopd (gross)
by 1H CY15. We conservatively forecast production of 14,320 bopd (gross) at end-CY14.
FIGURE 15: MAARI/MANAIA OIL FIELD (NEW ZEALAND) LOCATION MAP
Source: Company presentation

05 September 2014
Energy
Horizon Oil Limited
Wilson HTM Equities Research – Horizon Oil Limited 12
FIGURE 16: MAARI/MANAIA (PMP38160) SCEMATIC CROSS-SECTION
Source: Company presentation
FIGURE 17: MAARI/MANAIA PRODUCTION AND REVENUE
Source: Company data, Wilson HTM
Modelling and valuation assumptions
We value HZN’s Maari/Manaia project at A$152m ($0.13/sh) based on certified 2P
reserves of 58 mmbbl (gross) using a DCF methodology and 12% discount rate. Our key
modelling assumptions are reviewed below:
Capex: Gross capex of US$286m (~US$29m net) during FY14-16 for the Maari
Growth Project, remaining capitalised FPSO lease, recompletions and sustaining capex.
Production: We forecast oil production to peak at ~19,000 bopd in 1H CY15 driven
by the Maari Growth Project before declining at ~10% p.a.
0
20
40
60
80
100
120
140
0
50
100
150
200
250
300
350
400
2H13 1H14 2H14 1H15F 2H15F 1H16F 2H16F
Oil producton (mbbl) Revenue (US$/bbl) - RHS

05 September 2014
Energy
Horizon Oil Limited
Wilson HTM Equities Research – Horizon Oil Limited 13
Pricing: Oil sold at Brent crude plus US$5/bbl reflecting a quality premium.
Opex: We model operating costs of US$70m p.a. including fixed FPSO operating
costs and three workovers per year for electric submersible pump (ESP) changeouts.
Amortisation: US$12/bbl.
Royalty: 20% royalty consisting of an ad valorem royalty component (payable on
gross revenue) and an accounting profits royalty component (payable after cost recovery).
Tax: 28% company tax rate.

05 September 2014
Energy
Horizon Oil Limited
Wilson HTM Equities Research – Horizon Oil Limited 14
Papua New Guinea
HZN holds interests in 7,900 km2 of wet gas acreage in the Foreland Basin in the Western
Province of PNG. The company holds 30% in PDL 10 containing the Stanley
gas/condensate field (23.8 mmboe of 2P + 2C) and 27% in PRL 21, containing the
Elevala/Ketu/Tingu (EKT) gas/condensate fields (57.4 mmboe of 2P + 2C).
In May 2014, the PNG government granted the Stanley wet gas project with a production
development licence converting PRL 4 into PDL 10, allowing HZN to commence
development drilling with first condensate production expected in 2H CY16 with gas sales
to local customers expected shortly thereafter.
HZN is currently completing the FEED study for PRL 21 with a final investment decision
expected early CY15. The company is targeting first condensate production from PRL 21
in 2018 using a condensate stripping plant similar to the Stanley project in PDL 10.
However, with ~1.4 Tcf of gross 2C gas resource in PDL10 and PRL 21, the key prize is
monetising its gas resource by aggregating with other nearby fields (eg Talisman to the
south) to supply a mid-scale (2-4 Mtpa) LNG project requiring 2-4 Tcf of gas on Daru
Island on the Gulf of Papua. Another option is supplying gas to a potential third train (T3)
expansion of Exxon’s 6.9 Mtpa PNG LNG project near Port Moresby or the proposed
~5 Mtpa Total/InterOil Elk-Antelope LNG project, also near Port Moresby.
FIGURE 18: PNG ASSETS LOCATION MAP
Source: Company presentation

05 September 2014
Energy
Horizon Oil Limited
Wilson HTM Equities Research – Horizon Oil Limited 15
PDL 10, STANLEY GAS/CONDENSATE PROJECT
HZN holds a 30% interest in PDL 10 containing the Stanley wet gas field located ~40 km
north of Kiunga in the Western Province of PNG. Other joint venture partners include
Talisman Energy (operator, 40%), Osaka Gas (20%) and Mitsubishi Corp. (10%).
On 30 May 2014, the PNG government granted the Stanley Gas Project development
licence (PDL 10) and pipeline licence (PL 10), converting PRL 4 into PDL 10. Following
the development licence, HZN commenced development activities including the drilling of
the Stanley-3 and Stanley-5 development wells in August 2014, site preparation and
facilities construction. We note the PNG government may acquire up to a 22.5% interest
in the commercial development by reimbursing the participant partners for sunk costs
incurred.
The Stanley field contains a gross 2C resource of ~400 Bcf of gas and ~13 mmboe of
condensate. The project is expected to commence production in 2H CY16 at a rate of
~140 mmscf/d of gas plus recovery of ~4,000 bpd of condensate from two production
wells (Stanley-2 and Stanley-5) and two dry gas injection wells. Condensate will be
stripped from the wet gas using a two-train refrigeration plant with any unsold or unused
dry gas re-injected into the reservoir for enhanced recovery and sold at a later date.
Both the Stanley-2 and -5 production wells are complete and ready for production while
testing has indicated better-than-expected flow rates in excess of the 140 mmcf/d capacity
of the Stanley gas plant. In August 2014, Stanley-5 intersected ~96 metres of net pay with
a 24-hour flow rate of ~68 mmcf/d plus condensate at ~30 bbl per mmscf. We understand
the final Stanley-3 injection well was also recently spudded.
Condensate will be transported via a 6 inch, 40 km pipeline to a 60,000 bbl storage facility
at Kiunga on the Fly River before being shipped in 33,000 bbl capacity tankers (custom
designed and chartered by P&O) ~1 km downstream from the existing Kiunga wharf to
regional customers. We understand condensate will initially be sold to Trafigura’s Napa
Napa Refinery (Port Moresby) with additional cargos sold to the Singapore trading market.
FIGURE 19: PDL 10 (STANLEY FIELD) DEVELOPMENT CONCEPT
Source: Company presentation

05 September 2014
Energy
Horizon Oil Limited
Wilson HTM Equities Research – Horizon Oil Limited 16
Stanley project capex
RISC (HZN’s independent technical expert) has estimated gross capex of US$381m
(US$114m net at 30%) for the Stanley gas/condensate stripping project which we assume
for our Stanley project valuation. As shown below, the majority of the capex relates to the
gas plant with a 140 mmcf/d capacity using 2 x 50% gas processing trains.
TABLE 3: STANLEY GAS/CONDENSATE PROJECT CAPEX (GROSS)
Source: RISC, Wilson HTM
Stanley Project modelling and valuation assumptions
We value HZN’s 30% interest in the Stanley gas project at A$137m or $0.12/sh risked at
75%. Our valuation is derived using a DCF methodology (13% WACC) and assumes
~4,000 bpd of condensate sales from 2H CY16 and ~140 mmscf/d of gas sales from 1H
CY20. Our key modelling assumptions are discussed below:
Capex: Gross project capex of US$381m for two production wells, two injection wells,
the two train gas refrigeration plant, pipelines and storage tanks.
Production: Condensate sales of 4 kbpd (gross) commencing in 2H CY16 based on
13 mmbbl of condensate (gross 2P+2C). We assume gas production of ~140 mmscf/d is reinjected after condensate stripping before gas sales commence in 1H CY20 to supply a third party LNG project such as T3 of PNG LNG.
Pricing: Condensate sold at Brent crude oil pricing and gas sold at Australian east
coast LNG netback pricing (US$9/GJ in 1H CY20).
Opex: Operating costs of US$26m p.a. including condensate transport costs.
Royalty: 2% royalty to landowners, affected provincial governments and local level
governments calculated on a “wellhead value” basis plus a development levy of 2% of the wellhead value to the provincial governments and the local level governments.
Tax: 30% company tax rate.
Recent transaction resource multiple supports DCF valuation
Based on recent transactions for undeveloped PNG gas (Table 5), we calculate a median
resource multiple of US$4.35/boe (A$4.72/boe at US0.92). Applying this multiple to HZN’s
2P reserve plus 2C resource of 24.2 mmboe, we calculate a Stanley valuation of A$113m
or $0.10/sh, which supports our DCF valuation above.
Item US$m
Project Management and Supervision 15
Stanley Gas Plant 221
Pipeline 40
Kiunga Storage and Loadout facilities 27
Wells (including stack costs) 78
Total Capital Cost 381
Abandonment 38
Annual operating costs 26

05 September 2014
Energy
Horizon Oil Limited
Wilson HTM Equities Research – Horizon Oil Limited 17
PNG GAS COMMERCIALISATION OPTIONS
At present, no gas supply agreements from PDL 10 or PRL 21 have been contracted
although there are several gas commercialisation options available to HZN which we
review below.
Gas supply for power generation to nearby copper-gold mines
We understand HZN is in negotiations to supply ~3 PJa (~8 mmcf/d) of gas for power
generation to the Ok Tedi copper-gold mine located ~100 km to the north). Under this
scenario, HZN would supply dry gas to a small gas-fired power station to be constructed
adjacent to the Stanley Field with electricity transmitted to the Ok Tedi mine site to
displace diesel fuel. We understand that by switching from diesel fuel to electricity Ok Tedi
would reduce operating costs by approx. US$50m p.a.
Another option is supplying gas for power generation to be used at PanAust’s proposed
US$1.8bn Frieda River project, one of the world’s largest undeveloped copper gold
deposits. In August 2014 PanAust acquired an 80% interest in the project from Xstrata
and is expected to complete the feasibility study mid-CY15. We do not expect production
to start until ~2019.
However, we estimate that any gas sales for power generation are likely to be small at
around 20 mmcf/d, a fraction of the ~140 mmcf/d to be produced from Stanley.
Mid-scale (2-4 Mtpa) LNG project
Another potential option is for the ~1.4 Tcf (gross) 2C gas resource at Stanley (PDL 10)
and EKT (PRL 21) to underpin a mid-scale (2-4) Mtpa LNG project on Daru Island on the
Gulf of Papua. However, to secure the required 2-4 Tcf gas resource, HZN (and its joint
venture partners) would need to aggregate its resource with other fields in the Western
Province. We assume a final investment decision for an LNG project is reached in FY17
upon which HZN will receive a US$130m cash payment from Osaka Gas for the 40%
interest acquired in May 2013.
Assuming capex intensity of US$800/t for a barge-mounted LNG facility with river shuttle
tankers, a 4 Mtpa LNG project would cost ~US$2.4bn. Given the significant capex of
US$288m for HZN (assuming ~12% net interest), we currently do not assume HZN is an
equity participant despite the US$130m payment from Osaka Gas. However, HZN’s joint
venture partners Talisman, Osaka Gas and Mitsubishi should be able to fund an LNG
plant, in our view.
Gas sold to a third party LNG project
HZN could also supply gas to third party LNG projects such as the PNG LNG project
(Exxon, Oil Search, Santos) which is studying a potential third train (T3) expansion from
6.9 Mtpa to ~10.2 Mtpa underpinned by fields such as the 2.5 Tcf P’nyang field (PRL 3)
north of Stanley. We understand the PNG LNG partners are continuing development work
for P’nyang (PRL 3) with the aim of submitting a production development licence
application early CY15. In the event a pipeline is built from P’nyang (in the highlands)
down to the EKT Fields in the forelands, HZN would be well positioned to connect its
Stanley and EKT fields into the PNG LNG pipeline infrastructure.
Total SA and InterOil Corporation are also proposing a second LNG project in PNG near
Port Moresby to be supplied by the ~7 Tcf Elk-Antelope fields. In March 2014 Total
acquired a 40.1% interest in PRL 15 (the Elk-Antelope fields) from InterOil Corporation for
up to US$1.62bn. We believe a second LNG project in PNG will increase gas demand in
PNG and bodes well for undeveloped and uncontracted gas from fields such Stanley/EKT.
Wilson HTM view
We assume gas sales from Stanley (PDL 10) and the EKT fields (PRL 21) commence in
CY20 is sold to a mid-scale LNG project on Daru Island or possibly a T3 expansion of
PNG LNG near Port Moresby. As mentioned, at this stage we do not expect HZN to hold
an equity interest in a downstream LNG project given the substantial capex. We note HZN
may be able to secure earlier gas sales for power generation to Ok Tedi and Frieda River
(from CY19) although we expect any volumes to be small at ~20 mmscf/d.

05 September 2014
Energy
Horizon Oil Limited
Wilson HTM Equities Research – Horizon Oil Limited 18
PRL 21 (ELEVALA/KETU/TINGU)
HZN operates and holds a 27% interest in PRL 21 containing the Elevala, Ketu and Tingu
gas/condensate fields with gross 2C resource of 979 Bcf of gas (264 Bcf net to HZN) and
50 mmbbl of condensate (13.4 mmbbl net to HZN). Note that HZN’s interest will reduce to
20.93% assuming the PNG government exercises its back-in rights.
Other joint venture partners in PRL 21, located adjacent to PDL 10 are Osaka Gas (18%),
Talisman Energy (32.5%), Kina Petroleum (15%) and Mitsubishi Corporation (7.5%).
HZN is advancing the PRL 21 FEED study with a final investment decision targeted for
early CY15. In June 2014, HZN also submitted the environmental impact statement to the
Department of Environment and Conservation.
We understand the PRL 21 development concept is similar to Stanley although will be
larger with average annual gas production of ~210 mmcf/d (140 mmscf/d from Elevala
and 70 mmscf/d from Ketu) with a central processing facility for all production wells and
with condensate stripping on-site and transported to the Kiunga storage load-out facility
via a proposed pipeline from the project site.
According to HZN, the Elevala and Ketu fields have a higher condensate-gas ratio (CGR)
than the Stanley Field (30 bbl per mmscf) with Elevala gas yielding 52 bbl per mmscf and
Ketu yielding 57 bbl per mmscf which helps improve project economics.
FIGURE 20: PRL 21 DEVELOPMENT CONCEPT
Source: Company presentation

05 September 2014
Energy
Horizon Oil Limited
Wilson HTM Equities Research – Horizon Oil Limited 19
PRL 21 development plan
According to RISC, the PRL 21 development will include a liquids stripping project with
two producers and two injectors in Elevala and one producer in Ketu in addition to a gas
plant with three production trains and total production and injection capacity of 240
mmscf/d (~210 mmscf/d annualised capacity including downtime).
Similar to Stanley, condensate will be exported via a 60 km pipeline to a new storage and
ship loading facility located at Drimdemasuk on the Fly River (north of Kiunga) while gas
sales are forecast to commence in FY20.
PRL 21 project capex
RISC (HZN’s independent technical expert) has estimated gross capex of US$1,135m
(US$306m net to HZN at 27%) for the PRL 21 (Elevala/Ketu/Tingu) gas/condensate
stripping project which we assume for our project valuation. As shown below, the majority
of the capex relates to the three-train gas processing plant, 60 km pipeline, drilling and
completing five wells and a 20% contingency. We also assume operating costs of
~US$50m per year including condensate transport costs.
We assume the majority of the $1.1bn in capex is spent in FY17-18 with first condensate
production in FY19 and gas sales in FY20.
TABLE 4: PRL 21 (ELEVALA/KETU) PROJECT CAPEX (GROSS)
Source: RISC, Wilson HTM
PRL 21 (Elevala/Ketu/Tingu) modelling and valuation assumptions
We value HZN’s 27% interest in PRL 21 at A$115m or $0.10/sh, risked at 50% as PRL 21
remains in the FEED stage with a final investment decision not expected until 2015 in
addition to accounting for uncertainty relating to government approvals, development
delays, geological and funding risks. We highlight that the significant development capex
of $1.1bn to be spent during FY14-18 weighs heavily on our DCF valuation. Our key
modelling assumptions are discussed below:
Capex: Gross project capex of US$1,135m for three production wells, two injection
wells, the three train gas refrigeration plant, pipelines and storage tanks.
Production: Condensate sales of 11,270 bpd (gross) commencing in 1H CY19 based
on 50 mmbbl of 2C condensate resource (gross) and a CGR of ~54 bbl per mmcf. We assume gas production of ~210 mmscf/d is reinjected after condensate stripping with gas sales commencing in 1H CY20 to supply a third party LNG project such as T3 of PNG LNG.
Pricing: Condensate sold at Brent crude oil pricing and gas sold at Australian east
coast LNG netback pricing (US$9/GJ in FY17).
Opex: Operating costs of US$50m p.a. including condensate transport costs.
Royalty: 2% royalty to landowners, affected provincial governments and local level
governments calculated on a “wellhead value” basis plus a development levy of 2% of the wellhead value to the provincial governments and the local level governments.
Tax: 30% company tax rate.
Item US$m
Development planning 60
Gas Plant 390
Pipeline 210
Terminal, Storage and Loadout facilities 40
Roads 55
HSE, Regulatory, PM and Owners costs 55
Contingency (20%) 149
Wells (5) 175
Total Capital Cost 1135
05 September 2014
Energy
Horizon Oil Limited
Wilson HTM Equities Research – Horizon Oil Limited 20
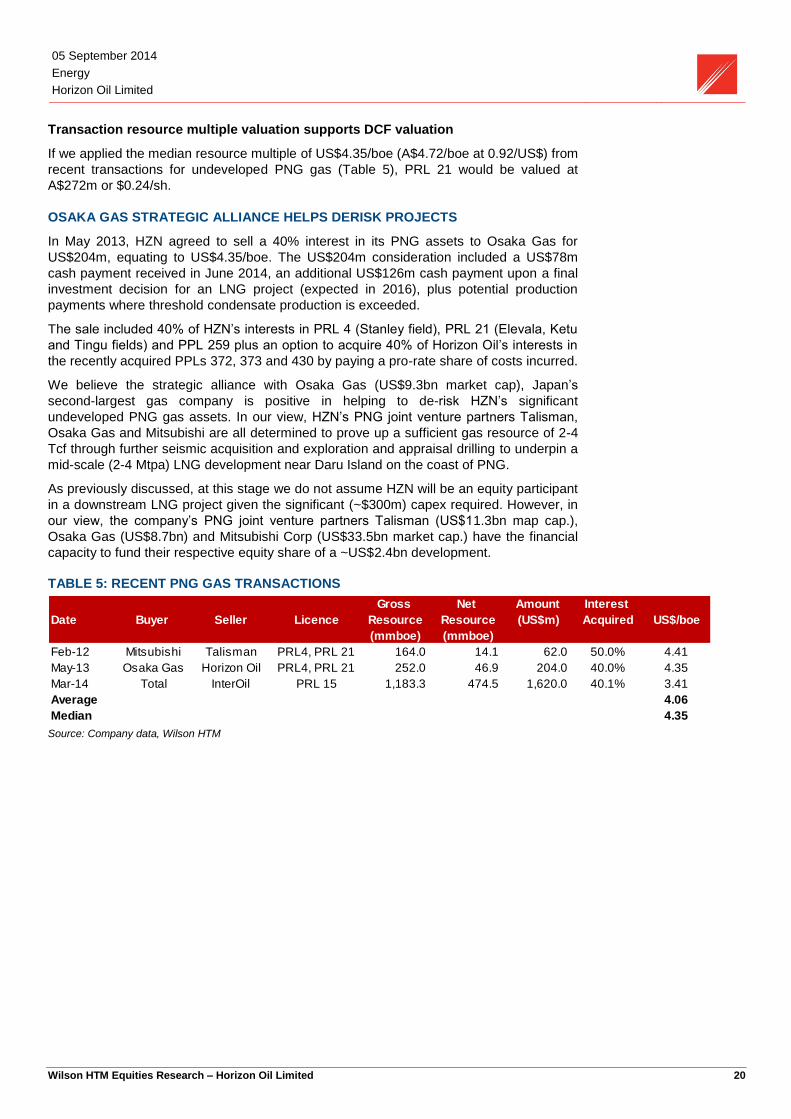
Transaction resource multiple valuation supports DCF valuation
If we applied the median resource multiple of US$4.35/boe (A$4.72/boe at 0.92/US$) from
recent transactions for undeveloped PNG gas (Table 5), PRL 21 would be valued at
A$272m or $0.24/sh.
OSAKA GAS STRATEGIC ALLIANCE HELPS DERISK PROJECTS
In May 2013, HZN agreed to sell a 40% interest in its PNG assets to Osaka Gas for
US$204m, equating to US$4.35/boe. The US$204m consideration included a US$78m
cash payment received in June 2014, an additional US$126m cash payment upon a final
investment decision for an LNG project (expected in 2016), plus potential production
payments where threshold condensate production is exceeded.
The sale included 40% of HZN’s interests in PRL 4 (Stanley field), PRL 21 (Elevala, Ketu
and Tingu fields) and PPL 259 plus an option to acquire 40% of Horizon Oil’s interests in
the recently acquired PPLs 372, 373 and 430 by paying a pro-rate share of costs incurred.
We believe the strategic alliance with Osaka Gas (US$9.3bn market cap), Japan’s
second-largest gas company is positive in helping to de-risk HZN’s significant
undeveloped PNG gas assets. In our view, HZN’s PNG joint venture partners Talisman,
Osaka Gas and Mitsubishi are all determined to prove up a sufficient gas resource of 2-4
Tcf through further seismic acquisition and exploration and appraisal drilling to underpin a
mid-scale (2-4 Mtpa) LNG development near Daru Island on the coast of PNG.
As previously discussed, at this stage we do not assume HZN will be an equity participant
in a downstream LNG project given the significant (~$300m) capex required. However, in
our view, the company’s PNG joint venture partners Talisman (US$11.3bn map cap.),
Osaka Gas (US$8.7bn) and Mitsubishi Corp (US$33.5bn market cap.) have the financial
capacity to fund their respective equity share of a ~US$2.4bn development.
TABLE 5: RECENT PNG GAS TRANSACTIONS
Source: Company data, Wilson HTM
Gross Net Amount Interest
Date Buyer Seller Licence Resource Resource (US$m) Acquired US$/boe
(mmboe) (mmboe)
Feb-12 Mitsubishi Talisman PRL4, PRL 21 164.0 14.1 62.0 50.0% 4.41
May-13 Osaka Gas Horizon Oil PRL4, PRL 21 252.0 46.9 204.0 40.0% 4.35
Mar-14 Total InterOil PRL 15 1,183.3 474.5 1,620.0 40.1% 3.41
Average 4.06
Median 4.35

05 September 2014
Energy
Horizon Oil Limited
Wilson HTM Equities Research – Horizon Oil Limited 21
Financial analysis
EARNINGS
In FY14, HZN achieved reported NPAT of $12.8m (versus $3.5m in FY13) driven by
significantly higher production (+185% versus pcp) leading to revenue of $144.3m.
Reported NPAT was also boosted by a $23.8m gain on the partial sale of its 40%
interests in its PNG assets to Osaka Gas. FY14 EBITDAX came in at $99.5m while EBIT
was $48.9m.
In FY14, production costs increased to US$31m, amortisation rose to US$39.4m and
royalties (including Chinese special oil income levy) increased to US$22.3m reflecting a
full year’s contribution from Block 22/12 (China) versus approx. four months in FY13 in
addition to higher production costs at Maari (New Zealand) due to remediation and
upgrade works completed during 1H FY14.
In FY15e, we forecast EBITDA of $140m and NPAT of $48.6m due to higher revenue of
$193m driven by a 28% increase in production and stable normalised production costs.
TABLE 6: INCOME STATEMENT
Source: Company data, Wilson HTM
CASH FLOWS
HZN generated $65m of operating cash flow in FY14 which we forecast to remain fairly
stable at $60m in FY15e and $54m in FY16e. We forecast exploration and development
capex of $107m in FY15e and $81m in FY16e mainly relating to the Stanley gas project in
PDL 10 to be funded by existing cash on and hand of $98.9m and operating cash flows.
We also assume HZN receives the remaining $130m payment from Osaka Gas in
FY17 upon a final investment decision of an LNG development using gas from PDL 10
and PRL 21.
Capex is forecast to increase to $139m in FY17e and $177m in FY18e driven by the
development of PRL 21 which we assume will be funded by a drawdown of the company’s
expanded debt facilities at the time.
As shown in Figure 21, we expect free cash flow generation of ~$150m from FY20 as
capex for PDL 10 and PRL 21 has been spent and production significantly increases due
to the commence of gas sales to a third party LNG project.
Income Statement FY12 FY13 FY14 FY15F FY16F FY17F FY18F
Oil and gas sales US$m 50.2 50.9 144.3 193.1 184.6 197.7 190.9
Total revenue US$m 50.2 50.9 144.3 193.1 184.6 197.7 190.9
Production costs US$m (9.5) (12.1) (31.0) (21.5) (21.5) (29.3) (29.3)
Royalties and other levies US$m (0.1) (2.6) (22.3) (13.5) (13.8) (12.2) (10.9)
Amortisation US$m (7.6) (8.6) (39.4) (41.5) (40.2) (38.5) (38.5)
Cost of Sales US$m (16.9) (22.7) (92.7) (76.5) (75.4) (80.0) (78.6)
Gross Profit US$m 33.5 25.4 45.7 116.6 109.2 117.7 112.3
EBIT US$m 29.6 18.2 48.7 98.3 90.6 99.0 93.5
Net finance costs US$m (5.9) (8.2) (18.7) (9.6) (7.8) (7.0) (12.8)
Profit before tax US$m 23.7 10.0 30.0 88.7 82.8 92.0 80.7
Tax US$m (8.8) (2.6) (17.5) (26.6) (24.8) (27.6) (24.2)
Underlying NPAT US$m 7.6 3.5 12.8 48.6 44.2 52.2 45.6
EBITDAX US$m 37.5 27.4 98.6 149.8 140.8 147.6 141.9
EBITDA US$m 37.2 26.8 88.1 139.8 130.8 137.6 131.9
Per barrel metrics FY12 FY13 FY14 FY15F FY16F FY17F FY18F
Revenue/boe US$/boe 114.3 101.0 100.6 105.5 102.7 101.1 99.3
Production costs/boe US$/boe 21.6 24.0 21.6 11.7 11.9 15.0 15.2
Royalties/boe US$/boe 0.2 5.2 15.5 7.4 7.7 6.2 5.6
DD&A/boe US$/boe 17.3 17.0 27.5 22.7 22.4 19.7 20.0
P&L/boe US$/boe 17.4 6.9 8.9 26.5 24.6 26.7 23.7
05 September 2014
Energy
Horizon Oil Limited
Wilson HTM Equities Research – Horizon Oil Limited 22
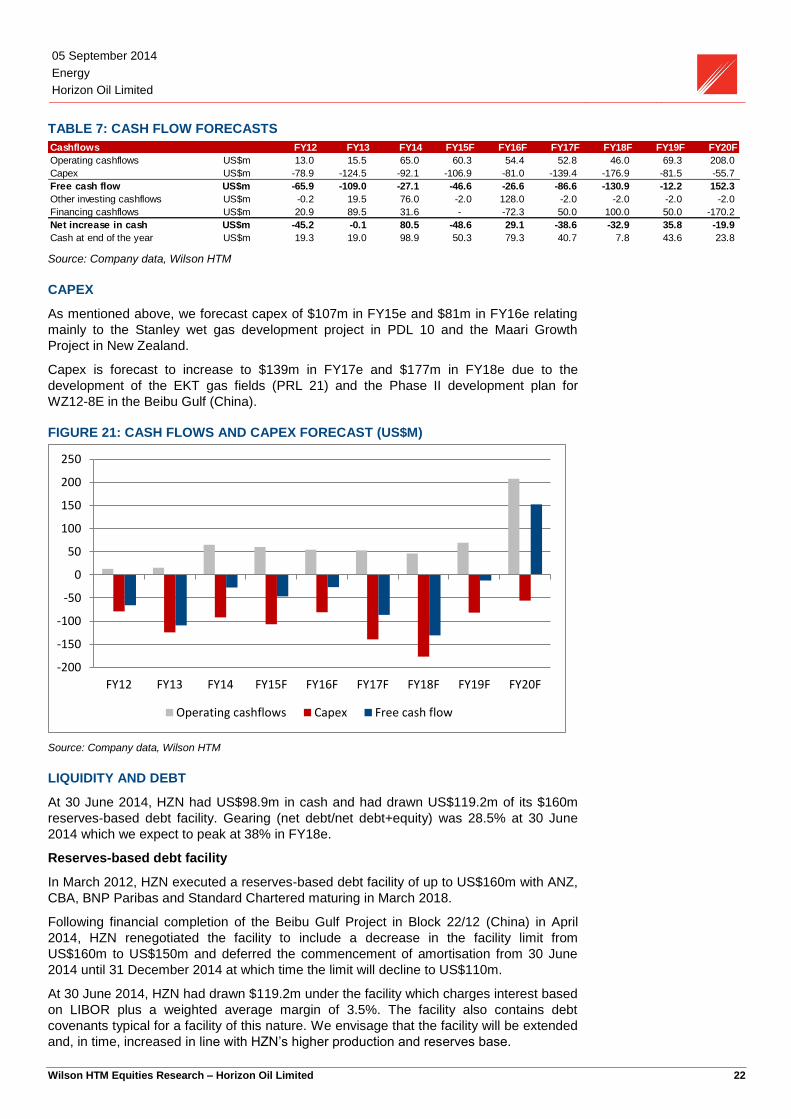
TABLE 7: CASH FLOW FORECASTS
Source: Company data, Wilson HTM
CAPEX
As mentioned above, we forecast capex of $107m in FY15e and $81m in FY16e relating
mainly to the Stanley wet gas development project in PDL 10 and the Maari Growth
Project in New Zealand.
Capex is forecast to increase to $139m in FY17e and $177m in FY18e due to the
development of the EKT gas fields (PRL 21) and the Phase II development plan for
WZ12-8E in the Beibu Gulf (China).
FIGURE 21: CASH FLOWS AND CAPEX FORECAST (US$M)
Source: Company data, Wilson HTM
LIQUIDITY AND DEBT
At 30 June 2014, HZN had US$98.9m in cash and had drawn US$119.2m of its $160m
reserves-based debt facility. Gearing (net debt/net debt+equity) was 28.5% at 30 June
2014 which we expect to peak at 38% in FY18e.
Reserves-based debt facility
In March 2012, HZN executed a reserves-based debt facility of up to US$160m with ANZ,
CBA, BNP Paribas and Standard Chartered maturing in March 2018.
Following financial completion of the Beibu Gulf Project in Block 22/12 (China) in April
2014, HZN renegotiated the facility to include a decrease in the facility limit from
US$160m to US$150m and deferred the commencement of amortisation from 30 June
2014 until 31 December 2014 at which time the limit will decline to US$110m.
At 30 June 2014, HZN had drawn $119.2m under the facility which charges interest based
on LIBOR plus a weighted average margin of 3.5%. The facility also contains debt
covenants typical for a facility of this nature. We envisage that the facility will be extended
and, in time, increased in line with HZN’s higher production and reserves base.
Cashflows FY12 FY13 FY14 FY15F FY16F FY17F FY18F FY19F FY20F
Operating cashflows US$m 13.0 15.5 65.0 60.3 54.4 52.8 46.0 69.3 208.0
Capex US$m -78.9 -124.5 -92.1 -106.9 -81.0 -139.4 -176.9 -81.5 -55.7
Free cash flow US$m -65.9 -109.0 -27.1 -46.6 -26.6 -86.6 -130.9 -12.2 152.3
Other investing cashflows US$m -0.2 19.5 76.0 -2.0 128.0 -2.0 -2.0 -2.0 -2.0
Financing cashflows US$m 20.9 89.5 31.6 - -72.3 50.0 100.0 50.0 -170.2
Net increase in cash US$m -45.2 -0.1 80.5 -48.6 29.1 -38.6 -32.9 35.8 -19.9
Cash at end of the year US$m 19.3 19.0 98.9 50.3 79.3 40.7 7.8 43.6 23.8
-200
-150
-100
-50
0
50
100
150
200
250
FY12 FY13 FY14 FY15F FY16F FY17F FY18F FY19F FY20F
Operating cashflows Capex Free cash flow

05 September 2014
Energy
Horizon Oil Limited
Wilson HTM Equities Research – Horizon Oil Limited 23
Convertible bonds
In June 2011, HZN issued US$80m of convertible bonds with a 5.5% p.a. coupon,
payable semi-annually in arrears, maturing on 17 June 2016 when the bonds will be
redeemed at 108.80% of their principal amount (7% yield to maturity).
The bonds were issued with an initial conversion price of US$0.52, equivalent to
A$0.55/sh (based on a USD/AUD of $0.94) although subsequent share issues resulted in
the conversion price lowering to US$0.409/sh as at 31 December 2013. At 30 June 2014,
no bonds had been converted and we assume the bonds are repaid in June 2016.
TABLE 8: NET DEBT AND GEARING RATIOS
Source: Company data, Wilson HTM
FIGURE 22: NET DEBT (US$M) AND GEARING FORECAST
Source: Company data, Wilson HTM
Gearing FY12 FY13 FY14 FY15F FY16F FY17F FY18F FY19F FY20F
Net Debt (cash) US$m 81.4 176.5 88.5 137.2 35.8 124.4 257.3 271.5 141.3
Net Debt / Equity % 50.4% 105.7% 39.8% 50.6% 11.3% 33.8% 62.3% 56.2% 22.0%
Net Debt / (Equity+Net Debt) % 33.5% 51.4% 28.5% 33.6% 10.2% 25.3% 38.4% 36.0% nm
Interest cover (x) (EBITDA) x -6.3x -3.3x -4.7x -14.6x -16.7x -19.6x -10.3x -10.2x -31.3x
Interest cover (x) (EBIT) x -5.0x -2.2x -2.6x -10.3x -11.6x -14.1x -7.3x -7.6x -24.3x
0%
10%
20%
30%
40%
50%
60%
0
50
100
150
200
250
300
FY12 FY13 FY14 FY15F FY16F FY17F FY18F FY19F FY20F
Net Debt (cash) Gearing (RHS)
05 September 2014
Energy
Horizon Oil Limited
Wilson HTM Equities Research – Horizon Oil Limited 24
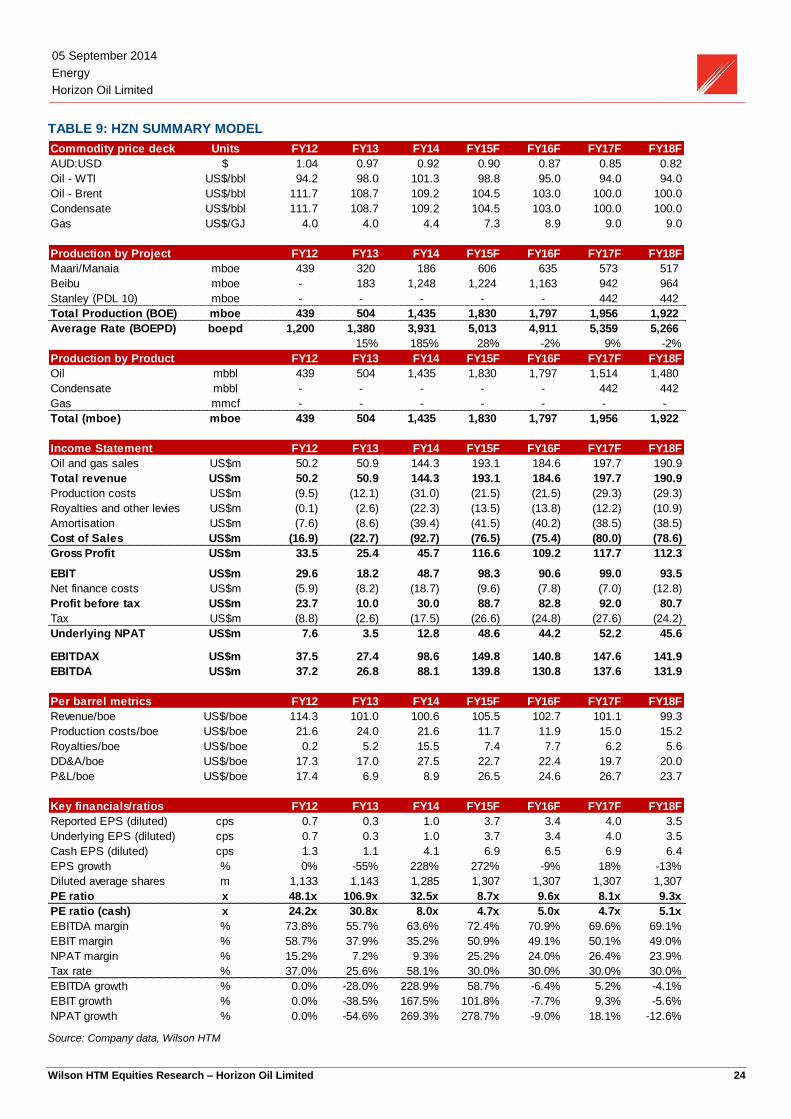
TABLE 9: HZN SUMMARY MODEL
Source: Company data, Wilson HTM
Commodity price deck Units FY12 FY13 FY14 FY15F FY16F FY17F FY18F
AUD:USD $ 1.04 0.97 0.92 0.90 0.87 0.85 0.82
Oil - WTI US$/bbl 94.2 98.0 101.3 98.8 95.0 94.0 94.0
Oil - Brent US$/bbl 111.7 108.7 109.2 104.5 103.0 100.0 100.0
Condensate US$/bbl 111.7 108.7 109.2 104.5 103.0 100.0 100.0
Gas US$/GJ 4.0 4.0 4.4 7.3 8.9 9.0 9.0
Production by Project FY12 FY13 FY14 FY15F FY16F FY17F FY18F
Maari/Manaia mboe 439 320 186 606 635 573 517
Beibu mboe - 183 1,248 1,224 1,163 942 964
Stanley (PDL 10) mboe - - - - - 442 442
Total Production (BOE) mboe 439 504 1,435 1,830 1,797 1,956 1,922
Average Rate (BOEPD) boepd 1,200 1,380 3,931 5,013 4,911 5,359 5,266
15% 185% 28% -2% 9% -2%
Production by Product FY12 FY13 FY14 FY15F FY16F FY17F FY18F
Oil mbbl 439 504 1,435 1,830 1,797 1,514 1,480
Condensate mbbl - - - - - 442 442
Gas mmcf - - - - - - -
Total (mboe) mboe 439 504 1,435 1,830 1,797 1,956 1,922
Income Statement FY12 FY13 FY14 FY15F FY16F FY17F FY18F
Oil and gas sales US$m 50.2 50.9 144.3 193.1 184.6 197.7 190.9
Total revenue US$m 50.2 50.9 144.3 193.1 184.6 197.7 190.9
Production costs US$m (9.5) (12.1) (31.0) (21.5) (21.5) (29.3) (29.3)
Royalties and other levies US$m (0.1) (2.6) (22.3) (13.5) (13.8) (12.2) (10.9)
Amortisation US$m (7.6) (8.6) (39.4) (41.5) (40.2) (38.5) (38.5)
Cost of Sales US$m (16.9) (22.7) (92.7) (76.5) (75.4) (80.0) (78.6)
Gross Profit US$m 33.5 25.4 45.7 116.6 109.2 117.7 112.3
EBIT US$m 29.6 18.2 48.7 98.3 90.6 99.0 93.5
Net finance costs US$m (5.9) (8.2) (18.7) (9.6) (7.8) (7.0) (12.8)
Profit before tax US$m 23.7 10.0 30.0 88.7 82.8 92.0 80.7
Tax US$m (8.8) (2.6) (17.5) (26.6) (24.8) (27.6) (24.2)
Underlying NPAT US$m 7.6 3.5 12.8 48.6 44.2 52.2 45.6
EBITDAX US$m 37.5 27.4 98.6 149.8 140.8 147.6 141.9
EBITDA US$m 37.2 26.8 88.1 139.8 130.8 137.6 131.9
Per barrel metrics FY12 FY13 FY14 FY15F FY16F FY17F FY18F
Revenue/boe US$/boe 114.3 101.0 100.6 105.5 102.7 101.1 99.3
Production costs/boe US$/boe 21.6 24.0 21.6 11.7 11.9 15.0 15.2
Royalties/boe US$/boe 0.2 5.2 15.5 7.4 7.7 6.2 5.6
DD&A/boe US$/boe 17.3 17.0 27.5 22.7 22.4 19.7 20.0
P&L/boe US$/boe 17.4 6.9 8.9 26.5 24.6 26.7 23.7
Key financials/ratios FY12 FY13 FY14 FY15F FY16F FY17F FY18F
Reported EPS (diluted) cps 0.7 0.3 1.0 3.7 3.4 4.0 3.5
Underlying EPS (diluted) cps 0.7 0.3 1.0 3.7 3.4 4.0 3.5
Cash EPS (diluted) cps 1.3 1.1 4.1 6.9 6.5 6.9 6.4
EPS growth % 0% -55% 228% 272% -9% 18% -13%
Diluted average shares m 1,133 1,143 1,285 1,307 1,307 1,307 1,307
PE ratio x 48.1x 106.9x 32.5x 8.7x 9.6x 8.1x 9.3x
PE ratio (cash) x 24.2x 30.8x 8.0x 4.7x 5.0x 4.7x 5.1x
EBITDA margin % 73.8% 55.7% 63.6% 72.4% 70.9% 69.6% 69.1%
EBIT margin % 58.7% 37.9% 35.2% 50.9% 49.1% 50.1% 49.0%
NPAT margin % 15.2% 7.2% 9.3% 25.2% 24.0% 26.4% 23.9%
Tax rate % 37.0% 25.6% 58.1% 30.0% 30.0% 30.0% 30.0%
EBITDA growth % 0.0% -28.0% 228.9% 58.7% -6.4% 5.2% -4.1%
EBIT growth % 0.0% -38.5% 167.5% 101.8% -7.7% 9.3% -5.6%
NPAT growth % 0.0% -54.6% 269.3% 278.7% -9.0% 18.1% -12.6%
05 September 2014
Energy
Horizon Oil Limited
Wilson HTM Equities Research – Horizon Oil Limited 25
TABLE 10: HZN SUMMARY MODEL
Source: Company data, Wilson HTM
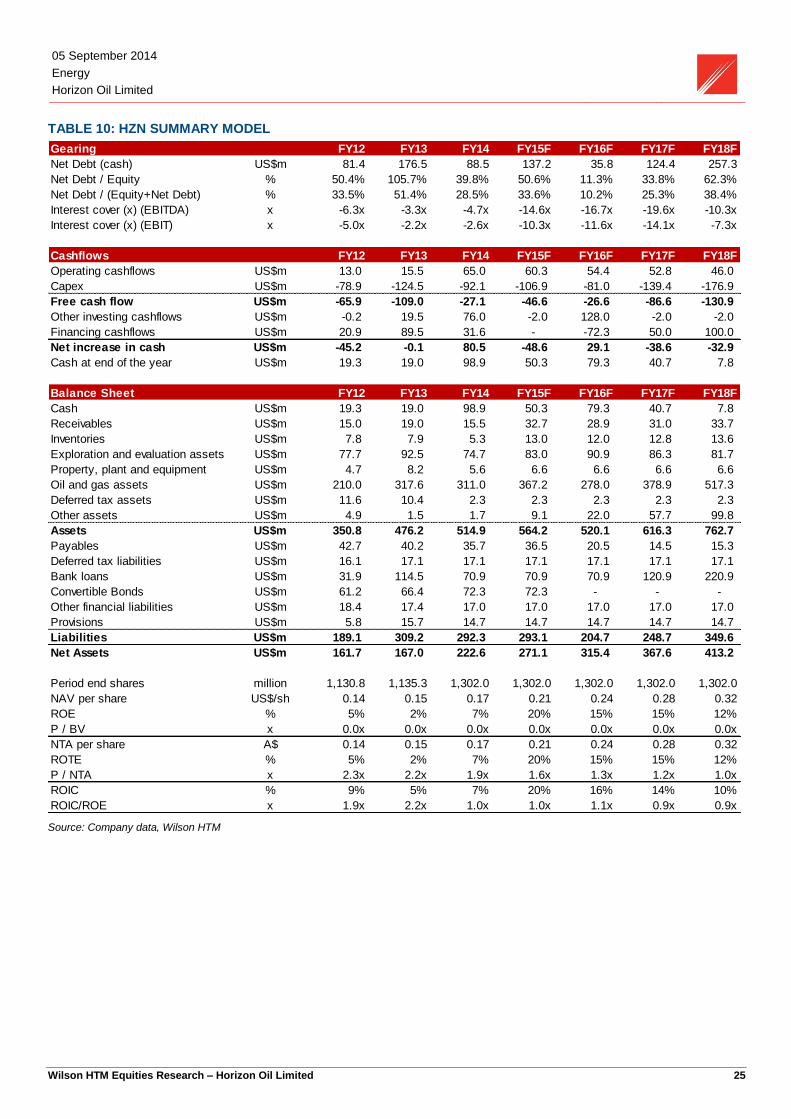
Gearing FY12 FY13 FY14 FY15F FY16F FY17F FY18F
Net Debt (cash) US$m 81.4 176.5 88.5 137.2 35.8 124.4 257.3
Net Debt / Equity % 50.4% 105.7% 39.8% 50.6% 11.3% 33.8% 62.3%
Net Debt / (Equity+Net Debt) % 33.5% 51.4% 28.5% 33.6% 10.2% 25.3% 38.4%
Interest cover (x) (EBITDA) x -6.3x -3.3x -4.7x -14.6x -16.7x -19.6x -10.3x
Interest cover (x) (EBIT) x -5.0x -2.2x -2.6x -10.3x -11.6x -14.1x -7.3x
Cashflows FY12 FY13 FY14 FY15F FY16F FY17F FY18F
Operating cashflows US$m 13.0 15.5 65.0 60.3 54.4 52.8 46.0
Capex US$m -78.9 -124.5 -92.1 -106.9 -81.0 -139.4 -176.9
Free cash flow US$m -65.9 -109.0 -27.1 -46.6 -26.6 -86.6 -130.9
Other investing cashflows US$m -0.2 19.5 76.0 -2.0 128.0 -2.0 -2.0
Financing cashflows US$m 20.9 89.5 31.6 - -72.3 50.0 100.0
Net increase in cash US$m -45.2 -0.1 80.5 -48.6 29.1 -38.6 -32.9
Cash at end of the year US$m 19.3 19.0 98.9 50.3 79.3 40.7 7.8
Balance Sheet FY12 FY13 FY14 FY15F FY16F FY17F FY18F
Cash US$m 19.3 19.0 98.9 50.3 79.3 40.7 7.8
Receivables US$m 15.0 19.0 15.5 32.7 28.9 31.0 33.7
Inventories US$m 7.8 7.9 5.3 13.0 12.0 12.8 13.6
Exploration and evaluation assets US$m 77.7 92.5 74.7 83.0 90.9 86.3 81.7
Property, plant and equipment US$m 4.7 8.2 5.6 6.6 6.6 6.6 6.6
Oil and gas assets US$m 210.0 317.6 311.0 367.2 278.0 378.9 517.3
Deferred tax assets US$m 11.6 10.4 2.3 2.3 2.3 2.3 2.3
Other assets US$m 4.9 1.5 1.7 9.1 22.0 57.7 99.8
Assets US$m 350.8 476.2 514.9 564.2 520.1 616.3 762.7
Payables US$m 42.7 40.2 35.7 36.5 20.5 14.5 15.3
Deferred tax liabilities US$m 16.1 17.1 17.1 17.1 17.1 17.1 17.1
Bank loans US$m 31.9 114.5 70.9 70.9 70.9 120.9 220.9
Convertible Bonds US$m 61.2 66.4 72.3 72.3 - - -
Other financial liabilities US$m 18.4 17.4 17.0 17.0 17.0 17.0 17.0
Provisions US$m 5.8 15.7 14.7 14.7 14.7 14.7 14.7
Liabilities US$m 189.1 309.2 292.3 293.1 204.7 248.7 349.6
Net Assets US$m 161.7 167.0 222.6 271.1 315.4 367.6 413.2
Period end shares million 1,130.8 1,135.3 1,302.0 1,302.0 1,302.0 1,302.0 1,302.0
NAV per share US$/sh 0.14 0.15 0.17 0.21 0.24 0.28 0.32
ROE % 5% 2% 7% 20% 15% 15% 12%
P / BV x 0.0x 0.0x 0.0x 0.0x 0.0x 0.0x 0.0x
NTA per share A$ 0.14 0.15 0.17 0.21 0.24 0.28 0.32
ROTE % 5% 2% 7% 20% 15% 15% 12%
P / NTA x 2.3x 2.2x 1.9x 1.6x 1.3x 1.2x 1.0x
ROIC % 9% 5% 7% 20% 16% 14% 10%
ROIC/ROE x 1.9x 2.2x 1.0x 1.0x 1.1x 0.9x 0.9x

05 September 2014
Energy
Horizon Oil Limited
Wilson HTM Equities Research – Horizon Oil Limited 26
Risks
Commodity price risk
Lower-than-expected oil, condensate and gas prices will negatively impact HZN’s
revenue, profitability, cash flows and valuation. Oil and gas prices have been historically
volatile and are driven by fluctuations in supply and demand. We forecast Brent crude oil
prices to remain above US$100/bbl during the forecast period which is positive for HZN’s
revenue and cash flows projections.
HZN hedges a portion of its Beibu Gulf and Maari oil production to comply with the
reserves-based lending facility and provide revenue certainty. Following the
commencement of production from the Beibu fields in China in March 2013, HZN hedged
1.26 mmbbl over a 24-month period to July 2015 using a mix of collars and swaps. The
production volumes hedged equate to ~40% of forecast production over the period.
Exploration risks
Oil and gas exploration is typically a high risk activity. HZN’s future production, revenue
and cash flows are partially dependent on the company’s ability to successfully add oil
and gas reserves and resources through exploration and appraisal drilling. Oil and gas
exploration and development involves significant costs and a high degree of risk with
exploration wells typically yielding a 15-20% success rate. The ability to successfully
discover, develop and produce oil and gas reserves/resources will impact HZN’s future
production, earnings and valuation.
Development risk
HZN has several development projects including the Stanley wet gas project in PNG
which may suffer delays due to unexpected financial, operational or political events, cost
overruns, lower commodity prices, equipment and labour shortages, difficulty in securing
sales contracts and community or industrial actions. We seek to account for these risks
through our assumed 50-75% risk factors and higher PNG discount rate of 13%.
Oil and gas reserve estimates
Estimating oil and natural gas reserves is a complex task requiring analysis of available
geological, geophysical, production and engineering data, and which requires the making
of assumptions about oil and gas prices, drilling and operating expenses, capital
expenditures, taxes and availability of funds. The degree, quality and reliability of these
data inputs can vary and any future changes may result in a downwards revision to oil and
gas reserve estimates.
Funding risks
Oil and gas exploration and development is a capital-intensive business requiring
substantial capital expenditures to acquire acreage and drill, fracture stimulate and
complete wells with sufficient infrastructure. HZN’s operating cash flows and access to
capital are subject to a several factors including: proved reserves; the volume of oil and
natural gas which can be produced from existing productive wells; the level of realised oil
and gas prices; the ability to acquire, locate and produce new reserves; and the
willingness of banks to provide credit or additional borrowing capacity.
Regulatory risks
HZN is subject to laws and regulations of federal, state and local authorities relating to the
exploration, development, production and marketing of oil and natural gas. Price controls,
taxes and other laws relating to the oil and natural gas industry, changes in these laws
and changes in administrative regulations could impact HZN’s oil and natural gas
production, operations and economics.

05 September 2014
Energy
Horizon Oil Limited
Wilson HTM Equities Research – Horizon Oil Limited 27
Board of directors
Fraser Ainsworth – Non-Executive Independent Director and Chairman
Fraser has been a director of Horizon Oil for over 13 years and has more than 28 years of
experience in the resource and energy industries. Fraser spent 26 years with CSR
Limited, mainly in CSR’s resources and energy business, including four years as
Managing Director of Adelaide-based Delhi Petroleum Pty Ltd. Fraser is a non-executive
director of Envestra Limited and is Chairman of Tarac Australia Limited. Fraser holds a
Bachelor of Commerce (UNSW). Fraser is Chairman of the Board, Chairman of the
Remuneration, Nomination and Disclosure Committees and a member of the Audit and
Risk Management Committees.
Brent Emmett – Executive Director and Chief Executive Officer
Brent has been a director of Horizon Oil for more than 14 years and has over 35 years’
experience across exploration, E&P management and investment banking. Brent holds a
Bachelor of Science (Honours) degree from Adelaide University. In October 2000, Brent
was elected to the Board of Bligh Oil and Minerals NL and in January 2002, Brent was
appointed as CEO of the company, which subsequently changed its name to Horizon Oil
Limited. Since then Brent has been actively engaged in building Horizon Oil’s portfolio of
international exploration, production and development assets. Brent is a member of the
Risk Management and Disclosure Committees.
John Humphrey – Non-Executive Independent Director
John has been a director of Horizon Oil for over 24 years and has more than 20 years of
legal experience as a commercial lawyer as a partner of King & Wood Mallesons
specialising in corporate law. John is a director of Downer EDI Limited and Wide Bay
Australia Limited and a former member of the Australian Takeovers Panel (from 2011-
2014). John is a past president of the Queensland division of the Securities Institute of
Australia and a former national vice-president of that organisation. John is Chairman of
the Audit Committee and a member of the Risk Management Committee.
Gerrit J de Nys – Non-Executive Director
Gerrit has been a director of Horizon Oil for 7 years and has 44 years’ experience in civil
engineering, construction, oil field contracting and natural resource investment
management, mostly while based in Asia over a period in excess of 30 years. Gerrit is the
former group managing director-direct investments of the IMC Pan Asia Alliance Group
(IMC) (a related party of Austral-Asia Energy Pty Ltd, which owns 24.55% of HZN) and
although now based in Australia has a continuing non-executive involvement including
directorships of subsidiaries of IMC and as chair of IMC’s Audit Committee. Gerrit is a
member of the Risk Management, Remuneration and Nomination Committees.
Andrew Stock – Non-Executive Independent Director
Andrew has been a director of Horizon Oil for over 3 years and has more than 36 years of
development, operations and commercial experience in energy industries in Australia and
overseas. Andrew is a former Director, Executive Projects and Executive General
Manager for Major Development Projects for Origin Energy Limited and is a former non-
executive director of Geodynamics Limited. Andrew is a non-executive director of Silex
Systems Limited, a board member of Alinta Holdings and the Clean Energy Finance
Corporation and a member of the Engineering Faculty and Energy Advisory Boards at
University of Adelaide. Andrew is Chairman of the Risk Management Committee and a
member of the Audit Committee and Remuneration and Nomination Committees.
05 September 2014
Energy
Horizon Oil Limited
Wilson HTM Equities Research – Horizon Oil Limited 28
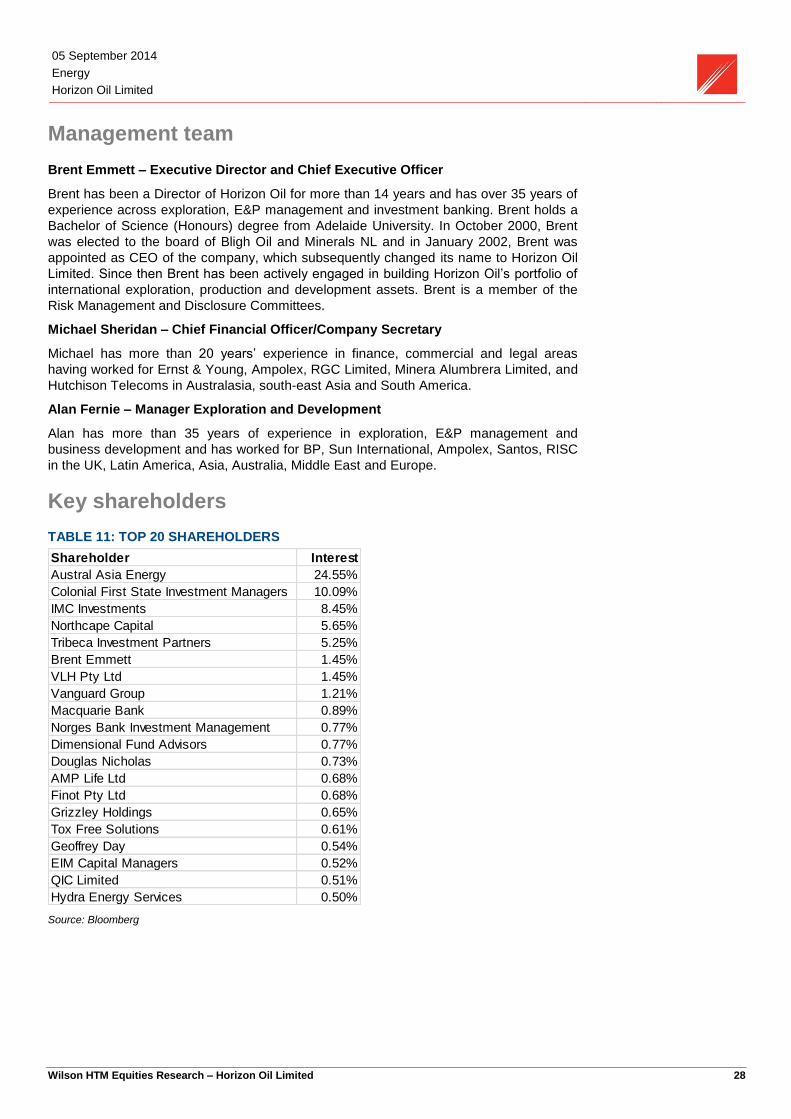
Management team
Brent Emmett – Executive Director and Chief Executive Officer
Brent has been a Director of Horizon Oil for more than 14 years and has over 35 years of
experience across exploration, E&P management and investment banking. Brent holds a
Bachelor of Science (Honours) degree from Adelaide University. In October 2000, Brent
was elected to the board of Bligh Oil and Minerals NL and in January 2002, Brent was
appointed as CEO of the company, which subsequently changed its name to Horizon Oil
Limited. Since then Brent has been actively engaged in building Horizon Oil’s portfolio of
international exploration, production and development assets. Brent is a member of the
Risk Management and Disclosure Committees.
Michael Sheridan – Chief Financial Officer/Company Secretary
Michael has more than 20 years’ experience in finance, commercial and legal areas
having worked for Ernst & Young, Ampolex, RGC Limited, Minera Alumbrera Limited, and
Hutchison Telecoms in Australasia, south-east Asia and South America.
Alan Fernie – Manager Exploration and Development
Alan has more than 35 years of experience in exploration, E&P management and
business development and has worked for BP, Sun International, Ampolex, Santos, RISC
in the UK, Latin America, Asia, Australia, Middle East and Europe.
Key shareholders
TABLE 11: TOP 20 SHAREHOLDERS
Source: Bloomberg
Shareholder Interest
Austral Asia Energy 24.55%
Colonial First State Investment Managers 10.09%
IMC Investments 8.45%
Northcape Capital 5.65%
Tribeca Investment Partners 5.25%
Brent Emmett 1.45%
VLH Pty Ltd 1.45%
Vanguard Group 1.21%
Macquarie Bank 0.89%
Norges Bank Investment Management 0.77%
Dimensional Fund Advisors 0.77%
Douglas Nicholas 0.73%
AMP Life Ltd 0.68%
Finot Pty Ltd 0.68%
Grizzley Holdings 0.65%
Tox Free Solutions 0.61%
Geoffrey Day 0.54%
EIM Capital Managers 0.52%
QIC Limited 0.51%
Hydra Energy Services 0.50%

05 September 2014
Energy
Horizon Oil Limited
Wilson HTM Equities Research – Horizon Oil Limited 29
Wilson HTM energy sector comps
TABLE 12: WILSON HTM ENERGY SECTOR COVERAGE COMPS
Source: Company data, Wilson HTM
Share FY14e Net debt (cash) Market Cap DCF Valuation Target Estimated
Company Ticker Rating Price (A$/sh) Debt (A$m) (A$m) EV (A$m) (A$/sh) Price (A$/sh) Price/DCF TSR
AWE Limited AWE HOLD 1.83 0.0 (42.1) 956.5 914.4 1.75 1.75 1.04 -4%
Beach Energy Limited BPT HOLD 1.64 0.0 (376.5) 2,120.4 1,743.9 1.61 1.60 1.02 -2%
Blue Energy Limited BUL BUY 0.05 0.0 (0.8) 59.3 58.5 0.10 0.10 0.54 85%
Drillsearch Energy Limited DLS BUY 1.45 153.4 (58.9) 660.9 602.0 1.91 1.90 0.76 31%
Horizon Oil Limited HZN BUY 0.33 143.3 93.0 423.1 516.1 0.44 0.45 0.74 38%
Karoon Gas Australia Limited KAR BUY 3.94 0.0 (444.8) 1,008.0 563.2 7.51 7.50 0.52 90%
Senex Energy Limited SXY BUY 0.60 0.0 (54.3) 688.9 634.5 0.74 0.75 0.81 25%
Strike Energy Limited STX BUY 0.12 5.2 (29.7) 95.8 66.1 0.18 0.18 0.63 57%
Sundance Energy SEA BUY 1.38 137.4 25.2 753.1 778.2 1.62 1.60 0.85 16%
Company 1P 2P 3P EV/2P EV/3P FY14 FY15e FY16e FY14 FY15e FY16e
AWE Limited 68.2 83.4 N/A 11.0 1.3 4.9 1.6 139.3 37.6 114.8
Beach Energy Limited 41.2 92.7 188.6 18.8 9.2 19.1 16.6 17.8 8.6 9.9 9.2
Blue Energy Limited 0.0 9.5 34.4 6.2 1.7 -0.20 -0.29 -0.29 -26.1 -17.9 -18.2
Drillsearch Energy Limited 12.8 28.5 52.7 21.2 11.4 16.3 18.9 19.4 8.9 7.7 7.5
Horizon Oil Limited 0.0 15.1 0.0 34.2 1.0 3.7 3.4 32.5 8.7 9.6
Karoon Gas Australia Limited 0.0 0.0 0.0 0.0 -0.05 -0.04 0.00 N/A N/A N/A
Senex Energy Limited 5.1 37.4 82.2 17.0 7.7 3.9 3.5 4.1 15.5 17.1 14.5
Strike Energy Limited 0.9 1.9 0.0 35.1 -2.5 -0.9 -1.0 -4.5 -13.5 -11.8
Sundance Energy 20.7 34.6 92.8 22.5 8.4 5.8 13.9 16.9 23.6 9.9 8.1
Median 18.8 8.4 1.3 3.7 3.4 12.2 9.3 8.7
Average 18.4 7.7 4.9 6.7 6.9 24.7 7.4 16.7
EV/Reserves (A$/boe) EPS (adjusted diluted) P/EReserves (mmboe)

05 September 2014
Energy
Horizon Oil Limited
Wilson HTM Equities Research – Horizon Oil Limited 30
PRICE TARGET
Valuation Price Target
Beibu Gulf Block 22/12 245.85 0.22
Maari/Manaia 152.20 0.13
PDL 10 (Stanley) 136.89 0.12
PRL 21 (Elevala, Ketu,
Tingu)
115.03 0.10
Net cash and other -88.54 -0.08
Corporate costs -62.05 -0.05
TOTAL ($m) 499.38 0.44
TOTAL ($ / Share) 0.44 0.45
INTERIMS ($m)
Half-yr (AUD) Dec 13 Jun 14 Dec 14 Jun 15
1HA 2HA 1HE 2HE
Sales
Revenue
64.8 73.7 93.6 99.5
EBITDA 28.5 60.3 68.4 71.4
EBIT 10.2 38.5 48.1 50.1
Net Profit 0.0 12.9 24.4 24.2
Norm. EPS 0.0 1.0 1.9 1.9
EBIT/Sales
(%)
15.8 52.2 51.4 50.4
Dividend (c) 0.0 0.0 0.0 0.0
Franking (%) 0.0 0.0 0.0 0.0
FINANCIAL STABILITY
Year-end June (USD) FY14A FY15E FY16E
Net Debt 88.5 137.2 35.8
Net Debt / Equity (%) 39.8 50.6 11.3
Net Debt / EV (%) 16.6 25.8 6.7
Current Ratio (x) 5.2 5.6 6.1
Interest Cover (x) 2.6 10.3 11.6
Adj. Cash Int. Cover (x) 5.5 11.3 12.7
Debt / CashFlow (x) 2.9 3.1 3.4
Net Debt (cash) / share
($)
NTA / share ($) 0.2 0.2 0.2
Book Value / share ($) 0.2 0.2 0.2
Payout Ratio (%) 0 0 0
Adj. Payout Ratio (%) 0 0 0
EPS RECONCILIATION ($m)
FY14A FY15E
Rep. Norm. Rep. Norm.
Sales Revenue 138 138 193 193
EBIT 48.7 48.7 98.3 98.3
Net Profit 12.8 12.8 48.6 48.6
Notional Earn. 0.0 0.0 0.0 0.0
Pref./Conv. Div. 0.0 0.0 0.0 0.0
Profit for EPS 12.8 12.8 48.6 48.6
Diluted Shrs(m) 1,253 1,253 1,288 1,288
Diluted EPS (c) 1.0 1.0 3.8 3.8
RETURNS
FY14A FY15E FY16E FY17E
ROE (%) 6.6 19.7 15.1 15.0
ROIC (%) 10.4 19.1 16.7 16.4
Incremental ROE 30.8 68.7 -9.4 14.5
Incremental ROIC 62.8 107.1 -26.6 14.0
KEY ASSUMPTIONS
Year-end June (USD) FY10A FY11A FY12A FY13A FY14A FY15E FY16E FY17E
Revenue Growth (%) -4.6 188.0 39.5 -4.4 7.1
EBIT Growth (%) -38.5 167.5 101.8 -7.7 9.3
NPAT Growth (%) -54.6 269.3 278.7 -9.0 15.8
EPS Growth (%) -54.6 234.3 268.1 -9.4 17.6
EBIT / Sales (%) 58.7 37.9 35.2 50.9 49.1 50.1
Tax Rate (%) 67.7 65.3 57.3 45.2 46.6 43.3
ROA (%) 9.0 4.3 9.6 18.1 16.4 17.7
ROE (%) 4.7 2.2 6.4 19.7 15.0 14.9
Production (mmboe) 0.36 1.01 1.64 1.89 1.87 1.83
Brent crude oil price (US$/bbl) 111.67 108.75 108.53 104.50 103.00 100.00
AUD/USD exchange rate 1.04 0.97 0.92 0.90 0.87 0.85
PROFIT & LOSS ($m)
Year-end June (USD) FY10A FY11A FY12A FY13A FY14A FY15E FY16E FY17E
Sales Revenue 50.4 48.1 138.5 193.1 184.6 197.7
EBITDA 37.7 27.3 88.7 139.8 130.8 137.6
Depn & Amort 8.1 9.1 40.0 41.5 40.2 38.5
EBIT 29.6 18.2 48.7 98.3 90.6 99.0
Net Interest Expense 5.9 8.2 18.7 9.6 7.8 7.0
Tax 16.0 6.6 17.2 40.1 38.6 39.8
Minorities / pref divs 0.0 0.0 0.0 0.0 0.0 0.0
Equity accounted NPAT 0.0 0.0 0.0 0.0 0.0 0.0
Net Profit pre Sig. Items 7.6 3.5 12.8 48.6 44.2 52.2
Abn’s / Ext’s / Signif. 0.0 0.0 0.0 0.0 0.0 -1.0
Reported Net Profit 7.6 3.5 12.8 48.6 44.2 51.2
CASH FLOW ($m)
Year-end June (USD) FY10A FY11A FY12A FY13A FY14A FY15E FY16E FY17E
EBITDA 37.7 27.3 88.7 139.8 130.8 137.6
Interest & Tax -5.9 -8.2 -18.7 -9.6 -7.8 -6.0
Working Cap / Other -17.3 18.3 -1.9 -69.7 -68.2 -90.9
Operating Cash Flow 14.4 37.4 68.1 60.6 54.8 40.6
Maintenance Capex -0.2 -0.1 -0.8 -2.0 -2.0 -2.0
Free Cash Flow 0.0 0.0 14.2 37.3 67.3 58.6 52.8 38.6
Dividends Paid 0.0 0.0 0.0 0.0 0.0 0.0
Development Capex -78.9 -124.5 -92.1 -106.9 -81.0 -139.4
Invest. / Disposals 0.0 20.4 53.6 0.0 130.0 0.0
Other Inv. Flows 0.0 0.0 0.0 53.6 0.0 0.0 0.0 0.0
Cash Flow Pre Financing 0.0 0.0 -64.7 -13.2 28.8 -48.4 101.8 -100.8
Funded by Equity 0.0 0.8 46.8 0.0 0.0 0.0
Funded by Debt 21.8 88.7 -15.2 0.0 0.0 50.0
Funded by Cash 42.9 -76.3 -60.4 48.4 -101.8 50.8
BALANCE SHEET SUMMARY ($m)
Year-end June (USD) FY10A FY11A FY12A FY13A FY14A FY15E FY16E FY17E
Cash 19.3 19.0 98.9 50.3 79.3 40.7
Current Receivables 15.0 19.0 15.5 32.7 28.9 31.0
Current Inventories 7.8 7.9 5.3 13.0 12.0 12.8
Net PPE 4.7 8.2 5.6 6.6 6.6 6.6
Investments 0.4 0.0 0.0 0.0 0.0 0.0
Intangibles / Capitalised 0.0 0.0 299.2 420.6 388.0 452.6 371.3 467.5
Other 4.5 1.5 1.7 9.1 22.0 57.7
Total Assets 350.8 476.2 514.9 564.2 520.1 616.3
Current Payables 42.7 40.2 35.7 36.5 20.5 14.5
Total Debt 0.0 0.0 100.7 195.6 187.4 187.4 115.1 165.1
Other Liabilities 45.7 73.5 69.2 69.2 69.2 69.2
Total Liabilities 189.1 309.2 292.3 293.1 204.7 248.7
Minorities / Convertibles 0.0 0.0 0.0 0.0 0.0 0.0
Shareholder Equity 161.7 167.0 222.6 271.1 315.4 367.6
Total Funds Employed 262.4 362.6 410.0 458.6 430.5 532.7
05 September 2014
Energy
Horizon Oil Limited
Wilson HTM Equities Research – Horizon Oil Limited 31
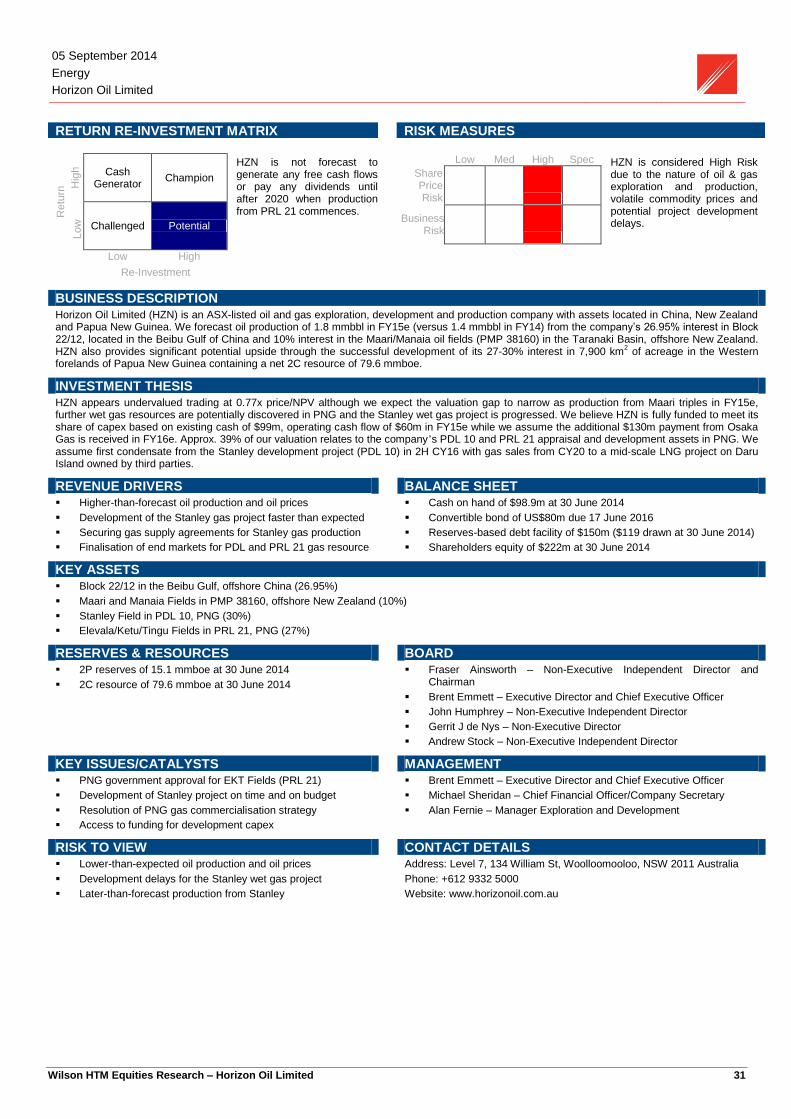
RETURN RE-INVESTMENT MATRIX RISK MEASURES
Retu
rn Hig
h
Cash Generator
Champion
Low
Challenged Potential
Low High
Re-Investment
HZN is not forecast to generate any free cash flows or pay any dividends until after 2020 when production from PRL 21 commences.
Low Med High Spec
Share Price Risk
Business Risk
HZN is considered High Risk due to the nature of oil & gas exploration and production, volatile commodity prices and potential project development delays.
BUSINESS DESCRIPTION
Horizon Oil Limited (HZN) is an ASX-listed oil and gas exploration, development and production company with assets located in China, New Zealand and Papua New Guinea. We forecast oil production of 1.8 mmbbl in FY15e (versus 1.4 mmbbl in FY14) from the company’s 26.95% interest in Block 22/12, located in the Beibu Gulf of China and 10% interest in the Maari/Manaia oil fields (PMP 38160) in the Taranaki Basin, offshore New Zealand. HZN also provides significant potential upside through the successful development of its 27-30% interest in 7,900 km
2 of acreage in the Western
forelands of Papua New Guinea containing a net 2C resource of 79.6 mmboe.
INVESTMENT THESIS
HZN appears undervalued trading at 0.77x price/NPV although we expect the valuation gap to narrow as production from Maari triples in FY15e, further wet gas resources are potentially discovered in PNG and the Stanley wet gas project is progressed. We believe HZN is fully funded to meet its share of capex based on existing cash of $99m, operating cash flow of $60m in FY15e while we assume the additional $130m payment from Osaka Gas is received in FY16e. Approx. 39% of our valuation relates to the company’s PDL 10 and PRL 21 appraisal and development assets in PNG. We assume first condensate from the Stanley development project (PDL 10) in 2H CY16 with gas sales from CY20 to a mid-scale LNG project on Daru Island owned by third parties.
REVENUE DRIVERS BALANCE SHEET
Higher-than-forecast oil production and oil prices
Development of the Stanley gas project faster than expected
Securing gas supply agreements for Stanley gas production
Finalisation of end markets for PDL and PRL 21 gas resource
Cash on hand of $98.9m at 30 June 2014
Convertible bond of US$80m due 17 June 2016
Reserves-based debt facility of $150m ($119 drawn at 30 June 2014)
Shareholders equity of $222m at 30 June 2014
KEY ASSETS
Block 22/12 in the Beibu Gulf, offshore China (26.95%)
Maari and Manaia Fields in PMP 38160, offshore New Zealand (10%)
Stanley Field in PDL 10, PNG (30%)
Elevala/Ketu/Tingu Fields in PRL 21, PNG (27%)
RESERVES & RESOURCES BOARD
2P reserves of 15.1 mmboe at 30 June 2014
2C resource of 79.6 mmboe at 30 June 2014
Fraser Ainsworth – Non-Executive Independent Director and Chairman
Brent Emmett – Executive Director and Chief Executive Officer
John Humphrey – Non-Executive Independent Director
Gerrit J de Nys – Non-Executive Director
Andrew Stock – Non-Executive Independent Director
KEY ISSUES/CATALYSTS MANAGEMENT
PNG government approval for EKT Fields (PRL 21)
Development of Stanley project on time and on budget
Resolution of PNG gas commercialisation strategy
Access to funding for development capex
Brent Emmett – Executive Director and Chief Executive Officer
Michael Sheridan – Chief Financial Officer/Company Secretary
Alan Fernie – Manager Exploration and Development
RISK TO VIEW CONTACT DETAILS
Lower-than-expected oil production and oil prices
Development delays for the Stanley wet gas project
Later-than-forecast production from Stanley
Address: Level 7, 134 William St, Woolloomooloo, NSW 2011 Australia
Phone: +612 9332 5000
Website: www.horizonoil.com.au

05 September 2014
Energy
Horizon Oil Limited
Wilson HTM Equities Research – Horizon Oil Limited 32
Head of Research Head of Institutional Sales
Shane Storey (07) 3212 1351 Richard Moulder (02) 8247 6603
Industrials Sydney
James Ferrier (03) 9640 3827 Jonathan Scales (02) 8247 6613
Stewart Oldfield (03) 9640 3818 Duncan Gamble (02) 8247 6629
George Gabriel (03) 9640 3864 Michael Pegum (02) 8247 6602
Daniel Wan (02) 8247 6694 Anthony Wilson (02) 8247 3113
Andrew Dalziel (07) 3212 1946 Peter Tebbutt (02) 8247 6682
Healthcare and Biotechnology Melbourne
Shane Storey (07) 3212 1351 David Permezel (03) 9640 3885
Joseph Michael (02) 8247 3101 Adam Dellaway (03) 9640 3824
Resources
Phillip Chippindale (02) 8247 3149 Wealth Management Research
James Redfern (02) 8247 6609 Peter McManus (02) 8247 3186
Liam Schofield (02) 8247 3173 John Lockton (02) 8247 3118
Quantitative Email: [email protected]
Nathan Szeitli (03) 9640 3806
National Offices
Brisbane Ph: (07) 3212 1333
Sydney Ph: (02) 8247 6600
Melbourne Ph: (03) 9640 3888
Gold Coast Ph: (07) 5509 5500
Dalby Ph: (07) 4660 8000
Hervey Bay Ph: (07) 4197 1600
Our website: www.wilsonhtm.com.au
Return Reinvestment Matrix and Risk Measures
Definitions at http://www.wilsonhtm.com.au/Disclosures
Recommendation Structure and Other Definitions
Definitions at http://www.wilsonhtm.com.au/Disclosures
Disclaimer
Whilst Wilson HTM Ltd believes the information contained in this communication is based on reliable information, no warranty is given as to its accuracy and persons relying on this information do so at their own risk. To the extent permitted by law Wilson HTM Ltd disclaims all liability to any person relying on the information contained in this communication in respect of any loss or damage (including consequential loss or damage) however caused, which may be suffered or arise directly or indirectly in respect of such information. Any projections contained in this communication are estimates only. Such projections are subject to market influences and contingent upon matters outside the control of Wilson HTM Ltd and therefore may not be realised in the future.
The advice contained in this document is general advice. It has been prepared without taking account of any person’s objectives, financial situation or needs and because of that, any person should, before acting on the advice, consider the appropriateness of the advice, having regard to the client’s objectives, financial situation and needs. Those acting upon such information without first consulting one of Wilson HTM Ltd investment advisors do so entirely at their own risk. This report does not constitute an offer or invitation to purchase any securities and should not be relied upon in connection with any contract or commitment whatsoever. If the advice relates to the acquisition, or possible acquisition, of a particular financial product – the client should obtain a Product Disclosure Statement relating to the product and consider the Statement before making any decision about whether to acquire the product. This communication is not to be disclosed in whole or part or used by any other party without Wilson HTM Ltd’s prior written consent.
Disclosure of Interest. Horizon Oil Limited
The Directors of Wilson HTM Ltd advise that at the date of this report they and their associates have relevant interests in Horizon Oil Ltd. They also advise that Wilson HTM Ltd and Wilson HTM Corporate Finance Ltd A.B.N. 65 057 547 323 and their associates have received and may receive commissions or fees from Horizon Oil Ltd in relation to advice or dealings in securities. Some or all of Wilson HTM Ltd authorised representatives may be remunerated wholly or partly by way of commission.
In producing research reports, members of Wilson HTM Ltd Research may attend site visits and other meetings hosted by the issuers the subject of its research reports. In some instances the costs of such site visits or meetings may be met in part or in whole by the issuers concerned if Wilson HTM Ltd considers it is appropriate and reasonable in the specific circumstances relating to the site visit or meeting.
Please see disclosures at http://www.wilsonhtm.com.au/Disclosures. Disclosures applicable to companies included in this report can be found in the latest relevant published research.


