
The Upper Athabasca Healthy Landscapes Project
FRI ND Program Information SessionEdmonton, Alberta
December 10th, 2009
David Andison

Starting Point = Natural Disturbance Patterns.
Planning & Monitoring Systems
Fire ThreatAccess
Wood Profile Outfitting
Grizzly Bear
Aesthetics
Old growth
Birds
Water Quality
Natural Resource Extraction
Costs

• Type• Frequency & Periodicity• Size & Shape• Severity• Tendencies
Economic and Social Consequences
• Recreation• Oil and Gas Extraction• Clean Water Supply• Fishing• Timber Harvesting• Grazing…
• Seral-stage levels• Old forest patch sizes• Edge density• Coarse woody debris• Suspended sediment & O2…
• Fire risk• MPB risk• Water quality• Caribou• Grizzly bear…
Disturbance Patterns
Landscape Condition
Biological Consequences

Assumptions:• Landscape health is the ultimate measure of
sustainability.
• Disturbance patterns are a proxy for landscape health, and can be used as a shared goal of land management.
• A landscape not operating within NRV is at risk.
• The further a landscape is beyond NRV, the greater the risk.
• We can differentiate a “healthy” from an “unhealthy” landscape via NRV indicators.

Indicator Landscape 1 Landscape 2
Too Low NRV Too High Too Low NRV Too High
Landscape 1 is “Healthier” than Landscape 2
Green = Measurable Historical RangeRed = Beyond Historical Range
Black Dots = Current (point, range)
FrequencyDuration
SizeShapeType
SeverityResponse to Veg.
Response to Topog.

A wildfire kills 70% of large trees within the riparian zone of a small stream.
Dead trees fall down and create large woody debris (LWD) in and over the stream.
Fish and invertebrate communities need organics for nutrients, fresh sediment for spawning, pools for habitat, and
LWD for shade and hiding cover.
New LWD in the stream changes water flow direction and velocity, and create
new pools.
New LWD over the stream create bridges for small mammal habitat
and travel.
Convoluted streams with LWD and a variety of sizes of pools act as buffers
against flooding.
Structurally and compositionally diverse aquatic
ecosystems filter toxins in water.
The changes to water flow direction and velocity causes organic matter
and sediment to erode from the banks into the stream.
Disturbance Pattern
Landscape Condition
Responses
Biological Responses
These are also social &
economic values

Install damns, build levees, dig reservoirs, add
LWD.
Stock lakes and streams with fish.
Aquatic diversity declines.
Management Actions
We want to minimize the risk of both flooding and water shortages.
We want access to recreational fishing.
We want our water to be safe and clean.
Economic, Ecological & Social
Issues
Forbid any disturbance in riparian zones.
Prevent and control all wildfires.
Loss of young riparian forest habitat type.
Biological Responses
Riparian forests become old.
LWD input limited to the occasional very large tree.
Landscape Condition
ResponsesThe landscape risk to natural disturbance increases.
Biological benefits of LWD continue to
decline.
Example of the Traditional Land Management Process.
Unintended cumulative
social, ecological, &
economic impacts.
DecisionFiltering ProcessAgency CAgency BAgency A
Install damns, build levees, dig reservoirs, add
LWD.
Stock lakes and streams with fish.
Aquatic diversity declines.
Management Actions
We want to minimize the risk of both flooding and water shortages.
We want access to recreational fishing.
We want our water to be safe and clean.
Economic, Ecological & Social
Issues
Forbid any disturbance in riparian zones.
Prevent and control all wildfires.
Loss of young riparian forest habitat type.
Biological Responses
Riparian forests become old.
LWD input limited to the occasional very large tree.
Landscape Condition
ResponsesThe landscape risk to natural disturbance increases.
Biological benefits of LWD continue to
decline.
Unintended cumulative
social, ecological, &
economic impacts.
DecisionFiltering ProcessAgency CAgency BAgency A

Initiation Immature Mature Over-Mature
Upland Gentle Forested
Upland Steep Forested
Upland Gentle Non-forested
Upland Steep Non-Forested
Lowland Gentle Forested
Lowland Gentle Non-Forested
Wetlands
Water
Forest Management
Ducks Unlimited, Peat..
Regulator D
DFO, Regulator C
Whose responsibility is it to manage the so-
called “non-productive” land
base?
Regulator A & B
There are also physical gaps

Management Actions
We want to begin to restore riparian zones to more historical landscape structures.
Landscape Health Issues
Example of a Healthy Landscape Management Process.
DecisionFiltering Process
Landscape condition & biological responses, andall other social, economic & ecological issues.
A disturbance plan kills 70% of large trees within the riparian zone of a small stream.
Dead trees fall down and create large woody debris (LWD) in and over the stream.
Aquatic communities need organics for nutrients, fresh sediment for spawning, pools for habitat, and LWD for cover.
New LWD in the stream changes water flow direction and velocity, and create new pools.
New LWD over the stream create bridges for small mammals.
Convoluted streams with LWD and a variety of sizes of pools act as buffers against
flooding.
Healthy fish communities are preferred fishing destinations.
Diverse, healthy aquatic ecosystems are more likely to filter toxins in water.
Changes to water flow cause organic matter and sediment to erode into the stream.
Landscape Condition
Responses
Biological Responses
Economic and SocialResponses

Management Goal = A Healthier Landscape.

Too Low NRV Too High
The point is not to get all of the dots in the green zone. The green zone represents natural thresholds, beyond which there are risks.
Management Objectives = Direction and distance of blue arrows
% Old Forest% Old Riparian For.
% Young Forest% Old Non-Forest% Young RiparianWater Sediment
Large Old Area FreqLarge Woody Debris
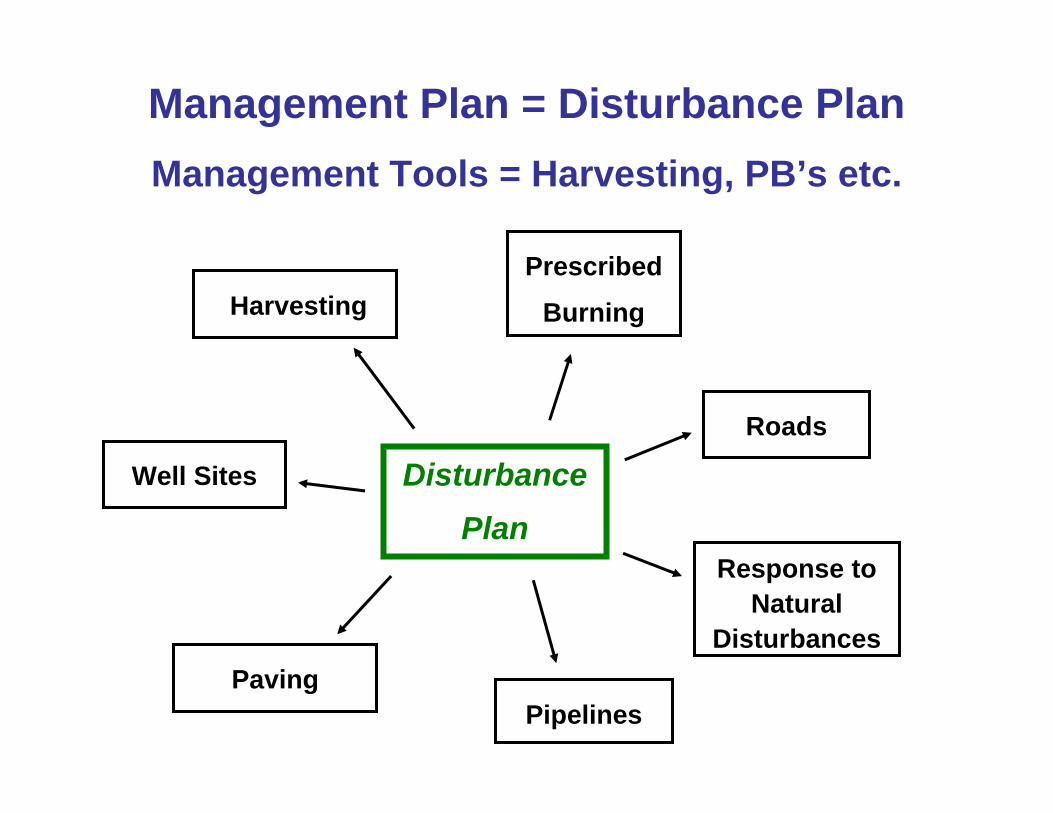
DisturbancePlan
HarvestingPrescribed
Burning
Roads
Well Sites
Paving
Response to Natural
Disturbances
Pipelines
Management Plan = Disturbance PlanManagement Tools = Harvesting, PB’s etc.

Alberta’s Land Use Framework• Vision: “The peoples of Alberta work together to respect and care for the land as the foundation for our economic, environmental and social well-being.”
• One of 3 Desired Outcomes:• “Healthy ecosystems and environment”
• “Supported by a land stewardship ethic”.
• “A cumulative effects management approach will be used in regional plans….
Frequency
Duration
Size
Shape
Type
Severity
Response to Veg.
Response to Topog.
MPB Threat
Wildfire Threat
Grizzly Bear Habitat
Bull Trout Habitat
Caribou Habitat
Wood Supply
Access
Rec. Fishing
% Old Forest
% Old Riparian For.
% Young Forest
% Old Non-Forest
% Young Riparian
Water Sediment
Large Old Area Freq
Large Woody Debris
Disturbance Attributes
Landscape Condition
Responses
Biological & Other
Responses
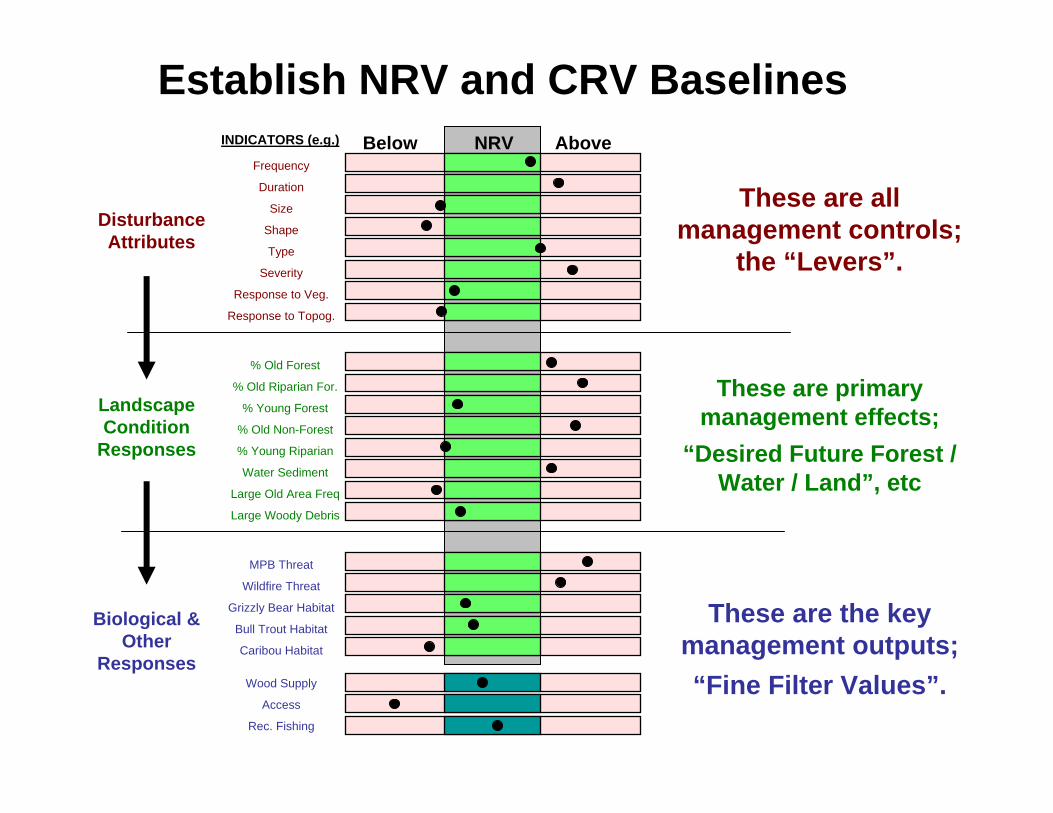
These are all management controls;
the “Levers”.
These are primary management effects;
“Desired Future Forest / Water / Land”, etc
These are the key management outputs;“Fine Filter Values”.
INDICATORS (e.g.) Below NRV Above
Establish NRV and CRV Baselines

Frequency
Duration
Size
Shape
Type
Severity
Response to Veg.
Response to Topog.
MPB Threat
Wildfire Threat
Grizzly Bear Habitat
Bull Trout Habitat
Caribou Habitat
Wood Supply
Access
Rec. Fishing
% Old Forest
% Old Riparian For.
% Young Forest
% Old Non-Forest
% Young Riparian
Water Sediment
Large Old Area Freq
Large Woody Debris
Disturbance Attributes
Landscape Condition
Responses
Biological Responses
Other Responses
INDICATOR
Identify Objectives Using NRV as Guides
Green arrows represent direction and distance we
wish to shift an LCR indicator.
Blue arrows represent direction and distance we
wish to shift a BR indicator.
Preferred Range
Below NRV Above

Frequency
Duration
Size
Shape
Type
Severity
Response to Veg.
Response to Topog.
MPB Threat
Wildfire Threat
Grizzly Bear Habitat
Bull Trout Habitat
Caribou Habitat
Wood Supply
Access
Rec. Fishing
% Old Forest
% Old Riparian For.
% Young Forest
% Old Non-Forest
% Young Riparian
Water Sediment
Large Old Area Freq
Large Woody Debris
Disturbance Attributes
Landscape Condition
Responses
INDICATOR
Now Identify The Likely “Levers” to Pull
Green arrows represent direction and distance we
wish to shift an LCR indicator.
Blue arrows represent direction and distance we
wish to shift a BR indicator.
Red arrows represent direction and distance we
need to shift a DA indicators to achieve
desired LCRs and BRs.
Biological Responses
Other Responses
Below NRV Above

Design Disturbance Scenarios - Together
Area A Area C
Area BArea D
Moderate to high severity, moderate size, low shape, moderate duration, & high response to vegetation and
topography.
Moderate severity, large size, complex shape, low duration, low
response to vegetation and topography.
All severity, all sizes, all shapes, low duration, low response to vegetation and topography.
High severity, large size, simple shapes, high duration, low response to vegetation and
topography

Use Planning Indicators to Compare ScenariosFrequency
Duration
Size
Shape
Type
Severity
Response to Veg.
Response to Topog.
MPB Threat
Wildfire Threat
Grizzly Bear Habitat
Bull Trout Habitat
Caribou Habitat
Wood Supply
Access
Rec. Fishing
% Old Forest
% Old Riparian For.
% Young Forest
% Old Non-Forest
% Young Riparian
Water Sediment
Large Old Area Freq
Large Woody Debris
Disturbance Attributes
Landscape Condition
Responses
INDICATOR Below NRV Above
Disturbance Indicators:“Did you do what you said you
would?”
Condition Indicators:“Did you create the
predicted conditions?”
Response Indicators:“Did you create the
predicted responses?”
Biological Responses
Other Responses

Predicted (from Models) Actual (from Monitoring)
Frequency
Duration
Size
Shape
Type
Severity
Response to Veg.
Response to Topog.
MPB Threat
Wildfire Threat
Grizzly Bear Habitat
Bull Trout Habitat
Caribou Habitat
Wood Supply
Access
Rec. Fishing
% Old Forest
% Old Riparian For.
% Young Forest
% Old Non-Forest
% Young Riparian
Water Sediment
Large Old Area Freq
Large Woody Debris
INDICATOR Below NRV Above Below NRV AboveYESNOYESYESYESNOYESYES
YESNOYESNOYESYESNONO
YESNONOYESNO
NOYESYES
Vs.
Adaptive monitoring becomes a logical outcome of a HL plan.

Core Study Area
Upper Athabasca LUF Landscape
Analysis Window
The Upper Athabasca HL Project

• Hinton Wood Products• Alberta Newsprint Co.• Jasper National Park• Alberta SRD – Forest Mgmt.• Alberta SRS – Land Use Planning group• Foothills Forest Products• Weyerhaeuser Company• Talisman Energy• Alberta Environment• Sundre Forest Products• Foothills Land Mgmt Forum• Alberta Energy• Coal Valley• Shell • Alberta SRD – Forest Protection• Alberta Tourism Parks and Recreation• Alberta SRD – Oil Sands Branch• Miller Western Forest Products• Foothills Research Institute• So far….
The UA HL Project Partnership

The Process (highlights):1. There are no rules – everything is on the
table.
2. All (hopefully) management partners will design the planning scenarios as a team.
3. The final product(s) will be completed in time for input into the UA land use planning exercise.

Why Participate?• NRV indicators, ranges, and current conditions for everyone involved (i.e.the same language) for strategic plans.
• National Parks are not part of the provincial land use plans.
• Input into this project equates to input into the Regional Land Use plan.
• As an alternative planning process, we may just come up with some new solutions consistent with current needs.


