
High School PBS:PBS Meetings & DataJon FrancoCentury HS,Hillsboro SD
Chris BorgmeierPortland State Universitywww.web.pdx.edu/~cborgmei

SW-PBSUniversal System
Team Leadership Common language Clear, Shared Expectations Regular acknowledgement of desired
behavior Consistent responses to problem behavior Data based decision making

Century HS POWER Team Meeting
Keys to an Effective Meeting
POWER Team Meeting agenda
Sharing data during the meeting How is data shared? What data is shared?
Sharing data with the entire staff How data is shared with entire staff? How often?

PO
WE
R T
EA
M M
eeti
ng
Ag
end
a

Making Explicit ConnectionsPBS & School Improvement Plan Goals


What data is important?
Discipline referralsTardy
Suspension/Expulsion Attendance Rates LRE data Graduation Rates Academic data
What data are you using now?
How often do you examine the data?
Have you used data to guide decision making?
How is data a part of your regular PBS teaming process?

What are barriers to using data for your team?
We have not asked for data Do not know what to ask for Don’t know who to ask/where to get data
Poor data systems Inconsistent data entry Data is not easily accessible Data is not accessible in a usable format
???

Effective Data Systems
Ease of data entry Ease of data retrieval Ease of understanding the data for
decision makingGraphic representationData presented to highlight most important
characteristics of the data

SWIS for Discipline Referral Data
www.swis.org $250/year/school

# of Schools Using SWIS by LevelApril 2009
Pre-K 9
Elementary 3,152
Middle 896
High 359
K-8/12 859

Century HS -- Majors OnlyBut what does
this really mean?

SWIS summary 07-08 (Majors Only)2,732 schools; 1,385,191 students; 1,244,026 ODRs
Grade Range Number of Schools
Mean Enrollment per school
Mean ODRs per 100 per school day
K-6 1,762 444 .34 (sd=.45)
(1 /300 / day)
6-9 482 653 .92 (sd=1.41)
(1/ 100 / day)
9-12 176 914 1.05 (sd=.1.56)
(1/105 / day)
K-(8-12) 312 401 1.00 (sd=1.85)
(1/ 100 / day
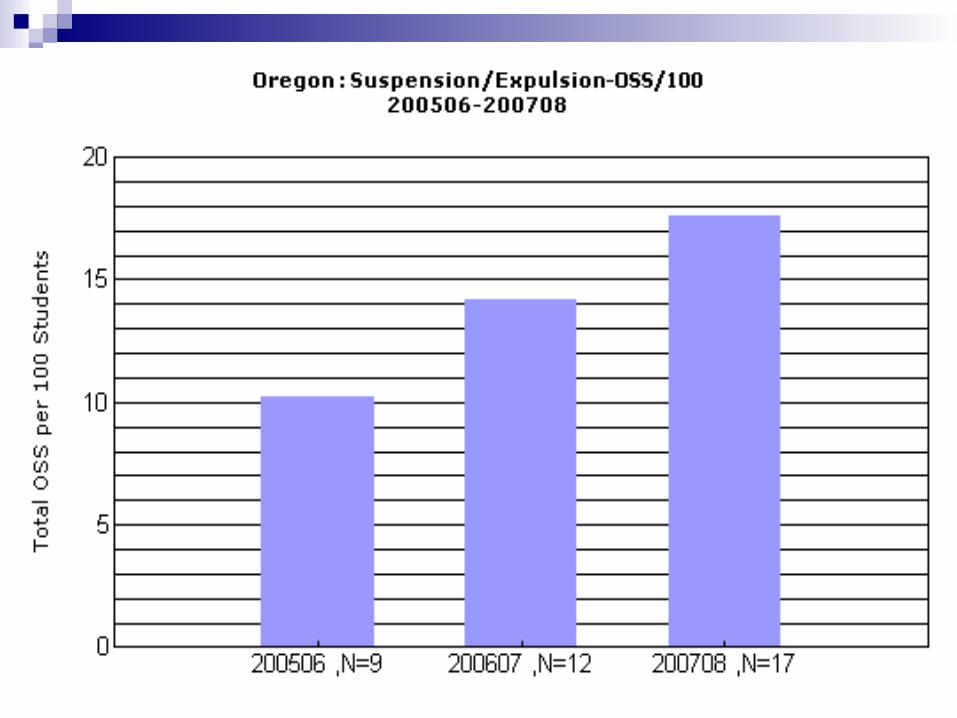
Oregon HS Averages
2005-06 – 13 HS = 0.75/100/Day
2006-07 – 14 HS = 0.78/100/Day
2007-08 -- 19 HS = 0.60/100/Day

Century HS -- Majors Only
1500 students
15 x 0.6 = 9 referrals/Day
(OR ave)

Century HS -- Major & Minor

Century HS -- Majors Only

Oregon High School DataODR by Problem Behavior

Century HS -- Majors Only

Century HS -- Majors Only

Century HS -- Mining the Data Problem Behavior at Noon
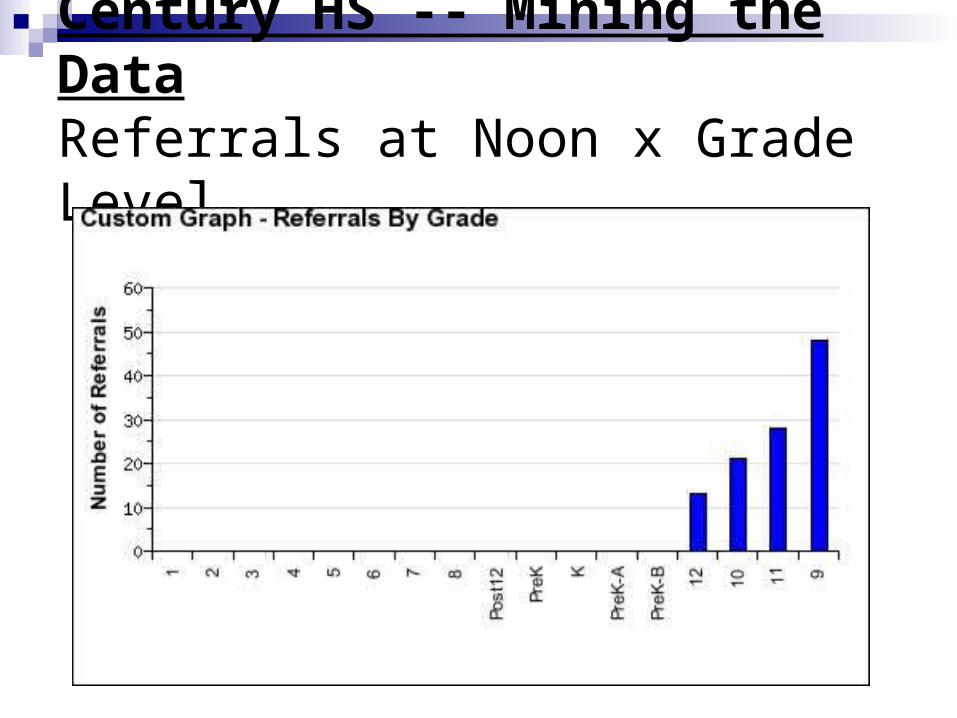
Century HS -- Mining the Data Referrals at Noon x Grade Level

Century HS -- Majors Only

What data is important?
Discipline referralsTardy
Suspension/Expulsion Attendance Rates LRE data Graduation Rates Academic data

What does this data mean?
ODR’s 33 %
Suspensions 22 %
HS Drop Outs 35 %
Students moved to 43 % out of school placement
Expulsions 17 %

What does this data mean?
ODR’s 33 %
Suspensions 22 %
HS Drop Outs 38 %
Students moved to 14 % out of school placement
Expulsions 45 %

Oregon HS DataSWIS

Oregon ODR/100/Day – Majors
200506-200809


Oregon High School DataAll Enrolled Students x Ethnicity & Students w/ Referrals x Ethnicity

Oregon High School DataAll Enrolled Students x Ethnicity & Referrals x Ethnicity


