Download - HBM M&A Survey - Swiss Biotech
February 2020
1
About the HBM Pharma/Biotech M&A Report
The HBM Pharma/Biotech M&A Report covers all completed trade sales of US and European biotechnology and pharma companies with a therapeutic focus (Rx incl. generics as well as OTC). For 2015-2019, additional data for asset deals and transactions outside of the US and Europe is provided. Where mentioned, M&A data for 2019 may also include announced transactions.
The report does not cover nutritional supplements, diagnostics, medical technology, digital health, life sciences tools, CROs, pharma manufacturing and services. Reverse mergers or minority investments are not included. Acquisitions that were structured as mergers for tax or other reasons are included.
Upfront transaction value is defined in this report as the upfront consideration in cash and/or shares. By contrast, the total transaction value also includes contingent (“biodollar”) payments linked to reaching certain milestones.
Additional data such as invested capital, exit multiples, stage of lead product etc. were collected from various sources. Please note that such data may be based on estimates and may not have been available for all transactions.
Further information about the HBM Pharma/Biotech M&A Report including a list of all transactions can be found under http://www.hbmpartners.com/reports. The use of data and charts is permitted with reference to “HBM Partners Pharma/Biotech M&A Report”.
The authors of the report welcome any feedback or corrections:
Dr Ulrich Geilinger, [email protected] , Dr Chandra Leo, [email protected] and Dr Emil Bujak, [email protected]
HBM Pharma/Biotech M&A Report 2020 Analysis of Biopharma M&A in 2019 (and previous years)
Key Findings
◼ Worldwide biopharma M&A volume of completed and announced deals (including
contingent payments and asset deals) reached a record of $254 billion in 2019 (as compared
to $155 billion in 2018 and $76 billion in 2017).
◼ The two mega-deals, BMS/Celgene ($74 billion) and Abbvie/Allergan ($63 billion) got most
headlines in 2019 with the acquisition of Celgene by BMS being the third largest pharma
acquisition in history.
◼ US biopharma deal activity was very strong with 12 $1-billion-plus deals closed in 2019 and
another 5 such deals announced. European deal volume (outside of the $63 billion
Abbvie/Allergan transaction) was only around $10 billion.
◼ As in previous years, M&A transaction volume outside of the US and Europe in 2019 was
modest with a transaction volume of only $5.4 billion.
◼ Premiums paid in 2019 for public companies reached an average of almost 100%,
demonstrating the continued appetite for companies with new products in development or
on the market.
◼ Return multiples to VC investors from M&A stayed at high levels in 2019 but did not reach
the values of previous years.
◼ VC-backed company trade sales in oncology dropped in number and deal volume, whereas
non-oncology orphan companies generated one third of transaction volume.

HBM Pharma/Biotech M&A Report 2020
2
Record Worldwide Biopharma M&A Transaction Volume in 2019
Worldwide Biopharma M&A Transaction Volume 2015 -2019
Completed transactions and in 2019 announced transactions, including asset deals, sale of subsidiaries and divisions.
Transaction volume including contingent payments. Europe includes Israel.
◼ Worldwide biopharma M&A volume of completed and announced deals (including contingent
payments and asset deals) in 2019 jumped to a record high of $254 billion. This number was driven of
course by the two mega-deals BMS/Celgene ($74 billion) and Abbvie/Allergan1 ($63 billion). M&A
transaction volume outside of these two mega-mergers reached $117 billion, also a historically high
number. Please note that we put the $59 billion Takeda/Shire deal into 2018 even though the
transaction was legally closed only in early 2019 (but was approved by shareholders in late 2018).
◼ The majority of larger M&A deals (above $1 billion transaction volume) were in oncology or in the
orphan/genetic disease areas.
◼ US biopharma M&A activity in 2019 was very strong with 18 private and 16 public companies sold at
$100 million or more. In Europe, only 9 company trade sales reached that level and transaction volume
(excluding the Abbvie/Allergan deal) was only around $10 billion.
◼ As in previous years, biopharma M&A transaction volume outside of the US and Europe remained
relatively low ($5.4 billion) with only a handful of significant transactions reported. It should be noted,
however, that it is difficult to get reliable M&A data from China.
While the mega-mergers attracted the most headlines in 2019, there were a high number of other
significant transactions mainly in the US (see next page), both in the first and second half of the year. Our
prediction that the second half of 2019 could see a slow-down (due to the six companies involved in
recent mega-mergers being absent in the M&A market) turned out to be too pessimistic.
1 The transaction will close only in 2020. Allergan has been classified as a European company, even though main operations
are in the US.
195.6
77.6
28.047.5
148.7
7.6
3.6
3.1
1.9
26.0
17.9
14.4
40.0
78.3
68.03.1
49.8
1.0
23.8
5.7
5.8
3.6
3.8
3.3
5.4230.0
149.0
75.9
154.9
253.9
0
50
100
150
200
250
2015 2016 2017 2018 2019
Up
fro
nt T
ran
sact
ion
Vo
lum
e ($
bill
ion
)
ROW M&A transactions
European divitions/assets sold
European companies sold
US divisions/assets sold
US companies sold
Teva/Allerga Generics
$40.5 billion
J&J/Actelion
$30 billion
Takeda/Shire
$59 billion
BMS/Celgene
$74 billion
Actavis/Allergan
$70.5 billion
Abbvie/Allergan $63 billion
(not completed yet)

HBM Pharma/Biotech M&A Report 2020
3
Table: Largest Completed and Announced Biopharma M&A Transactions in 2019
Notes: Transactions ranked by total transaction value Regions and countries (columns 1 and 3): In case of whole companies sold = location of headquarter; in case of asset/division deals = country of business (if available) NC = Announced transactions, not completed yet at year end 2019 “Asset/Div.” = Sale of assets, divisions and subsidiaries “Market” = Approved or marketed drugs | “NDA” – NDA filed | “1”, “2” and “3” = Phase 1 2 3, stage of lead product
1) Osiris with its regenerative medicine products including skin, bone graft and articular cartilage substitutes was classified as a “biopharma company” even though one could argue that it is more a medtech-like company.
A list of all biopharma US and European M&A transactions since 2005 with disclosed transaction volumes (Excel sheet) can be found here http://www.hbmpartners.com/reports.
Target Company/Business Public/
Private
VC- or PE-
Backed /
Premium
Buyer Upfront
Deal Value
($m)
Total Deal
Value ($m)
Phase/Stage
of Lead
Product
Est. VC
Invest-
ment
($m)
Therapeutic Area(s)
US Celgene / US Public 53% Bristol-Myers Squibb / US 74'000 80'000 Market Oncology, autoimmune diseases
Europe NC Allergan / Ireland Public 45% AbbVie / US 63'000 63'000 Market Medical aesthetics, eye care, CNS
US Otezla (Celgene product) / US Asset/Div. Amgen / US 13'400 13'400 Market Psoriasis, arthritis
US Pfizer Upjohn / US Merger Mylan (new Viatris) / Netherlands 12'000 12'000 Market Various generics
US Array BioPharma / US Public 62% Pfizer / US 11'400 11'400 Market Oncology
US NC The Medicines Company / US Public 24% Novartis / Switzerland 9'700 9'700 3 Genetic cardiovascular diseases
US Loxo Oncology / US Public 68% Eli Lilly / US 8'000 8'000 2 Oncology
US Tesaro / US Public 57% GlaxoSmithKline / UK 5'100 5'100 Market Oncology
US Spark Therapeutics / US Public 122% Roche / Switzerland 4'300 4'300 2 Gene therapy
Europe Merck KGaA Cancer IO Pipeline / Germany Asset/Div. GSK / UK 340 4'200 2 Cancer IO products
US NC Audentes Therapeutics / US Public 110% Astellas Pharma / Japan 2'700 2'700 NDA Genetic neuromuscular diseases
US NC ArQule / US Public 107% Merck & Co. / US 2'700 2'700 2 B-cell malignancies
US NC Synthorx / US Public 172% Sanofi / US 2'500 2'500 1 Cancer, solid tumors
US Peloton Therapeutics / US Private VC Merck & Co. / US 1'050 2'200 2 137 Oncology, kidney cancer
US NC Ra Pharmaceuticals / US Public 100% UCB / Belgium 2'100 2'100 3 Myasthenia gravis
US Alder Biopharmaceuticals / US Public 79% Lundbeck / Denmark 1'950 2'020 NDA Migraine
US IFM Tre / US Private VC Novartis / Switzerland 310 1'575 1 242 NASH, inflammation, genetic dis.
US Promedior / US Private VC Roche / Switzerland 390 1'390 2 77 Anti-fibrotic diseases
Europe Veloxis Pharmaceuticals AS / Denmark Public Asahi Kasei Corp / Japan 1'300 1'300 Market Prevention of organ rejection
ROW Clementia Pharmaceuticals / Canada Public 70% Ipsen / France 1'000 1'263 3 Genetic diseases
Asia Kyowa Hakko Bio / Japan Public Kirin Holdings / Japan 1'200 1'200 Market Consumer health
US Paragon Bioservices / US Private VC Catalent / US 1'200 1'200 n.a. Gene therapy production
US Achillion Pharmaceuticals / US Public 72% Alexion Pharmaceuticals / US 930 1'100 2 Factor D inhibitors, genetic dis.
Europe GSK (rabies vaccine etc.) / UK Asset/Div. Bavarian Nordic / Denmark 336 1'050 Market Rabies & ensphalitis vaccines
US Exonics Therapeutics / US Private VC Vertex / US 245 1'000 Preclinical Genetic diseases, DMD
US Dova Pharmaceuticals / US Public 36% SOBI Swedish Orphan Biovitrum / Sweden915 965 Market ITP, chronic liver disease
US Semma Therapeutics / US Private VC Vertex Pharmaceuticals Inc / US 950 950 Preclinical Type 1 diabetes
US Rodin Therapeutics / US Private VC Alkermes / Ireland 100 950 Preclinical 45 Neurodegenerative disorders
Europe Nightstar Therapeutics / UK Public 69% Biogen / US 877 877 3 Genetic dis., choroideremia (CHM)
Europe Therachon / Switzerland Private VC Pfizer / US 340 810 1 163 Genetic diseases, achondroplasia
US Tilos Therapeutics / US Private VC Merck & Co. / US not discl. 773 Preclinical 57 Cancer, fibrotic diseases
US Xyphos Biosciences / US Private VC Astellas Pharma / Japan 120 665 Preclinical 100 Cancer, bi-specific AB
ROW Takeda (Russian OTC business) / Russia Asset/Div. Stada Arzneimittel AG / Germany 660 660 Market Various OTC and RX products
US 1) Osiris Therapeutics / US Public Smith & Nephew / UK 660 660 Market Wound healing, regenerative medicine
US BlueRock (remaining 60% ) / US Private VC Bayer / Germany 240 600 1 Cell therapies,neurology, cardiology etc.
US Calporta Therapeutics / US Private VC Merck / US not discl. 576 Preclinical Lysosomal storage disorders
Europe Breath Therapeutics / Germany Private VC Zambon / Italy 156 558 3 Respiratory, bronchiolitis
Asia Kyowa Pharma (subs. Lupin) / Japan Asset/Div. PE Unison Capital / Japan 526 526 Market Branded generics
Europe NovImmune (emapalumab assets) / SwitzerlandPrivate VC SOBI / Sweden 520 520 Market 10 Primary haemophagocytic lymphohistiocytosis
Asia Aspen Japan (subs. Aspen Global) / Japan Asset/Div. Novartis / Switzerland 331 442 Market Generics
US NC Progenics Pharmaceuticals / US Public Lantheus Holdings / US 412 412 Market Oncology
US Modis Therapeutics / US Private VC Zogenix / US 250 400 2 240 Genetic disease; Thymidine Kinase 2 deficiency
US Abide Therapeutics / US Private VC Lundbeck / Denmark 250 400 2 Gilles de la Tourette's syndrome, Neuropathic pain
Europe Amal Therapeutics / Switzerland Private VC Boehringer Ingelheim / Germany not discl. 366 Preclinical Cancer IO and vaccines
Europe Trimb Healthcare / Sweden Private PE Karo Pharma / Sweden 360 360 Market Various, OTC
Europe Pensa (generics subs. Esteve) / Spain Asset/Div. Towa Pharmaceutical / Japan 356 356 Market Generics
US AvKare / US Private Amneal Pharmaceuticals / US 340 340 Market Generics
US Cavion / US Private VC Jazz Pharmaceuticals / Iceland 53 313 2 Essential tremor
US Immune Design / US Public 300% Merck & Co. / US 300 300 2 Cancer vaccines
US Spectrum Pharmaceuticals / US Asset/Div. Acrotech (Aurobindo Subs.) / India 160 300 Market Hematology, oncology
ROW Grupo Biotoscana (51% stake) / Uruguay Public PE Knight Therapeutics / Canada 143 281 Market Specialty generics
Asia Arrow Pharmaceuticals (subs. Strides Pharma Science) / AustraliaAsset/Div. PE Arrotex Australia / Australia 208 272 Market Generics
US BioElectron Technology / US Asset/Div. VC PTC Therapeutics / US 10 210 Phase 2 Genetic mitochondrial diseases
Asia Boan Biological Technology / China Private Luye Pharma / China 103 205 Preclinical Biosimilars
US Synergy (from bankruptcy) / US Asset/Div. Bausch Health / Canada 200 200 Market GI
Asia Takeda (OTC drugs EM) / Japan Asset/Div. Acino / Switzerland 200 200 Market Primary care products
US Semnur Pharmaceuticals / US Private VC Scilex Holding (formerly Sorrento) / US 60 200 3 Non-opioid pain management
HBM Pharma/Biotech M&A Report 2020
4
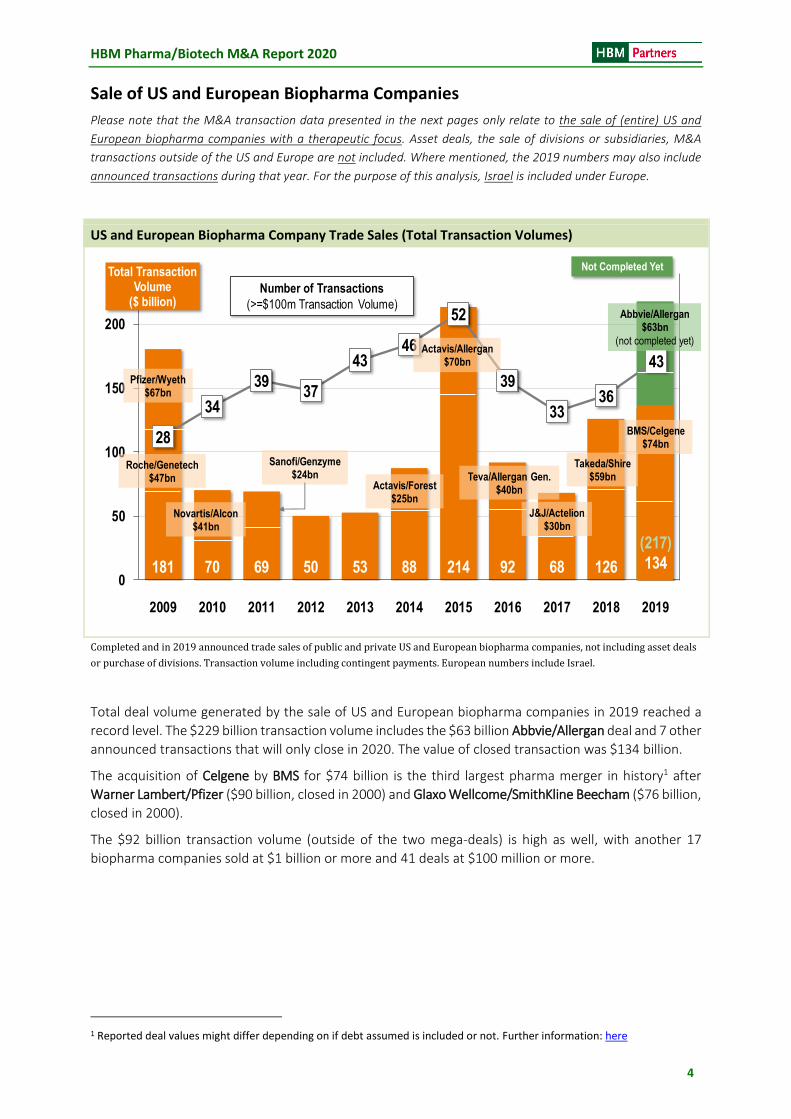
Sale of US and European Biopharma Companies
Please note that the M&A transaction data presented in the next pages only relate to the sale of (entire) US and
European biopharma companies with a therapeutic focus. Asset deals, the sale of divisions or subsidiaries, M&A
transactions outside of the US and Europe are not included. Where mentioned, the 2019 numbers may also include
announced transactions during that year. For the purpose of this analysis, Israel is included under Europe.
US and European Biopharma Company Trade Sales (Total Transaction Volumes)
Completed and in 2019 announced trade sales of public and private US and European biopharma companies, not including asset deals
or purchase of divisions. Transaction volume including contingent payments. European numbers include Israel.
Total deal volume generated by the sale of US and European biopharma companies in 2019 reached a
record level. The $229 billion transaction volume includes the $63 billion Abbvie/Allergan deal and 7 other
announced transactions that will only close in 2020. The value of closed transaction was $134 billion.
The acquisition of Celgene by BMS for $74 billion is the third largest pharma merger in history1 after
Warner Lambert/Pfizer ($90 billion, closed in 2000) and Glaxo Wellcome/SmithKline Beecham ($76 billion,
closed in 2000).
The $92 billion transaction volume (outside of the two mega-deals) is high as well, with another 17
biopharma companies sold at $1 billion or more and 41 deals at $100 million or more.
1 Reported deal values might differ depending on if debt assumed is included or not. Further information: here
181 70 69 50 53 88 214 92 68 126 218
28
34
3937
4346
52
39
3336
43
0
50
100
150
200
2009 2010 2011 2012 2013 2014 2015 2016 2017 2018 2019
Total Transaction Volume
($ billion)
(217)
134
(217)
134
Pfizer/Wyeth$67bn
Roche/Genetech$47bn
Novartis/Alcon$41bn
Sanofi/Genzyme$24bn
Actavis/Forest$25bn
Actavis/Allergan$70bn
Teva/Allergan Gen.$40bn
J&J/Actelion$30bn
Takeda/Shire$59bn
Abbvie/Allergan$63bn
(not completed yet)
Number of Transactions
(>=$100m Transaction Volume)
BMS/Celgene$74bn
Not Completed Yet
HBM Pharma/Biotech M&A Report 2020
5
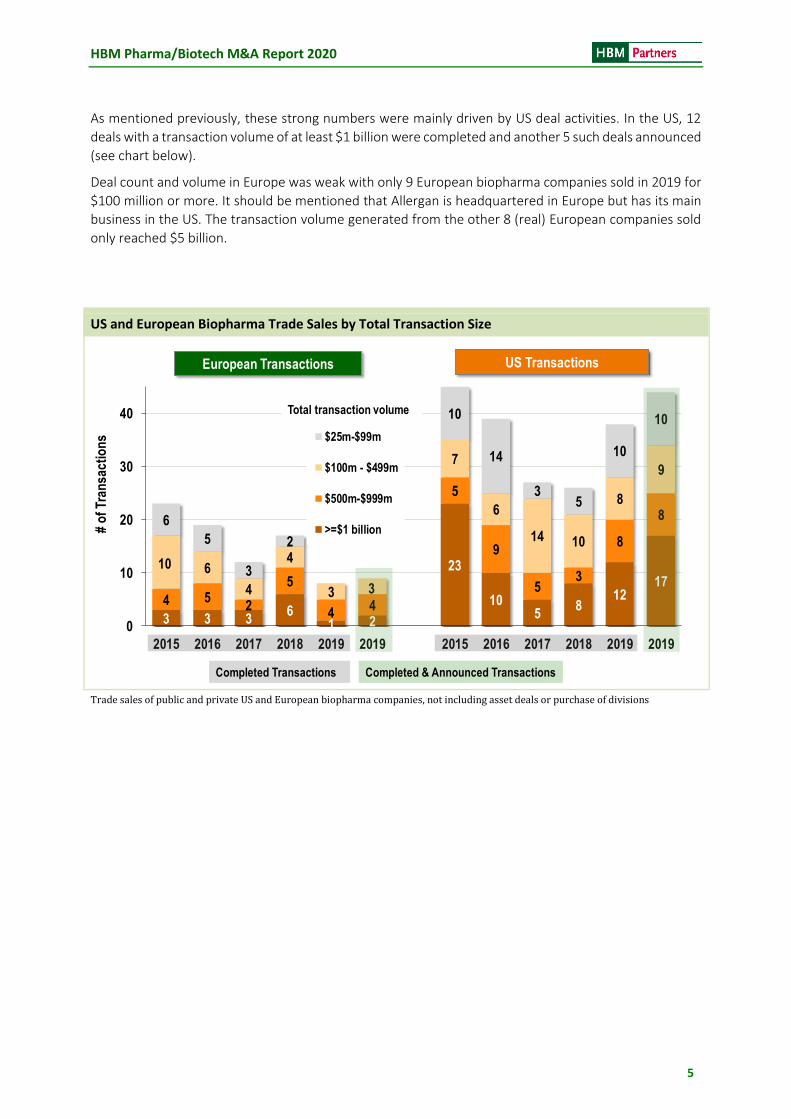
As mentioned previously, these strong numbers were mainly driven by US deal activities. In the US, 12
deals with a transaction volume of at least $1 billion were completed and another 5 such deals announced
(see chart below).
Deal count and volume in Europe was weak with only 9 European biopharma companies sold in 2019 for
$100 million or more. It should be mentioned that Allergan is headquartered in Europe but has its main
business in the US. The transaction volume generated from the other 8 (real) European companies sold
only reached $5 billion.
US and European Biopharma Trade Sales by Total Transaction Size
Trade sales of public and private US and European biopharma companies, not including asset deals or purchase of divisions
3 3 36
1 2
23
105
812
17
4 52
5
44
5
9
53
8
8
10 6
4
4
3 3
7
6
14 10
8
9
6
5
3
2
10
14
35
10
10
0
10
20
30
40
2015 2016 2017 2018 2019 2019 2015 2016 2017 2018 2019 2019
# o
f T
ran
sact
ion
s $25m-$99m
$100m - $499m
$500m-$999m
>=$1 billion
European Transactions US Transactions
Completed Transactions Completed & Announced Transactions
Total transaction volume

HBM Pharma/Biotech M&A Report 2020
6
Premiums Paid for Public US and European Biopharma Companies
Premium = Increase of stock price on the day of deal announcement. Only deals with an upfront consideration of at
least $100 million are included in this analysis. Given the high degree of variation in premiums paid, the average
numbers should be interpreted with caution.
Premiums Paid for US and European Public Biopharma Companies
Completed and announced (2019) trade sales of public US and European biopharma companies with total deal value of at least $100 million. Non-weighted average premiums.
◼ Average premiums paid in 2019 for public US and European biopharma companies reached almost
100%. These very high premiums show that there is a continued appetite for acquisitions despite the
already high valuations of public biopharma companies.
◼ The premiums paid in large deals ($10 billion or more) was generally lower than that for smaller
companies: The average premiums paid in the 13 $10-billion-plus deals done during the five years
2015-2019 was 43% vs. the average premium of 84% paid in smaller transactions).
◼ As seen in the chart above, premiums paid for European companies have - until 2017 – been lower
than for US companies. In 2018 and 2019 premiums paid in Europe caught up with the numbers in
the US.
◼ Smaller and clinical-stage companies generally received higher premiums than companies with
approved or marketed products (see table below).
Average Premiums Paid for US & European Public Biopharma Companies 2015-2019 by Stage of Lead
Product (total deal value $100 million or more)
Phase 2 Phase 3 NDA Filed Approved/
Marketed
Total*
# of public companies sold 15 16 8 36 75
Average premium paid 136% 65% 72% 43% 72%
7HBM Biopharma M&A Report
47%
77%
57%
29%
60%
36%
109%
82%
70%
97%
36%
46%
25%27%
31%
64%
26%
73%
94%
0%
20%
40%
60%
80%
100%
120%
2010 2011 2012 2013 2014 2015 2016 2017 2018 2019
Ave
rag
e P
rem
ium
sP
aid
in P
ub
lic T
akeo
vers
US and European public takeovers with
total deal value of at least $100 million
Including 500% premium paid by
Allergan for Tobira.
Without that deal the average
premium in 2016 would be 70%.
High Premiums Paid in 2018 for Public US & European Companies
Premiums* Paid for Public Take-Overs 2009-2018
Average
Premiums
paid for
European
Companies
Average
Premiums
Paid for US
Companies
Only two
European
transactions
in 2019!
HBM Pharma/Biotech M&A Report 2020
7
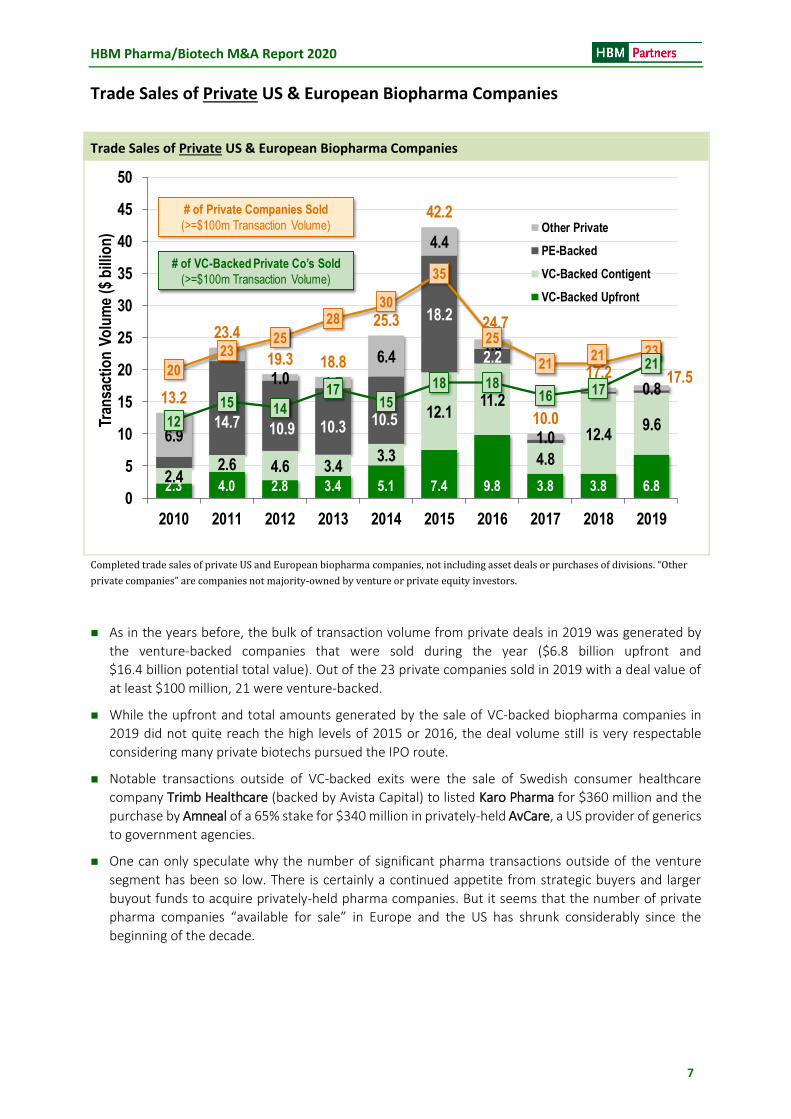
Trade Sales of Private US & European Biopharma Companies
Trade Sales of Private US & European Biopharma Companies
Completed trade sales of private US and European biopharma companies, not including asset deals or purchases of divisions. “Other
private companies” are companies not majority-owned by venture or private equity investors.
◼ As in the years before, the bulk of transaction volume from private deals in 2019 was generated by
the venture-backed companies that were sold during the year ($6.8 billion upfront and
$16.4 billion potential total value). Out of the 23 private companies sold in 2019 with a deal value of
at least $100 million, 21 were venture-backed.
◼ While the upfront and total amounts generated by the sale of VC-backed biopharma companies in
2019 did not quite reach the high levels of 2015 or 2016, the deal volume still is very respectable
considering many private biotechs pursued the IPO route.
◼ Notable transactions outside of VC-backed exits were the sale of Swedish consumer healthcare
company Trimb Healthcare (backed by Avista Capital) to listed Karo Pharma for $360 million and the
purchase by Amneal of a 65% stake for $340 million in privately-held AvCare, a US provider of generics
to government agencies.
◼ One can only speculate why the number of significant pharma transactions outside of the venture
segment has been so low. There is certainly a continued appetite from strategic buyers and larger
buyout funds to acquire privately-held pharma companies. But it seems that the number of private
pharma companies “available for sale” in Europe and the US has shrunk considerably since the
beginning of the decade.
2.3 4.0 2.8 3.4 5.1 7.4 9.8 3.8 3.8 6.82.4
2.6 4.6 3.43.3
12.111.2
4.8
12.49.614.7 10.9 10.3 10.5
18.2
2.2
6.9
2.1
1.0 1.7
6.4
4.4
1.5
1.0
0.7 0.813.2
23.4
19.3 18.8
25.3
42.2
24.7
10.0
17.2 17.520
2325
2830
35
25
2121 23
12
15 14
1715
18 1816 17
21
0
5
10
15
20
25
30
35
40
45
50
2010 2011 2012 2013 2014 2015 2016 2017 2018 2019
Tran
sact
ion
Vo
lum
e ($
bill
ion
) Other Private
PE-Backed
VC-Backed Contigent
VC-Backed Upfront
# of Private Companies Sold
(>=$100m Transaction Volume)
# of VC-Backed Private Co’s Sold
(>=$100m Transaction Volume)
HBM Pharma/Biotech M&A Report 2020
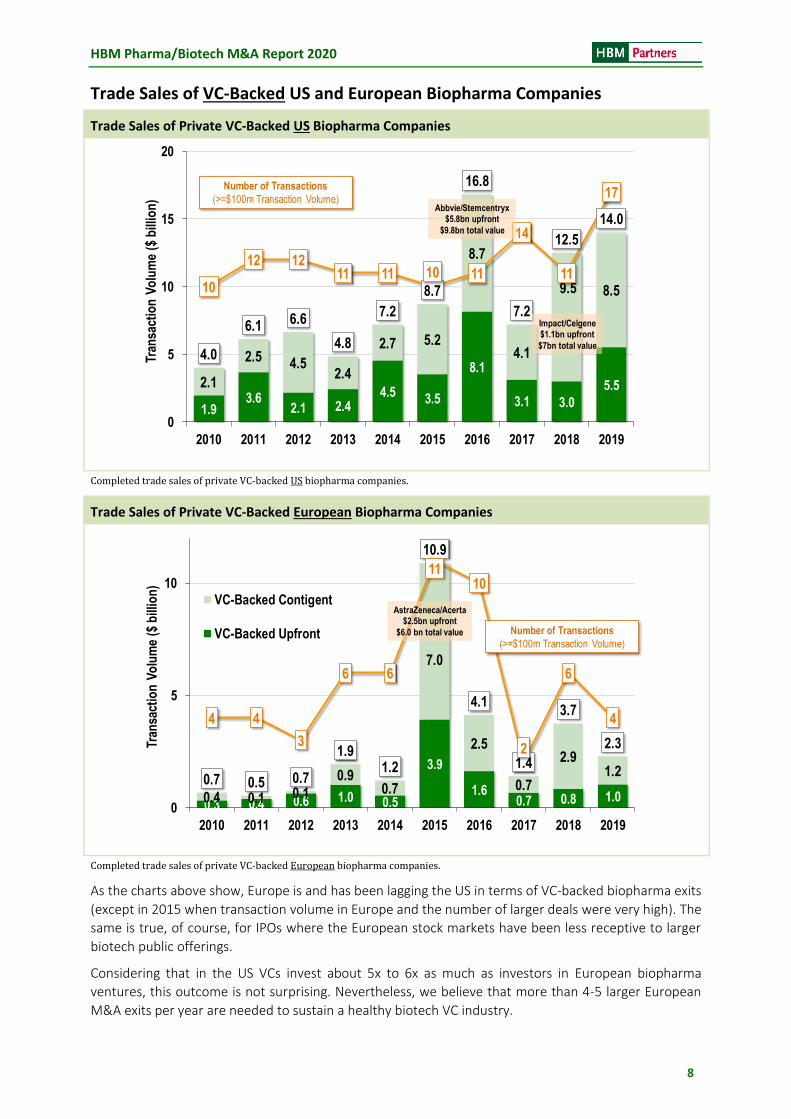
8
Trade Sales of VC-Backed US and European Biopharma Companies
Trade Sales of Private VC-Backed US Biopharma Companies
Completed trade sales of private VC-backed US biopharma companies.
Trade Sales of Private VC-Backed European Biopharma Companies
Completed trade sales of private VC-backed European biopharma companies.
As the charts above show, Europe is and has been lagging the US in terms of VC-backed biopharma exits
(except in 2015 when transaction volume in Europe and the number of larger deals were very high). The
same is true, of course, for IPOs where the European stock markets have been less receptive to larger
biotech public offerings.
Considering that in the US VCs invest about 5x to 6x as much as investors in European biopharma
ventures, this outcome is not surprising. Nevertheless, we believe that more than 4-5 larger European
M&A exits per year are needed to sustain a healthy biotech VC industry.
1.93.6
2.1 2.44.5
3.5
8.1
3.1 3.0
5.52.1
2.5 4.52.4
2.7 5.2
8.7
4.1
9.5 8.5
4.0
6.1 6.6
4.8
7.2
8.7
16.8
7.2
12.5
14.0
10
12 1211 11 10 11
14
11
17
0
5
10
15
20
2010 2011 2012 2013 2014 2015 2016 2017 2018 2019
Tran
sact
ion
Vo
lum
e ($
bill
ion
)
Number of Transactions
(>=$100m Transaction Volume)Abbvie/Stemcentryx
$5.8bn upfront
$9.8bn total value
Impact/Celgene$1.1bn upfront
$7bn total value
0.3 0.4 0.6 1.0 0.5
3.9
1.60.7 0.8 1.00.4 0.1 0.1
0.90.7
7.0
2.5
0.7
2.91.2
0.7 0.5 0.7
1.91.2
10.9
4.1
1.4
3.7
2.3
4 4
3
6 6
1110
2
6
4
0
5
10
2010 2011 2012 2013 2014 2015 2016 2017 2018 2019
Tran
sact
ion
Vo
lum
e ($
bill
ion
)
VC-Backed Contigent
VC-Backed Upfront Number of Transactions
(>=$100m Transaction Volume)
AstraZeneca/Acerta$2.5bn upfront
$6.0 bn total value
HBM Pharma/Biotech M&A Report 2020
9
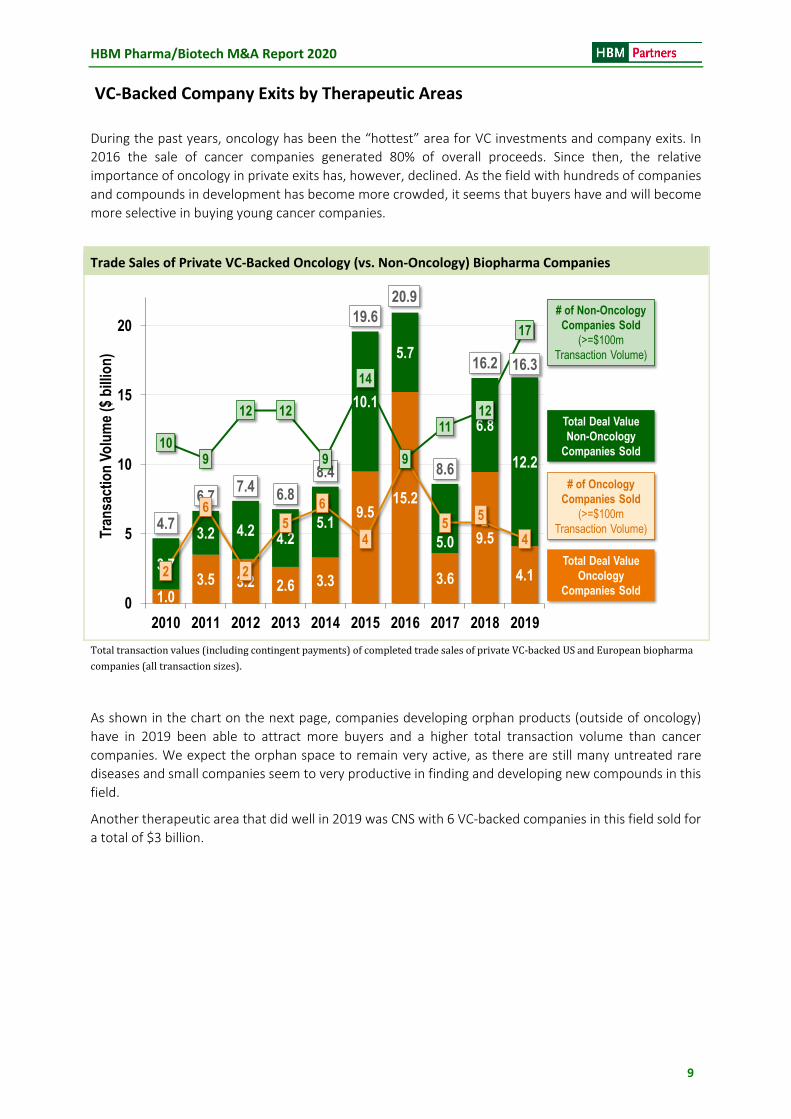
VC-Backed Company Exits by Therapeutic Areas
During the past years, oncology has been the “hottest” area for VC investments and company exits. In
2016 the sale of cancer companies generated 80% of overall proceeds. Since then, the relative
importance of oncology in private exits has, however, declined. As the field with hundreds of companies
and compounds in development has become more crowded, it seems that buyers have and will become
more selective in buying young cancer companies.
Trade Sales of Private VC-Backed Oncology (vs. Non-Oncology) Biopharma Companies
Total transaction values (including contingent payments) of completed trade sales of private VC-backed US and European biopharma
companies (all transaction sizes).
As shown in the chart on the next page, companies developing orphan products (outside of oncology)
have in 2019 been able to attract more buyers and a higher total transaction volume than cancer
companies. We expect the orphan space to remain very active, as there are still many untreated rare
diseases and small companies seem to very productive in finding and developing new compounds in this
field.
Another therapeutic area that did well in 2019 was CNS with 6 VC-backed companies in this field sold for
a total of $3 billion.
12HBM Biopharma M&A Report
Trade Sales of Private Biopharma Companies 2010-2019
1.03.5 3.2 2.6 3.3
9.515.2
3.6
9.5
4.13.7
3.2 4.24.2
5.1
10.1
5.7
5.0
6.8
12.2
4.7
6.77.4
6.8
8.4
19.6
20.9
8.6
16.2 16.3
2
6
2
5
6
4
9
55
4
109
12 12
9
14
9
1112
17
0
5
10
15
20
2010 2011 2012 2013 2014 2015 2016 2017 2018 2019
Tran
sact
ion
Vo
lum
e ($
bill
ion
)
Trade sales of private US & European biopharma companies (completed transactions)
# of Oncology
Companies Sold
(>=$100m
Transaction Volume)
# of Non-Oncology
Companies Sold
(>=$100m
Transaction Volume)
Total Deal Value
Non-Oncology
Companies Sold
Total Deal Value
Oncology
Companies Sold

HBM Pharma/Biotech M&A Report 2020
10
Trade Sales of VC-Backed Orphan (vs. “Other”) Companies
Total transaction values (including contingent payments) of completed trade sales of private VC-backed US and European biopharma
companies (all transaction sizes).
13HBM Biopharma M&A Report
Trade Sales of Private Biopharma Companies 2010-2019
1.1 1.6 1.3 2.0 2.6
5.5
7.3
17.9 19.6
6.6
13.6
10.8
8.4
19.6
20.9
8.6
16.2 16.3
3 3 3
5
3
8
12
15 15
11
1413
0
5
10
15
20
2014 2015 2016 2017 2018 2019
Tran
sact
ion
Vo
lum
e ($
bill
ion
)
Trade sales of private US & European biopharma companies (completed transactions)
# of Co’s Sold
With Orphan Prod.
(>=$100m
Transaction Volume)
# of Other
Companies Sold
(>=$100m
Transaction Volume)
Total Deal Value
Other Companies
Sold
Total Deal Value
Co’s Sold With
Orphan Products
Noteworthy Venture Exits in 2019
In May 2019, US-based Peleton Therapeutics was sold to Merck for $1.05 billion million upfront plus potential milestone payments of up to $1.15 billion. Peleton with its phase 3-ready kidney cancer drug was founded in 2010. It is estimated that over $200 million were invested by VCs in the company generating significant returns for investors such as Column Group, EcoR1, Nextech, RA and Foresite.
Also in May 2019, US IFM Tre was acquired by Novartis for $310 million upfront plus contingent payments of up to $1.265 billion. IFM Tre’s portfolio of NLPR3 antagonists, consisting of one clinical and two preclinical programs, target chronic inflammatory and fibrotic disorders. With only about $30 million invested, the exit should provide a great return for Atlas and Abingworth. And, another sibling company of IFM was already sold in 2017 to BMS for up to $1.3 billion.
In November 2019, Roche acquired US Promedior for up to $1.39 billion ($390 million upfront), a year after previous suitor BMS opted not to exercise its right to acquire the developer of treatments for fibrotic diseases. Earlier in 2019, Promedior generated positive Phase II results in idiopathic pulmonary fibrosis (IPF) and myelofibrosis (MF). The company, founded in 2006, was financed with an estimated $63 million by various VCs (Forbion, Polaris, Morgenthaler, Healthcare Ventures, Easton Capital), thus providing great returns to investors.
Vertex acquired two companies in 2019. Vertex picked up Exonics Therapeutics in June 2019 (for $245 million upfront and $1 billion total potential value) with its SingleCut CRISPR gene editing technology to develop treatments by repairing mutations that cause DMD and other genetic neuromuscular diseases. Exonics was launched in 2017 and received $45 million of financing by CureDuchenne Ventures and Column Group.
With the acquisition of Semma Therapeutics in October 2019 for $950 million in cash, Vertex made a bet on the use of stem cell-derived human islets as a potentially curative treatment for type 1 diabetes. Semma was founded in 2016 and financed with an estimated $163 million by VCs such as Eight Roads, Arch, MPM, Cowen, F-Prime and the corporate venture funds of Novartis and Medtronic.
HBM Pharma/Biotech M&A Report 2020
11
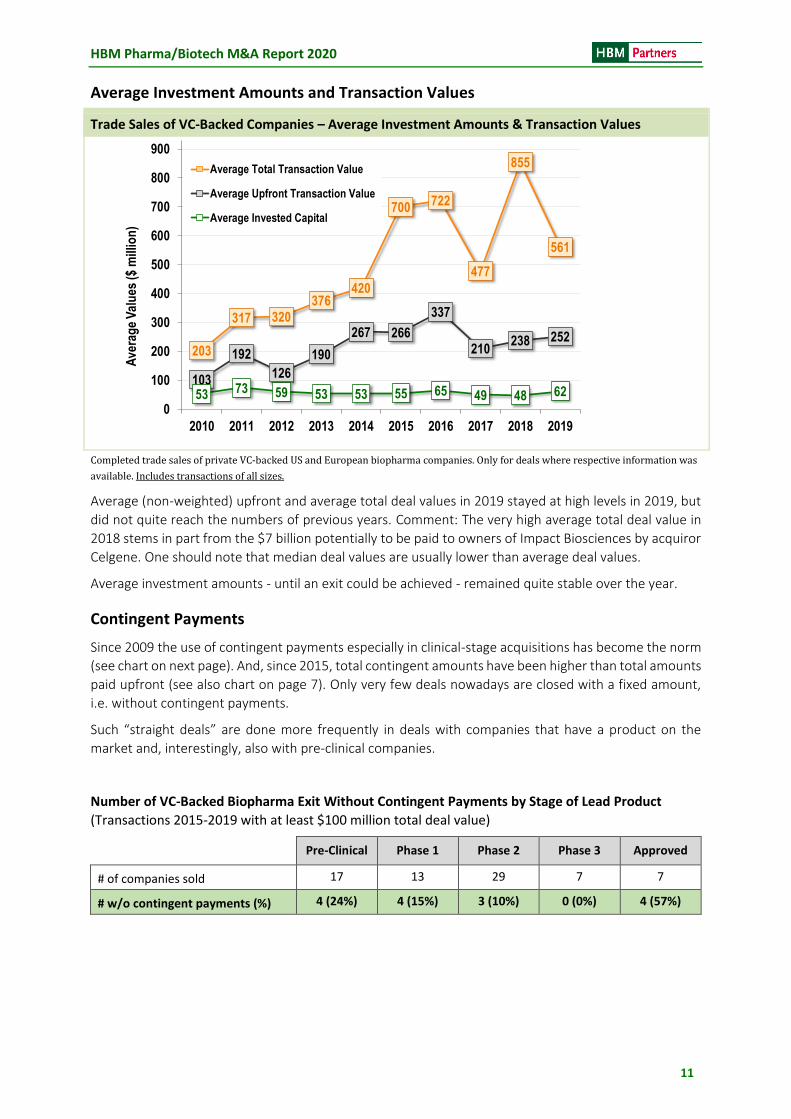
Average Investment Amounts and Transaction Values
Trade Sales of VC-Backed Companies – Average Investment Amounts & Transaction Values
Completed trade sales of private VC-backed US and European biopharma companies. Only for deals where respective information was
available. Includes transactions of all sizes.
Average (non-weighted) upfront and average total deal values in 2019 stayed at high levels in 2019, but
did not quite reach the numbers of previous years. Comment: The very high average total deal value in
2018 stems in part from the $7 billion potentially to be paid to owners of Impact Biosciences by acquiror
Celgene. One should note that median deal values are usually lower than average deal values.
Average investment amounts - until an exit could be achieved - remained quite stable over the year.
Contingent Payments
Since 2009 the use of contingent payments especially in clinical-stage acquisitions has become the norm
(see chart on next page). And, since 2015, total contingent amounts have been higher than total amounts
paid upfront (see also chart on page 7). Only very few deals nowadays are closed with a fixed amount,
i.e. without contingent payments.
Such “straight deals” are done more frequently in deals with companies that have a product on the
market and, interestingly, also with pre-clinical companies.
Number of VC-Backed Biopharma Exit Without Contingent Payments by Stage of Lead Product
(Transactions 2015-2019 with at least $100 million total deal value)
Pre-Clinical Phase 1 Phase 2 Phase 3 Approved
# of companies sold 17 13 29 7 7
# w/o contingent payments (%) 4 (24%) 4 (15%) 3 (10%) 0 (0%) 4 (57%)
14HBM Biopharma M&A Report
203
317 320
376420
700722
477
855
561
103
192
126
190
267 266
337
210238 252
53 73 59 53 53 55 65 49 48 62
0
100
200
300
400
500
600
700
800
900
2010 2011 2012 2013 2014 2015 2016 2017 2018 2019
Ave
rag
e V
alu
es ($
mill
ion
)
Average Total Transaction Value
Average Upfront Transaction Value
Average Invested Capital
Average Investment / Average Upfront and Total Deal Values
Trade sales of private VC-backed US &
European biopharma companies
Only for transactions where
respective information was available.
Trade sales of private VC-backed US & European biopharma companies
HBM Pharma/Biotech M&A Report 2020
12
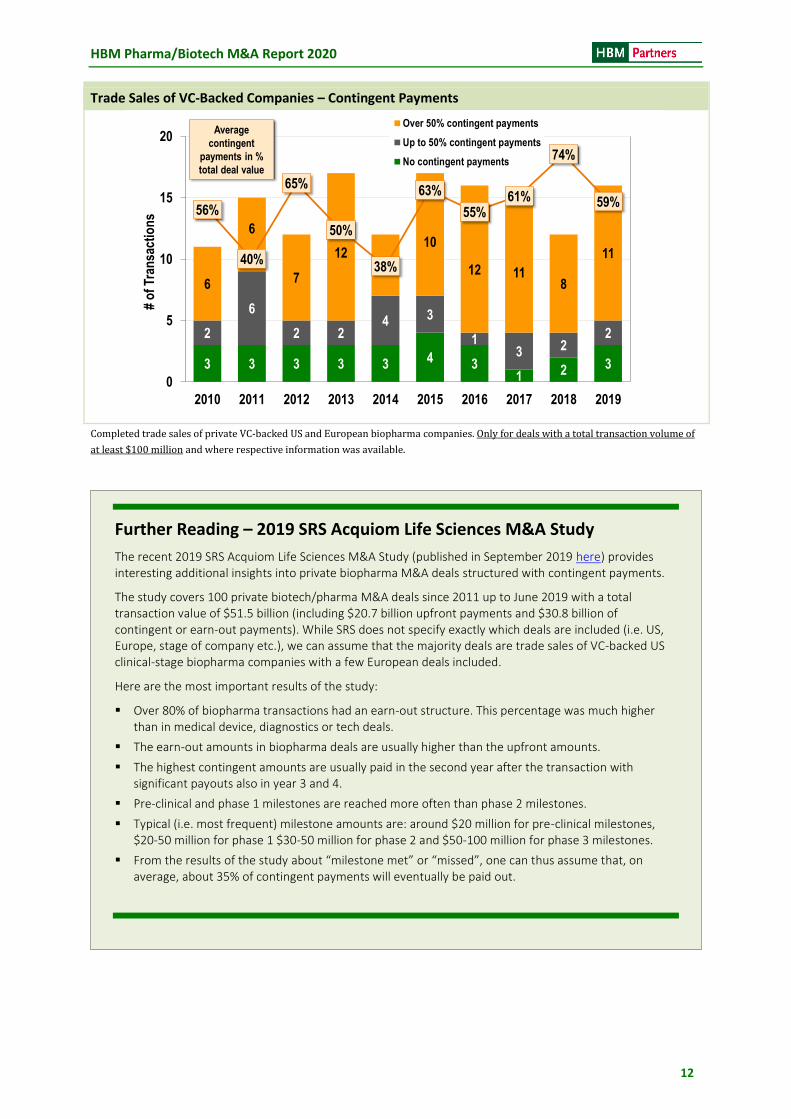
Trade Sales of VC-Backed Companies – Contingent Payments
Completed trade sales of private VC-backed US and European biopharma companies. Only for deals with a total transaction volume of
at least $100 million and where respective information was available.
15HBM Biopharma M&A Report
Contingent „Biodollar“ Payments as % of Total Deal Value
3 3 3 3 3 4 31 2 3
2
6
2 24 3
13 2
2
6
6
7
125
10
12 118
11
56%
40%
65%
50%
38%
63%
55%61%
74%
59%
0
5
10
15
20
2010 2011 2012 2013 2014 2015 2016 2017 2018 2019
# o
f Tr
ansa
ctio
ns
Over 50% contingent payments
Up to 50% contingent payments
No contingent payments
Average
contingent
payments in %
total deal value
Trade sales of private VC-backed US & European biopharma companies
Trade sales of private VC-backed US &
European biopharma companies
Only for transactions where
respective information was available.
Further Reading – 2019 SRS Acquiom Life Sciences M&A Study
The recent 2019 SRS Acquiom Life Sciences M&A Study (published in September 2019 here) provides interesting additional insights into private biopharma M&A deals structured with contingent payments.
The study covers 100 private biotech/pharma M&A deals since 2011 up to June 2019 with a total transaction value of $51.5 billion (including $20.7 billion upfront payments and $30.8 billion of contingent or earn-out payments). While SRS does not specify exactly which deals are included (i.e. US, Europe, stage of company etc.), we can assume that the majority deals are trade sales of VC-backed US clinical-stage biopharma companies with a few European deals included.
Here are the most important results of the study:
▪ Over 80% of biopharma transactions had an earn-out structure. This percentage was much higher than in medical device, diagnostics or tech deals.
▪ The earn-out amounts in biopharma deals are usually higher than the upfront amounts.
▪ The highest contingent amounts are usually paid in the second year after the transaction with significant payouts also in year 3 and 4.
▪ Pre-clinical and phase 1 milestones are reached more often than phase 2 milestones.
▪ Typical (i.e. most frequent) milestone amounts are: around $20 million for pre-clinical milestones, $20-50 million for phase 1 $30-50 million for phase 2 and $50-100 million for phase 3 milestones.
▪ From the results of the study about “milestone met” or “missed”, one can thus assume that, on average, about 35% of contingent payments will eventually be paid out.
HBM Pharma/Biotech M&A Report 2020
13
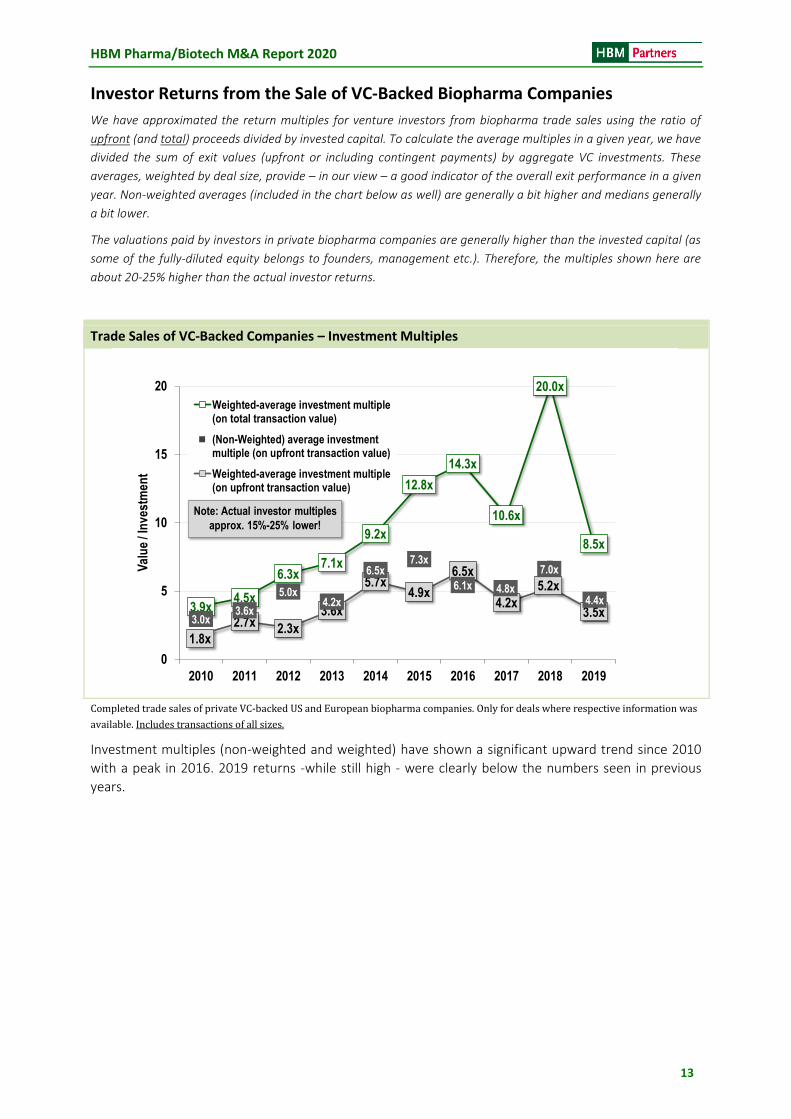
Investor Returns from the Sale of VC-Backed Biopharma Companies
We have approximated the return multiples for venture investors from biopharma trade sales using the ratio of
upfront (and total) proceeds divided by invested capital. To calculate the average multiples in a given year, we have
divided the sum of exit values (upfront or including contingent payments) by aggregate VC investments. These
averages, weighted by deal size, provide – in our view – a good indicator of the overall exit performance in a given
year. Non-weighted averages (included in the chart below as well) are generally a bit higher and medians generally
a bit lower.
The valuations paid by investors in private biopharma companies are generally higher than the invested capital (as
some of the fully-diluted equity belongs to founders, management etc.). Therefore, the multiples shown here are
about 20-25% higher than the actual investor returns.
Trade Sales of VC-Backed Companies – Investment Multiples
Completed trade sales of private VC-backed US and European biopharma companies. Only for deals where respective information was
available. Includes transactions of all sizes.
Investment multiples (non-weighted and weighted) have shown a significant upward trend since 2010
with a peak in 2016. 2019 returns -while still high - were clearly below the numbers seen in previous
years.
17HBM Biopharma M&A Report
Average Investment Multiples On Upfront and Total Deal Value
3.9x4.5x
6.3x7.1x
9.2x
12.8x
14.3x
10.6x
20.0x
8.5x
1.8x
2.7x 2.3x
3.6x
5.7x4.9x
6.5x
4.2x
5.2x
3.5x3.0x
3.6x
5.0x4.2x
6.5x7.3x
6.1x 4.8x
7.0x
4.4x
0
5
10
15
20
2010 2011 2012 2013 2014 2015 2016 2017 2018 2019
Val
ue
/ In
vest
men
t
Weighted-average investment multiple(on total transaction value)
(Non-Weighted) average investmentmultiple (on upfront transaction value)
Weighted-average investment multiple(on upfront transaction value)
Trade sales of private VC-backed US & European biopharma companies
Trade sales of private VC-backed US &
European biopharma companies
Only for transactions where
respective information was available.
Note: Actual investor multiples
approx. 15%-25% lower!
HBM Pharma/Biotech M&A Report 2020
14
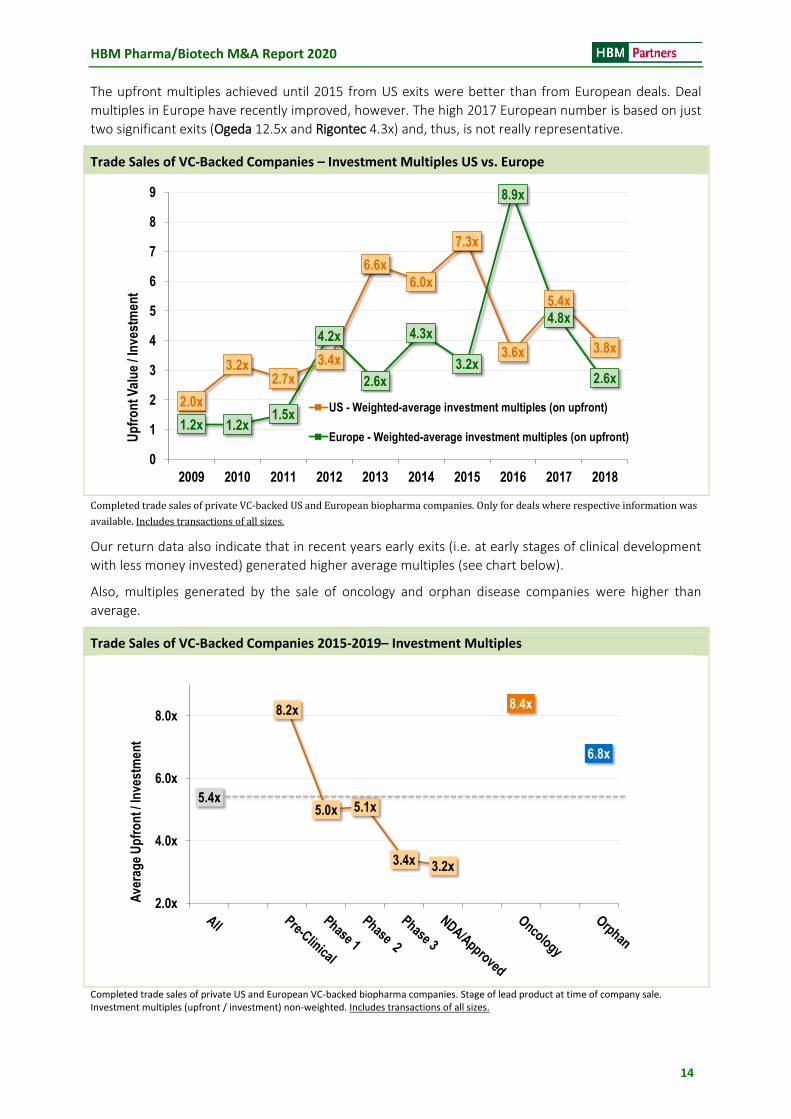
The upfront multiples achieved until 2015 from US exits were better than from European deals. Deal
multiples in Europe have recently improved, however. The high 2017 European number is based on just
two significant exits (Ogeda 12.5x and Rigontec 4.3x) and, thus, is not really representative.
Trade Sales of VC-Backed Companies – Investment Multiples US vs. Europe
Completed trade sales of private VC-backed US and European biopharma companies. Only for deals where respective information was
available. Includes transactions of all sizes.
Our return data also indicate that in recent years early exits (i.e. at early stages of clinical development
with less money invested) generated higher average multiples (see chart below).
Also, multiples generated by the sale of oncology and orphan disease companies were higher than
average.
Trade Sales of VC-Backed Companies 2015-2019– Investment Multiples
Completed trade sales of private US and European VC-backed biopharma companies. Stage of lead product at time of company sale. Investment multiples (upfront / investment) non-weighted. Includes transactions of all sizes.
18HBM Biopharma M&A Report
Average Investment Multiples On Upfront Deal Value – US vs. Europe
2.0x
3.2x2.7x
3.4x
6.6x
6.0x
7.3x
3.6x
5.4x
3.8x
1.2x 1.2x1.5x
4.2x
2.6x
4.3x
3.2x
8.9x
4.8x
2.6x
0
1
2
3
4
5
6
7
8
9
2009 2010 2011 2012 2013 2014 2015 2016 2017 2018
Up
fro
ntV
alu
e / I
nve
stm
ent
US - Weighted-average investment multiples (on upfront)
Europe - Weighted-average investment multiples (on upfront)
Trade sales of private VC-backed US & European biopharma companies
Trade sales of private VC-backed US &
European biopharma companies
Only for transactions where
respective information was available.
19HBM Biopharma M&A Report
Average Investment Multiples On Upfront Deal Value – US vs. Europe
5.4x
8.2x
5.0x 5.1x
3.4x 3.2x
8.4x
6.8x
2.0x
4.0x
6.0x
8.0x
Ave
rag
e U
pfr
on
t / In
vest
men
t
Trade sales of private VC-backed US & European biopharma companies
Trade sales of private VC-backed US &
European biopharma companies
Only for transactions where
respective information was available.
HBM Pharma/Biotech M&A Report 2020
15
Summary and Outlook
2019 was a strong year for biopharma M&A mainly in the US. Even though some players that have been
engaged in very large transactions might be less active as buyers for some time, the appetite for
biopharma companies with unique assets will remain high.
We expect to see further active M&A deal making especially if the stock markets would become less
receptive for IPOs and if public company valuations come down.
Zug, 1 February 2020
The authors of the report welcome any feedback or corrections:
Dr Ulrich Geilinger, [email protected] , Dr Chandra Leo, [email protected] and
Dr Emil Bujak, [email protected]
About HBM Partners
HBM Partners is among the global leaders in healthcare-focused investing with approximately $1.7 billion in assets under management. HBM focuses on development stage, growth and buy-out financings of private and public biopharma, medical device and diagnostics companies. Investments in private companies usually range between $10 million to $50 million.
HBM Partners advises HBM Healthcare Investments AG (SIX: HMBN) as well as other specialized private & public equity funds.
HBM Partners has been an active contributor to value creation in its portfolio companies, generating over 60 trade sales and IPOs since its inception in 2001.
HBM Partners AG, CH-6300 Zug, Switzerland, www.hbmpartners.com, phone +41 43 888 71 71


