Marie-Aude AUFAUREEcole Centrale Paris
SAP Academic Chair in Business Intelligence
Graphs for Business Intelligence

Graphs for Business Intelligence – MA AUFAURE
Agenda
Context/motivation for using graph structures
Use cases
Variety of graphs
Application: extracting and aggregating graphs from relational databases
1st European Business Intelligence Summer School 2

Graphs for Business Intelligence – MA AUFAURE
CONTEXT/MOTIVATION
1st European Business Intelligence Summer School 3

Graphs for Business Intelligence – MA AUFAURE
Data Everywhere
1st European Business Intelligence Summer School 4
Information overload
More data stored in the Web in 2010 than all data produced sincethe begining of humanity until 2003!
By 2013, the amount of trafic flowing over the internet annually will reach 667 Exabytes (CISCO)

Graphs for Business Intelligence – MA AUFAURE
Big Data Data are mainly unstructured80% of data manipulated in an enterprise are unstructured
Data are produced in real time and distributed Data come from heterogeneous sources in an
unpredictable wayMobile phone, sensors, computers, TV, etc.
⇒ The world contains an unimaginably vast amount of digital information which is getting even vaster even more rapidly Data-centered economy
⇒ Big Data phenomena is considered as the main computer science challenge for the next decade
1st European Business Intelligence Summer School

Graphs for Business Intelligence – MA AUFAURE
Graphs everywhere
1st European Business Intelligence Summer School 6
-Social networks-Web-Enterprise databases-Biology-Etc.

Graphs for Business Intelligence – MA AUFAURE
Graphs everywhere
1st European Business Intelligence Summer School 7
Students Laboratory Topicss1s2s3
t1t2t3
Lab1Lab2Lab3
Belongs to developresearch on
s1
s3 t3
l2
l1
t2
t1
Graphs for Business Intelligence – MA AUFAURE
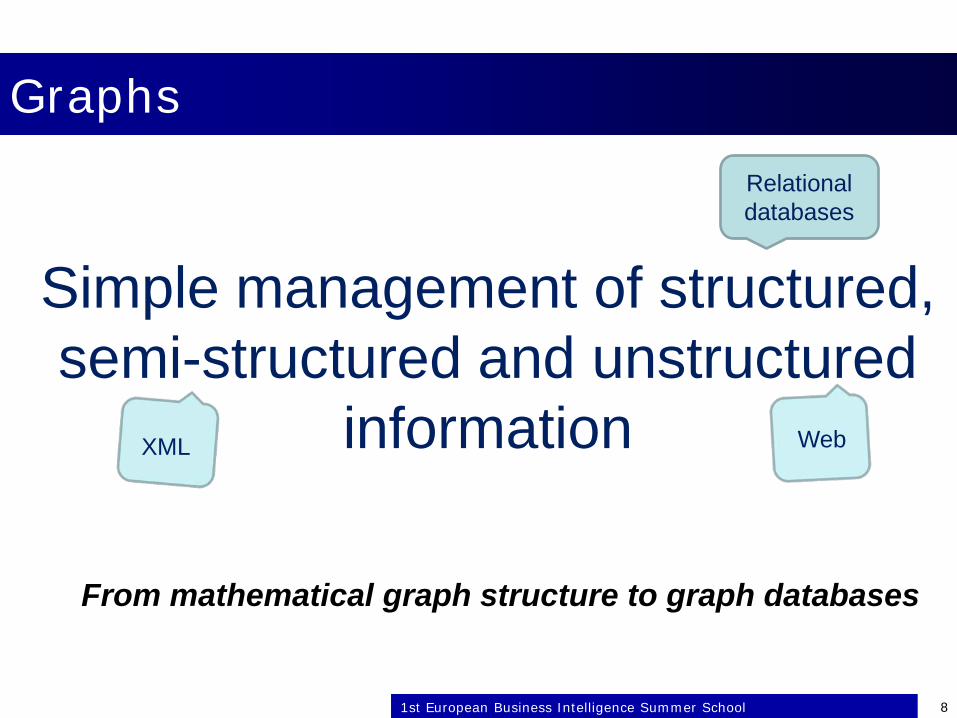
Graphs
1st European Business Intelligence Summer School 8
Simple management of structured,semi-structured and unstructured
information
Relationaldatabases
XML Web
From mathematical graph structure to graph databases

Graphs for Business Intelligence – MA AUFAURE
Graphs: what can we do with?
Traversing linked information, finding shortest path, doing (semantic) partitionRecommendation and discovery of
potentially interesting linked information
1st European Business Intelligence Summer School 9

Graphs for Business Intelligence – MA AUFAURE
Graphs: what can we do with?
Exploit the graph structure of large repositoriesWeb environmentDigital documents repositoriesDatabases with metadata
1st European Business Intelligence Summer School 10

Graphs for Business Intelligence – MA AUFAURE
USE CASES
1st European Business Intelligence Summer School 11
Social networks, recommendation (enterprise andweb contexts)
Graphs for Business Intelligence – MA AUFAURE
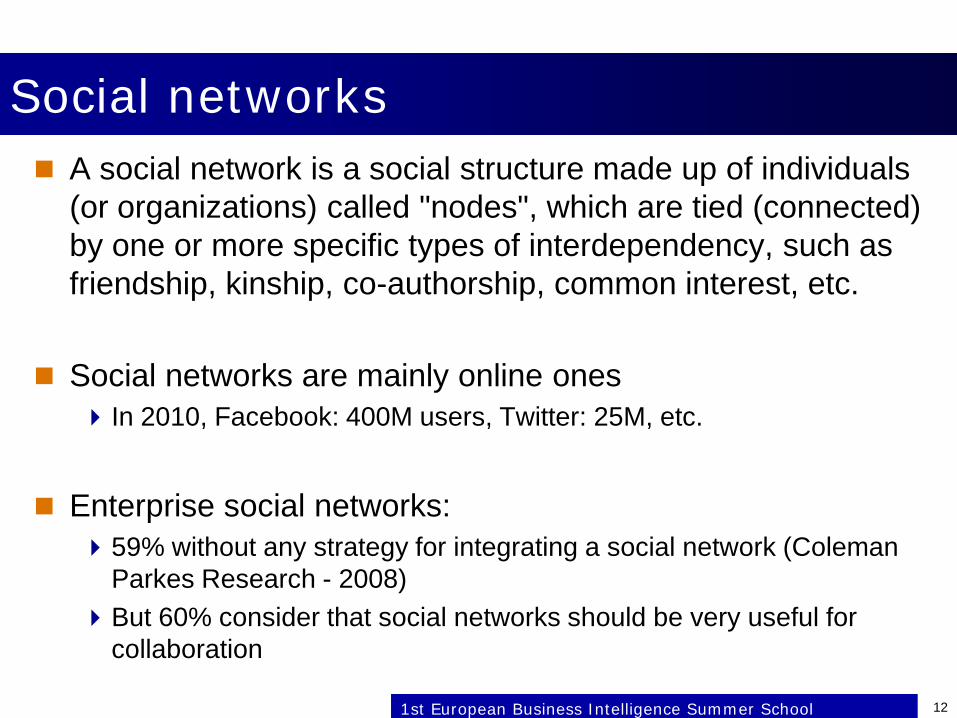
Social networks A social network is a social structure made up of individuals
(or organizations) called "nodes", which are tied (connected) by one or more specific types of interdependency, such as friendship, kinship, co-authorship, common interest, etc.
Social networks are mainly online ones In 2010, Facebook: 400M users, Twitter: 25M, etc.
Enterprise social networks:59% without any strategy for integrating a social network (Coleman
Parkes Research - 2008) But 60% consider that social networks should be very useful for
collaboration
1st European Business Intelligence Summer School 12

Graphs for Business Intelligence – MA AUFAURE
Why enterprise social networks?
A technology for internal communication, information sharing and collaboration
A technology for information communication towards clientsVote for the best product,Understand the clients needs
A technology for watching the gossipE-reputation, opinion mining
A technology for creating collective intelligenceCollaborative common knowledgeWikis and blogs associated to social networks
1st European Business Intelligence Summer School 13

Graphs for Business Intelligence – MA AUFAURE
Social networks for enterprises, public administrations: scenarios Centrality, importance and influence of actorsBetweeness: mediators and isolated actorsCloseness : proximity
Identification ok key actorsEntry points in the networkSensible points in the networkProbability estimation of a relation
GroupsGroups formation (from relations)Cohesion, density, stabilityGroups similarity
1st European Business Intelligence Summer School 14

Graphs for Business Intelligence – MA AUFAURE
Centrality definition
Being central is:
Be the source or destination of numerous relations: « degree centrality »
Be close to many actors: « closeness »Be central for many connections: « betweeness »
1st European Business Intelligence Summer School 15
Graphs for Business Intelligence – MA AUFAURE
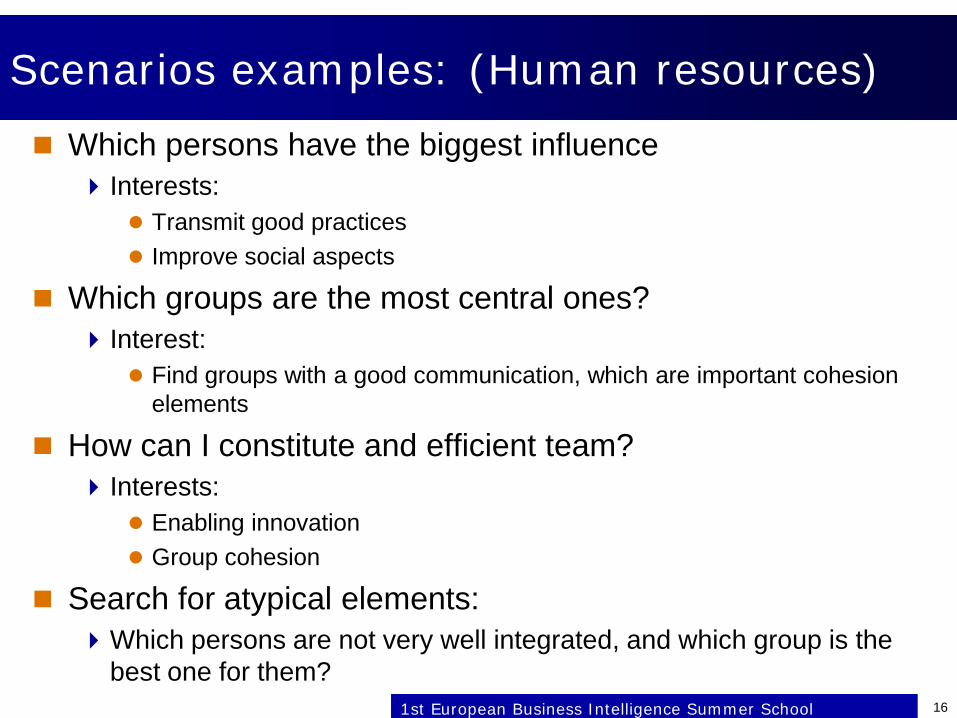
Scenarios examples: (Human resources) Which persons have the biggest influence Interests:
Transmit good practices Improve social aspects
Which groups are the most central ones? Interest:
Find groups with a good communication, which are important cohesion elements
How can I constitute and efficient team? Interests:
Enabling innovation Group cohesion
Search for atypical elements:Which persons are not very well integrated, and which group is the
best one for them?1st European Business Intelligence Summer School 16

Graphs for Business Intelligence – MA AUFAURE
Scenarios examples: (Human resources) Communication between entities Is it good?How can it be improved?
Which groups are similar?Analyze groups with “good” propertiesApply observations on a group to another similar oneExplain a behavior with a structure
Monitor and strengthen links with different partners
1st European Business Intelligence Summer School 17

Graphs for Business Intelligence – MA AUFAURE
Scenarios examples: (Individuals) NetworkingFrom whom should I be closer? Identify important relation by studying relations of other persons
Build a collaborative social networkWhich relations could be interesting to set up?
Learn from the experience of others Find an expert in the enterprise Develop my own profile for finding a job
1st European Business Intelligence Summer School 18
Graphs for Business Intelligence – MA AUFAURE
Social networks for public administrations Public administrations need social networks:As enterprises:
To analyze internal networks (projects, organization…) To analyze external networks (suppliers, clients, partners…)
As an interface for citizens: To be well-understood by citizens (who does what) To understand citizens (who says what)
Scenarios examples:Need to look over the organizational structure (employees,
departments, transversal projects) and identify costsNeed for citizens to understand the impact of public politics (offered
services, available resources for each district of the city, which projects are the most relevant, citizens complains)
Opinion analysis from external social networks (Twitter for example)
1st European Business Intelligence Summer School 19
Graphs for Business Intelligence – MA AUFAURE
Social networks for public administrations
1st European Business Intelligence Summer School 20
Graphs for Business Intelligence – MA AUFAURE
Graphs for Recommendation
In an enterprise context:Recommendation of documents, expertsHelp for decision-makingSituational applications
In a web context:Market-based applicationsSocial searchWeb link analysis (based on the web graph structure)
PageRank, HITS
1st European Business Intelligence Summer School 21

Graphs for Business Intelligence – MA AUFAURE
Providers
Repository
Graphs Gi + schema
Events Situations
Operators
Queue
Business events Situation model and recommendations
Gra
ph re
posi
tory
Situ
atio
n pl
atfo
rm
Activation rules
Extensible components
XML/RDF SQLIn
memoryData sources
QuestionProcessor (operator 1)
PatternMatcher (operator 2)
AnswerGenerator (operator 3)
tokenizer
POS-tagging
stemmer focus id.
entity recog.semantic
relations
syntactic relations
language id.
n-gram model
Pattern base
Pattern Learning
Technical query
Processing
Visualization Processing
Web-based
validation
Feedback handler
search service
Recommendation in an enterprise contextThollot, Kuchmann & Aufaure, 2010
1st European Business Intelligence Summer School

Graphs for Business Intelligence – MA AUFAURE
Modeling the situation as a user-centered graph
© SAP 2008 / Page 23
Maggie
Intention
Close deal
Company
Paris
Located_in
Is_reading
Kraft
Has_anMeeting
Has_meeting
A date
Starting on
Mentions(confidence xx)
Account manager
Is_an
Oracle
Mike B.
Has_author
Reports_to
Is_aIs_a
Press release
ProductAnnounced
by
Rapid Planningproduct
links to
Mentions(confidence xx)
1st European Business Intelligence Summer School

Graphs for Business Intelligence – MA AUFAURE
Graph Repository (GR)
+ extensible schema
nodes and relations are described in a graph repository
Providers feed the GRSocial Provider
LDAP, etc.
BI ProviderOLAP cubes, dimensions, measures, dependencies,
hierarchies
Text Analysis ProviderNamed Entity Recognition
and facts extraction
CRM ProviderCustomer-related facts
…
1st European Business Intelligence Summer School

Graphs for Business Intelligence – MA AUFAURE
Relations between nodes of these graphs represent static or time- dependent facts/assertions Homogeneous statementsExtended triples: (Subject Predicate Object + Metadata)
situation statements Time dependency, uncertainty management, security
Maggie read document1 Maggie read document1
+ origin: email client (plugin)
+ time validity: timestamp + lifetime
+ security: private / public / ACL
+ confidence
Subject
Predicate
Object
Maggie
Intention
Close deal
Paris
Located_in
Is_reading
Kraft
Has_anMeeting
Has_meeting
A date
Starting on
Mentions(confidence xx)
Account manager
Is_an
Oracle
Mike B.
Has_author
Reports_to
Press release
b
links to
Mentions(confidence xx)
1st European Business Intelligence Summer School

Graphs for Business Intelligence – MA AUFAURE
Sample graphs – Universe/cube
Information from BI provider.
Gives a graph view of a universe or a cube.
Depending on the underlying source, additional semantics can be pushed to the IM.
LegendGreen – universe/cubeBlue – dimensionGray – measure
1st European Business Intelligence Summer School
Graphs for Business Intelligence – MA AUFAURE
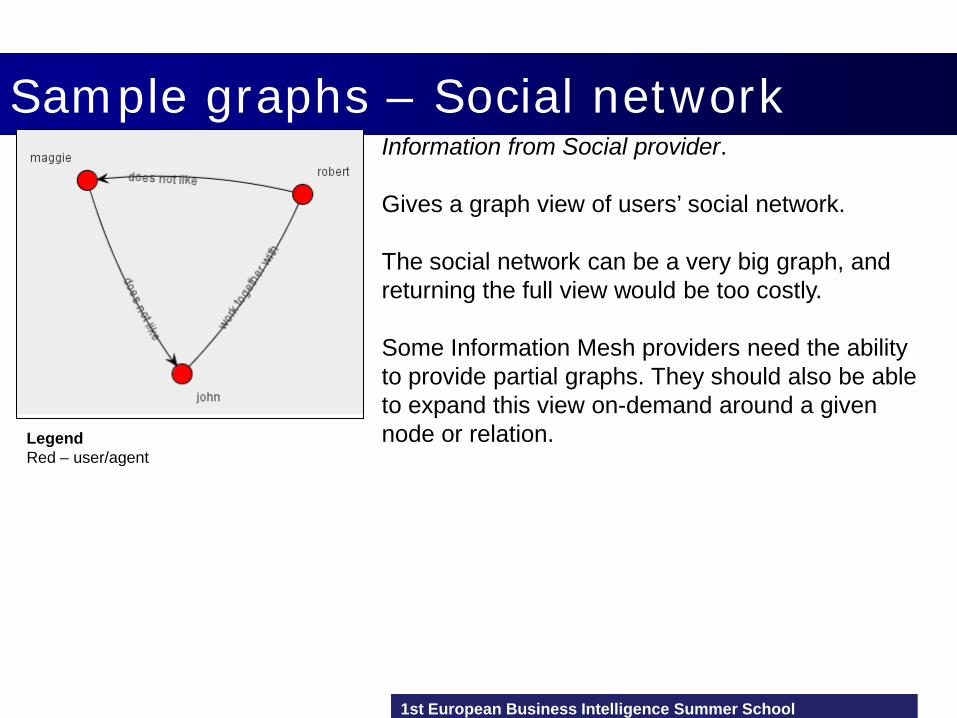
Sample graphs – Social networkInformation from Social provider.
Gives a graph view of users’ social network.
The social network can be a very big graph, and returning the full view would be too costly.
Some Information Mesh providers need the ability to provide partial graphs. They should also be able to expand this view on-demand around a given node or relation.Legend
Red – user/agent
1st European Business Intelligence Summer School

Graphs for Business Intelligence – MA AUFAURE
Sample graphs – A user’s situationOracle
Company
This graph represents Robert’s situation. A situation is centered on the concerned user.
A situation establishes connections between different partial graphs of the Information Mesh (social network, universe view and text analysis results in this example).
In situation graphs, there is a combination of generally true and volatile nodes & relations.E.g., relations (and nodes) from the universe view are static, while “is reading” is by nature very dynamic/volatile.
Situation “center”
LegendGreen – universe/cubeBlue – dimensionGray – measureRed – user/agentBlack – text analysis-related entity
Text analysis results
Universe/cube view
1st European Business Intelligence Summer School

Graphs for Business Intelligence – MA AUFAURE
Representing a user’s situation is key to serve relevant recommendations
Social network,BI,…
Recommendations
People
BI
Tools & apps
Documents
User’s situation
1st European Business Intelligence Summer School
Graphs for Business Intelligence – MA AUFAURE
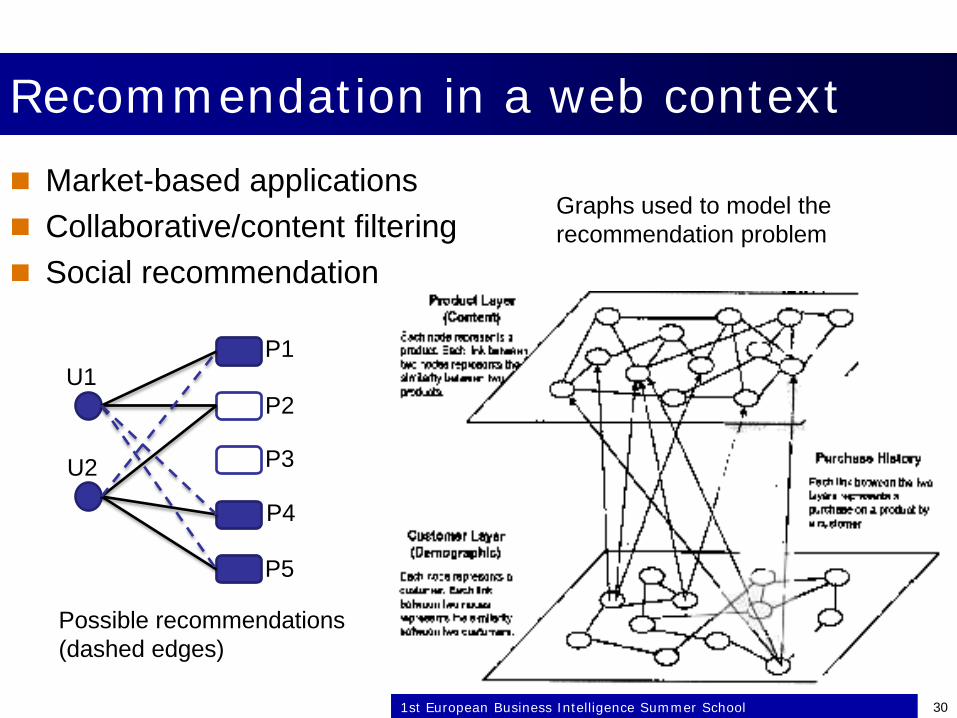
Recommendation in a web context
1st European Business Intelligence Summer School 30
Market-based applications Collaborative/content filtering Social recommendation
Graphs used to model therecommendation problem
U1
U2
P1
P2
P4
P3
P5
Possible recommendations(dashed edges)

Graphs for Business Intelligence – MA AUFAURE
VARIETY OF GRAPHS
1st European Business Intelligence Summer School 31

Graphs for Business Intelligence – MA AUFAURE
Graphs: Definition
1st European Business Intelligence Summer School 32
A graph G = (V, E) consists of a set V of vertices (also called nodes a set E of edges where This definition refers to simple and undirected graphs
VVE ×⊆
The term multigraph is generally understood to mean that multiple edgesand loops are allowed

Graphs for Business Intelligence – MA AUFAURE
Labeled Graphs
1st European Business Intelligence Summer School 33
Given two alphabets ΣV and ΣE a labeled graph is a triple G=(V,E, lV) where V is a finite set of nodes, is a ternary relation describingthe edges (including the labeling of the edges) and is a function describing the labeling of the nodes
VVE E ×Σ×⊆
VV Vl Σ→:
A graph labeling is the assignment of labels, traditionally represented by integers, to the edges or vertices, or both, of a graph
Applied to finite undirected simple graphs

Graphs for Business Intelligence – MA AUFAURE
Attributed graph
1st European Business Intelligence Summer School 34
If nodes in a graph have attributes, the graph is an attributed graph denoted by AG = (V, E, α), where α is a labeling function:
If both nodes and edges in a graph have attributes, the graph is an attributed graph denoted by AG = (V, E, α, β) where is an edge labeling function.
NLV →:α
LE →:β
Coauthor network with 2 attributes: « Topic » and « Age »Zhou & al, ICDM 2010

Graphs for Business Intelligence – MA AUFAURE
Hypergraphs
1st European Business Intelligence Summer School 35
An hypergraph G is a tuple (V, E, µ), where V is a finite set of nodes, E is a finite set of edges, µ : E → V* is aconnection function where V* means multiple nodes (an edge can connect any number of nodes).

Graphs for Business Intelligence – MA AUFAURE
Hypernodes
1st European Business Intelligence Summer School 36
A hypernode has the form H= (N, E)where H ∈ L is termed the label of the hypernode and (N, E) is a digraph such that N ⊂ (P ∪ L) (P is the set of primitive nodes).
(N,E) is termed the digraph (directed graph) of the hypernode

Graphs for Business Intelligence – MA AUFAURE
Subject Objectpredicate
Graphs for the Web: RDF
organization
CarHas_car
String
Integer
Cars-
Num
ber
Name
Sub-organization
String
Integer
Mark
Km
Organization-1
Car-1Has_car
« Direction générale des services »
515Cars-
Number
Name
Sub-organization
BMW
10000
Mark
Km
Organization-2« Cabinet du
Maire »
6
Cars-
Number
Name
Organization-3« Direction cabinet du
Maire »
2
Cars-
Number
Name
Organization-4« Direction Presse communication »
4
Cars-
Number
Name
Sub-organization
Sub-organization
Car-2
LAGUNA
20000
Mark
Km
Has_c
ar
Exemple
1st European Business Intelligence Summer School

Graphs for Business Intelligence – MA AUFAURE
Graph Databases and Models A graph database is a kind of NoSQL database (Not Only
SQL) that uses graph structures with nodes, edges, and properties to represent and store information. General graph databases that can store any graph.http://en.wikipedia.org/wiki/Graph_database
Benefits:No implicit model like within RDBMSExplicit representation of the semanticsHigh-performance traversing (a node space)
Existing graph databases:CassandraNeo4jAllegrographetc.
1st European Business Intelligence Summer School 38
Graphs for Business Intelligence – MA AUFAURE
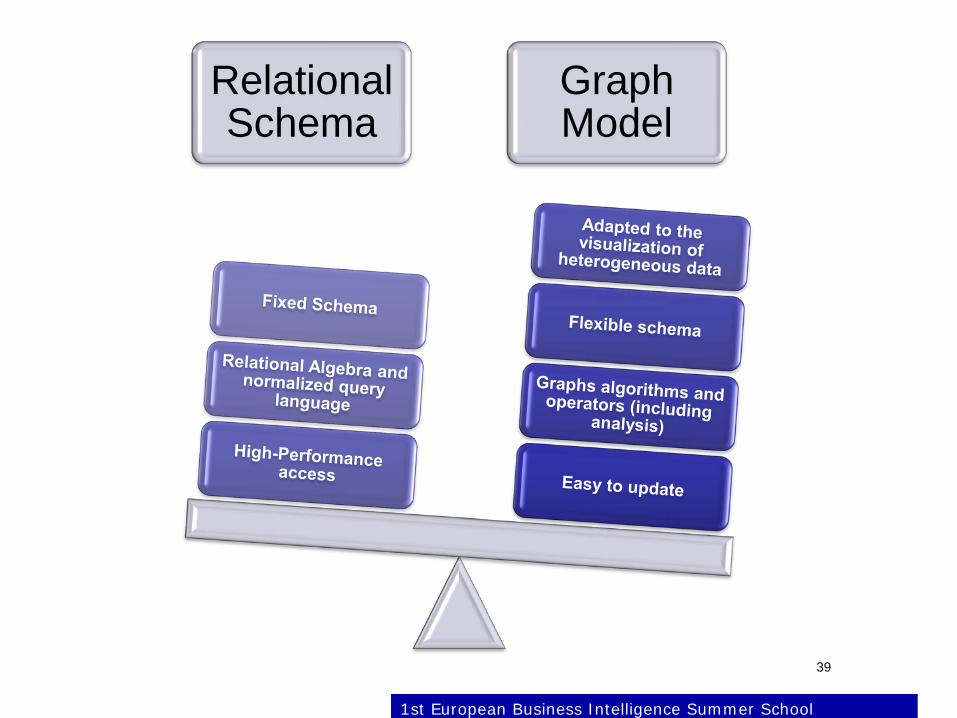
Relational Schema
Graph Model
39
1st European Business Intelligence Summer School

Graphs for Business Intelligence – MA AUFAURE
Graph models Data and/or schema are represented by graphs (directed
graphs in most cases)Schema and Instances can be clearly distinguished
Data manipulation:Graphs transformation (graph rewriting)Operations on graphs (paths, neighborhoods, subgraphs, graph
patterns, connectivity, graphs statistics like centrality)
Integrity constraints enforce data consistencySchema-instance consistency, identity and referential integrity,
functional and inclusion dependenciesExamples: labels with unique names, constraints on nodes, etc.
1st European Business Intelligence Summer School 40
Graphs for Business Intelligence – MA AUFAURE
Graph Databases Models Model information whose logical structure is a
graph Emphasize the interconnectivity between the data two categories:Models based on simple nodes
directed or undirected graph with simple nodes and edges Not adapted for the representation of complex entities
Models based on Hypernodes Entities and relations based on hypernodes and hypergraphs Attributes can be multivaluated Appropriate to represent complex and dynamic objects
1st European Business Intelligence Summer School 41

Graphs for Business Intelligence – MA AUFAURE
Data structures: representation of entities All graph db-models have their formal foundation, variations
of the basic mathematic structure of a graphDirected or undirected graphsLabeled or unlabeled edges an nodesHypergraphs and hypernodes
A (basic) schema graph defines:entity types represented as nodes labeled with zero or one type
name,primitive entities represented as nodes labeled with basic types relations represented as edges labeled with relation name
Extension in other models to complex structures allowing the representation of complex objects
1st European Business Intelligence Summer School 42
Graphs for Business Intelligence – MA AUFAURE
Data structures: representation of relations Types of relations supported by graph-db models:Attributes: represent a property directly linked to an entity
(represented by labeled edges)Neighborhood relations: graph structure provides simple support and
visualization of such relationsStandard abstractions: aggregation (part-of relation), composition
(the opposite relation), association (n-ary relations), groupings or sets.
Derivation and inheritance: IS-A relationsNested relations: recursively specified relations defined by nested
objets. Supported by using hypernode or hypergraphs structures
1st European Business Intelligence Summer School 43

Graphs for Business Intelligence – MA AUFAURE
Graph data models
1st European Business Intelligence Summer School 44
Model based on simple nodes
Model based on hypernodes
GOOD [Gyssens et al, 90],GMOD [Andries et al, 93], G-Log [Paredaens et al, 95], PaMaL[Gemis, et al, 93]GDM[Hidders,2002], LDM [Kuper et Vardi,93],
Hypernode model [Levene et al,90], GGL[Graves et al,90], GROOVY [Levene et al,91]

Graphs for Business Intelligence – MA AUFAURE
GMOD
1st European Business Intelligence Summer School 45
In the schema, nodes represent abstract objects (Person) and labeled edges establish relations with primitive objects (properties name and lastname), and other abstract objects (parent relation).For building an instance, we instantiate the schema for each person by assigning values to oval nodes

Graphs for Business Intelligence – MA AUFAURE
HYPERNODE
1st European Business Intelligence Summer School 46
The schema (left) defines a person as a complex object with the properties name and lastname of type string, and parent of type person (recursively defined). The instance (on the right) shows the relations in the genealogy among different instances of person.

Graphs for Business Intelligence – MA AUFAURE
Query languages Graph models have generally an associated query languageGraphical/Visual, semantic, formal, SQL-likeRDF languagesXML languages
Typology of queries:
1st European Business Intelligence Summer School 47
Queries type
Aggregation Query Select Query
Simple selection
Selection with conditions
Analysis query
Path QueryStatistics (centrality,
etc.)

Graphs for Business Intelligence – MA AUFAURE
Example of visual query languages
1st European Business Intelligence Summer School 48
These languages allow users to draw a query as a graph pattern. The result is thecollection of all subgraphs matching the desired pattern.
Employee
CitizenProject
Service
Works-on-project
Service-provider
Service-
demander
organization
Works-in
offers
orgParent
Manager
Man
aged
by
Graph schema Graph instance

Graphs for Business Intelligence – MA AUFAURE
Select projects where the project manager is « Alain »?
A B
objType=Project ManagerName=AlainobjType=ProjectQGraph
linKType=Managed_by
Hyperlog
X ManagerManaged-by
Alain
Name
Name
budget ? budget
?Name
NameManager
Alain
?Manager?Project
G
ProjectManager StringName
Managed -by
Alain
NameGOOD
49
Example of visual query languages
1st European Business Intelligence Summer School

Soussi, Louati, Cuvelier, Aufaure, Lechevallier (2010, 2011)
Example: Graph extraction and aggregation from relational databases
50

Graphs for Business Intelligence – MA AUFAURE
Context/Motivation Motivation : be able to represent relations between any kind
of objectExample : network of researchers and labs extracted from relational
databases and enriched with web data
Providing a unique representation for massive and heterogeneous dataGraphs : a natural representation
Adapted to both structured and unstructured data Easy to manipulate
Data update without modifying the structureAlgorithms dedicated to graphs : shortest path, sub-graphs, etc.
1st European Business Intelligence Summer School

Graphs for Business Intelligence – MA AUFAURE
Context/Motivation
52
Social networks are playing an important role in information searching and sharing.Current methods for extracting/mining social networks are mainly based on web
dataEnterprise context: mainly relational databases (in the best case!)
Social Networks Extraction from Relational Databases
Use of graph models:More flexible and dynamicReveal hidden relationsEase entities extraction
But: Extracted Social Networks can be very largePertinent analysis and interpretation of data is difficultNeed of graph aggregation for the analysis
Use of the K-SNAP aggregation algorithm
1st European Business Intelligence Summer School

Graphs for Business Intelligence – MA AUFAURE
SPIDER-Graph Model
53
Works-on
Name String
Employee
DNO
Enum Integer
DNODname
LocationString
String
Integer
Department_1
PnumPname String
Integer
Project
Dnum Department_2
DNODname
LocationString
String
Integer
Hyernode Model
Name
address String
String
Employee
DNO Department
LastName String
Enum Integer
DNODname
LocationString
String
Integer
Department
Works-on PnumPname
StartDateString
String
Integer
Project
Dnum Department
SPIDER-Graph Model
Hypernode Model vs Spider-Graph Model
Main differences between our model and the hypernode one:1. Explicit representation of labeled edges to describe relations2. Complex-node attributes types are references to other complex-nodes3. Easier to visualize
1st European Business Intelligence Summer School
Graphs for Business Intelligence – MA AUFAURE
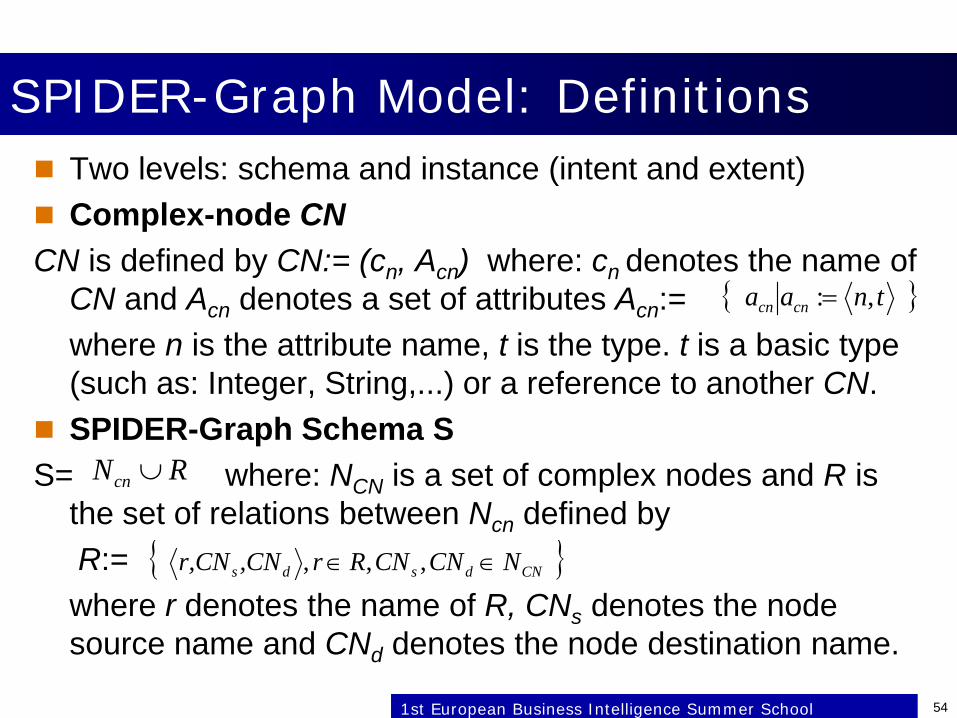
SPIDER-Graph Model: Definitions Two levels: schema and instance (intent and extent) Complex-node CNCN is defined by CN:= (cn, Acn) where: cn denotes the name of
CN and Acn denotes a set of attributes Acn:=where n is the attribute name, t is the type. t is a basic type (such as: Integer, String,...) or a reference to another CN.
SPIDER-Graph Schema SS= where: NCN is a set of complex nodes and R is
the set of relations between Ncn defined byR:= where r denotes the name of R, CNs denotes the node source name and CNd denotes the node destination name.
54
{ }tnaa cncn ,:=
RNcn ∪
{ }CNdsds NCNCNRr,CNr,CN ∈∈ ,,,
1st European Business Intelligence Summer School

Graphs for Business Intelligence – MA AUFAURE
A general view of the approach
55
Relational database
Graph Model Extraction
Object Graph Extraction
Identification of objects and their characteristics
Relation Extraction
Graph ModelChosen Objects
Objects Graph
Extraction of a large graphAggregation with K-SNAP
Resumed Graph
Enterprise Ontology
Name
address Paris
Smith
Employee_3
DNO Department-1
LastName Yan
Enum 03
DNODname
LocationDevelopment
Paris
01
Department_1
PnumPname
StartDateTrans-2
06-2009
101
Project_1
Dnum Department_1
MidRole Managing the
project team
Employee_3
Manager_1
NumPPnametype
Phone7Mobile Phone
123
Price 500eur
Product-1
NumPPnum
quantityProject-1
10000
Product-1
Desc hardware
Product-Project_1
Is-A
Works-onPart-ofPart-of Name
address Paris
Alain
Employee_1
DNO Department-1
LastName Jones
Enum 01
Works-on
NumPPnametype
Scr2LCD screen
204
Price
Product-2
NumPPnum
quantityProject-1
200
Product-2
Desc software
Product-Project_2
1200eur
Part-ofPart-of
1st European Business Intelligence Summer School
Graphs for Business Intelligence – MA AUFAURE
Relational database Enterprise Documents
Name
address String
String
Employee
DNO Department
LastName String
Enum Integer
DNODname
LocationString
String
Integer
Department
PnumPname
StartDateString
String
Integer
Project
Dnum Department
MidRole String
Employee
Manager
NumPPnametype
StringString
Integer
Price Double
Product
NumPPnum
quantityProject
Integer
Product
Desc String
Product-Project
Is-A
Works-onPart-of
Part-of
Fidnametype
StringString
Integer
Pnum
Facility
Project
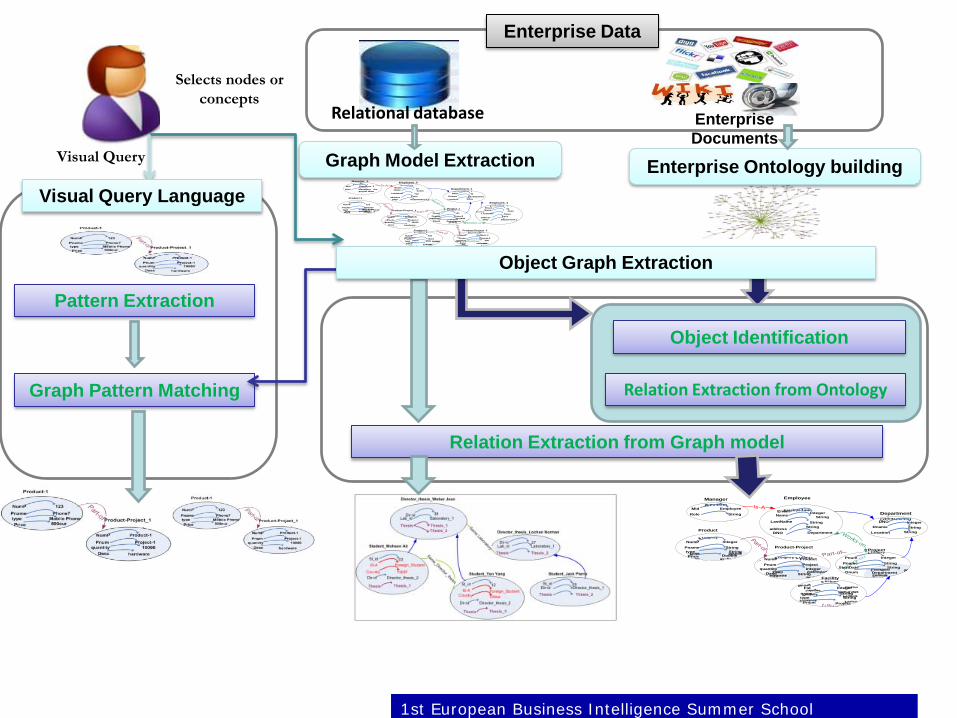
Graph Model Extraction Enterprise Ontology building
Relation Extraction from Graph model
Object Identification
Relation Extraction from OntologyGraph Pattern Matching
Selects nodes or concepts
Pattern Extraction
Visual Query
Object Graph Extraction
Name
address Paris
Smith
Employee_3
DNO Department-1
LastName Yan
Enum 03
DNODname
LocationDevelopment
Paris
01
Department_1
PnumPname
StartDateTrans-2
06-2009
101
Project_1
Dnum Department_1
MidRole Managing the
project team
Employee_3
Manager_1
NumPPnametype
Phone7Mobile Phone
123
Price 500eur
Product-1
NumPPnum
quantityProject-1
10000
Product-1
Desc hardware
Product-Project_1
Is-A
Works-onPart-ofPart-of Name
address Paris
Alain
Employee_1
DNO Department-1
LastName Jones
Enum 01
Works-on
NumPPnametype
Scr2LCD screen
204
Price
Product-2
NumPPnum
quantityProject-1
200
Product-2
Desc software
Product-Project_2
1200eur
Part-ofPart-of
Enterprise Data
Visual Query Language
1st European Business Intelligence Summer School

Graphs for Business Intelligence – MA AUFAURE
Name
address String
String
Employee
DNO Department
LastName String
Enum Integer
DNODname
LocationString
String
Integer
Department
PnumPname
StartDateString
String
Integer
Project
Dnum Department
MidRole String
Employee
Manager
NumPPnametype
StringString
Integer
Price Double
Product
NumPPnum
quantityProject
Integer
Product
Desc String
Product-Project
Is-A
Works-onPart-of
Part-of
Fidnametype
StringString
Integer
Pnum
Facility
Project
(1) Complex-node creation
(2) Relations Identification
Transformation to a SPIDER-Graph Model from a RDBMS: Schema Translation
571st European Business Intelligence Summer School

Graphs for Business Intelligence – MA AUFAURE
Name
address Paris
Smith
Employee_3
DNO Department-1
LastName Yan
Enum 03
DNODname
LocationDevelopment
Paris
01
Department_1
PnumPname
StartDateTrans-2
06-2009
101
Project_1
Dnum Department_1
MidRole Managing the
project team
Employee_3
Manager_1
NumPPnametype
Phone7Mobile Phone
123
Price 500eur
Product-1
NumPPnum
quantityProject-1
10000
Product-1
Desc hardware
Product-Project_1
Is-A
Works-onPart-ofPart-of Name
address Paris
Alain
Employee_1
DNO Department-1
LastName Jones
Enum 01
Works-on
NumPPnametype
Scr2LCD screen
204
Price
Product-2
NumPPnum
quantityProject-1
200
Product-2
Desc software
Product-Project_2
1200eur
Part-ofPart-of
58
Transformation to a SPIDER-Graph Model: Data Migration
(3) Intance level (population)
1st European Business Intelligence Summer School

Graphs for Business Intelligence – MA AUFAURE
(Hidden) Relations identification
59
Relation Transformation
R1 (a,b)R2(a #,c)
R1 (a,b)R2(a#, c, e)
a
b
Type1
Type2
R1
c
R1
Type3
R2
a
Is-A
Type1
Type2
R1
cR1
Type3
R2
aPart-of
b e Type4
1st European Business Intelligence Summer School

Graphs for Business Intelligence – MA AUFAURE
(Hidden) Relations identification
60
Relation Transformation
R1 (a, b)R2(a#, c#)
R3(c, d)
R1 (a, b)R2(c, a#,e)
a
b
Type1
Type2
R1
d
Type3
Type4
R2
c
R2
R1
cR1
R2
a
a
b
Type1
Type2
R1
a
Type3
R1
c
e Type4
R2
1st European Business Intelligence Summer School

Graphs for Business Intelligence – MA AUFAURE
Relational database Enterprise Documents
Name
address String
String
Employee
DNO Department
LastName String
Enum Integer
DNODname
LocationString
String
Integer
Department
PnumPname
StartDateString
String
Integer
Project
Dnum Department
MidRole String
Employee
Manager
NumPPnametype
StringString
Integer
Price Double
Product
NumPPnum
quantityProject
Integer
Product
Desc String
Product-Project
Is-A
Works-onPart-of
Part-of
Fidnametype
StringString
Integer
Pnum
Facility
Project
Graph Model Extraction Enterprise Ontology building
Relation Extraction from Graph model
Object Identification
Relation Extraction from OntologyGraph Pattern Matching
Selects nodes or concepts
Pattern Extraction
Visual Query
Object Graph Extraction
Name
address Paris
Smith
Employee_3
DNO Department-1
LastName Yan
Enum 03
DNODname
LocationDevelopment
Paris
01
Department_1
PnumPname
StartDateTrans-2
06-2009
101
Project_1
Dnum Department_1
MidRole Managing the
project team
Employee_3
Manager_1
NumPPnametype
Phone7Mobile Phone
123
Price 500eur
Product-1
NumPPnum
quantityProject-1
10000
Product-1
Desc hardware
Product-Project_1
Is-A
Works-onPart-ofPart-of Name
address Paris
Alain
Employee_1
DNO Department-1
LastName Jones
Enum 01
Works-on
NumPPnametype
Scr2LCD screen
204
Price
Product-2
NumPPnum
quantityProject-1
200
Product-2
Desc software
Product-Project_2
1200eur
Part-ofPart-of
Enterprise Data
Visual Query Language
1st European Business Intelligence Summer School
Graphs for Business Intelligence – MA AUFAURE
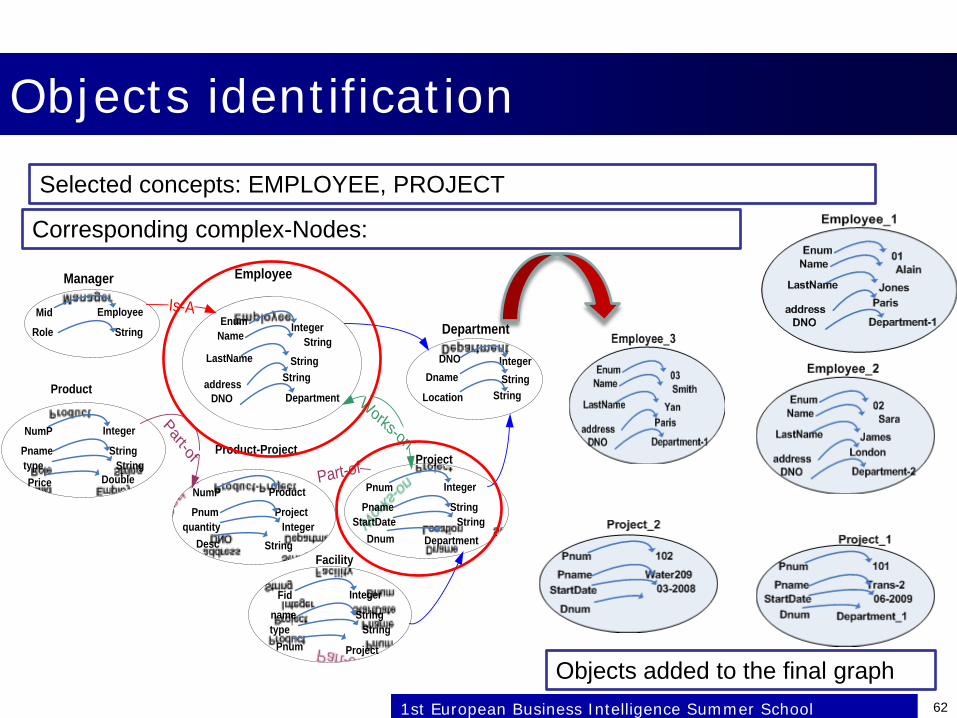
Objects identification
62
Selected concepts: EMPLOYEE, PROJECT
Name
address String
String
Employee
DNO Department
LastName String
Enum Integer
DNODname
LocationString
String
Integer
Department
PnumPname
StartDateString
String
Integer
Project
Dnum Department
MidRole String
Employee
Manager
NumPPnametype
StringString
Integer
Price Double
Product
NumPPnum
quantityProject
Integer
Product
Desc String
Product-Project
Is-A
Works-onPart-of
Part-of
Fidnametype
StringString
Integer
Pnum
Facility
Project
Corresponding complex-Nodes:
Objects added to the final graph1st European Business Intelligence Summer School

Graphs for Business Intelligence – MA AUFAURE
Relation construction (definitions) Objective: use existing relations and find hidden ones Input: SPIDER-Graph, set of relation patterns, Output:
Interaction Graph Definition: Interaction Graph GOGO = (OI, RO) where:
OI is a finite set of objects such as OI := {oI | oI ∈ NCN}RO is a finite set of relations between objects such as
RO := {r | r := (l, oI1, OI2) where l is the relation name and oI1, OI2 ∈ OI
Relation pattern: Pr = (n, oI1, oI2, om)n = name of the relationoI1, oI2 are entities sharing the relation om is a mediator for this relation (complex object used to find a
new relation631st European Business Intelligence Summer School

Graphs for Business Intelligence – MA AUFAURE
Patterns to identify new objects.
64
Object Graph ExtractionRelation Construction-1-
IS-A
Input Relation(Schema)
Detected Objects(instances)
IS-A Relation
Initial Relation ProcessDefinition R1:=(« IS_A », CNs, CNd), CNs or CNd
instances ∈ OI
CNs or CNd instances are added to OI
Example <« IS_A », Employee, Manager> Manager instances are added to OI
1st European Business Intelligence Summer School
Graphs for Business Intelligence – MA AUFAURE
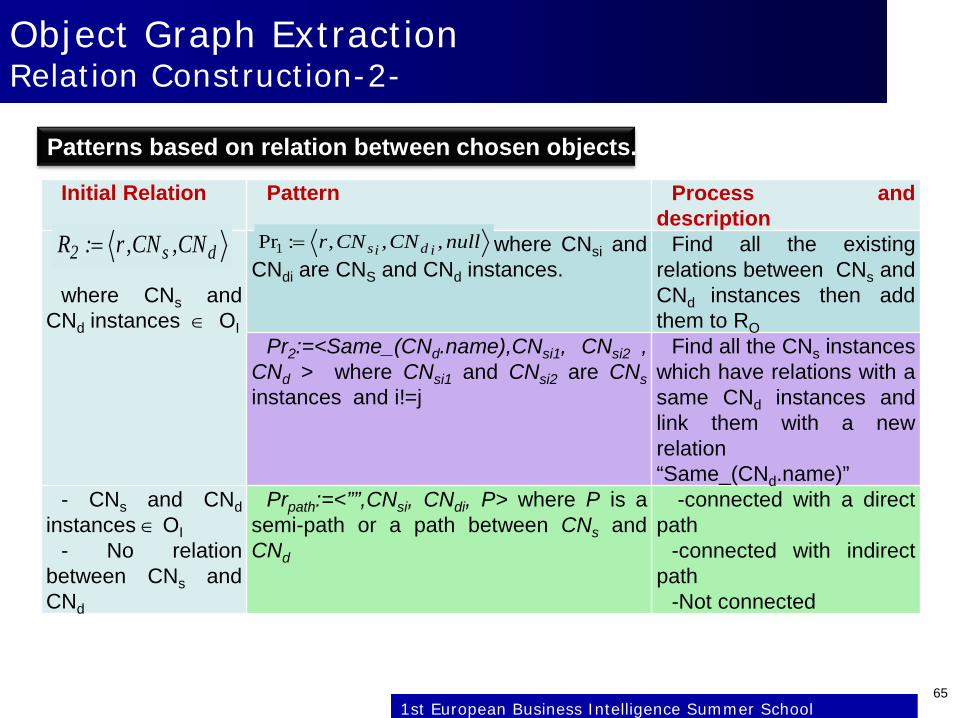
Patterns based on relation between chosen objects.
Initial Relation Pattern Process anddescription
w
where CNs andCNd instances ∈ OI
where CNsi andCNdi are CNS and CNd instances.
Find all the existingrelations between CNs andCNd instances then addthem to RO
Pr2:=<Same_(CNd.name),CNsi1, CNsi2 ,CNd > where CNsi1 and CNsi2 are CNsinstances and i!=j
Find all the CNs instanceswhich have relations with asame CNd instances andlink them with a newrelation“Same_(CNd.name)”
- CNs and CNdinstances ∈ OI
- No relationbetween CNs andCNd
Prpath:=<””,CNsi, CNdi, P> where P is asemi-path or a path between CNs andCNd
-connected with a directpath
-connected with indirectpath
-Not connected
ds2 CN,CN,r:R = nullCNCNr idis ,,,:Pr1 =
65
Object Graph ExtractionRelation Construction-2-
1st European Business Intelligence Summer School

Graphs for Business Intelligence – MA AUFAURE
Object Graph ExtractionRelation Construction-3-
66
Input Relation
Same-Project
Same-Project
Works-on
Works-on
Works-on
Works-on
New Relations Pr1:=<r, CNsi,CNdi, null ),where CNsi and CNdi are CNS and CNd instances.Pr2:=<Same_(CNd.name),CNSIi, CNSIj , CNd > where CNSIi and CNSIjare CNs instances and i!=j
Patterns based on relation between chosen objects.
1st European Business Intelligence Summer School
Graphs for Business Intelligence – MA AUFAURE
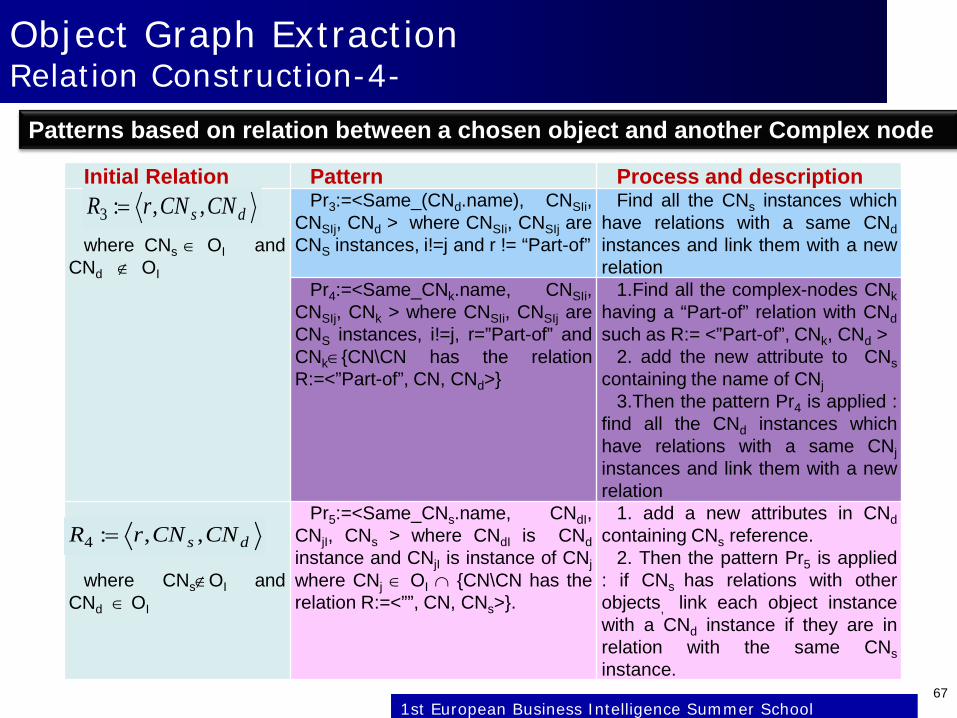
Initial Relation Pattern Process and description
where CNs ∈ OI andCNd ∉ OI
Pr3:=<Same_(CNd.name), CNSIi,CNSIj, CNd > where CNSIi, CNSIj areCNS instances, i!=j and r != “Part-of”
Find all the CNs instances whichhave relations with a same CNdinstances and link them with a newrelation
Pr4:=<Same_CNk.name, CNSIi,CNSIj, CNk > where CNSIi, CNSIj areCNS instances, i!=j, r=”Part-of” andCNk∈{CN\CN has the relationR:=<”Part-of”, CN, CNd>}
1.Find all the complex-nodes CNkhaving a “Part-of” relation with CNdsuch as R:= <”Part-of”, CNk, CNd >
2. add the new attribute to CNscontaining the name of CNj
3.Then the pattern Pr4 is applied :find all the CNd instances whichhave relations with a same CNjinstances and link them with a newrelation
where CNs∉OI andCNd ∈ OI
Pr5:=<Same_CNs.name, CNdI,CNjI, CNs > where CNdI is CNdinstance and CNjI is instance of CNjwhere CNj ∈ OI ∩ {CN\CN has therelation R:=<””, CN, CNs>}.
1. add a new attributes in CNdcontaining CNs reference.
2. Then the pattern Pr5 is applied: if CNs has relations with otherobjects, link each object instancewith a CNd instance if they are inrelation with the same CNsinstance.
ds CNCNrR ,,:3 =
ds CNCNrR ,,:4 =
67
Object Graph ExtractionRelation Construction-4-
Patterns based on relation between a chosen object and another Complex node
1st European Business Intelligence Summer School

Graphs for Business Intelligence – MA AUFAURE
Object Graph ExtractionRelation Construction-5-
68
Input Relation
New Relations Pr3:=<Same_(Department), Employeei, Employeej, Departmentd >where i!=j
Same-Department
Patterns based on relation between a chosen object and another Complex node
1st European Business Intelligence Summer School

Graphs for Business Intelligence – MA AUFAURE
Object Graph ExtractionRelation Construction-6-
69
Input Relation
New Relations Pr4:=<Same_Product, Projecti, Projectj, Product_Projectk >where” and i!=j
Same-Product
Patterns based on relation between a chosen object and another Complex node
1st European Business Intelligence Summer School

Graphs for Business Intelligence – MA AUFAURE
Object Graph ExtractionRelation Construction-7-
70
Input Relation
Same-Product
New Relations Pr5:=<Same_Facility, Projecti, Projectj, Facilitys >
Patterns based on relation between a chosen object and another Complex node
1st European Business Intelligence Summer School
Graphs for Business Intelligence – MA AUFAURE
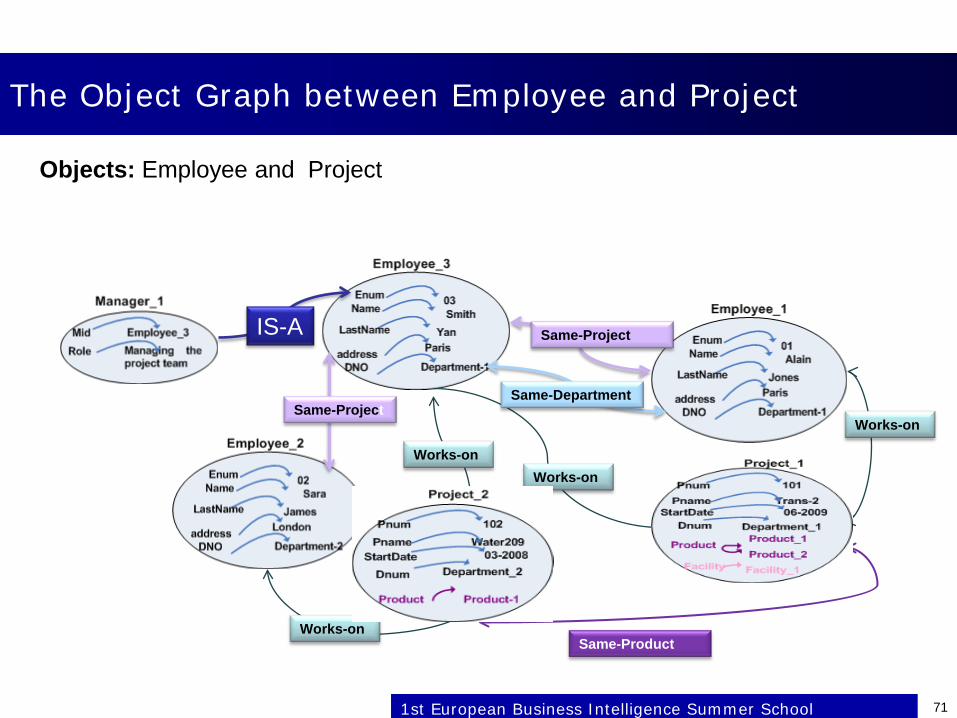
The Object Graph between Employee and Project
71
Objects: Employee and Project
IS-A Same-Project
Same-Project
Works-on
Works-on
Works-on
Works-on
Same-Department
Same-Product
1st European Business Intelligence Summer School
Graphs for Business Intelligence – MA AUFAURE
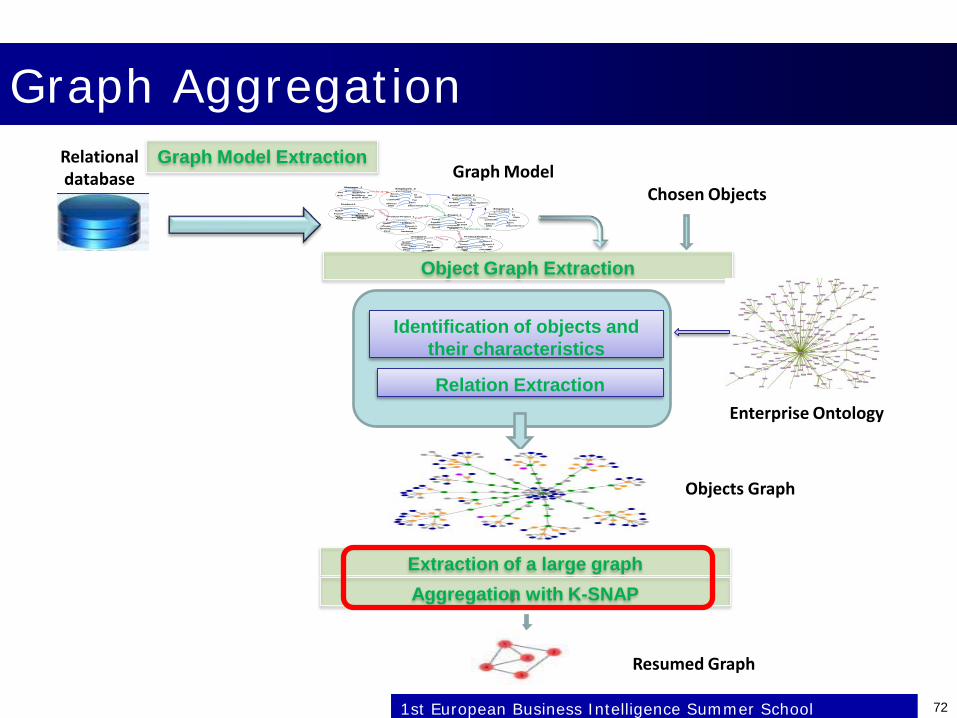
Graph Aggregation
72
Relational database
Graph Model Extraction
Object Graph Extraction
Identification of objects and their characteristics
Relation Extraction
Graph ModelChosen Objects
Objects Graph
Extraction of a large graphAggregation with K-SNAP
Resumed Graph
Enterprise Ontology
Name
address Paris
Smith
Employee_3
DNO Department-1
LastName Yan
Enum 03
DNODname
LocationDevelopment
Paris
01
Department_1
PnumPname
StartDateTrans-2
06-2009
101
Project_1
Dnum Department_1
MidRole Managing the
project team
Employee_3
Manager_1
NumPPnametype
Phone7Mobile Phone
123
Price 500eur
Product-1
NumPPnum
quantityProject-1
10000
Product-1
Desc hardware
Product-Project_1
Is-A
Works-onPart-ofPart-of Name
address Paris
Alain
Employee_1
DNO Department-1
LastName Jones
Enum 01
Works-on
NumPPnametype
Scr2LCD screen
204
Price
Product-2
NumPPnum
quantityProject-1
200
Product-2
Desc software
Product-Project_2
1200eur
Part-ofPart-of
1st European Business Intelligence Summer School

Graphs for Business Intelligence – MA AUFAURE
SNAP & k-SNAP Graph AggregationTian, Hankins and Patel (SIGMOD 2008)
● Summarization based on user-selected nodeattributes and relationships.
● Produce summaries with controllableresolutions.
● Provide “drill-down” and “roll-up” abilities tonavigate multi-resolution summaries.
● Efficient algorithms
● Produce meaningful summaries for realapplications (and multiple points of view)
● Efficient and scalable for very large graphs1st European Business Intelligence Summer School

Graphs for Business Intelligence – MA AUFAURE
Working with...
● Nodes
● Edges (but with different types)
● Attributes (all identical for all nodes)
● Node Grouping = Partition of Nodes
● Neighbor Groups : groups in relationship with a node.
1st European Business Intelligence Summer School

Graphs for Business Intelligence – MA AUFAURE
Compatible Groupings
● A-compatible Grouping :– all nodes in the same group must have the same attributes.
● (A,R)-compatible Grouping:– A-compatible grouping,
– all nodes in the same group must have the same neighbor groups.
(A,R)-compatible grouping performed by the SNAP : Summarization by grouping Nodes on Attributes and Pairwise relationships.
1st European Business Intelligence Summer School

Graphs for Business Intelligence – MA AUFAURE
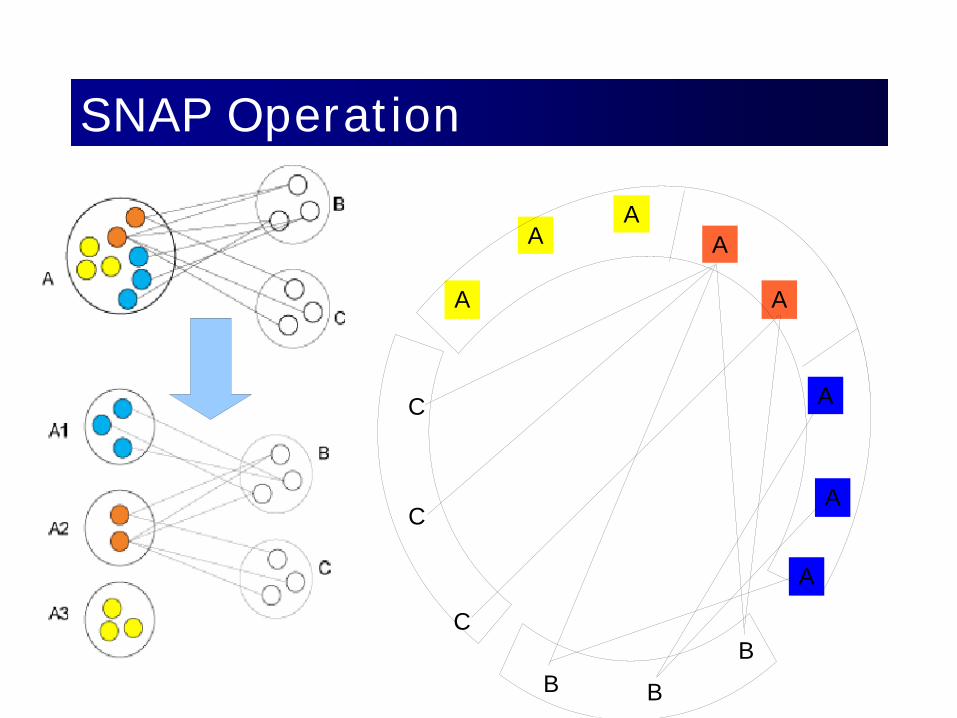
SNAP Operation
1st European Business Intelligence Summer School

Graphs for Business Intelligence – MA AUFAURE
SNAP OperationA
A
A A
A
A
A
A
BB B
C
C
C
1st European Business Intelligence Summer School

Graphs for Business Intelligence – MA AUFAURE
SNAP Operation
AA
A A
A
A
A
A
BB B
C
C
C
Graphs for Business Intelligence – MA AUFAURE
SNAP Operation
AA
A A
A
A
A
A
BB B
C
C
C

Graphs for Business Intelligence – MA AUFAURE
Why k-SNAP ?
A-Compatible (A,R)-Compatible
Too few Too many
k-SNAPRoll-up Drill-down
1st European Business Intelligence Summer School

Graphs for Business Intelligence – MA AUFAURE
Attributes and relationships
● Attributes and relationships together, but attributes first!
For example:●All students in the blue group have the same gender and are in the same dept●Every student in the blue group has:●at least one “friend” in the green group●at least one “classmate” in the purple group●at least one “friend” in the orange group●at least one “classmate” in the orange group
1st European Business Intelligence Summer School

Graphs for Business Intelligence – MA AUFAURE
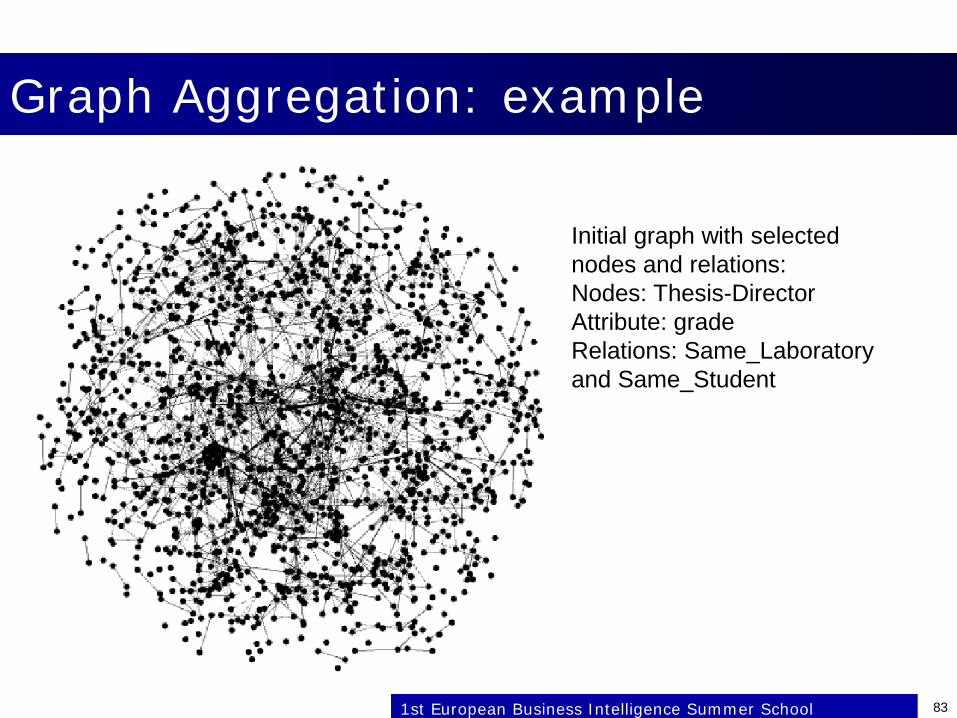
Graph Aggregation: example
82
Interaction Graph representing a social network (extracted from the ADEME Database)
1st European Business Intelligence Summer School
Graphs for Business Intelligence – MA AUFAURE
Graph Aggregation: example
83
Initial graph with selectednodes and relations:Nodes: Thesis-DirectorAttribute: gradeRelations: Same_Laboratory and Same_Student
1st European Business Intelligence Summer School

Graphs for Business Intelligence – MA AUFAURE
Graph Aggregation
84
Sample of the real graph
K-snap generates a summary formed by 3 groups (A-compatible grouping):HDR, co-supervisor, prof (modalities of the attribute grade)
1st iteration: subdivision of the HDR group into 2 subgroups according to the relation Same_Student: HDR_1: HDRs supervising a student with at least one professor or co-supervisor, HDR_2: HDR supervising students having only asdirector HDRs
2nd iteration: subdivision of the Prof group into 2 subgroups according to the relation Same_Laboratory
1st European Business Intelligence Summer School

Graphs for Business Intelligence – MA AUFAURE
Graph Aggregation
851st European Business Intelligence Summer School

Graphs for Business Intelligence – MA AUFAURE
Graph Aggregation
86
Application of the centrality measure to compare the results
1st European Business Intelligence Summer School

Graphs for Business Intelligence – MA AUFAURE
Limits of the K-SNAP algorithm
Can only be applied to homogeneous graphs (same description for each node)
Number of groups can be the Cartesian product of modalities of all attributes
Inefficient in case of numerous attributes and/or numerical values
⇒Increase of small groups
1st European Business Intelligence Summer School 87
Graphs for Business Intelligence – MA AUFAURE
Conclusion Graphs: towards a unified view of structured data and
unstructured content? Models: many existing models QueriesVisual query languageKeywords search and Q&APaths queries – Aggregation queries
Summarization – Aggregation (K-SNAP)Customized summariesMeaningful summaries for real applications,Efficient and scalable for very large graphs
Matching with a semantic layer (ontology)
881st European Business Intelligence Summer School
Graphs for Business Intelligence – MA AUFAURE
Challenges/open problems Searching automatically the interaction between specific
objects from RDB knowing that SQL queries cannot find this kind of information.
Allowing users to analyze easily the resulting graph Add semantics find communities that not only takes into account links
between individuals, but also their similarities based on their own attributes
Manage the consistency of the graph
891st European Business Intelligence Summer School

Contact: [email protected]://perso.ecp.fr/~aufaurema/
http://www.mas.ecp.fr/BI/New/index.html
Questions/Comments?
Positions available in my group (research engineer/postdoc)


