Download - Glyphworks V8 Training Manual 2012
Interactive Data Processing with nCode GlyphWorks
English

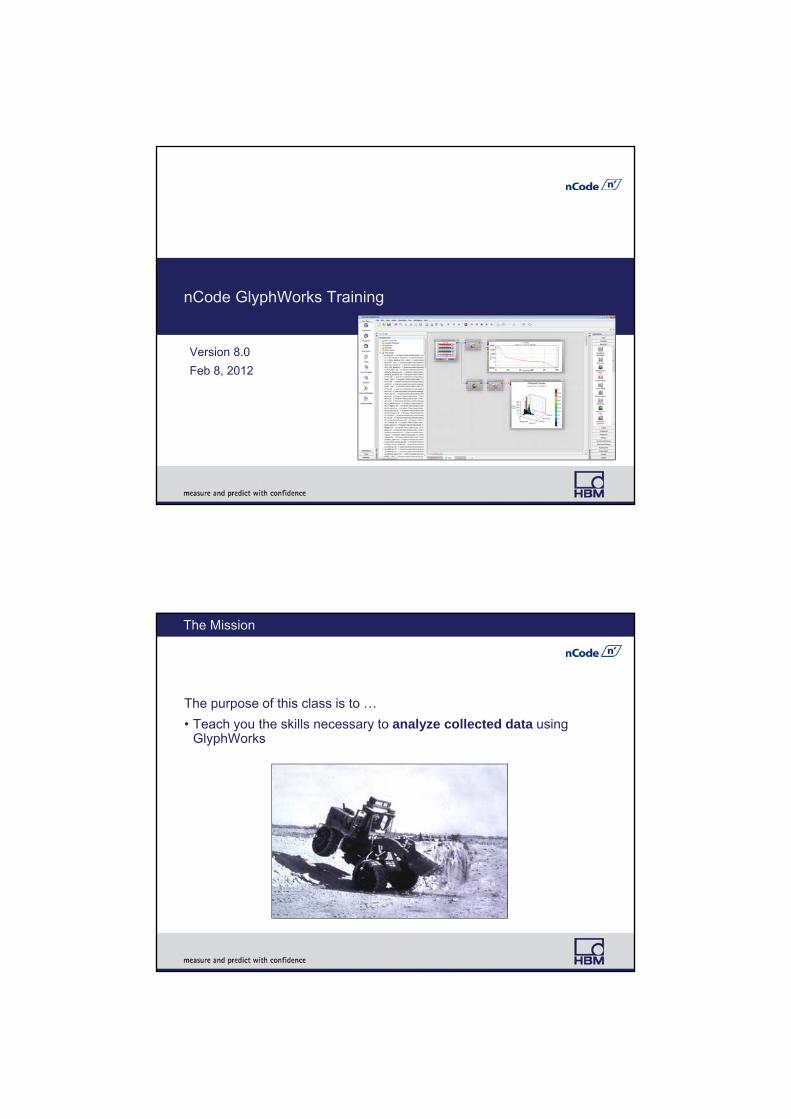
Version 8.0
Feb 8, 2012
nCode GlyphWorks Training
The Mission
The purpose of this class is to …
• Teach you the skills necessary to analyze collected data using GlyphWorks
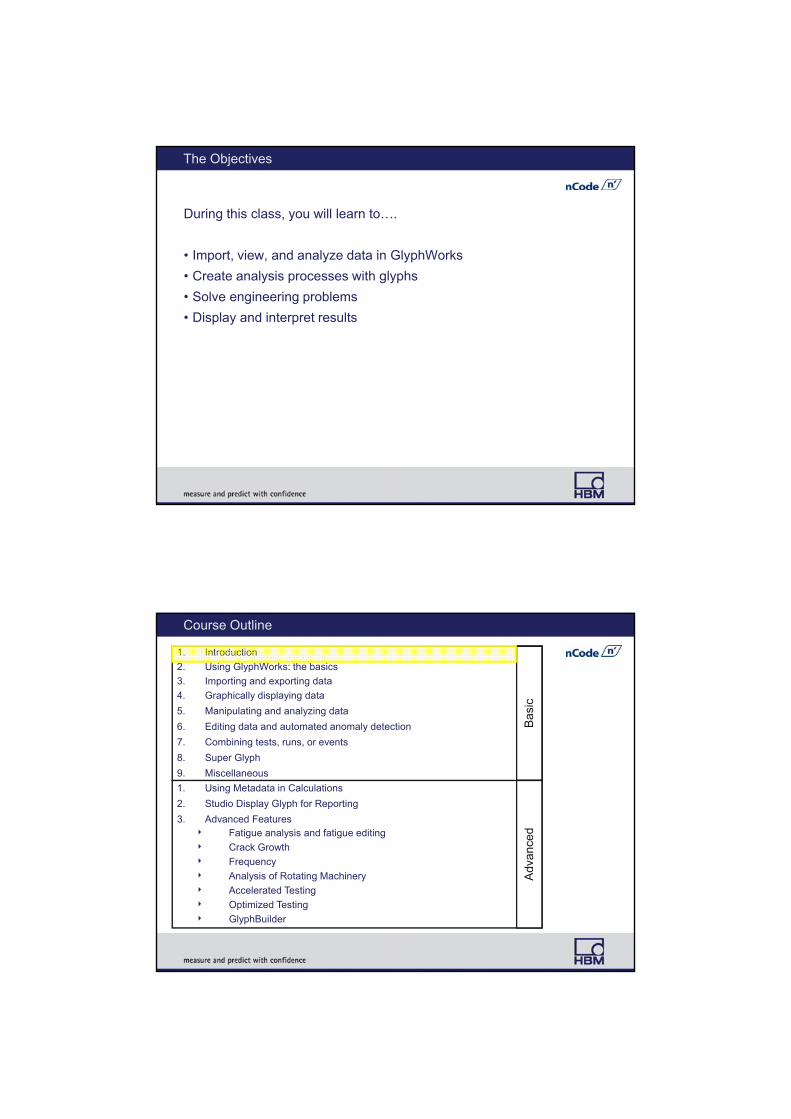
The Objectives
During this class, you will learn to….
• Import, view, and analyze data in GlyphWorks
• Create analysis processes with glyphs
• Solve engineering problems
• Display and interpret results
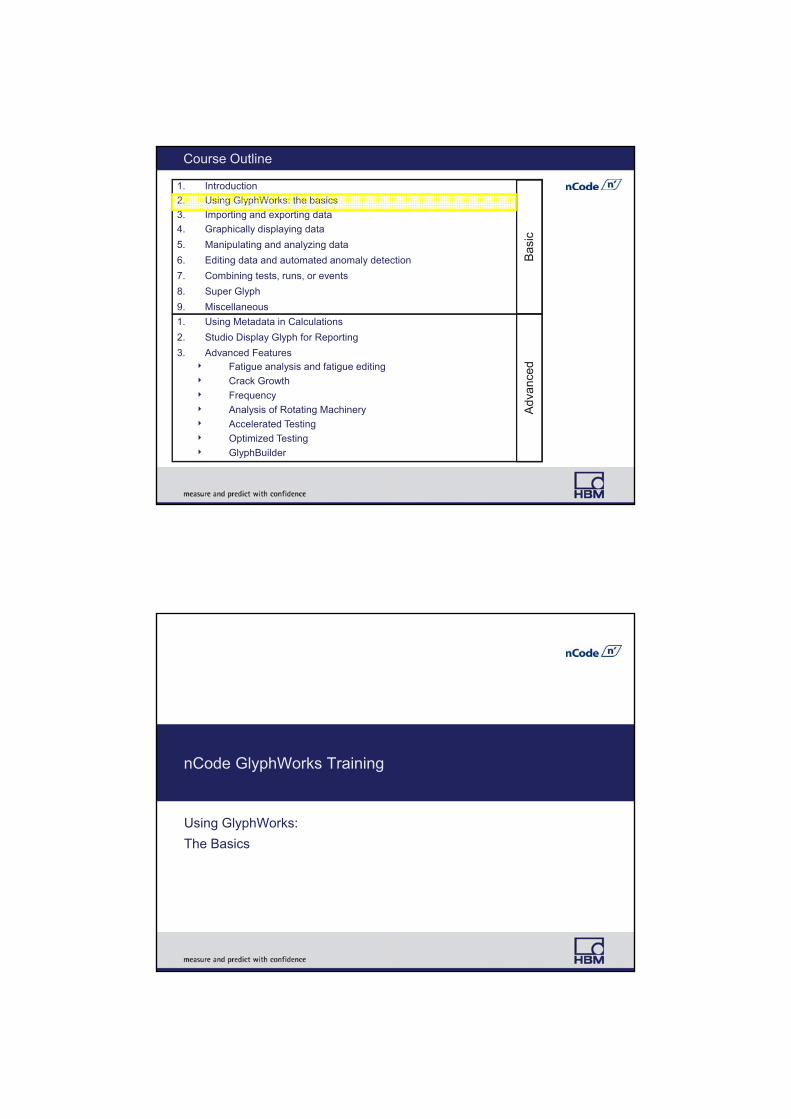
Course Outline
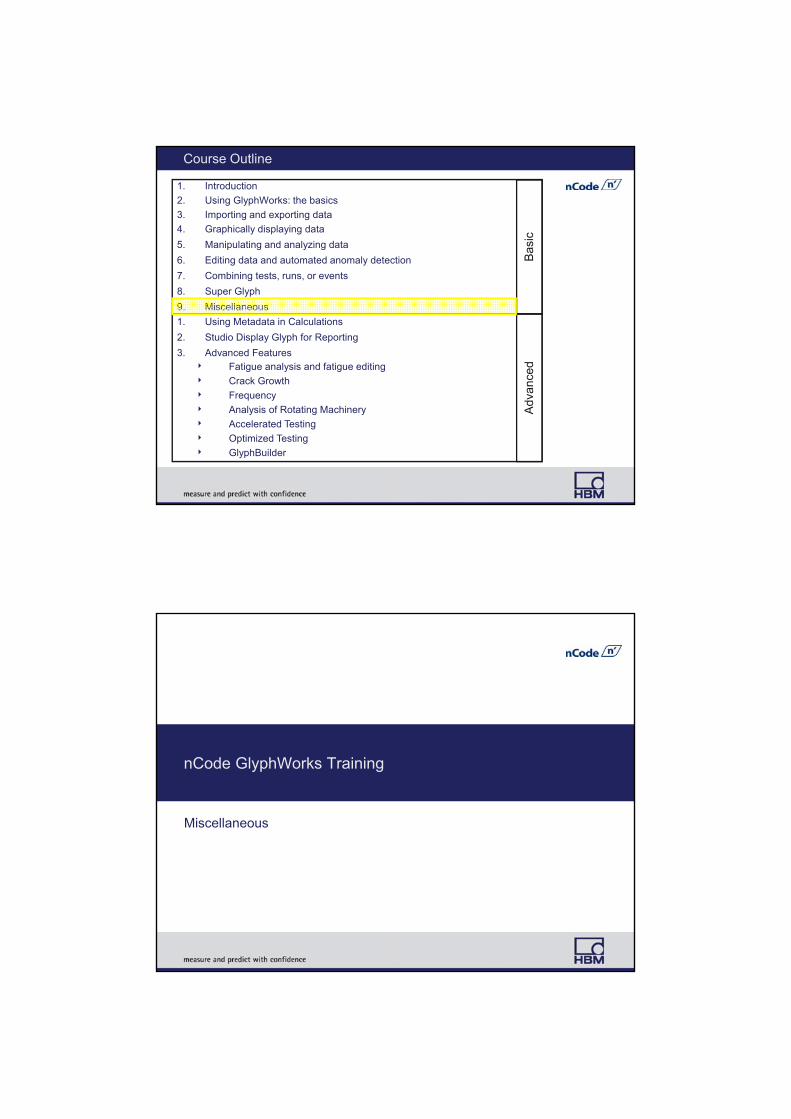
1. Introduction
2. Using GlyphWorks: the basics
3. Importing and exporting data
4. Graphically displaying data
5. Manipulating and analyzing data
6. Editing data and automated anomaly detection
7. Combining tests, runs, or events
8. Super Glyph
9. Miscellaneous
Bas
ic
1. Using Metadata in Calculations
2. Studio Display Glyph for Reporting
3. Advanced Features Fatigue analysis and fatigue editing
Crack Growth
Frequency
Analysis of Rotating Machinery
Accelerated Testing
Optimized Testing
GlyphBuilder
Adv
ance
d

nCode GlyphWorks Training
Hands On:
Creating a ‘Hello World’ Process
Introduction to nCode software
GlyphWorks Training
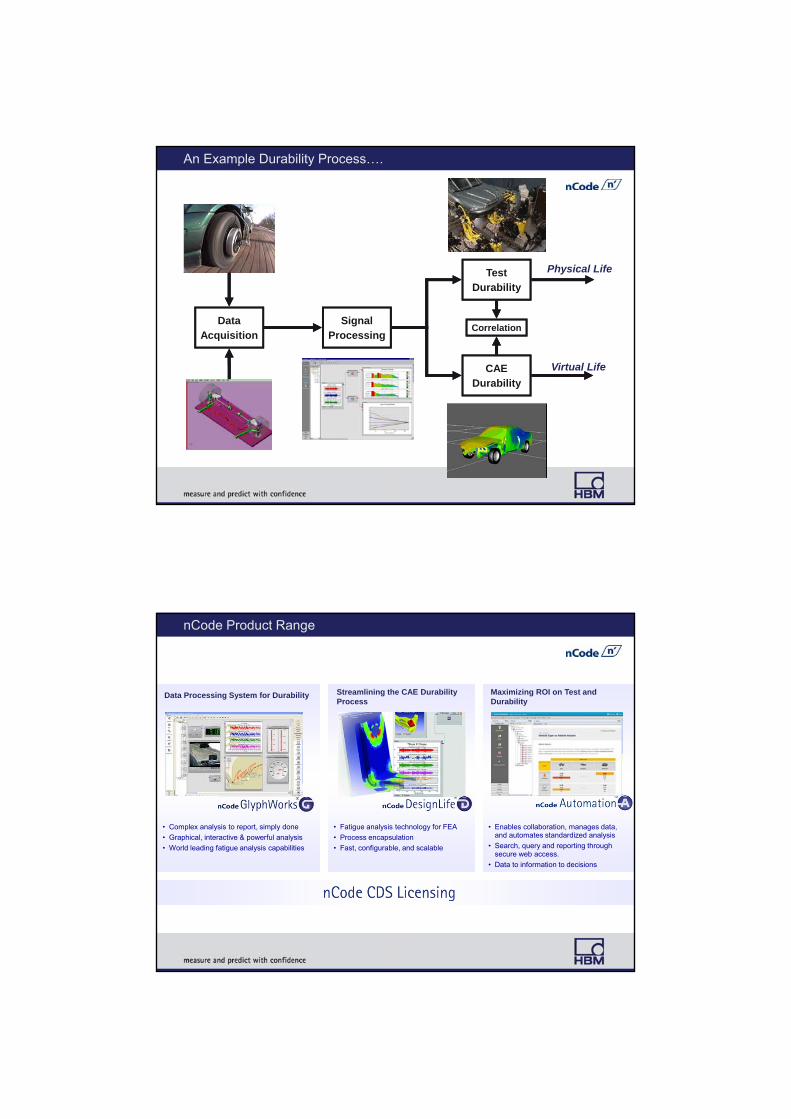
An Example Durability Process….
Physical Life
Virtual LifeCAEDurability
TestDurability
SignalProcessing
CorrelationData
Acquisition
nCode Product Range
• Complex analysis to report, simply done
• Graphical, interactive & powerful analysis
• World leading fatigue analysis capabilities
• Enables collaboration, manages data, and automates standardized analysis
• Search, query and reporting through secure web access.
• Data to information to decisions
• Fatigue analysis technology for FEA
• Process encapsulation
• Fast, configurable, and scalable
Data Processing System for Durability Streamlining the CAE Durability Process
Maximizing ROI on Test and Durability

nCode GlyphWorks®
Data Processing System for Durability
• Fatigue analysis with stress-life, strain-life, and crack growth technology
• Accelerates durability and vibration tests for both time and frequency domain applications
• Analyzes gigabytes of multi-channel data and streamlines reporting
• Process-oriented and graphical environmentfor standardized analysis of your measured data
• Wide range of built-in analysis functions and display types
• Extensible using Python scripting and MATLAB®
nCode DesignLife™
• Predicts fatigue from FEA accurately and efficiently using industry leading capabilities
• Stress-life and strain-life analysis accounting for mean stress, temperature, plasticity, stress gradients, and more
• Advanced technology including thermo-mechanical, composites, multi-axial, welds, vibration, crack growth, Python extensions
• Supports FEA results from ANSYS, Abaqus, Nastran, LS-Dyna, and more
• Highly configurable for the expert user
• Duty cycle capabilities for real world loading simulations of components and structures
• Fast results with parallel processing capabilities
Streamlining the CAE Durability Process

nCode Automation™
Maximize ROI on Test and Durability
• Enables collaboration, manages data, and automates standardized analysis
• Reduces vast amounts of data to key information through powerful analytics, search and reporting
• Web-based, multi-tier server-based Java EE technology, straightforward to deploy and use
• Scalable from single desktop up to corporate-wide applications using IBM WebSphere and Oracle databases
• Secure data communication with compliance to ITAR requirements and full traceability of transactions
nCode GlyphWorks Training
Introduction to GlyphWorks
GlyphWorks®
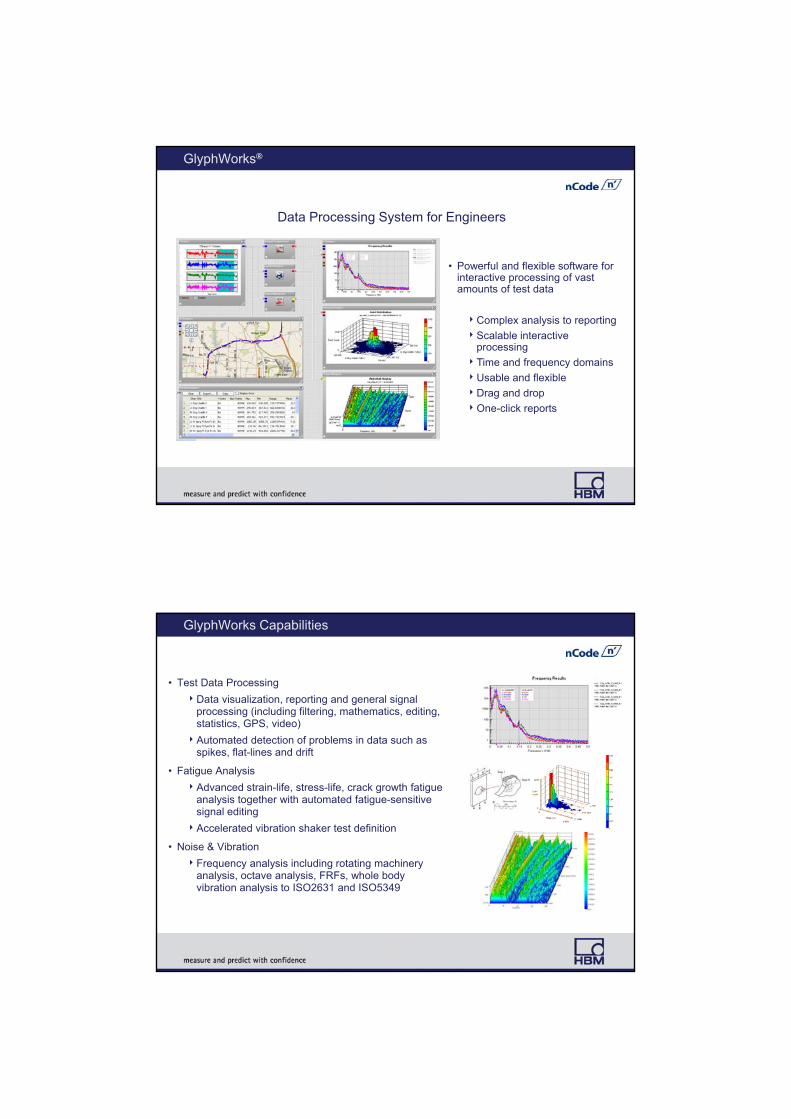
Data Processing System for Engineers
• Powerful and flexible software for interactive processing of vast amounts of test data
Complex analysis to reporting
Scalable interactive processing
Time and frequency domains
Usable and flexible
Drag and drop
One-click reports
GlyphWorks Capabilities
• Test Data Processing
Data visualization, reporting and general signal processing (including filtering, mathematics, editing, statistics, GPS, video)
Automated detection of problems in data such as spikes, flat-lines and drift
• Fatigue Analysis
Advanced strain-life, stress-life, crack growth fatigue analysis together with automated fatigue-sensitive signal editing
Accelerated vibration shaker test definition
• Noise & Vibration
Frequency analysis including rotating machinery analysis, octave analysis, FRFs, whole body vibration analysis to ISO2631 and ISO5349
Course Outline
1. Introduction
2. Using GlyphWorks: the basics
3. Importing and exporting data
4. Graphically displaying data
5. Manipulating and analyzing data
6. Editing data and automated anomaly detection
7. Combining tests, runs, or events
8. Super Glyph
9. Miscellaneous
Bas
ic
1. Using Metadata in Calculations
2. Studio Display Glyph for Reporting
3. Advanced Features Fatigue analysis and fatigue editing
Crack Growth
Frequency
Analysis of Rotating Machinery
Accelerated Testing
Optimized Testing
GlyphBuilder
Adv
ance
d
nCode GlyphWorks Training
Using GlyphWorks:
The Basics
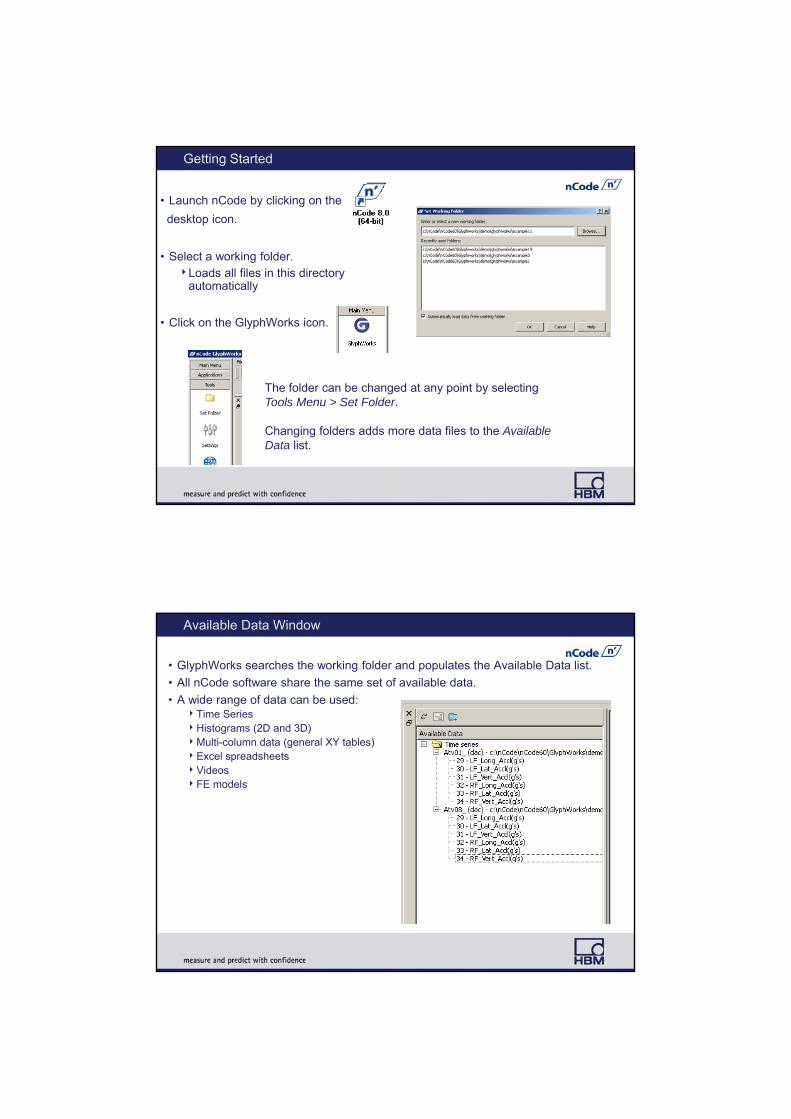
Getting Started
• Launch nCode by clicking on the
desktop icon.
• Select a working folder.Loads all files in this directory
automatically
• Click on the GlyphWorks icon.
The folder can be changed at any point by selecting Tools Menu > Set Folder.
Changing folders adds more data files to the Available Data list.
Available Data Window
• GlyphWorks searches the working folder and populates the Available Data list.
• All nCode software share the same set of available data.
• A wide range of data can be used:Time SeriesHistograms (2D and 3D)Multi-column data (general XY tables)Excel spreadsheetsVideosFE models

Available Data Window
Refresh list Plot with nCode Viewer Index for nCode Automation
Test
Channels
Selectable Data Views
Right click to change the data view.
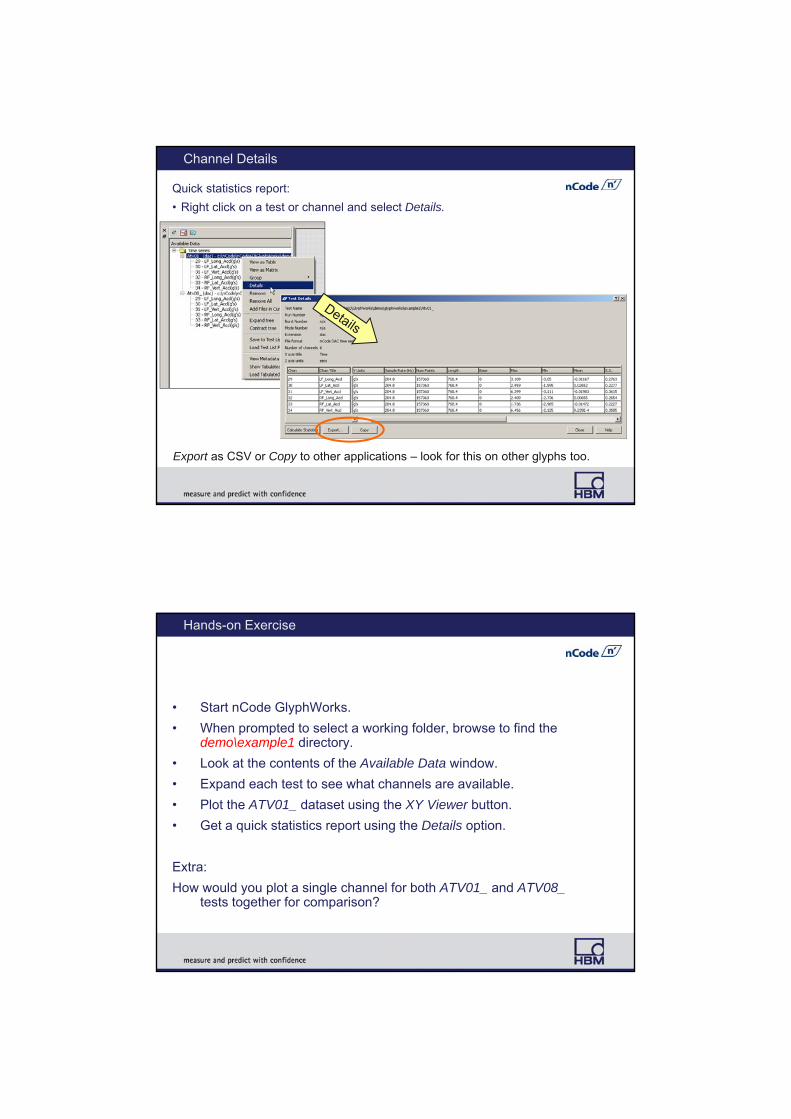
Channel Details
Quick statistics report:
• Right click on a test or channel and select Details.
Export as CSV or Copy to other applications – look for this on other glyphs too.
Hands-on Exercise
• Start nCode GlyphWorks.
• When prompted to select a working folder, browse to find the demo\example1 directory.
• Look at the contents of the Available Data window.
• Expand each test to see what channels are available.
• Plot the ATV01_ dataset using the XY Viewer button.
• Get a quick statistics report using the Details option.
Extra:
How would you plot a single channel for both ATV01_ and ATV08_tests together for comparison?

What is a Glyph?
• Processes are defined graphically using process building blocks called glyphs.
Glyph 1Pad
Pipe
• Glyphs are connected by pipes, which contain the data that passes between glyphs and attach at the glyph's pads.
Glyph 2
Pad
GlyphWorks Design Elements
Glyph Palette
Available Data
Pipe
Glyph
Tip: Windows can be turned on and off via the View pulldown menu.

Display Toolbar
The content of this section updates as you click on display glyphs.
Hands-on Exercise
• Create a process to differentiate the ATV01 time series data
(which is in the demo\example1 folder).
• Plot the differentiated data along with the original data using an XYDisplay glyph.
• Notice that by default the XYDisplay glyph shows different channel content depending on how many input pads are used.
1 input pad: show all channels from a single data stream
2 input pads: show 1 channel from 2 data streams, like original vs. edited
Differentiated data
Original data
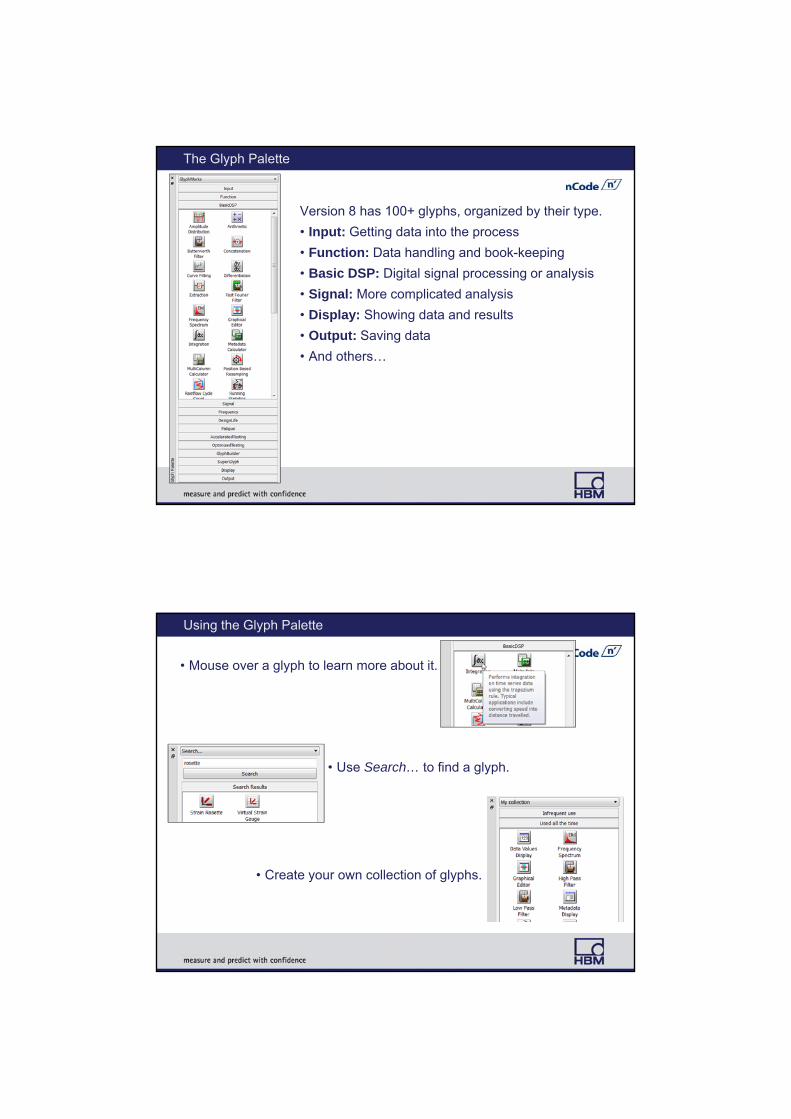
The Glyph Palette
Version 8 has 100+ glyphs, organized by their type.
• Input: Getting data into the process
• Function: Data handling and book-keeping
• Basic DSP: Digital signal processing or analysis
• Signal: More complicated analysis
• Display: Showing data and results
• Output: Saving data
• And others…
Using the Glyph Palette
• Mouse over a glyph to learn more about it.
• Use Search… to find a glyph.
• Create your own collection of glyphs.
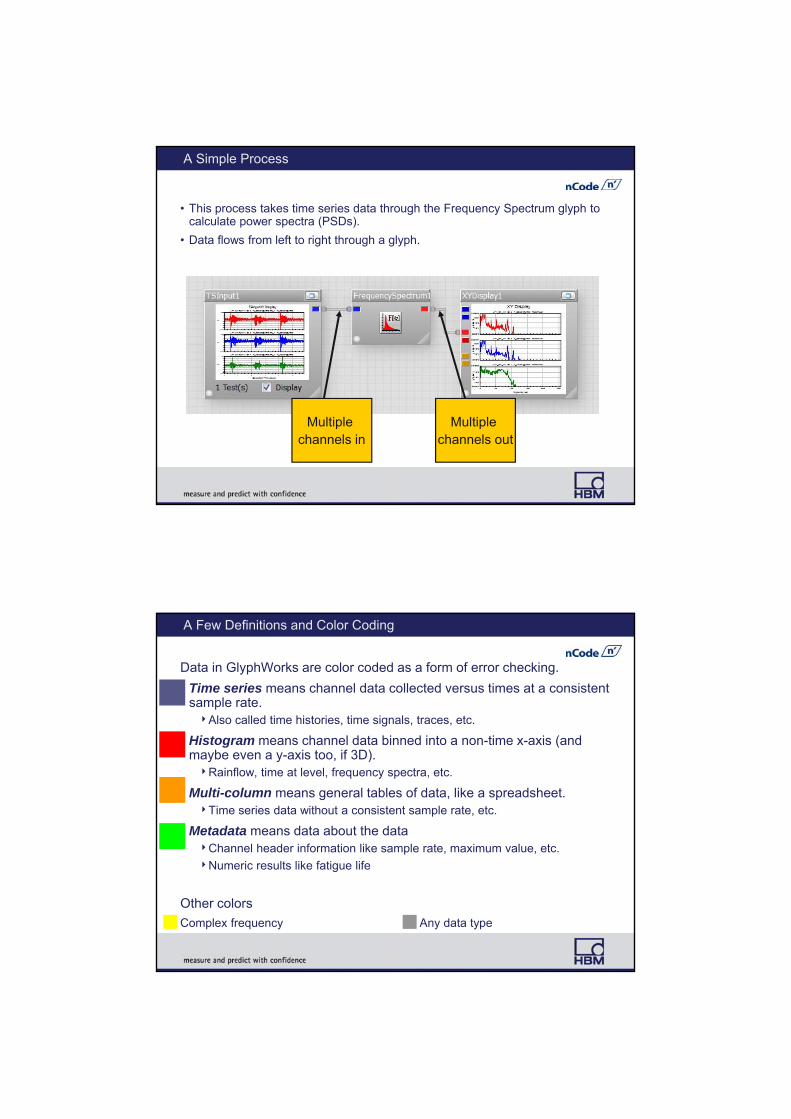
A Simple Process
• This process takes time series data through the Frequency Spectrum glyph to calculate power spectra (PSDs).
• Data flows from left to right through a glyph.
Multiple channels in
Multiple channels out
A Few Definitions and Color Coding
Data in GlyphWorks are color coded as a form of error checking.
• Time series means channel data collected versus times at a consistent sample rate.Also called time histories, time signals, traces, etc.
• Histogram means channel data binned into a non-time x-axis (and maybe even a y-axis too, if 3D).Rainflow, time at level, frequency spectra, etc.
• Multi-column means general tables of data, like a spreadsheet.Time series data without a consistent sample rate, etc.
• Metadata means data about the dataChannel header information like sample rate, maximum value, etc.
Numeric results like fatigue life
Other colors
Complex frequency Any data type
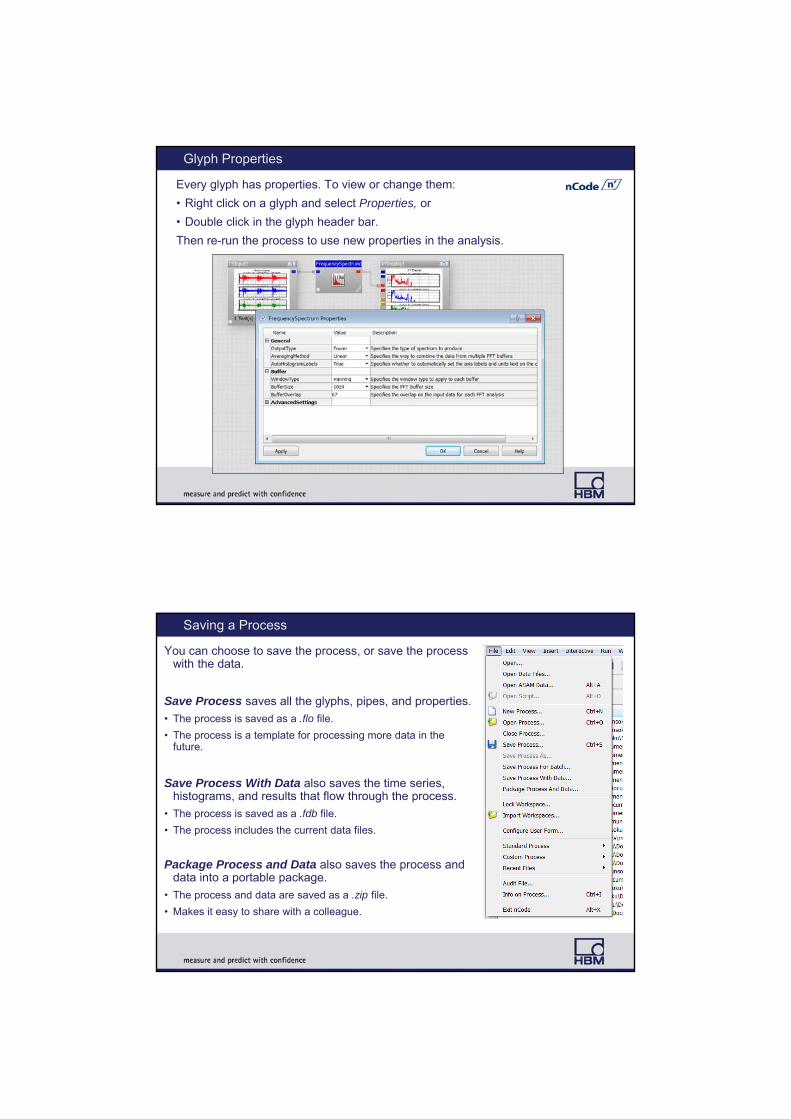
Glyph Properties
Every glyph has properties. To view or change them:
• Right click on a glyph and select Properties, or
• Double click in the glyph header bar.
Then re-run the process to use new properties in the analysis.
Saving a Process
You can choose to save the process, or save the process with the data.
Save Process saves all the glyphs, pipes, and properties.
• The process is saved as a .flo file.
• The process is a template for processing more data in the future.
Save Process With Data also saves the time series, histograms, and results that flow through the process.
• The process is saved as a .fdb file.
• The process includes the current data files.
Package Process and Data also saves the process and data into a portable package.
• The process and data are saved as a .zip file.
• Makes it easy to share with a colleague.

Running a Process
• Run process using the Run tool bar.
• The “In Process” light turns red as each glyph processes data.
Run the whole process.Run 1 glyph at a time.
• The Diagnostics window shows execution progress.
Usability Features
Glyph layout usability features include….Undo / redo
Cut / copy / paste
Multiple glyph selection
Rename glyphs
Supports shortcuts like Ctrl -X, -C, -V, etc.
Paste
Copy

Usability Features
Full screen button (or use F9)
Workspace zoom slider
Language Support
• GlyphWorks supports extended character sets required for Japanese, Chinese and Korean fonts.
• Currently providesGerman FrenchChineseJapanese
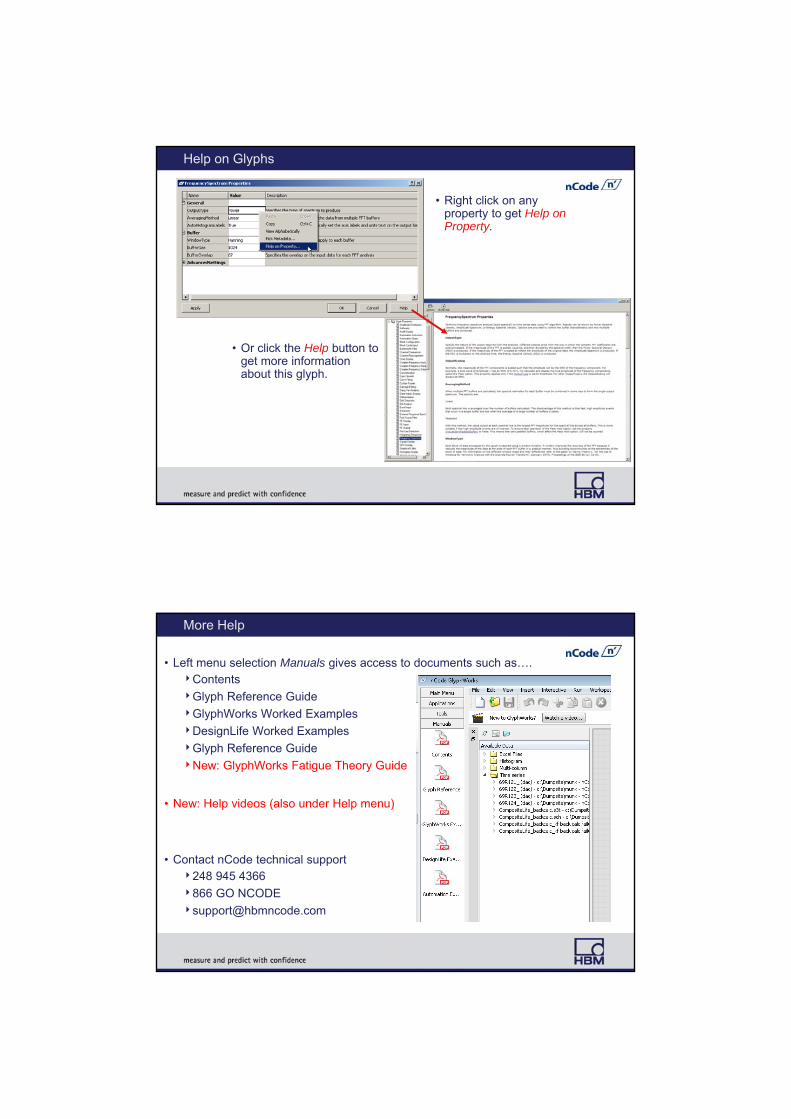
Help on Glyphs
• Right click on any property to get Help on Property.
• Or click the Help button to get more information about this glyph.
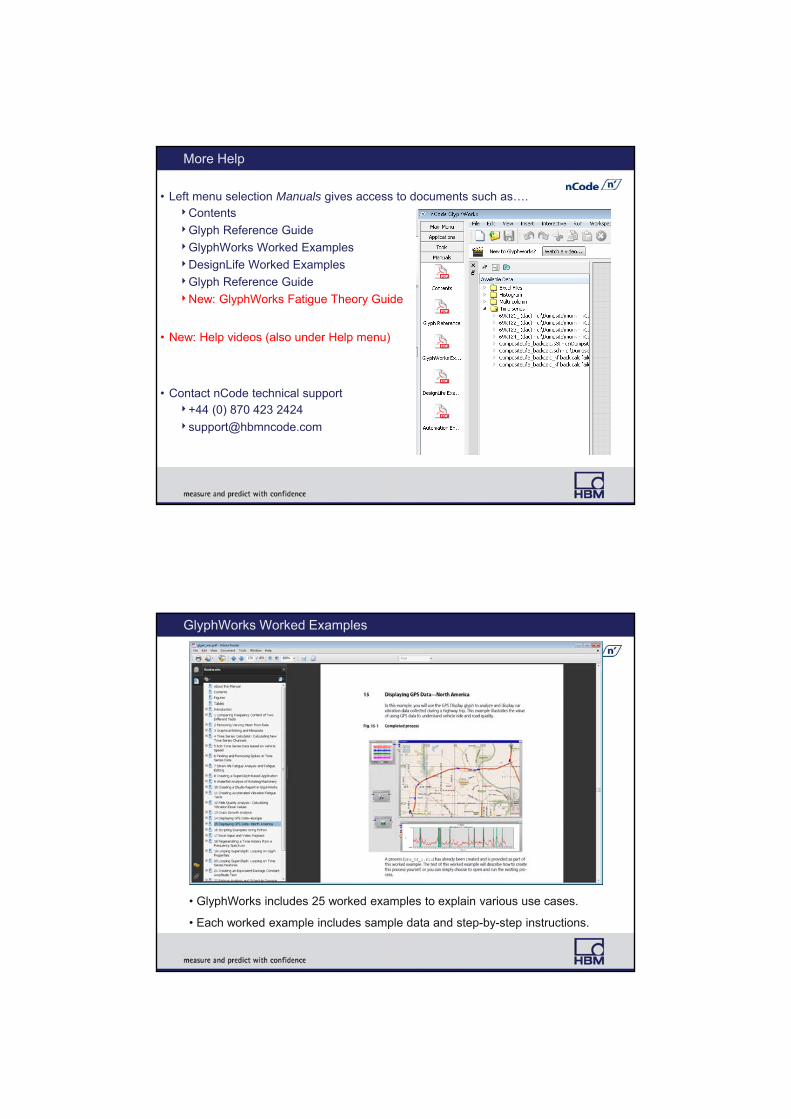
More Help
• Left menu selection Manuals gives access to documents such as….Contents
Glyph Reference Guide
GlyphWorks Worked Examples
DesignLife Worked Examples
Glyph Reference Guide
New: GlyphWorks Fatigue Theory Guide
• New: Help videos (also under Help menu)
• Contact nCode technical support248 945 4366
866 GO NCODE
More Help
• Left menu selection Manuals gives access to documents such as….Contents
Glyph Reference Guide
GlyphWorks Worked Examples
DesignLife Worked Examples
Glyph Reference Guide
New: GlyphWorks Fatigue Theory Guide
• New: Help videos (also under Help menu)
• Contact nCode technical support+44 (0) 870 423 2424
GlyphWorks Worked Examples
• GlyphWorks includes 25 worked examples to explain various use cases.
• Each worked example includes sample data and step-by-step instructions.
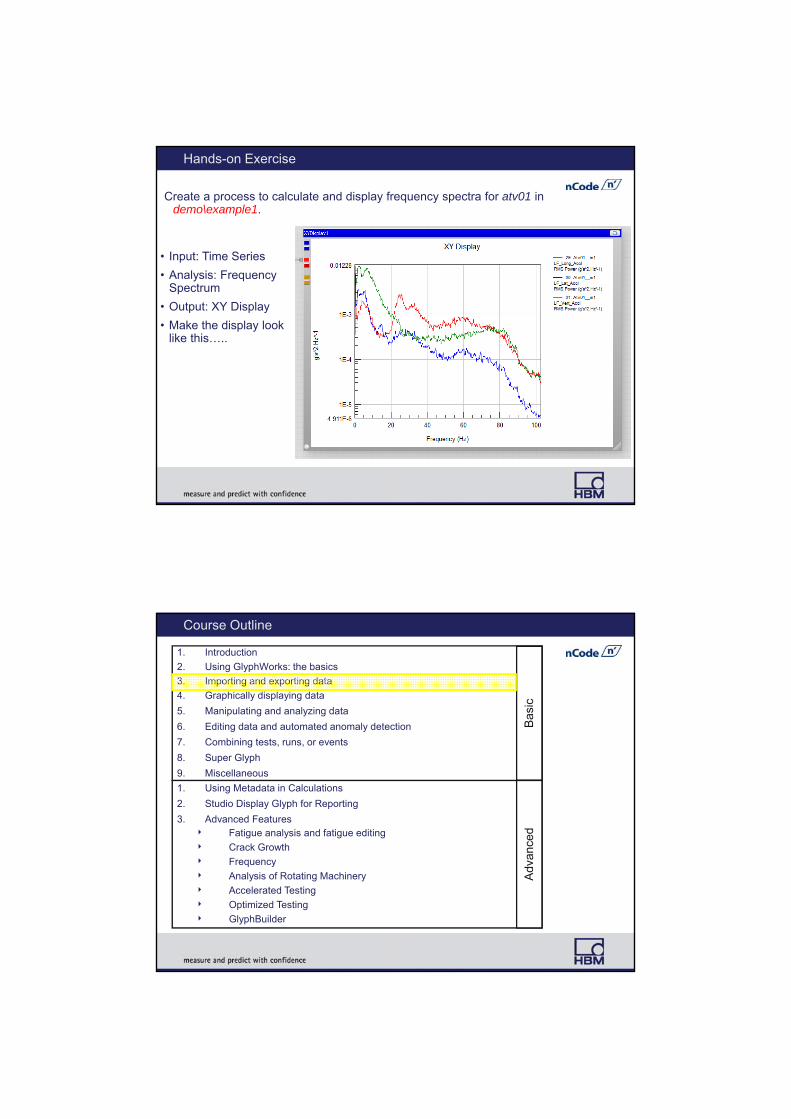
Hands-on Exercise
Create a process to calculate and display frequency spectra for atv01 in demo\example1.
• Input: Time Series
• Analysis: Frequency Spectrum
• Output: XY Display
• Make the display look like this…..
Course Outline
1. Introduction
2. Using GlyphWorks: the basics
3. Importing and exporting data
4. Graphically displaying data
5. Manipulating and analyzing data
6. Editing data and automated anomaly detection
7. Combining tests, runs, or events
8. Super Glyph
9. Miscellaneous
Bas
ic
1. Using Metadata in Calculations
2. Studio Display Glyph for Reporting
3. Advanced Features Fatigue analysis and fatigue editing
Crack Growth
Frequency
Analysis of Rotating Machinery
Accelerated Testing
Optimized Testing
GlyphBuilder
Adv
ance
d

nCode GlyphWorks Training
Importing and Exporting Data
Data Sources

File Formats
GlyphWorks directly supports a wide range of file formats.
Read and write•HBM catman bin and MEA•nCode s3t and DAC•SoMat SIF•MTS RPC 3•NI Diadem DAT•NI TDM and TDMS•MATLAB (specific format, V5)•nVision Signal•Lexade SIG•ASAM ATFT•DIAdem W16 and R32•Saginomiya RFC •Microsoft WAV•Servotest SBF•EdasWin EDT•ASCII via ASCIITranslate
Read•SoMat SIE and 2100 DAT •Schenck-Pegasus SPG •ACRA Control KAM-500•imc FAMOS RAW•I-DEAS Pro ATI•dAtagate MUX •TEAC TAFFmat•OROS OXF•UFF (I-DEAS Universal File Type 58)•Sony PCScan III and PCScanIV XMX•LDS Nicolet PNRF•Prosig Dats DAC•B&K Pulse PTI•ETAS MDF3•Vector MDF•Dewetron D7D•Microsoft Excel•DSPCon DatX•IPETRONIK bin•Kyowa KS2
ASCIITranslate
• Wizard interfaceDefine format interactively
Standard spreadsheet-style import
• Handles large channel counts, large files, and multiple files.
• Output is binary files that GlyphWorks can use.
ASCIITranslate creates time series, histograms, or multi-column data from ASCII text files.
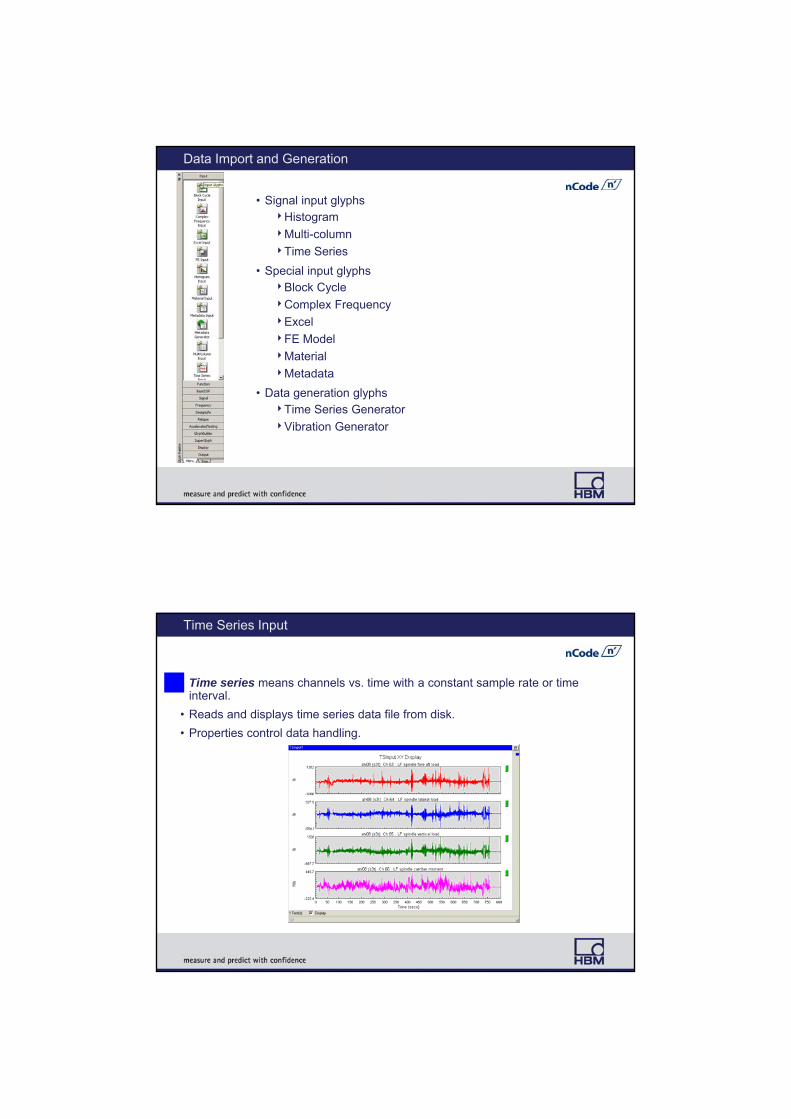
Data Import and Generation
• Signal input glyphsHistogram
Multi-column
Time Series
• Special input glyphsBlock Cycle
Complex Frequency
Excel
FE Model
Material
Metadata
• Data generation glyphsTime Series Generator
Vibration Generator
Time Series Input
• Time series means channels vs. time with a constant sample rate or time interval.
• Reads and displays time series data file from disk.
• Properties control data handling.
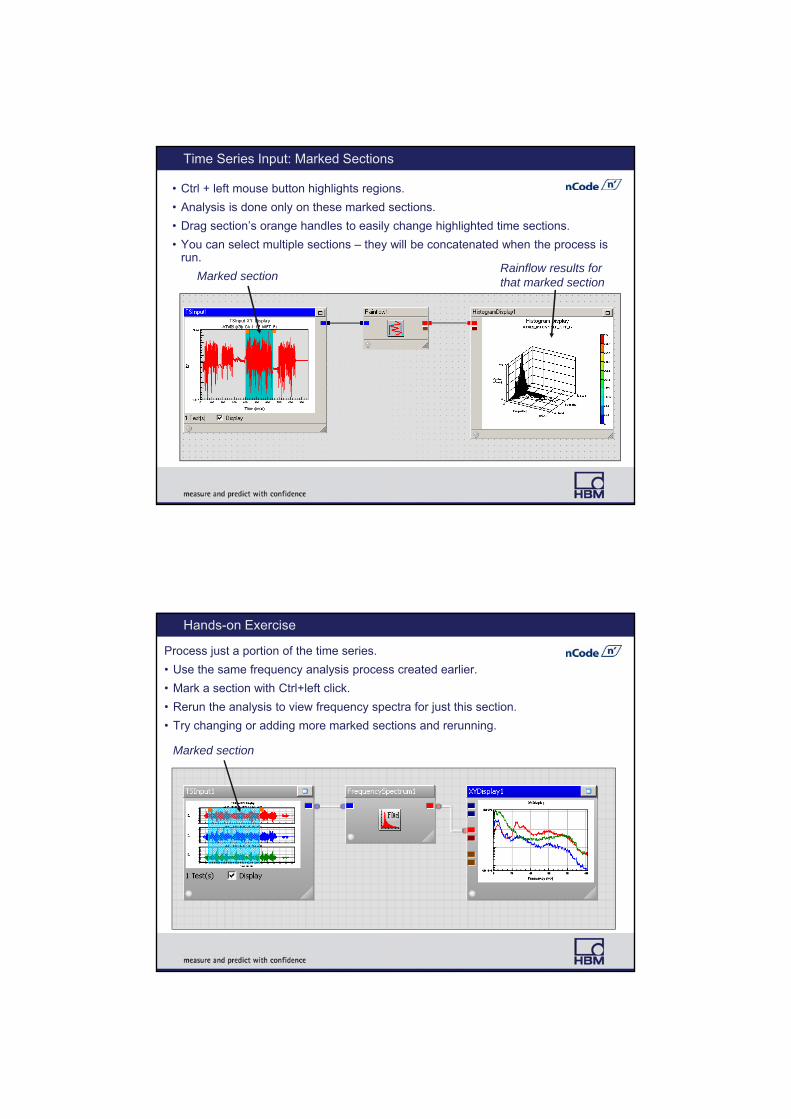
Time Series Input: Marked Sections
• Ctrl + left mouse button highlights regions.
• Analysis is done only on these marked sections.
• Drag section’s orange handles to easily change highlighted time sections.
• You can select multiple sections – they will be concatenated when the process is run.
Marked sectionRainflow results for that marked section
Hands-on Exercise
Process just a portion of the time series.
• Use the same frequency analysis process created earlier.
• Mark a section with Ctrl+left click.
• Rerun the analysis to view frequency spectra for just this section.
• Try changing or adding more marked sections and rerunning.
Marked section

Histogram Input
• Histogram means channel data binned into a non-time x-axis (and maybe even a y-axis too, if 3D).
• Reads histogram data file from disk.
• Examples include rainflow, time at level, frequency spectra, etc.
Multi-column Input
• Multi-column means general tables of data, like a spreadsheet.
Examples:• paired XY data• comma-separated value tables• time series data without a consistent sample rate • feature lists (see sections on triggers and anomalies)
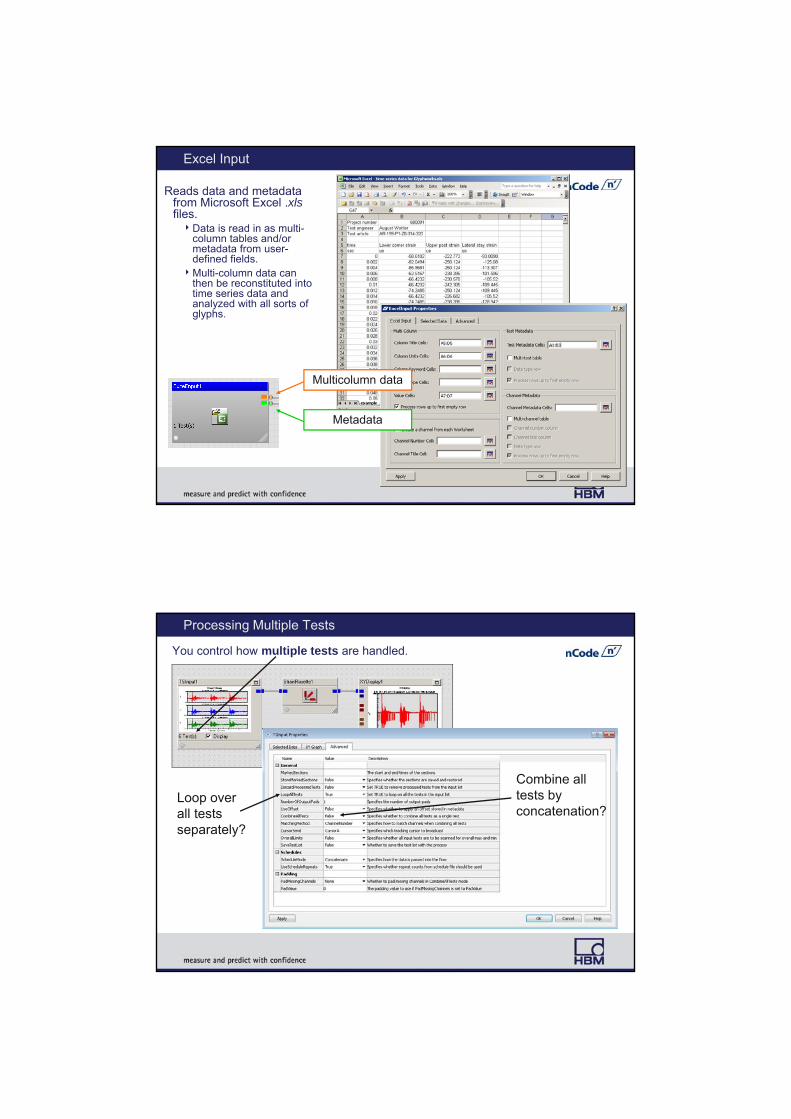
Excel Input
Reads data and metadata from Microsoft Excel .xlsfiles.Data is read in as multi-
column tables and/or metadata from user-defined fields.
Multi-column data can then be reconstituted into time series data and analyzed with all sorts of glyphs.
Multicolumn data
Metadata
Processing Multiple Tests
You control how multiple tests are handled.
Loop over all tests separately?
Combine all tests by concatenation?

Collating Data
• Select Collate Data to keep all displayed results if working with multiple separate tests.
Results from all 3 tests
• Pick which results are displayed with the Channel Selection dialog.
3 tests
Hands-on Exercise
Compare the frequency content of several tests.
• Use both tests ATV01_ and ATV08_ from demo\example1 directory.
• Create a process to calculate and display the frequency spectra. TimeSeriesInput -> FrequencySpectrum -> XYDisplay
• Turn Run -> Collate Data on to keep all displayed results for all tests.
• Display channel 29 for both tests using XYDisplay’s channel selection utility.
Comparison of channel 29 for ATV01_ and
ATV08_
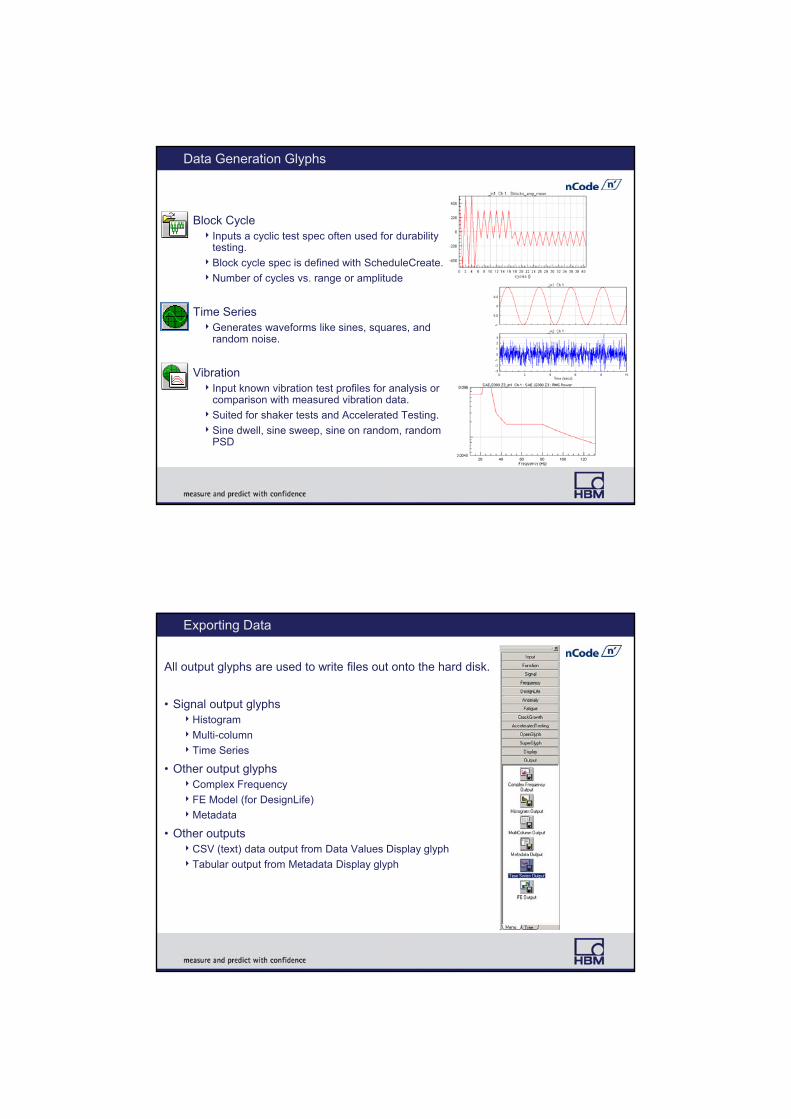
Data Generation Glyphs
• Block Cycle Inputs a cyclic test spec often used for durability
testing.
Block cycle spec is defined with ScheduleCreate.
Number of cycles vs. range or amplitude
• Time SeriesGenerates waveforms like sines, squares, and
random noise.
• Vibration Input known vibration test profiles for analysis or
comparison with measured vibration data.
Suited for shaker tests and Accelerated Testing.
Sine dwell, sine sweep, sine on random, random PSD
Exporting Data
All output glyphs are used to write files out onto the hard disk.
• Signal output glyphsHistogram
Multi-column
Time Series
• Other output glyphsComplex Frequency
FE Model (for DesignLife)
Metadata
• Other outputsCSV (text) data output from Data Values Display glyph
Tabular output from Metadata Display glyph
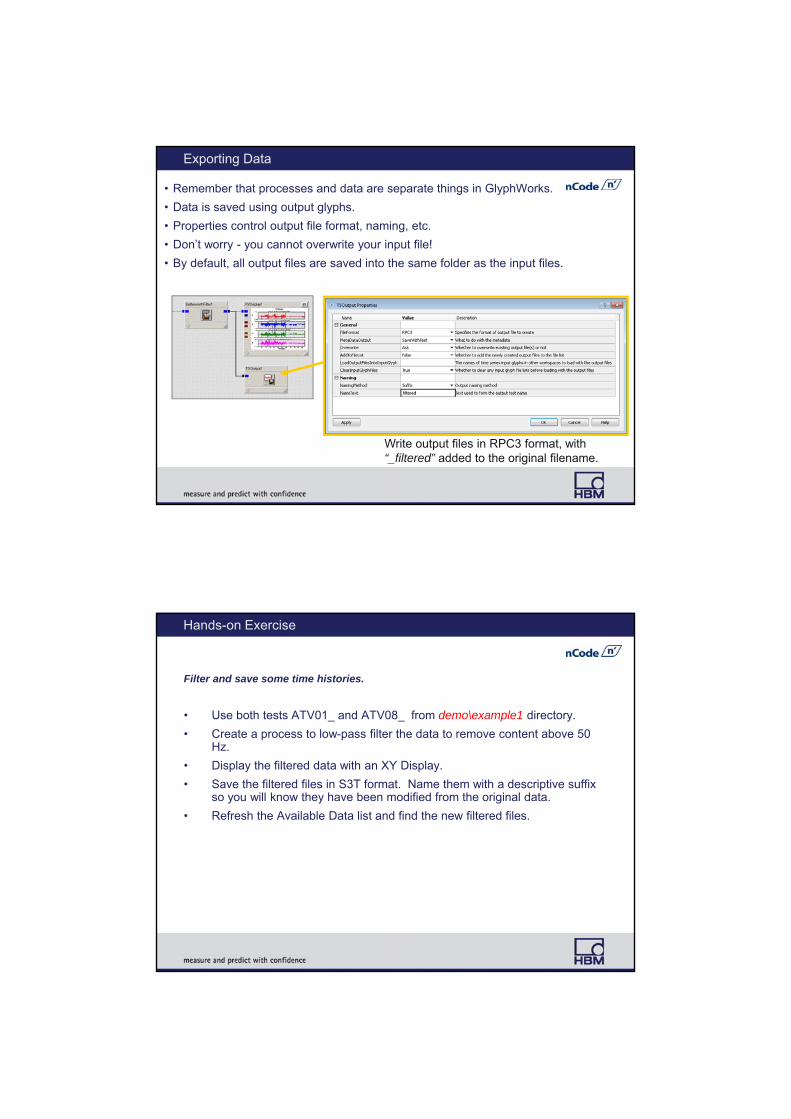
Exporting Data
• Remember that processes and data are separate things in GlyphWorks.
• Data is saved using output glyphs.
• Properties control output file format, naming, etc.
• Don’t worry - you cannot overwrite your input file!
• By default, all output files are saved into the same folder as the input files.
Write output files in RPC3 format, with “_filtered” added to the original filename.
Hands-on Exercise
Filter and save some time histories.
• Use both tests ATV01_ and ATV08_ from demo\example1 directory.
• Create a process to low-pass filter the data to remove content above 50 Hz.
• Display the filtered data with an XY Display.
• Save the filtered files in S3T format. Name them with a descriptive suffix so you will know they have been modified from the original data.
• Refresh the Available Data list and find the new filtered files.
Course Outline
1. Introduction
2. Using GlyphWorks: the basics
3. Importing and exporting data
4. Graphically displaying data
5. Manipulating and analyzing data
6. Editing data and automated anomaly detection
7. Combining tests, runs, or events
8. Super Glyph
9. Miscellaneous
Bas
ic
1. Using Metadata in Calculations
2. Studio Display Glyph for Reporting
3. Advanced Features Fatigue analysis and fatigue editing
Crack Growth
Frequency
Analysis of Rotating Machinery
Accelerated Testing
Optimized Testing
GlyphBuilder
Adv
ance
d
nCode GlyphWorks Training
Graphically Displaying Data
Display and Reporting
• Chart DisplayCharts like bar, pie, etc.
• Data Values DisplayView any data in tabular form
• GPS Display – product optionLat/long on grid or map
• Gauge Display – product optionDynamic readoutsLink to time series and video
• Histogram Display
• Media Display – product optionVideoAudio
• Metadata DisplayDisplay metadata and results in configurable tables
• Studio DisplayReport generation and export
• Waterfall Display
• XY Display
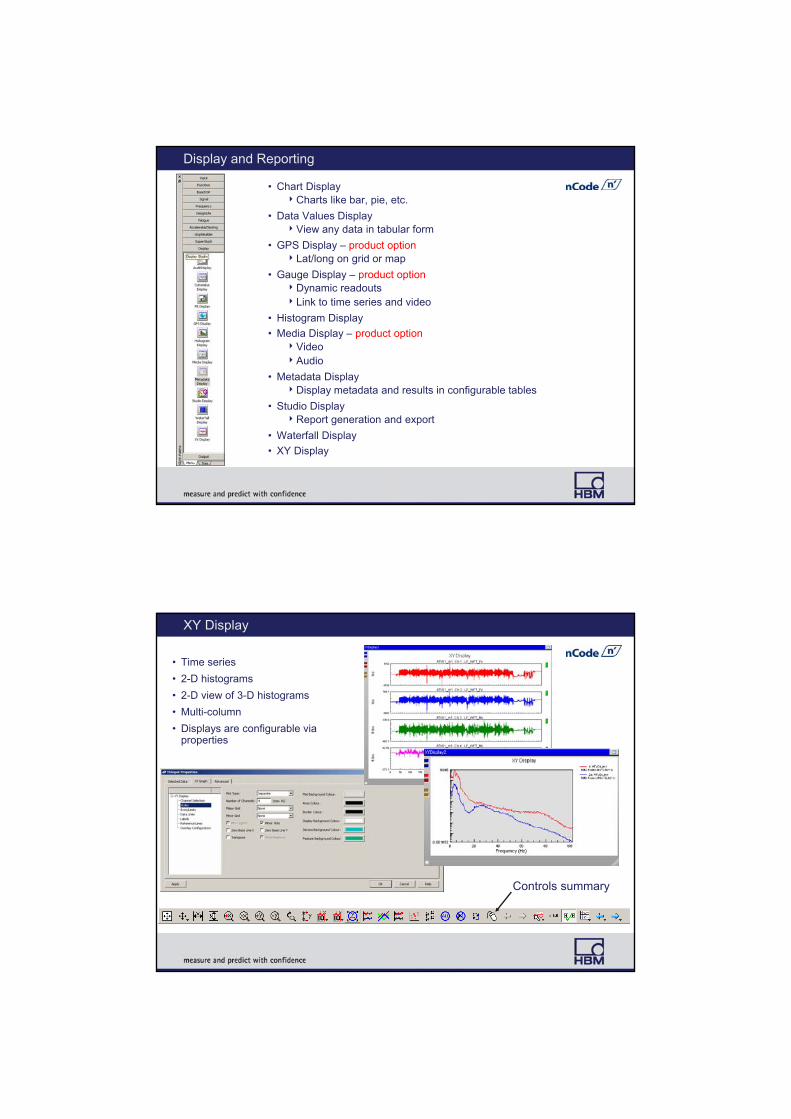
XY Display
• Time series
• 2-D histograms
• 2-D view of 3-D histograms
• Multi-column
• Displays are configurable via properties
Controls summary

Preferences for Displays
• Save the configuration of displays as your preferred setup.
• Define how you want the display to look and then save it with right mouse option ‘Save configuration’.
• Includes separate configurations in XY Display for time series, histogram, and multi-column data.
Selecting Channels for Display
• Select which tests and channels are displayed.
• Includes filtering to limit channel content.
• Example: Show channel 1 for all tests.
Available tests and channels
Available displays slots and content
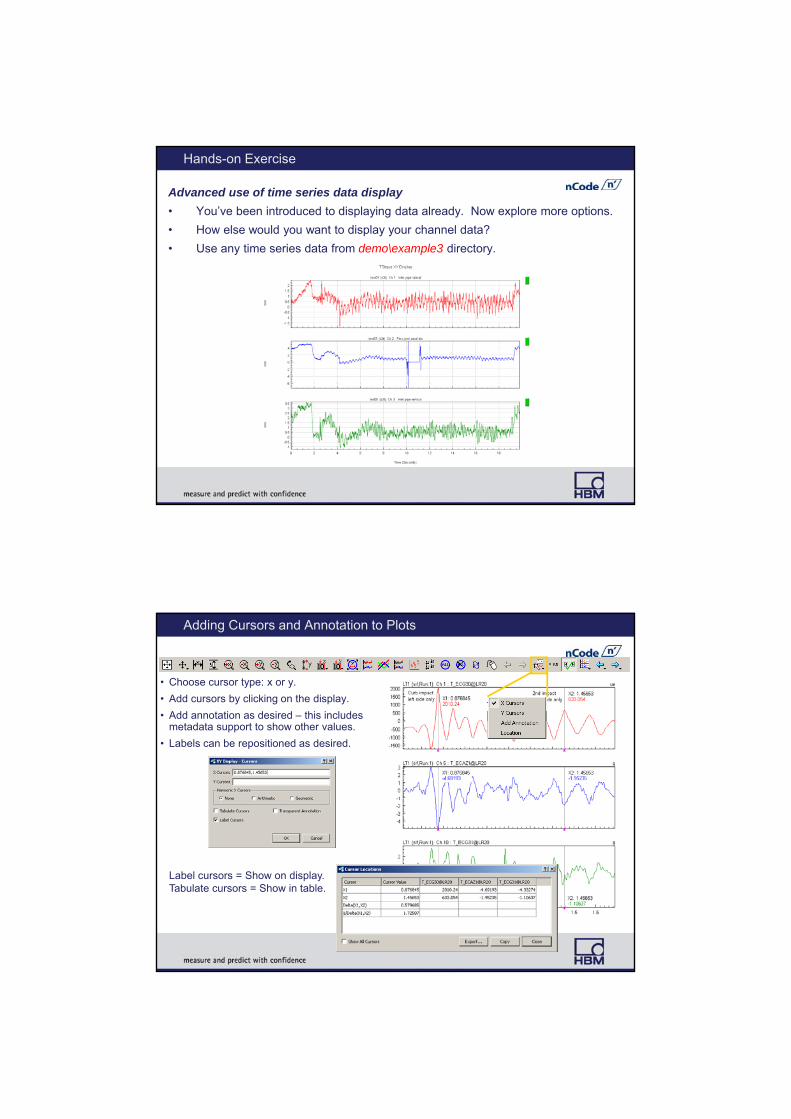
Hands-on Exercise
Advanced use of time series data display
• You’ve been introduced to displaying data already. Now explore more options.
• How else would you want to display your channel data?
• Use any time series data from demo\example3 directory.
Adding Cursors and Annotation to Plots
• Choose cursor type: x or y.
• Add cursors by clicking on the display.
• Add annotation as desired – this includes metadata support to show other values.
• Labels can be repositioned as desired.
Label cursors = Show on display.Tabulate cursors = Show in table.
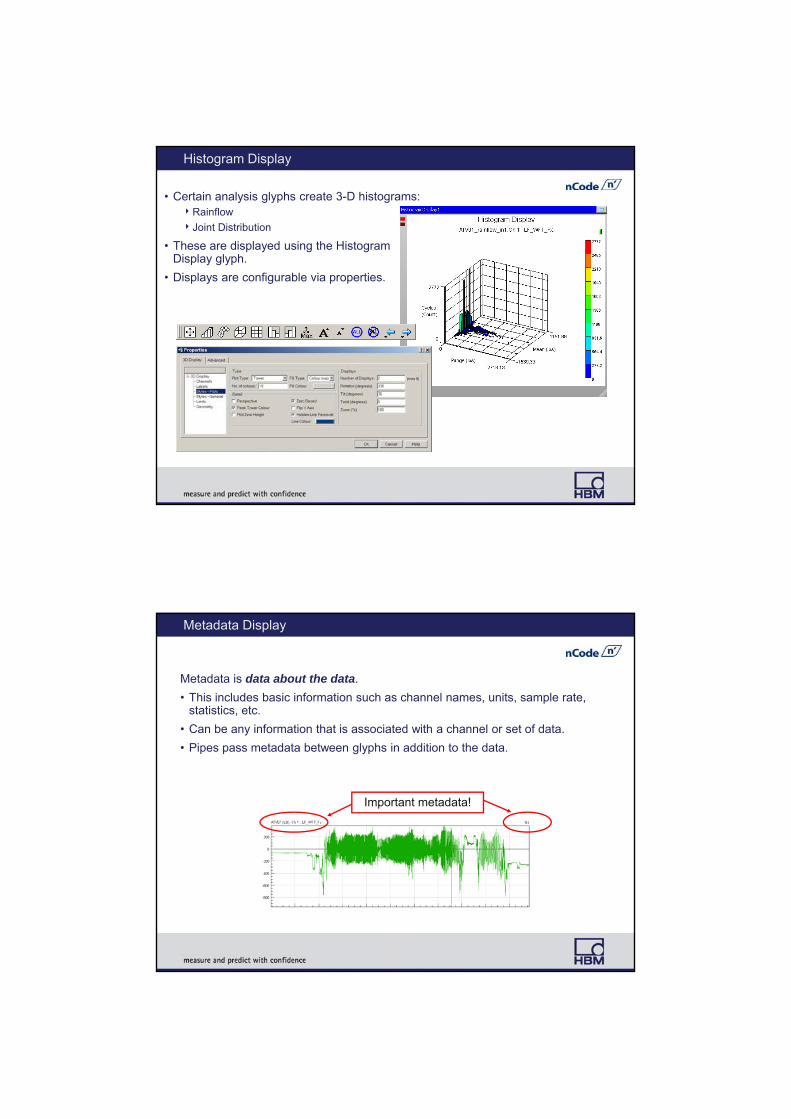
Histogram Display
• Certain analysis glyphs create 3-D histograms:Rainflow
Joint Distribution
• These are displayed using the Histogram Display glyph.
• Displays are configurable via properties.
Metadata Display
Metadata is data about the data.
• This includes basic information such as channel names, units, sample rate, statistics, etc.
• Can be any information that is associated with a channel or set of data.
• Pipes pass metadata between glyphs in addition to the data.
Important metadata!

Displaying Metadata
• Tree view: Shows all metadata.
• Tabular view: Shows select metadata in a channel-based table.
• Custom view with user-defined columns via GUI selection
• Tables can be automatically exported to CSV format for Excel.
Results Are Stored as Metadata
• Analysis glyphs often create additional metadata. These are named using the convention:<NameOfGlyph>_Results
• For instance, a Strain-Life glyph writes a set of metadata to each channel under a section named such as StrainLife1_Results

Data Values Display
See the raw data values of any data in GlyphWorks.
• Number of significant figures is controlled via properties.
• Spreadsheet cells can be colored based on value (for example, show max value in red).
• Export option to CSV file for Excel, etc.
Time series Rainflow histogram with non-zero cycles in red
GPS Display – Product Option
• Plots GPS latitude and longitude data.
• Link channel data with where you were.
• Display background options:A plain grid An interactive map if Microsoft
MapPoint is installedA picture
• Can be highlighted with a feature list.
• Includes synched cursor with XY Display.
• Link to external apps like Google Earth via KML export.
See GlyphWorks Worked Examples #14 and 15.
GPS Display – Product Option
• The GPS Display glyph can also be used to flag regions of interest.
• Graphical Editor glyph can then extract these time segments.
• Very useful for breaking a lap of a proving ground into separate events.
See GlyphWorks Worked Example #25.
Times when vehicle was in
this region
User-defined region
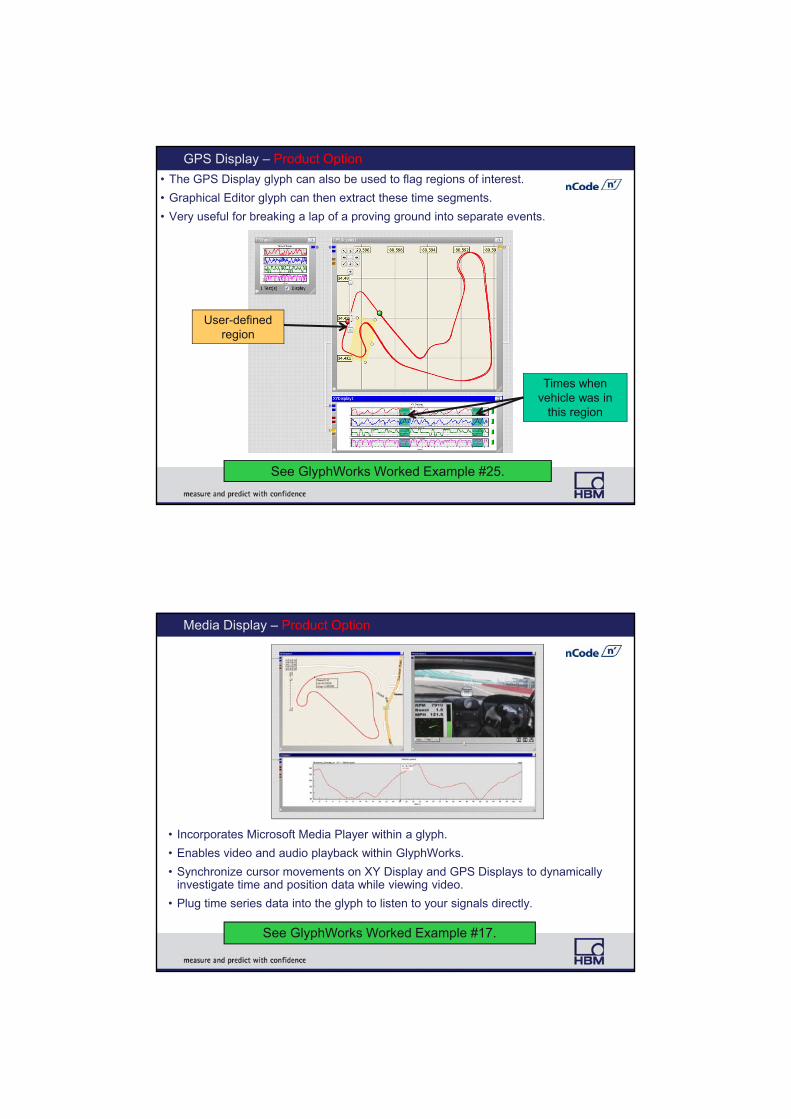
Media Display – Product Option
• Incorporates Microsoft Media Player within a glyph.
• Enables video and audio playback within GlyphWorks.
• Synchronize cursor movements on XY Display and GPS Displays to dynamically investigate time and position data while viewing video.
• Plug time series data into the glyph to listen to your signals directly.
See GlyphWorks Worked Example #17.
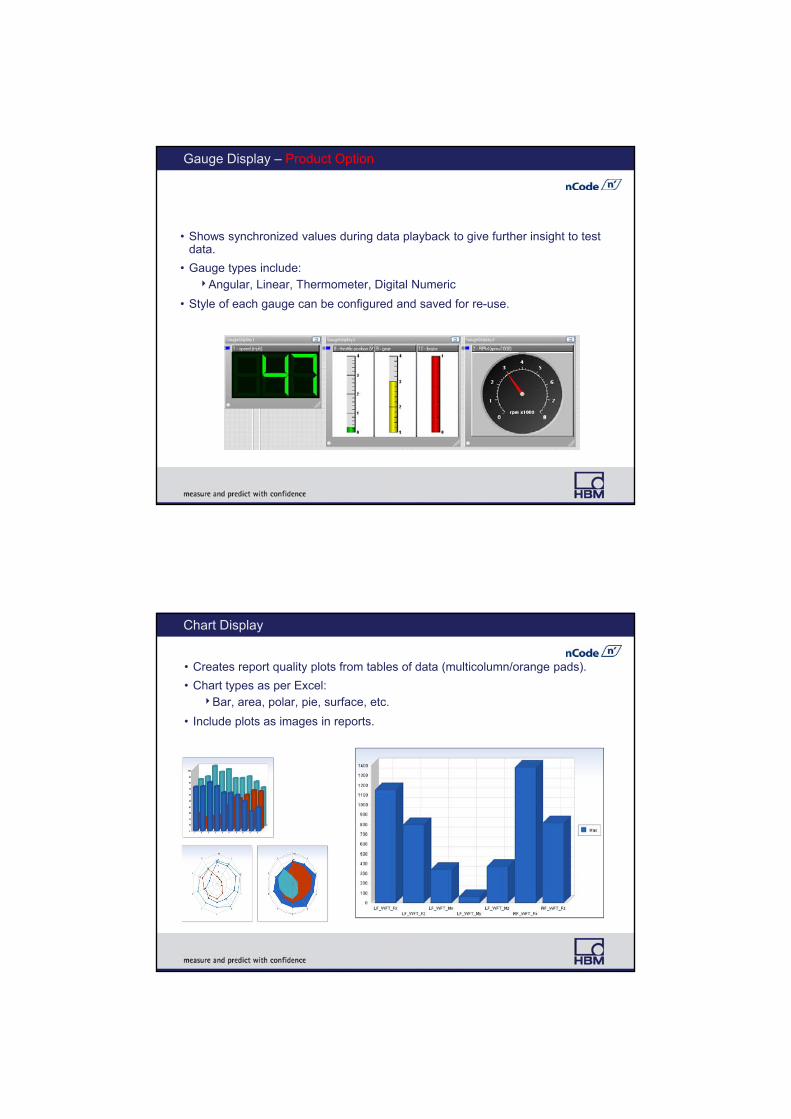
Gauge Display – Product Option
• Shows synchronized values during data playback to give further insight to test data.
• Gauge types include: Angular, Linear, Thermometer, Digital Numeric
• Style of each gauge can be configured and saved for re-use.
Chart Display
• Creates report quality plots from tables of data (multicolumn/orange pads).
• Chart types as per Excel:Bar, area, polar, pie, surface, etc.
• Include plots as images in reports.

Studio Display
• Create reports in GlyphWorks.
• Summarize channel data in many ways on a single report page.
See GlyphWorks Worked Example #10.
Course Outline
1. Introduction
2. Using GlyphWorks: the basics
3. Importing and exporting data
4. Graphically displaying data
5. Manipulating and analyzing data
6. Editing data and automated anomaly detection
7. Combining tests, runs, or events
8. Super Glyph
9. Miscellaneous
Bas
ic
1. Using Metadata in Calculations
2. Studio Display Glyph for Reporting
3. Advanced Features Fatigue analysis and fatigue editing
Crack Growth
Frequency
Analysis of Rotating Machinery
Accelerated Testing
Optimized Testing
GlyphBuilder
Adv
ance
d
nCode GlyphWorks Training
Manipulating, Analyzing, and Editing Data
► Function Glyphs
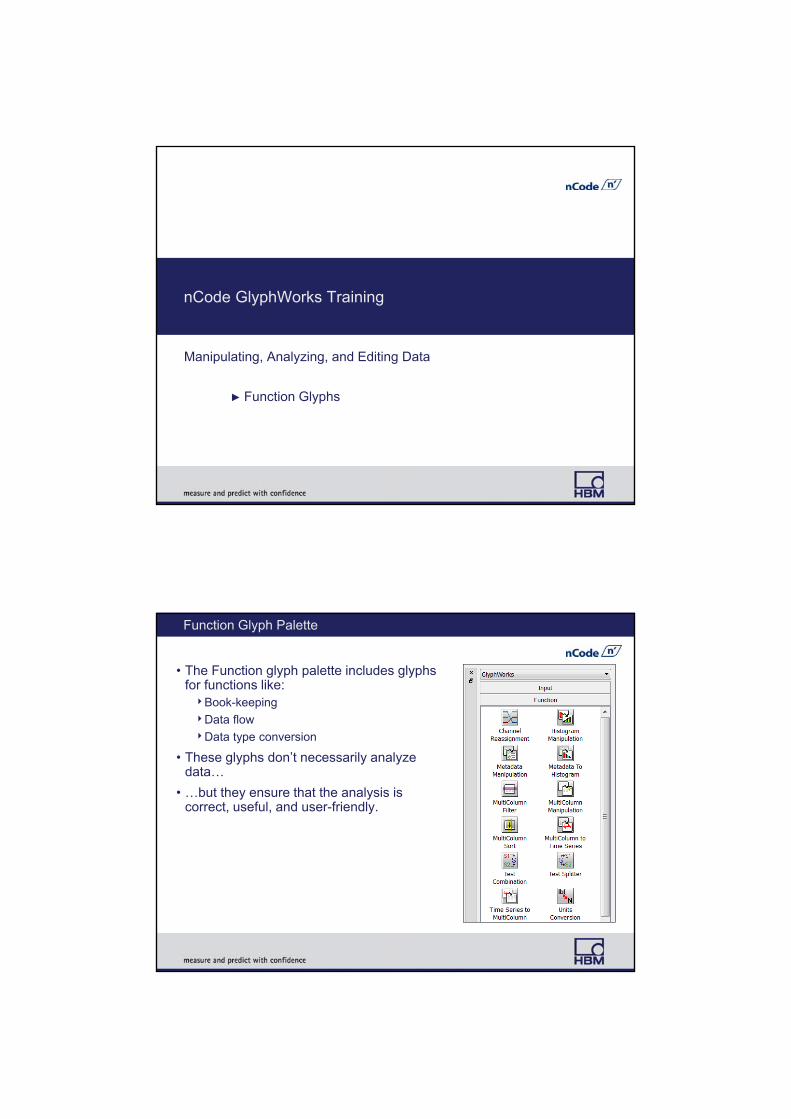
Function Glyph Palette
• The Function glyph palette includes glyphs for functions like:Book-keeping
Data flow
Data type conversion
• These glyphs don’t necessarily analyze data…
• …but they ensure that the analysis is correct, useful, and user-friendly.

Units Conversion
Units Conversion
Performs units conversions.
Uses metadata to recognize channel units and multiplies as necessary.
Units lookups are stored in \nssys\unitconv.sys and unitspell.sys.
Example: In the time domain, convert all accels to m/s2 with appropriate multipliers.
Can also be used to convert histograms like PSDs.
Channel Numbering
• Channel ReassignmentRedefine channel numbers using numbers or metadata.
Can be very helpful in ensuring all datasets have consistent channel numbering.
• For example, make sure engine speed is always channel 1.

Test Splitter
Test SplitterLogical channel recognition according
to a true/false condition
“True” channels go out of upper output pad.
“False” channels go out of lower output pad.
Pick by….
• Channel number
• Channel name
• Metadata comparison
• #max# > 5.0
• #YUnits# contains ‘strain’
• Use the right click Pick Metadataoption for easy metadata selection.
Strains
Everything else
Case Study – Test Splitter
• Analyze shock absorber temperature during field use.
• GlyphWorks identifies the required channels and analyzes each separately:Damper temperatures
GPS lat, long, speed
Find temperature channels
Find speed channel
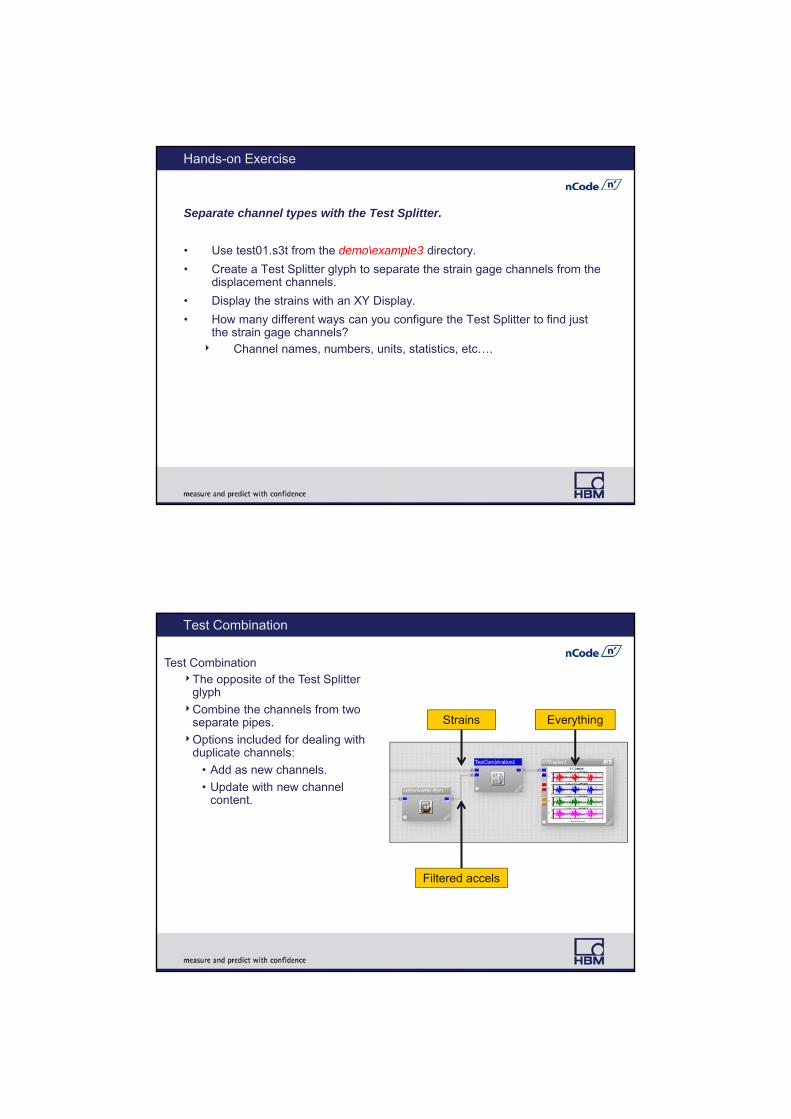
Hands-on Exercise
Separate channel types with the Test Splitter.
• Use test01.s3t from the demo\example3 directory.
• Create a Test Splitter glyph to separate the strain gage channels from the displacement channels.
• Display the strains with an XY Display.
• How many different ways can you configure the Test Splitter to find just the strain gage channels? Channel names, numbers, units, statistics, etc….
Test Combination
Strains
Filtered accels
Test CombinationThe opposite of the Test Splitter
glyph
Combine the channels from two separate pipes.
Options included for dealing with duplicate channels:
• Add as new channels.
• Update with new channel content.
Everything
nCode GlyphWorks Training
Manipulating, Analyzing, and Editing Data
► Digital Signal Processing Glyphs
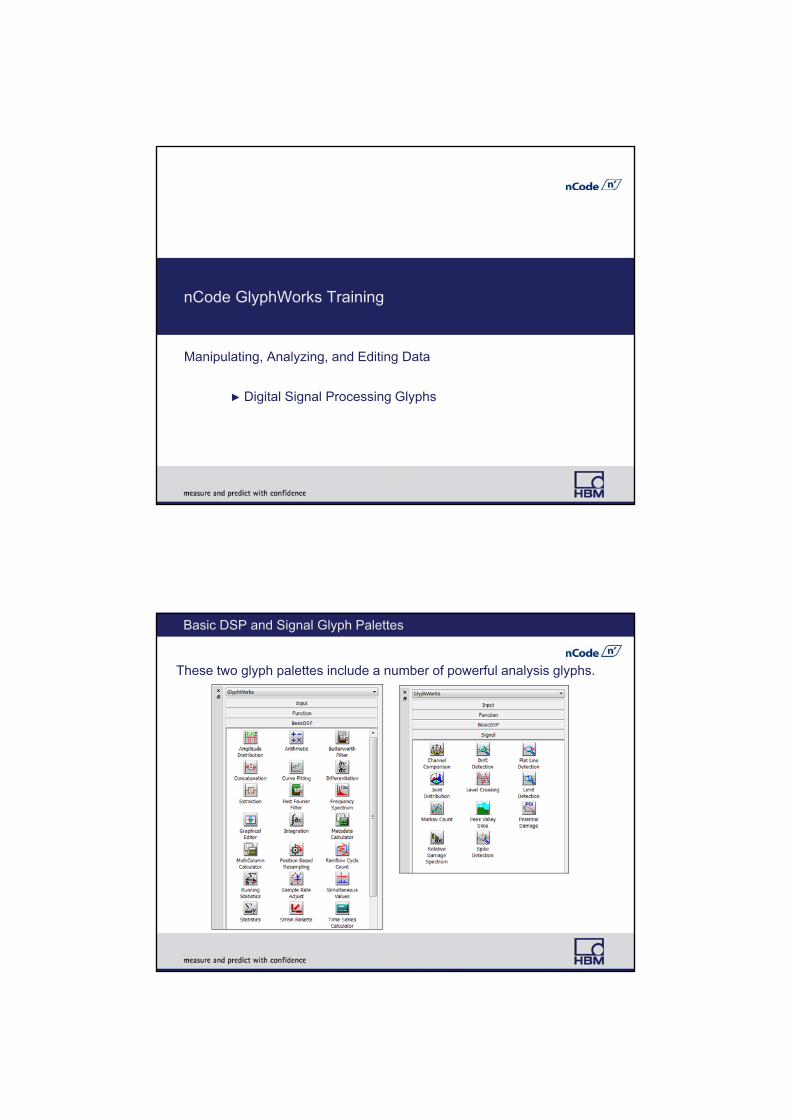
Basic DSP and Signal Glyph Palettes
These two glyph palettes include a number of powerful analysis glyphs.
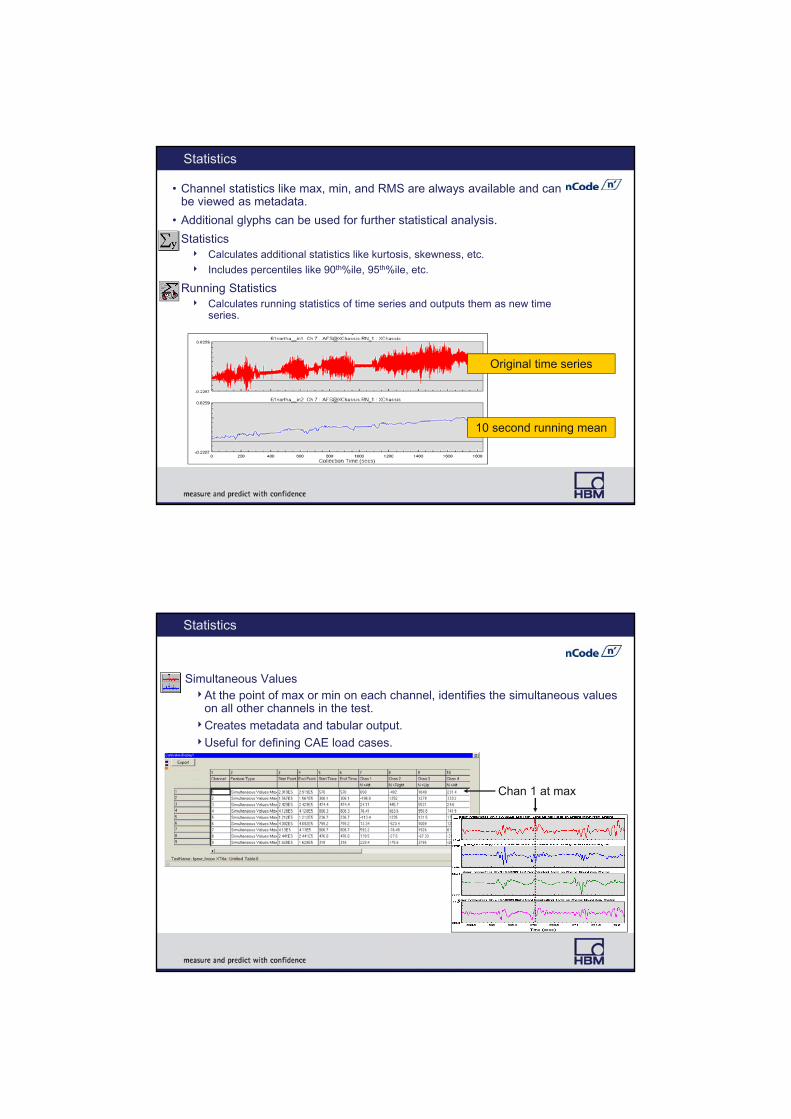
Statistics
• Channel statistics like max, min, and RMS are always available and can be viewed as metadata.
• Additional glyphs can be used for further statistical analysis.
• Statistics Calculates additional statistics like kurtosis, skewness, etc.
Includes percentiles like 90th%ile, 95th%ile, etc.
• Running Statistics Calculates running statistics of time series and outputs them as new time
series.
Original time series
10 second running mean
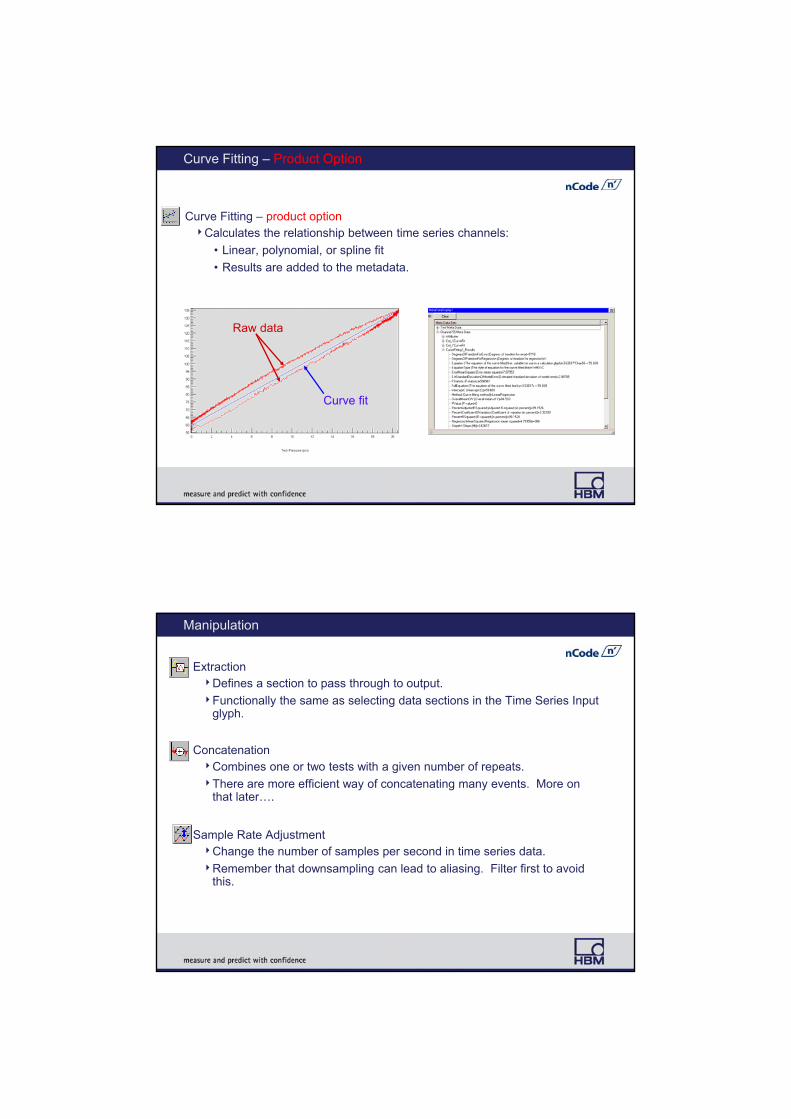
Statistics
• Simultaneous ValuesAt the point of max or min on each channel, identifies the simultaneous values
on all other channels in the test.
Creates metadata and tabular output.
Useful for defining CAE load cases.
Chan 1 at max
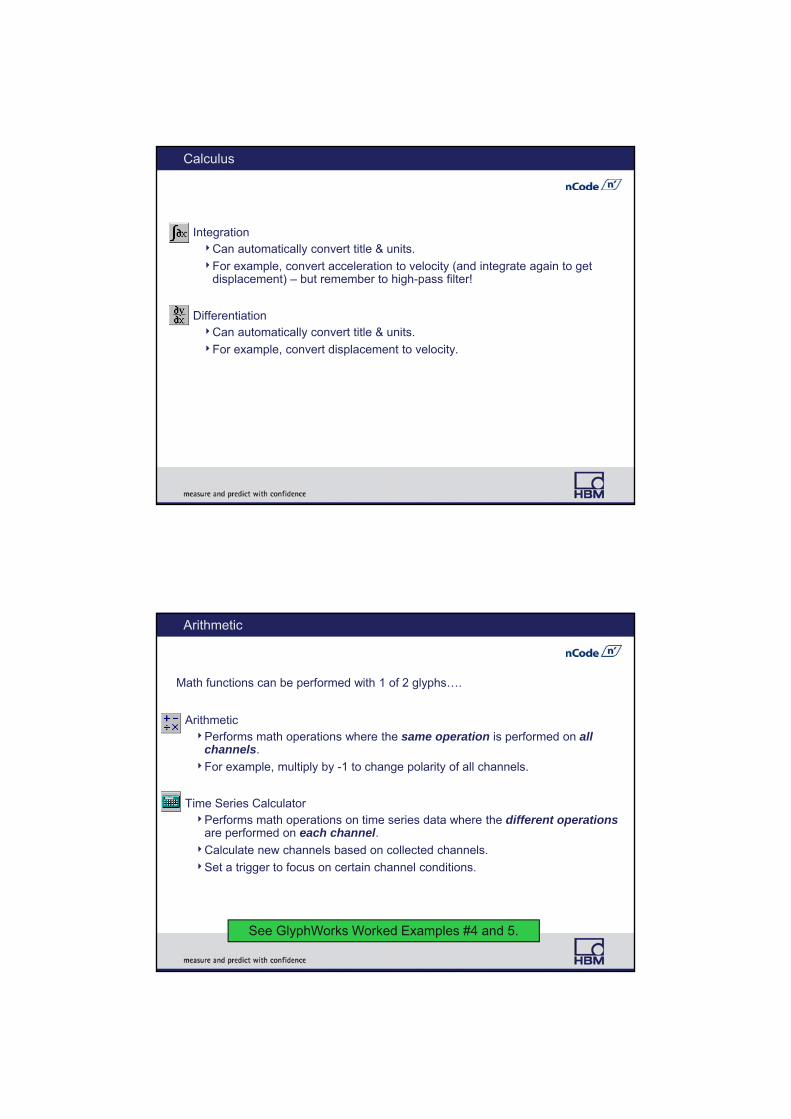
Curve Fitting – Product Option
• Curve Fitting – product optionCalculates the relationship between time series channels:
• Linear, polynomial, or spline fit
• Results are added to the metadata.
Raw data
Curve fit
Manipulation
• ExtractionDefines a section to pass through to output.
Functionally the same as selecting data sections in the Time Series Input glyph.
• ConcatenationCombines one or two tests with a given number of repeats.
There are more efficient way of concatenating many events. More on that later….
• Sample Rate AdjustmentChange the number of samples per second in time series data.
Remember that downsampling can lead to aliasing. Filter first to avoid this.
Calculus
• IntegrationCan automatically convert title & units.
For example, convert acceleration to velocity (and integrate again to get displacement) – but remember to high-pass filter!
• DifferentiationCan automatically convert title & units.
For example, convert displacement to velocity.
Arithmetic
Math functions can be performed with 1 of 2 glyphs….
• ArithmeticPerforms math operations where the same operation is performed on all
channels.
For example, multiply by -1 to change polarity of all channels.
• Time Series CalculatorPerforms math operations on time series data where the different operations
are performed on each channel.
Calculate new channels based on collected channels.
Set a trigger to focus on certain channel conditions.
See GlyphWorks Worked Examples #4 and 5.

Time Series Calculator
Channel Calculation Example
Calculate temperature difference.
Chan32 = Chan30 – Chan31
Time Series Calculator
Channel Calculation Example with IF statement
Separate a load channel into its tensile and compressive loads.
Chan23 = if(Chan22 > 0, Chan22, 0)
Many other functions are available under Pick Function.
tension
compression

Time Series Calculator
Trigger Example
Find time sections when load is tensile.
Chan22>0.0
• Creates a Feature List highlighting sections during which this condition is true.
Sections where condition is true are highlighted in XYDisplay
Feature List
Time Series Calculator
• Includes pre- and post-trigger times in seconds to modify feature length.
• Supports AND/OR logic for multiple trigger conditions.
• Powerful editing capability: Graphical Editor glyph can use feature list for automated editing.
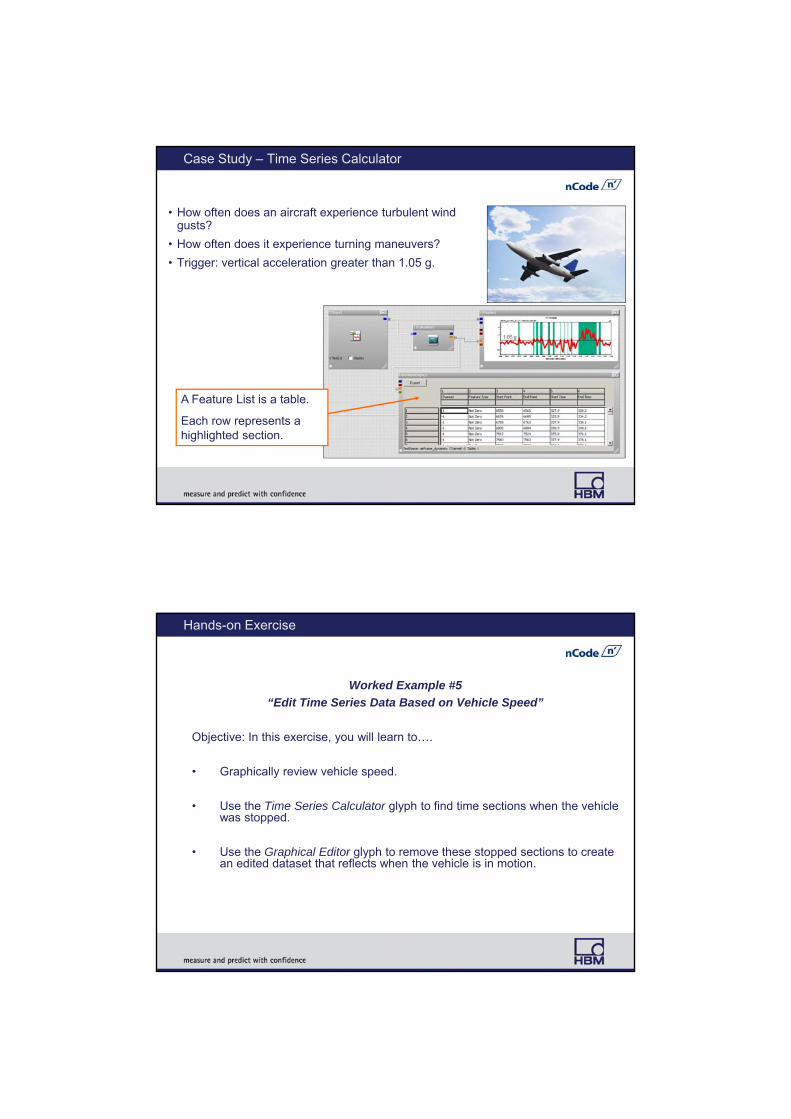
Case Study – Time Series Calculator
• How often does an aircraft experience turbulent wind gusts?
• How often does it experience turning maneuvers?
• Trigger: vertical acceleration greater than 1.05 g.
A Feature List is a table.
Each row represents a highlighted section.
Hands-on Exercise
Worked Example #5
“Edit Time Series Data Based on Vehicle Speed”
Objective: In this exercise, you will learn to….
• Graphically review vehicle speed.
• Use the Time Series Calculator glyph to find time sections when the vehicle was stopped.
• Use the Graphical Editor glyph to remove these stopped sections to create an edited dataset that reflects when the vehicle is in motion.
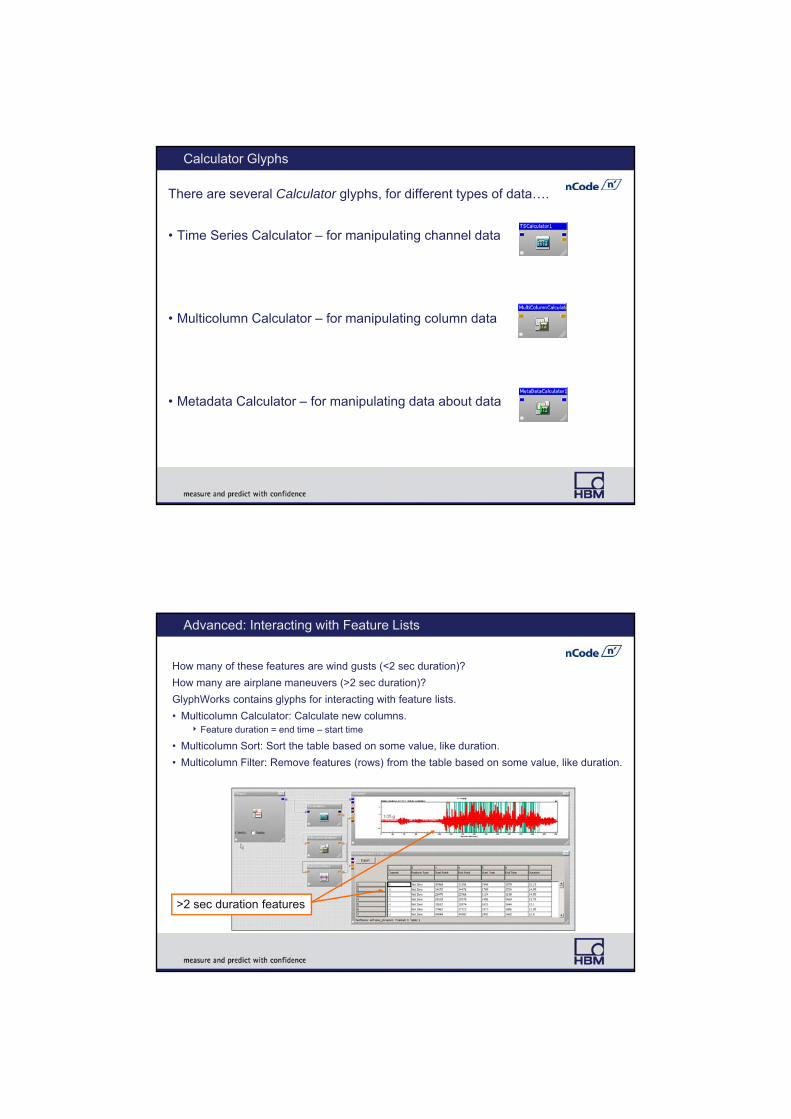
Calculator Glyphs
There are several Calculator glyphs, for different types of data….
• Time Series Calculator – for manipulating channel data
• Multicolumn Calculator – for manipulating column data
• Metadata Calculator – for manipulating data about data
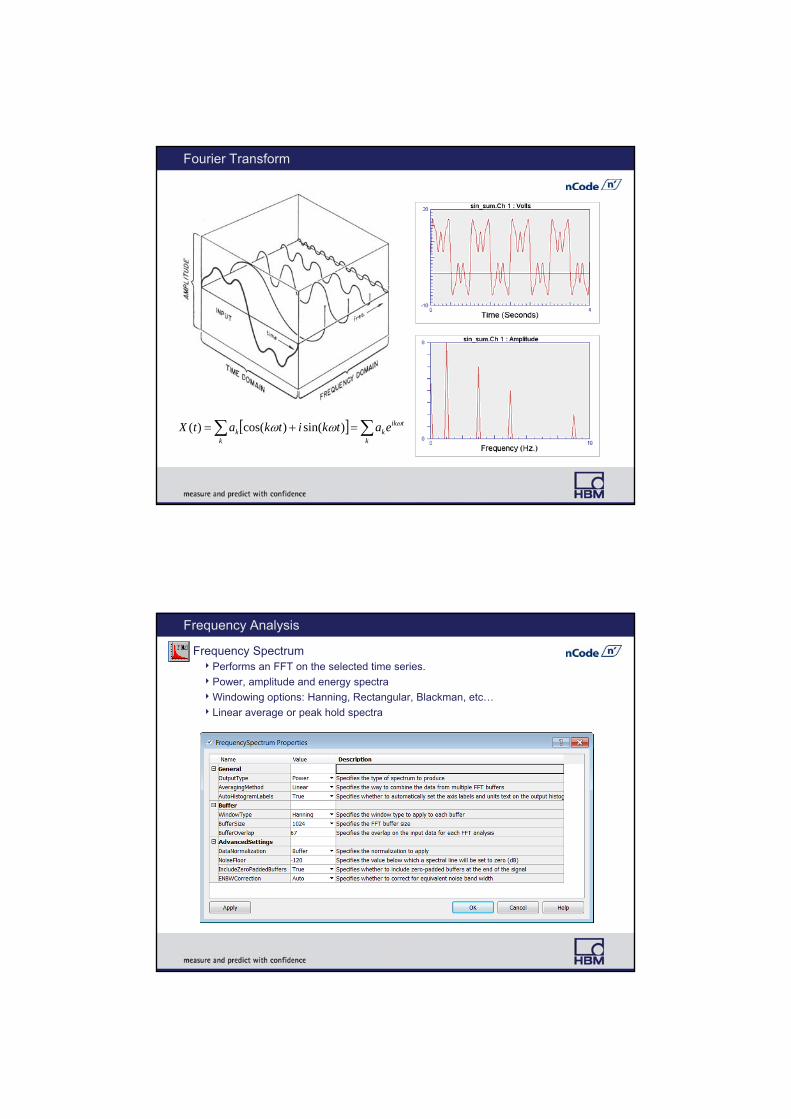
Advanced: Interacting with Feature Lists
How many of these features are wind gusts (<2 sec duration)?
How many are airplane maneuvers (>2 sec duration)?
GlyphWorks contains glyphs for interacting with feature lists.
• Multicolumn Calculator: Calculate new columns. Feature duration = end time – start time
• Multicolumn Sort: Sort the table based on some value, like duration.
• Multicolumn Filter: Remove features (rows) from the table based on some value, like duration.
>2 sec duration features
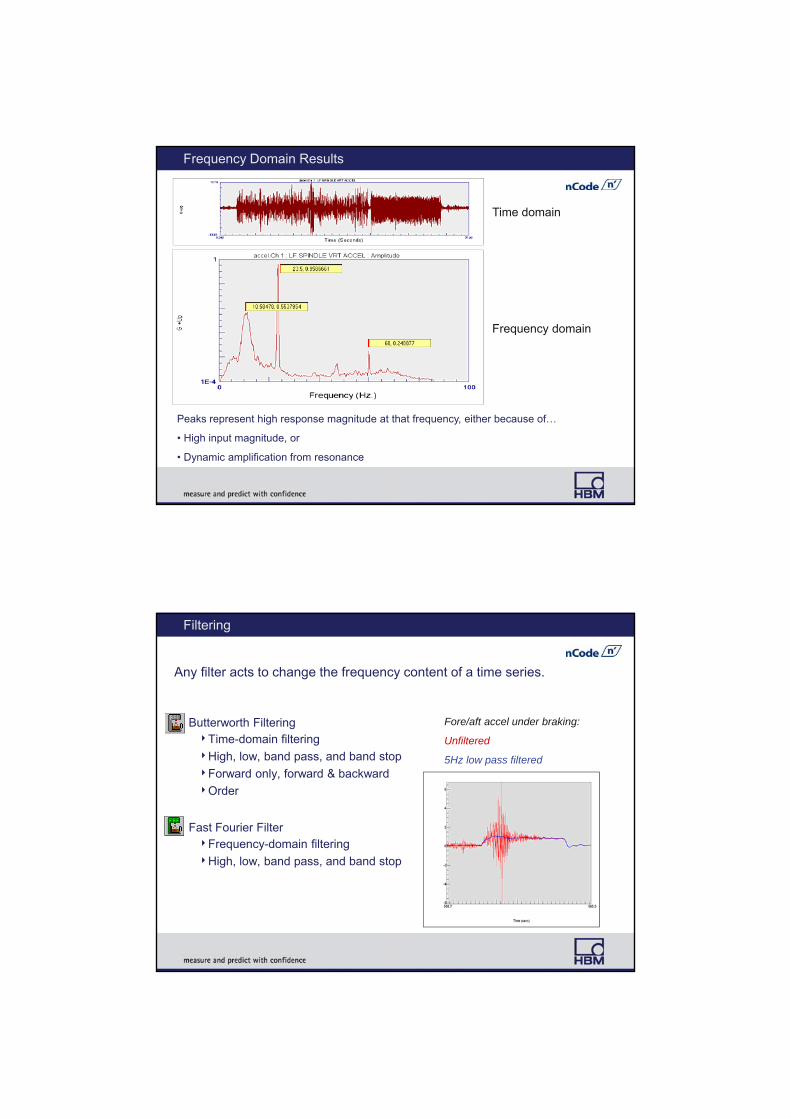
Fourier Transform
k
tikk
kk eatkitkatX )sin()cos()(
Frequency Analysis
• Frequency SpectrumPerforms an FFT on the selected time series.
Power, amplitude and energy spectra
Windowing options: Hanning, Rectangular, Blackman, etc…
Linear average or peak hold spectra
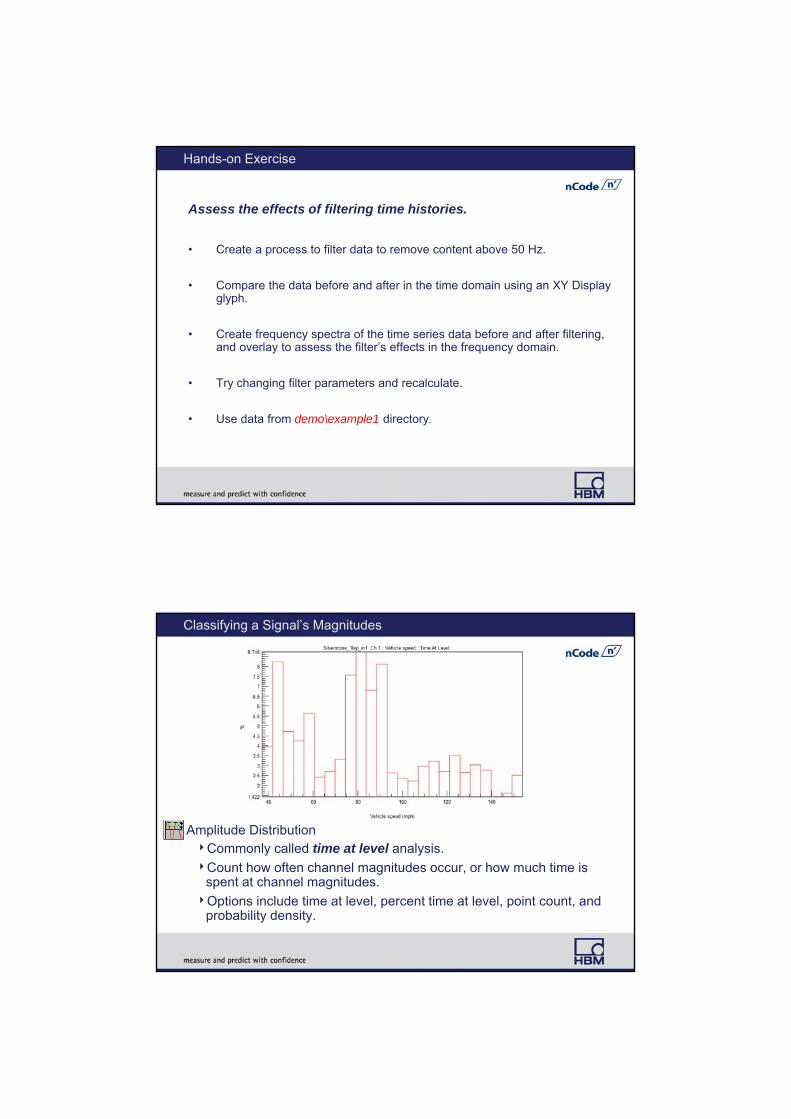
Peaks represent high response magnitude at that frequency, either because of…
• High input magnitude, or
• Dynamic amplification from resonance
Frequency Domain Results
Time domain
Frequency domain
Filtering
• Butterworth FilteringTime-domain filtering
High, low, band pass, and band stop
Forward only, forward & backward
Order
• Fast Fourier FilterFrequency-domain filtering
High, low, band pass, and band stop
Fore/aft accel under braking:
Unfiltered
5Hz low pass filtered
Any filter acts to change the frequency content of a time series.
Hands-on Exercise
Assess the effects of filtering time histories.
• Create a process to filter data to remove content above 50 Hz.
• Compare the data before and after in the time domain using an XY Display glyph.
• Create frequency spectra of the time series data before and after filtering, and overlay to assess the filter’s effects in the frequency domain.
• Try changing filter parameters and recalculate.
• Use data from demo\example1 directory.
Classifying a Signal’s Magnitudes
• Amplitude DistributionCommonly called time at level analysis.
Count how often channel magnitudes occur, or how much time is spent at channel magnitudes.
Options include time at level, percent time at level, point count, and probability density.

Hands-on Exercise
• Inside the Amplitude Distribution glyph, set:
AnalysisType = PercentTimeAtLevel
NumberOfBins = 50
• View the resulting time at level histogram with an XYDisplay. Notice that the x-axis autoscales by default.
• Change the following parameters in Amplitude Distribution and recalculate:
HistogramSizing = MinMax
HistogramMin = 0
HistogramMax = 50
• Attach a Data Values Display glyph to view the time at level results in a table.
Calculate time at level for vehicle speed.
Use the data from demo\example5 directory.
Joint Distribution
• For two channels: Time at level, point count and probability
density options • For example, time at level means the
amount of time spent where both signals are within a given range of values, in each ‘bin’ of the histogram.
• For three channels: Third signal can be used to increment the z-
axis • For example, engine torque, gear and
speed channels can be used to generate cycles per combination of torque and gear.
Time at level of a constant velocity joint’s angle vs. torque
Joint distribution means time at level with 2 independent variables instead of just 1.Results are 3D and can be viewed with the Histogram Display glyph.
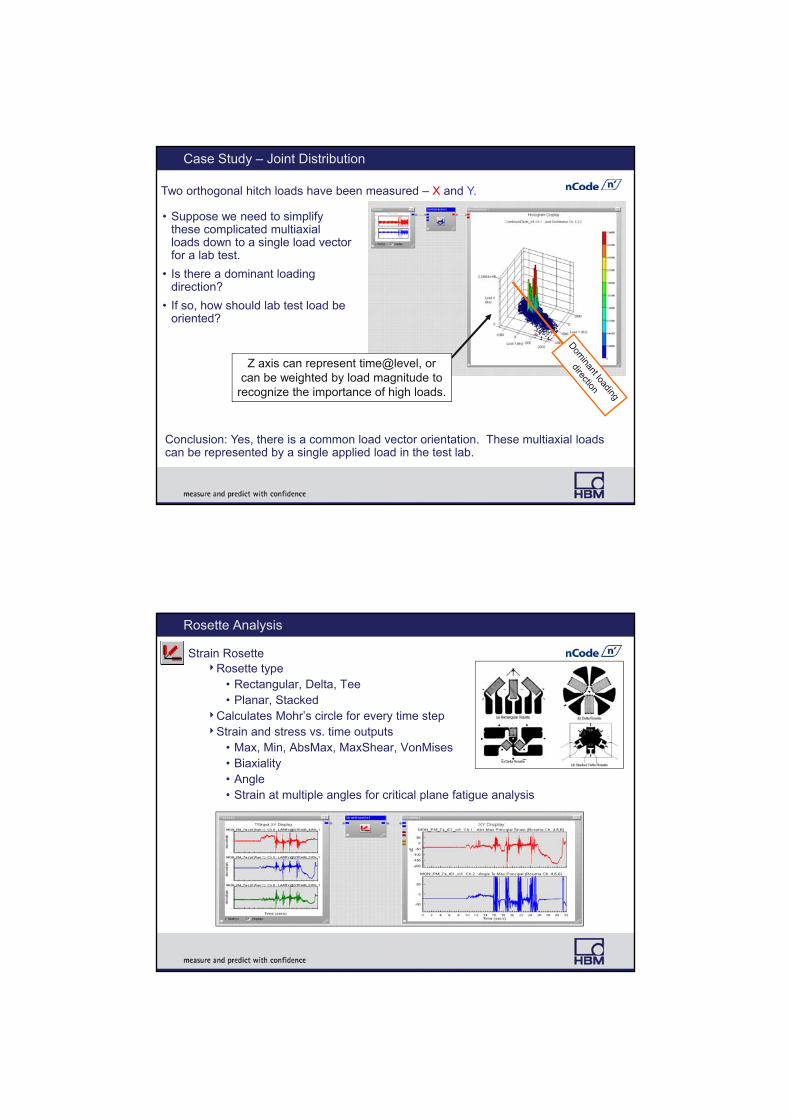
• Suppose we need to simplify these complicated multiaxial loads down to a single load vector for a lab test.
• Is there a dominant loading direction?
• If so, how should lab test load be oriented?
Case Study – Joint Distribution
Two orthogonal hitch loads have been measured – X and Y.
Z axis can represent time@level, or can be weighted by load magnitude to
recognize the importance of high loads.
Conclusion: Yes, there is a common load vector orientation. These multiaxial loads can be represented by a single applied load in the test lab.
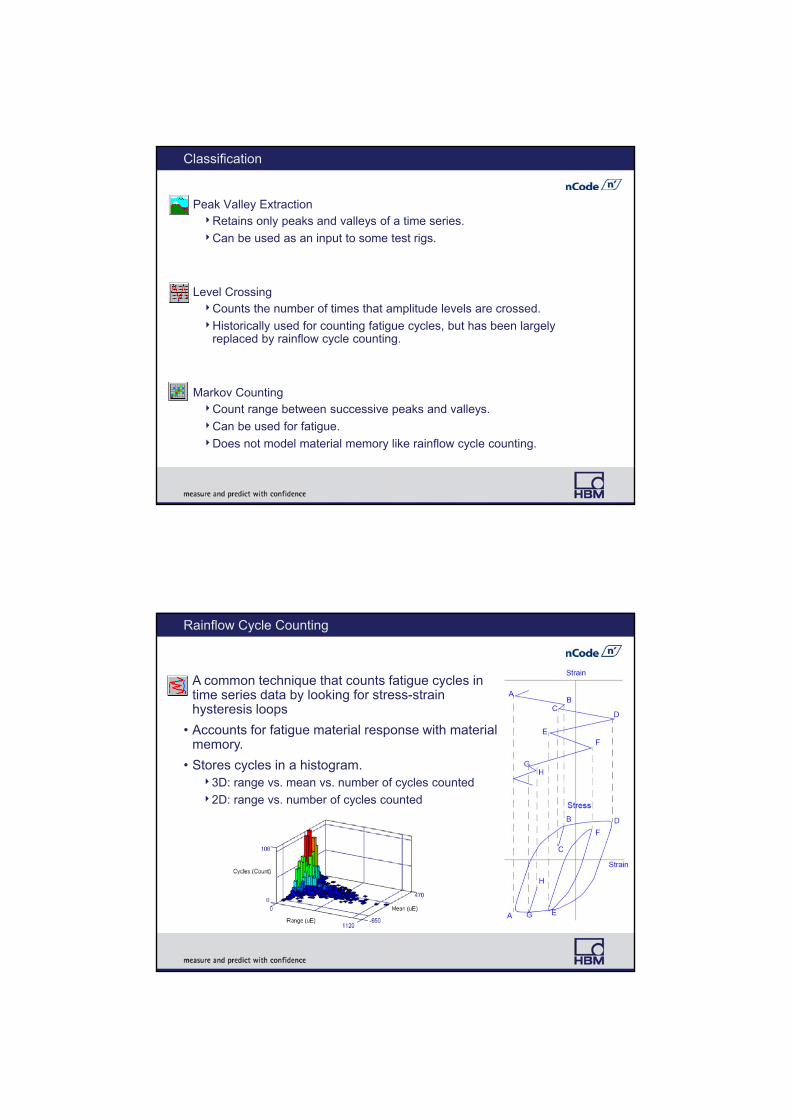
Rosette Analysis
Strain RosetteRosette type
• Rectangular, Delta, Tee• Planar, Stacked
Calculates Mohr’s circle for every time stepStrain and stress vs. time outputs
• Max, Min, AbsMax, MaxShear, VonMises• Biaxiality• Angle• Strain at multiple angles for critical plane fatigue analysis
Classification
• Peak Valley ExtractionRetains only peaks and valleys of a time series.
Can be used as an input to some test rigs.
• Level CrossingCounts the number of times that amplitude levels are crossed.
Historically used for counting fatigue cycles, but has been largely replaced by rainflow cycle counting.
• Markov CountingCount range between successive peaks and valleys.
Can be used for fatigue.
Does not model material memory like rainflow cycle counting.
• A common technique that counts fatigue cycles in time series data by looking for stress-strain hysteresis loops
• Accounts for fatigue material response with material memory.
• Stores cycles in a histogram. 3D: range vs. mean vs. number of cycles counted
2D: range vs. number of cycles counted
Rainflow Cycle Counting

Fatigue Comparison
• Relative DamagePerforms a relative damage calculation on all channels using a simple S-N curve.
Compare two different sets of load-time histories in fatigue damage sense.
Which is more severe?
Lo
ad,
etc
slope
cycles
Damage A
Damage BDA:DB
See GlyphWorks Worked Example #19 and the standard process CompareRelativeDamage.flo.
Hands-on Exercise
Compare the relative damage content of two separate passes of a single proving ground event.
• From the File menu –Standard Processes, open the standard process Compare Relative Damage.
• Use \example5\rough_road_2passes.rsp for both input glyphs.
• Select pass 1 as a marked section for TSInput1.
• Select pass 2 as a marked section for TSInput2.

Fatigue Comparison
• Potential Damage IntensityVector combinations of orthogonal loads (Fx, Fy, etc.)
• Represent multiaxial load effects independent of component geometry.
Assess effects of multiaxial loads in fatigue damage sense.
Compare different events’ damage under multiaxial loading.
Lo
ad,
etc
slope
cycles
F = f(Fx, Fy)Fx
Fy
Damage = f(Fx, Fy, )
Relative Damage Spectrum
119
Multi-channel time signal of acceleration at wheel hub
• Calculates relative fatigue damage in discrete frequency bands.
• Understand how fatigue damage depends on frequency.

Course Outline
1. Introduction
2. Using GlyphWorks: the basics
3. Importing and exporting data
4. Graphically displaying data
5. Manipulating and analyzing data
6. Editing data and automated anomaly detection
7. Combining tests, runs, or events
8. Super Glyph
9. Miscellaneous
Bas
ic
1. Using Metadata in Calculations
2. Studio Display Glyph for Reporting
3. Advanced Features Fatigue analysis and fatigue editing
Crack Growth
Frequency
Analysis of Rotating Machinery
Accelerated Testing
Optimized Testing
GlyphBuilder
Adv
ance
d
nCode GlyphWorks Training
Editing Data and Automated Anomaly Detection

Examples of Data Anomalies
Graphical Editing
Time series data can be edited with the Graphical Editor glyph.
Editing can be done…
Remove drift
Fix spikes
Delete dead time
See GlyphWorks Worked Example #3.
• When the process is run: sections are color coded blue
• Interactively: sections are color coded yellow
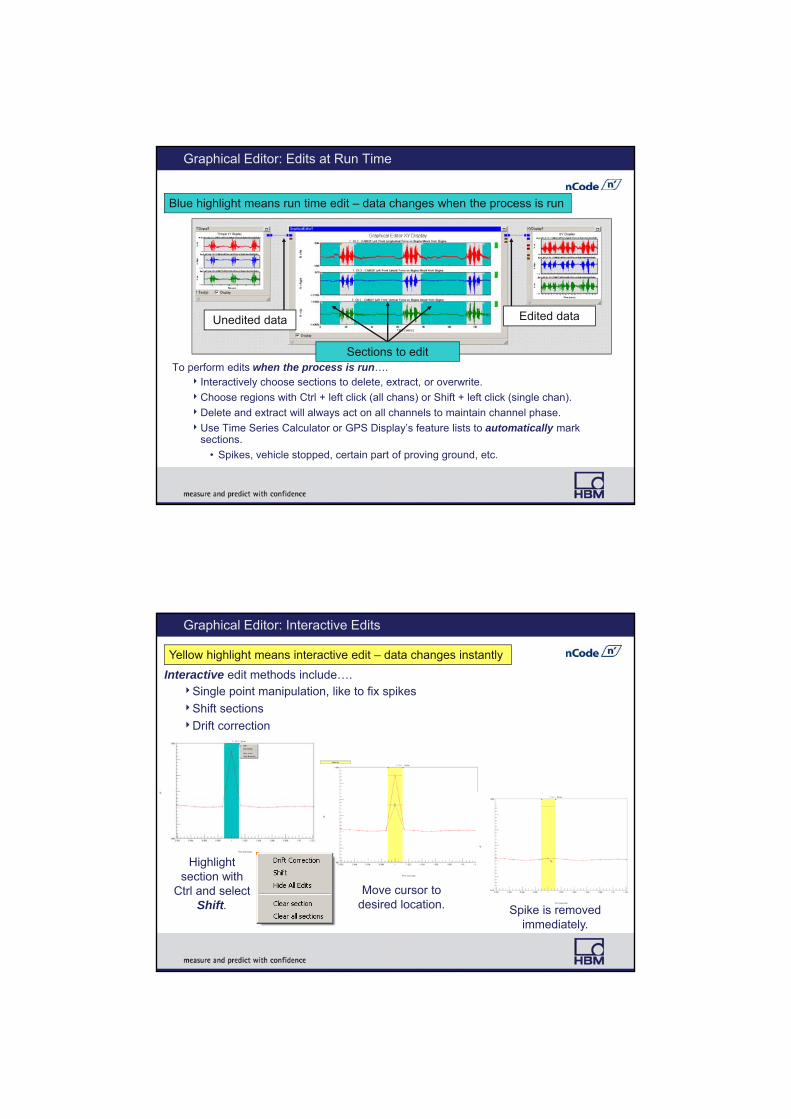
Graphical Editor: Edits at Run Time
To perform edits when the process is run…. Interactively choose sections to delete, extract, or overwrite.
Choose regions with Ctrl + left click (all chans) or Shift + left click (single chan).
Delete and extract will always act on all channels to maintain channel phase.
Use Time Series Calculator or GPS Display’s feature lists to automatically mark sections.
• Spikes, vehicle stopped, certain part of proving ground, etc.
Sections to edit
Edited dataUnedited data
Blue highlight means run time edit – data changes when the process is run
Graphical Editor: Interactive Edits
Interactive edit methods include….Single point manipulation, like to fix spikes
Shift sections
Drift correction
Highlight section with
Ctrl and select Shift.
Move cursor to desired location. Spike is removed
immediately.
Yellow highlight means interactive edit – data changes instantly

Hands-on Exercise
Worked Example #3
“Graphical Editing and Metadata”
Objective: in this exercise, you will learn to….
• Review time series data graphically.
• Manually edit sections of the time series to remove “bad data”.
• Review metadata that describes the time series.
Automated Anomaly Detection
• GlyphWorks includes some glyphs for automatic anomaly detection:Spike detection
Flat-line detection
Drift detection
Limit detection
Channel comparison
• Very powerful tools for quickly identifying problems or known features in time series data Highlights potential problems.
Don’t spend time looking at good data.

Automated Spike Detection and Correction Example
Feature list
Graphically displays and smoothes spikes
• Spike Detection glyph finds spikes and creates a Feature List indicating when these spikes occurred.
• This Feature List can be used by the Graphical Editor glyph.
Features shown highlighted
See GlyphWorks Worked Example #6.
Interactive Run Mode
Allows the user to make interactive selections while using an automated feature detection algorithm.
Example: Spike Detection glyph finds spikes, and user decides which possible spikes really are before any editing is done.
Pause at this glyph.
Colored background means interactive mode is on.
Hands-on Exercise
Worked Example #6
“Finding and Removing Spikes in Time Series Data”
Objective: In this exercise, you will learn to….
• Create a GlyphWorks process that automatically identifies spikes in time series data.
• Review results of this automated spike detection.
• Remove spikes with the Graphical Editor glyph.
Course Outline
1. Introduction
2. Using GlyphWorks: the basics
3. Importing and exporting data
4. Graphically displaying data
5. Manipulating and analyzing data
6. Editing data and automated anomaly detection
7. Combining tests, runs, or events
8. Super Glyph
9. Miscellaneous
Bas
ic
1. Using Metadata in Calculations
2. Studio Display Glyph for Reporting
3. Advanced Features Fatigue analysis and fatigue editing
Crack Growth
Frequency
Analysis of Rotating Machinery
Accelerated Testing
Optimized Testing
GlyphBuilder
Adv
ance
d
nCode GlyphWorks Training
Combining Tests, Events, or Runs
Combining Tests
Sometimes it’s necessary to calculate results for combinations of time series tests.
Example: What’s the cyclic content of 4 different use cases, each with different repeats or exposure times?
There are 3 methods of combining tests in GlyphWorks:1. Time Series Input or Histogram Input glyph: CombineAllTests = True2. ScheduleCreate app3. Concatenation glyph
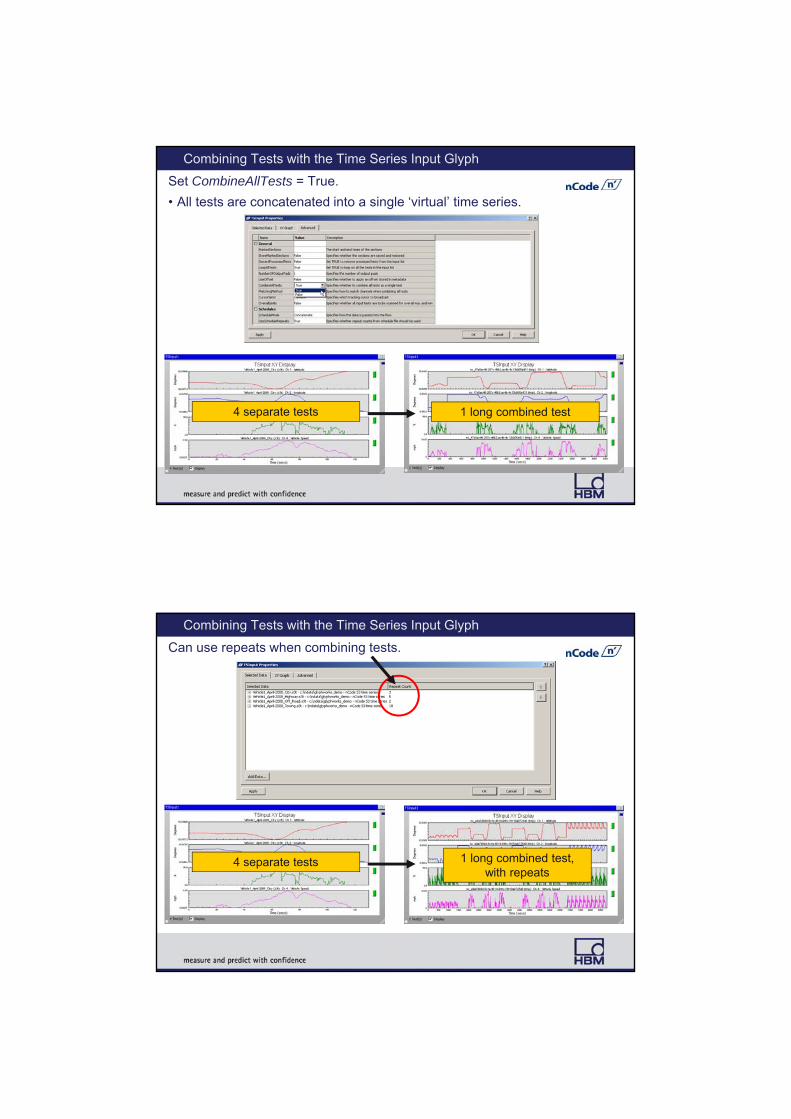
Combining Tests with the Time Series Input Glyph
Set CombineAllTests = True.
• All tests are concatenated into a single ‘virtual’ time series.
1 long combined test4 separate tests
Combining Tests with the Time Series Input Glyph
Can use repeats when combining tests.
1 long combined test4 separate tests 1 long combined test,
with repeats
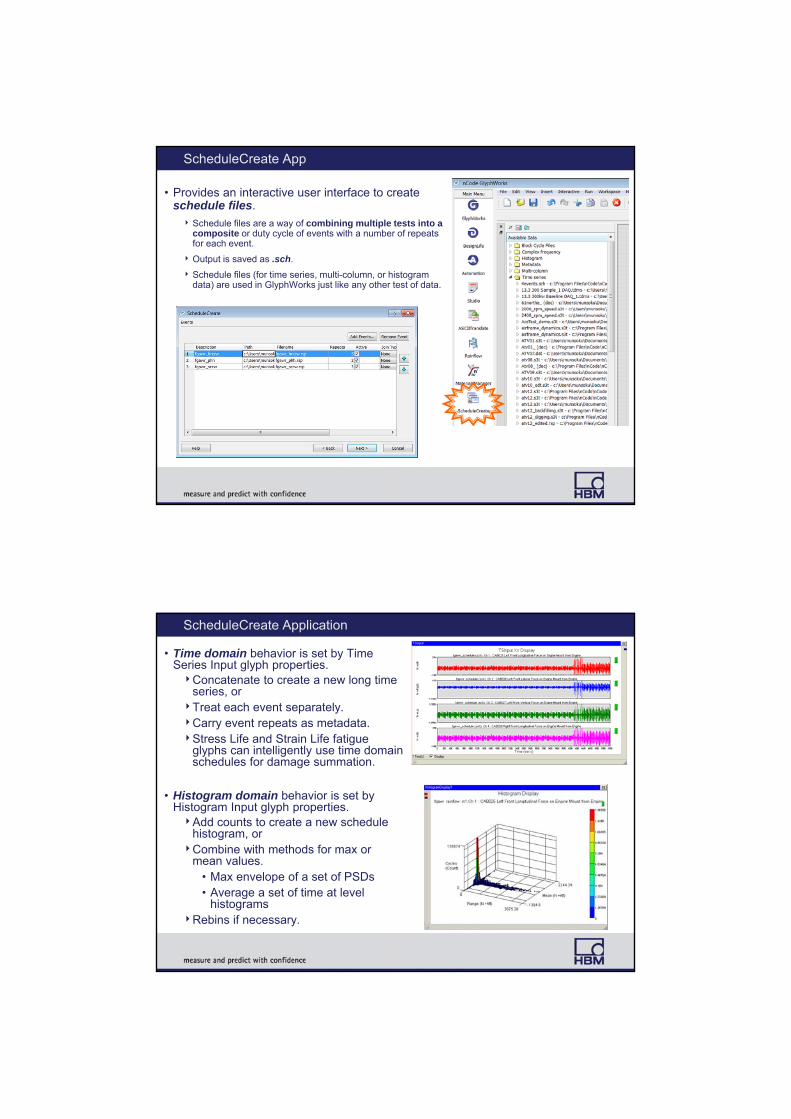
ScheduleCreate App
• Provides an interactive user interface to create schedule files.
Schedule files are a way of combining multiple tests into a composite or duty cycle of events with a number of repeats for each event.
Output is saved as .sch.
Schedule files (for time series, multi-column, or histogram data) are used in GlyphWorks just like any other test of data.
ScheduleCreate Application
• Time domain behavior is set by Time Series Input glyph properties.Concatenate to create a new long time
series, orTreat each event separately.Carry event repeats as metadata.Stress Life and Strain Life fatigue
glyphs can intelligently use time domain schedules for damage summation.
• Histogram domain behavior is set by Histogram Input glyph properties.Add counts to create a new schedule
histogram, orCombine with methods for max or
mean values.• Max envelope of a set of PSDs • Average a set of time at level
histogramsRebins if necessary.
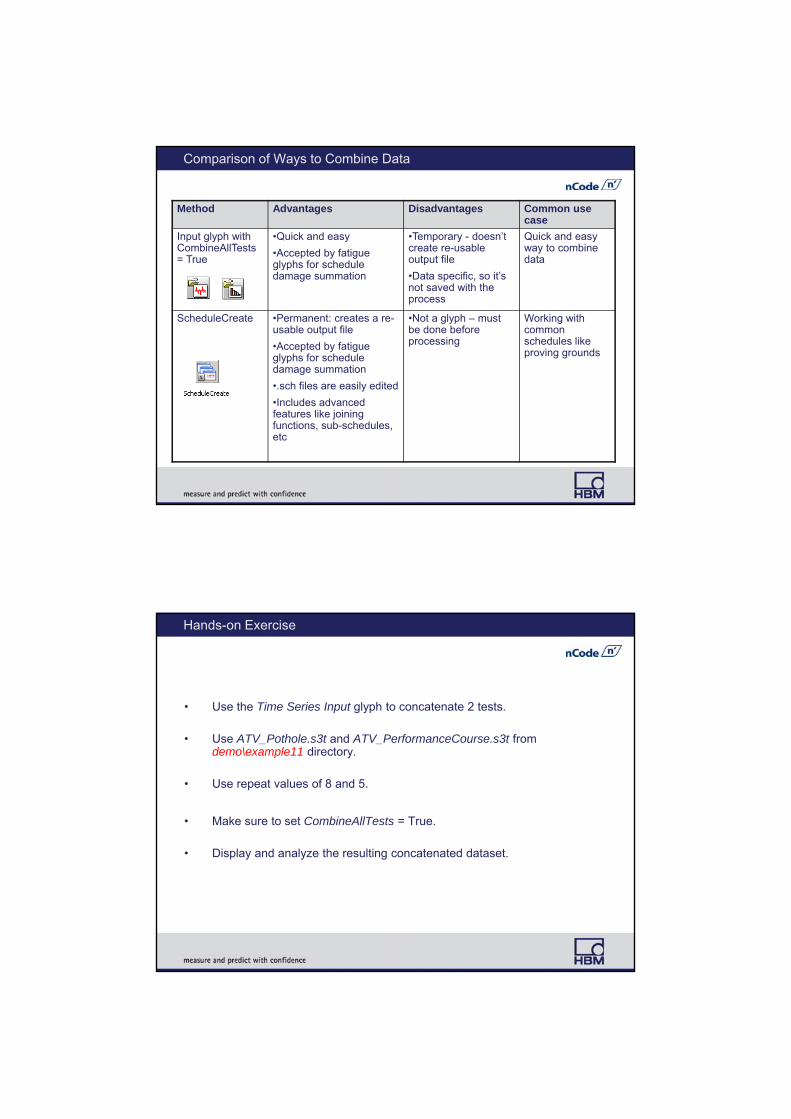
Comparison of Ways to Combine Data
Method Advantages Disadvantages Common use case
Input glyph with CombineAllTests= True
•Quick and easy
•Accepted by fatigue glyphs for schedule damage summation
•Temporary - doesn’t create re-usable output file
•Data specific, so it’s not saved with the process
Quick and easy way to combine data
ScheduleCreate •Permanent: creates a re-usable output file
•Accepted by fatigue glyphs for schedule damage summation
•.sch files are easily edited
•Includes advanced features like joining functions, sub-schedules, etc
•Not a glyph – must be done before processing
Working with common schedules like proving grounds
Hands-on Exercise
• Use the Time Series Input glyph to concatenate 2 tests.
• Use ATV_Pothole.s3t and ATV_PerformanceCourse.s3t from demo\example11 directory.
• Use repeat values of 8 and 5.
• Make sure to set CombineAllTests = True.
• Display and analyze the resulting concatenated dataset.

Course Outline
1. Introduction
2. Using GlyphWorks: the basics
3. Importing and exporting data
4. Graphically displaying data
5. Manipulating and analyzing data
6. Editing data and automated anomaly detection
7. Combining tests, runs, or events
8. Super Glyph
9. Miscellaneous
Bas
ic
1. Using Metadata in Calculations
2. Studio Display Glyph for Reporting
3. Advanced Features Fatigue analysis and fatigue editing
Crack Growth
Frequency
Analysis of Rotating Machinery
Accelerated Testing
Optimized Testing
GlyphBuilder
Adv
ance
d
nCode GlyphWorks Training
Super Glyph

Super Glyph
• Multiple glyphs to be contained within a single glyph
• The contents of the Super Glyph can either be displayed or hidden to form a ‘black box’ glyph.
• Super Glyphs can be saved onto the Glyph Palette for later re-use in other processes, like a subroutine.
• Super Glyphs can be secured with password protection.
Example Super Glyph process for fatigue editing
Step 1: Select glyphs to convert to a Super Glyph.
Step 2: Select one of three Super Glyph create toolbar options.
Step 3: Super Glyph is created.
Maximize the Super Glyph to see or edit its contents.
Creating a Super Glyph
Toolbar buttons for easy creation of Super Glyphs:
Replace with Super Glyph
Copy to Super Glyph
Replaces selected glyphs with a Looping Super Glyph
Unwrap Super Glyph
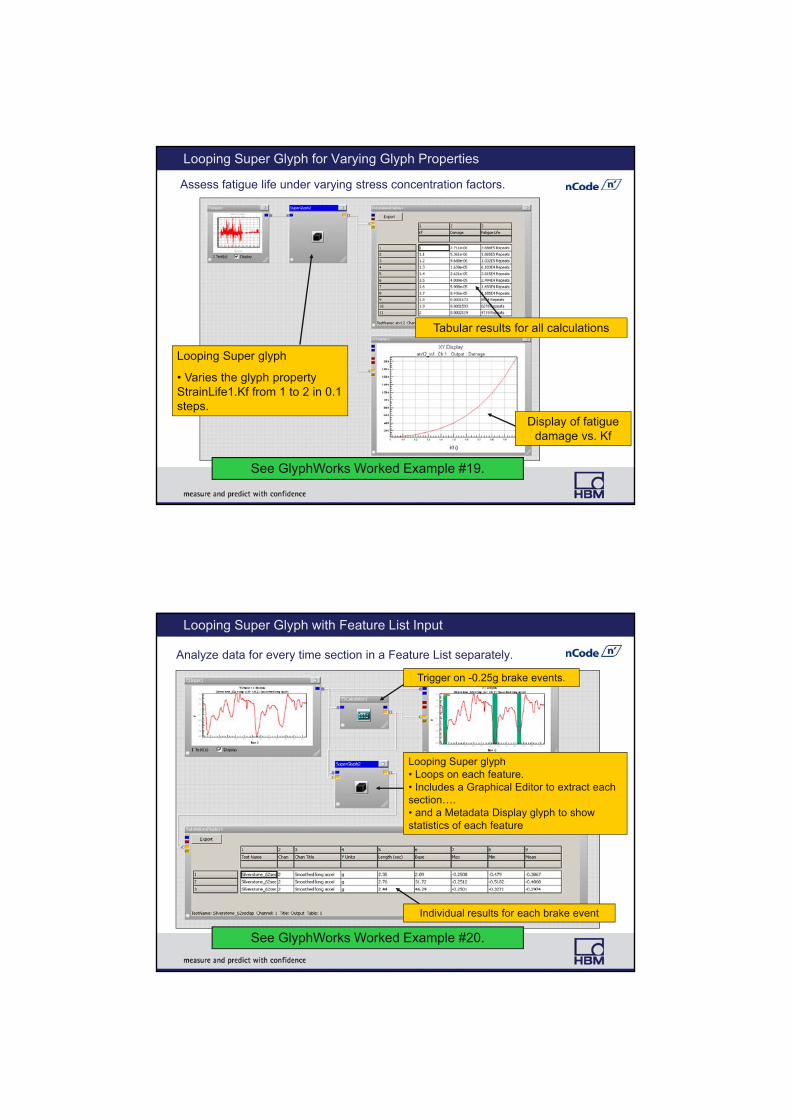
Looping Super Glyph for Varying Glyph Properties
Assess fatigue life under varying stress concentration factors.
Looping Super glyph
• Varies the glyph property StrainLife1.Kf from 1 to 2 in 0.1 steps.
Display of fatigue damage vs. Kf
Tabular results for all calculations
See GlyphWorks Worked Example #19.
Looping Super Glyph with Feature List Input
Analyze data for every time section in a Feature List separately.
Trigger on -0.25g brake events.
Looping Super glyph • Loops on each feature.• Includes a Graphical Editor to extract each section….• and a Metadata Display glyph to show statistics of each feature
Individual results for each brake event
See GlyphWorks Worked Example #20.
Course Outline
1. Introduction
2. Using GlyphWorks: the basics
3. Importing and exporting data
4. Graphically displaying data
5. Manipulating and analyzing data
6. Editing data and automated anomaly detection
7. Combining tests, runs, or events
8. Super Glyph
9. Miscellaneous
Bas
ic
1. Using Metadata in Calculations
2. Studio Display Glyph for Reporting
3. Advanced Features Fatigue analysis and fatigue editing
Crack Growth
Frequency
Analysis of Rotating Machinery
Accelerated Testing
Optimized Testing
GlyphBuilder
Adv
ance
d
nCode GlyphWorks Training
Miscellaneous

Standard and Custom Processes
Provide hotlinks to GlyphWorks analysis processes.
Standard Processes are provided with the nCode installation.
• Examples of GlyphWorks functionality
• One-click access to example processes
Custom Processes are created by the user.
• One-click access to commonly used processes
• Can even share processes across a network
• Content is provided via CustomProcessMenu.sys
• See user guide for more information on setupSearch for ‘custom process’ in the GlyphWorks
User Guide
Saving Glyphs
• Any glyph can be saved to any glyph palette. This enables user-configured glyphs like “My PSD” to be saved for easy re-use.
• Create your own glyphs and reuse or share!
Save your own glyph!

Multiple Workspaces
• Keeps multiple related tasks together in one GlyphWorks process.
• Workspaces can be linked: One workspace’s output glyph can feed another workspace’s input glyph.
Workspace for fatigue calcsWorkspace for editing raw data
Multiple Views
• Store multiple views of the workspace – for example, the analysis glyphs vs. the results histograms, as shown below.
• Go right to results by clicking on the View tab.
View for resultsView for analysis
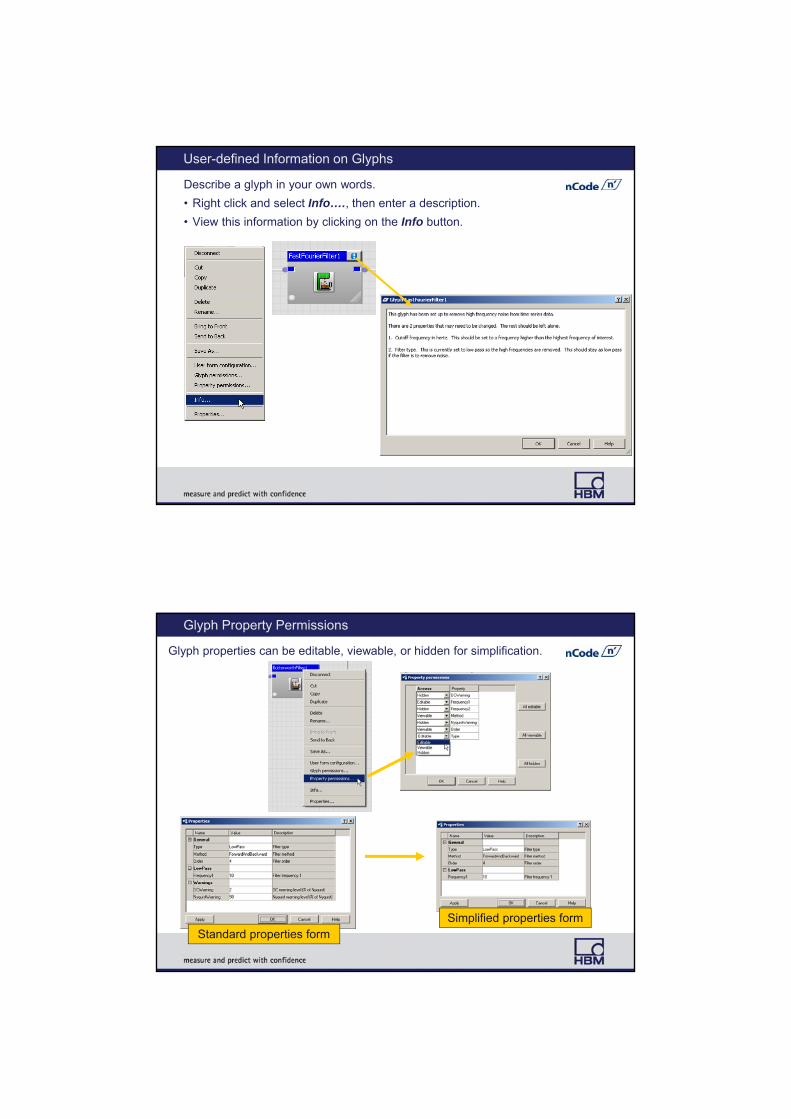
User-defined Information on Glyphs
Describe a glyph in your own words.
• Right click and select Info…., then enter a description.
• View this information by clicking on the Info button.
Glyph Property Permissions
Glyph properties can be editable, viewable, or hidden for simplification.
Standard properties formSimplified properties form

User Forms
Replace workspace with simplified user input form.Ask only required questions up front and hide
complexity of process behind the form.
Workspace is replaced by this form when the
process is run.
Select which glyph properties will be on the
user form.
Disabling Data Flow
• Individual pipes can be disabled to control data flow.
• Example: Don’t write out new time series until viewing before and after displays.
Highlighted pipe indicates that it’s been disabled.

Preferences System
• Glyph preferences set default glyph properties.
• FileFormat preferences control how certain data files are readExample: how are SIF files’ burst data read? Separate, concatenated, etc….
• Language settings are found under \Libraries\General\Language
• Preferences are set on a global (for networked installations) or home (user) basis.
Audit Capability
• The detail of each GlyphWorks run can be written to an ASCII report file as an audit of the analysis process.
• The audit records details such as:
Glyphs and property settings
Glyph versions
Input and output data
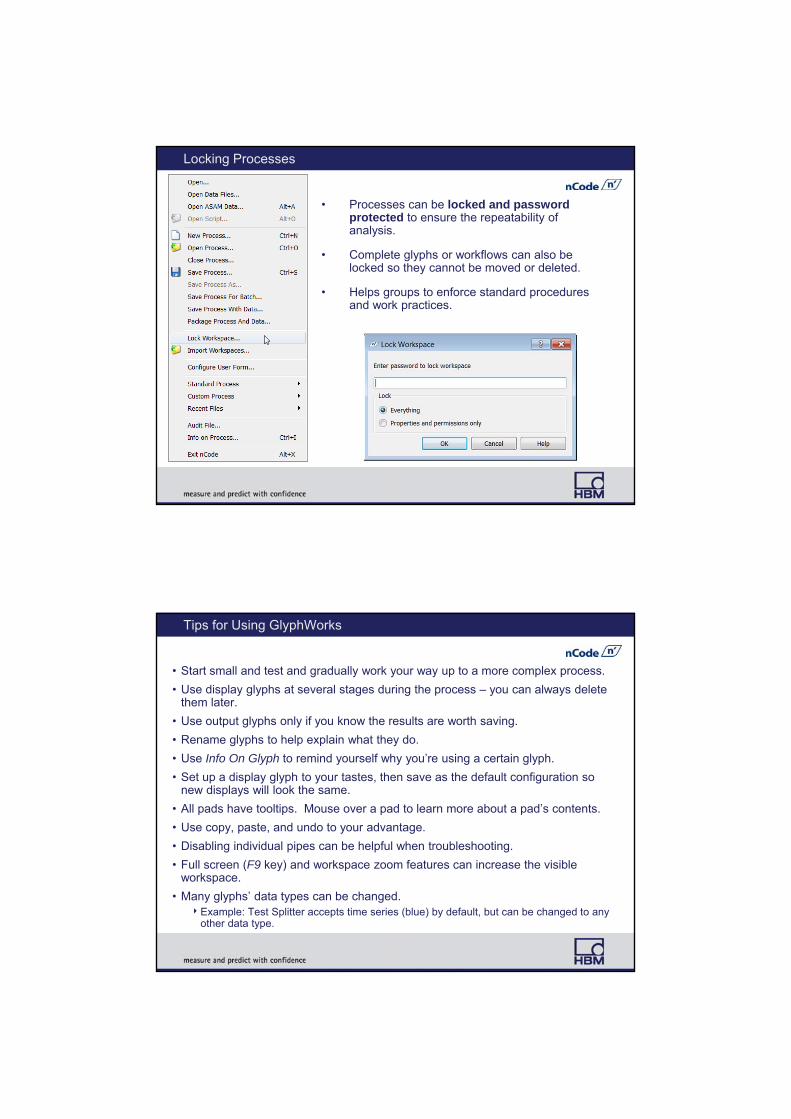
Locking Processes
• Processes can be locked and password protected to ensure the repeatability of analysis.
• Complete glyphs or workflows can also be locked so they cannot be moved or deleted.
• Helps groups to enforce standard procedures and work practices.
Tips for Using GlyphWorks
• Start small and test and gradually work your way up to a more complex process.
• Use display glyphs at several stages during the process – you can always delete them later.
• Use output glyphs only if you know the results are worth saving.
• Rename glyphs to help explain what they do.
• Use Info On Glyph to remind yourself why you’re using a certain glyph.
• Set up a display glyph to your tastes, then save as the default configuration so new displays will look the same.
• All pads have tooltips. Mouse over a pad to learn more about a pad’s contents.
• Use copy, paste, and undo to your advantage.
• Disabling individual pipes can be helpful when troubleshooting.
• Full screen (F9 key) and workspace zoom features can increase the visible workspace.
• Many glyphs’ data types can be changed.Example: Test Splitter accepts time series (blue) by default, but can be changed to any
other data type.
Course Outline
1. Introduction
2. Using GlyphWorks: the basics
3. Importing and exporting data
4. Graphically displaying data
5. Manipulating and analyzing data
6. Editing data and automated anomaly detection
7. Combining tests, runs, or events
8. Super Glyph
9. Miscellaneous
Bas
ic
1. Using Metadata in Calculations
2. Studio Display Glyph for Reporting
3. Advanced Features Fatigue analysis and fatigue editing
Crack Growth
Frequency
Analysis of Rotating Machinery
Accelerated Testing
Optimized Testing
GlyphBuilder
Adv
ance
d
nCode GlyphWorks Training
Using Metadata in Calculations

Using Metadata in Glyph Properties
Metadata can be used as glyph properties.
• Available metadata are shown by picklist.
• Example: Arithmetic glyph can remove the mean from each channel by using #Mean#.
• Channel references are not needed, but can be used.
#Mean# = mean of every channel separately
#Chan1.Mean# = mean of channel 1
Metadata set name (for example, Attributes) is not needed:
#Attributes.Mean# is the same as #Mean#
Any metadata can be used, like:
#Chan1.Rainflow1_Results.NumCycles#
Metadata are case INSENSITIVE and shown in mixed case just to be easier to read.
Hands-on Exercise
• Using rough_road_2passes.rsp data from demo\example5directory, create a process to remove the mean from each strain gage channel.
Test Splitter to find strain channels based on a channel title containing ‘strain’, or y units equal to ‘microstrain’
Arithmetic glyph to subtract #Mean# from each channel
• Display the results before and after this mean removal. How are they different?
• What does this difference mean in an engineering sense?
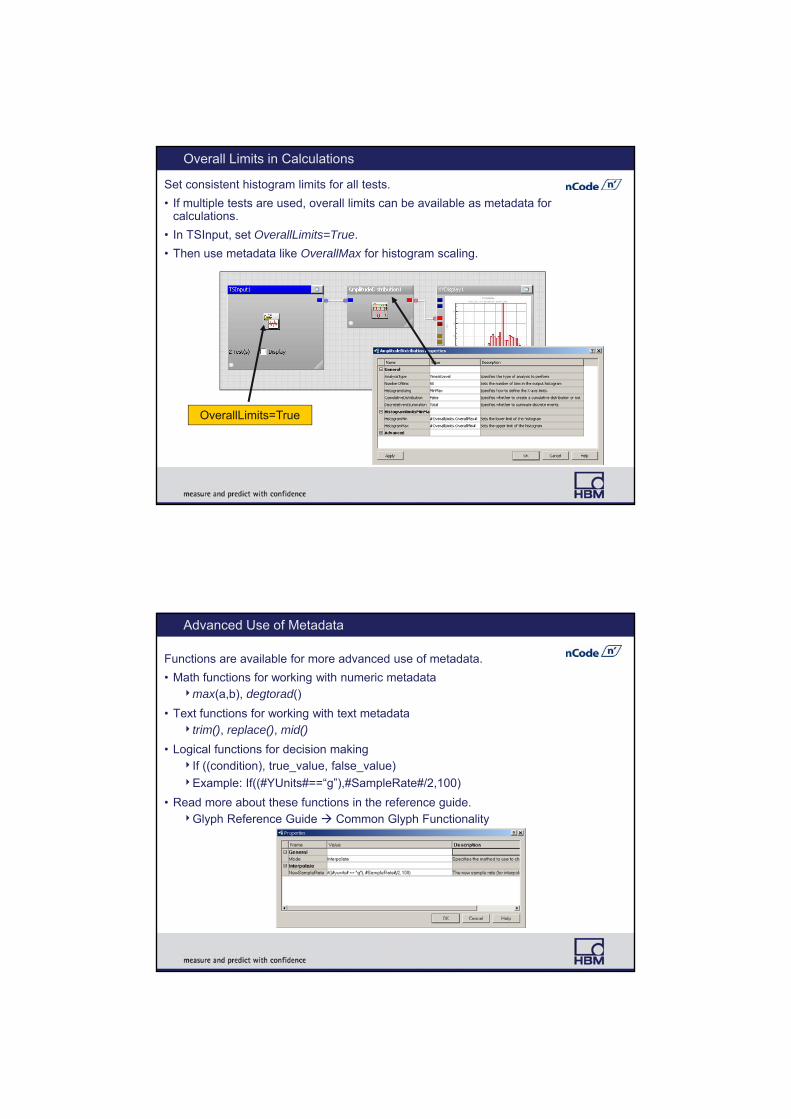
Overall Limits in Calculations
Set consistent histogram limits for all tests.
• If multiple tests are used, overall limits can be available as metadata for calculations.
• In TSInput, set OverallLimits=True.
• Then use metadata like OverallMax for histogram scaling.
OverallLimits=True
Advanced Use of Metadata
Functions are available for more advanced use of metadata.
• Math functions for working with numeric metadatamax(a,b), degtorad()
• Text functions for working with text metadatatrim(), replace(), mid()
• Logical functions for decision makingIf ((condition), true_value, false_value)
Example: If((#YUnits#==“g”),#SampleRate#/2,100)
• Read more about these functions in the reference guide.Glyph Reference Guide Common Glyph Functionality
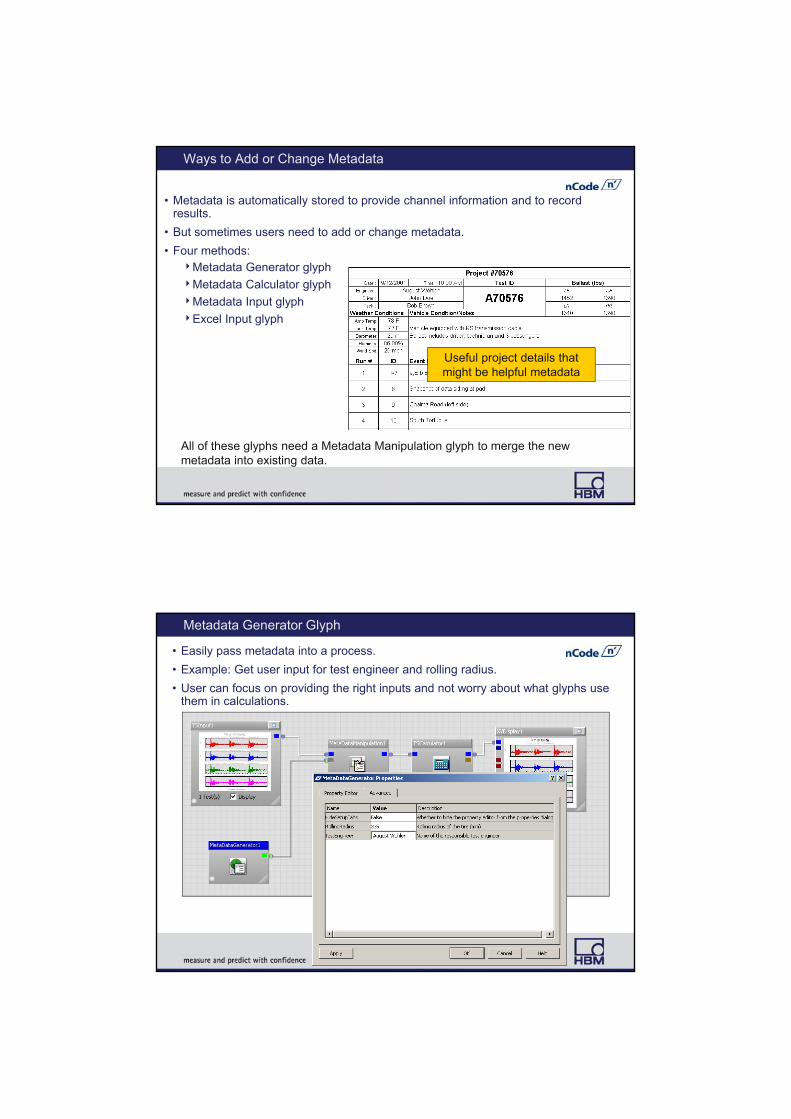
Ways to Add or Change Metadata
• Metadata is automatically stored to provide channel information and to record results.
• But sometimes users need to add or change metadata.
• Four methods:Metadata Generator glyph
Metadata Calculator glyph
Metadata Input glyph
Excel Input glyph
Useful project details that might be helpful metadata
All of these glyphs need a Metadata Manipulation glyph to merge the new metadata into existing data.
Metadata Generator Glyph
• Easily pass metadata into a process.
• Example: Get user input for test engineer and rolling radius.
• User can focus on providing the right inputs and not worry about what glyphs use them in calculations.
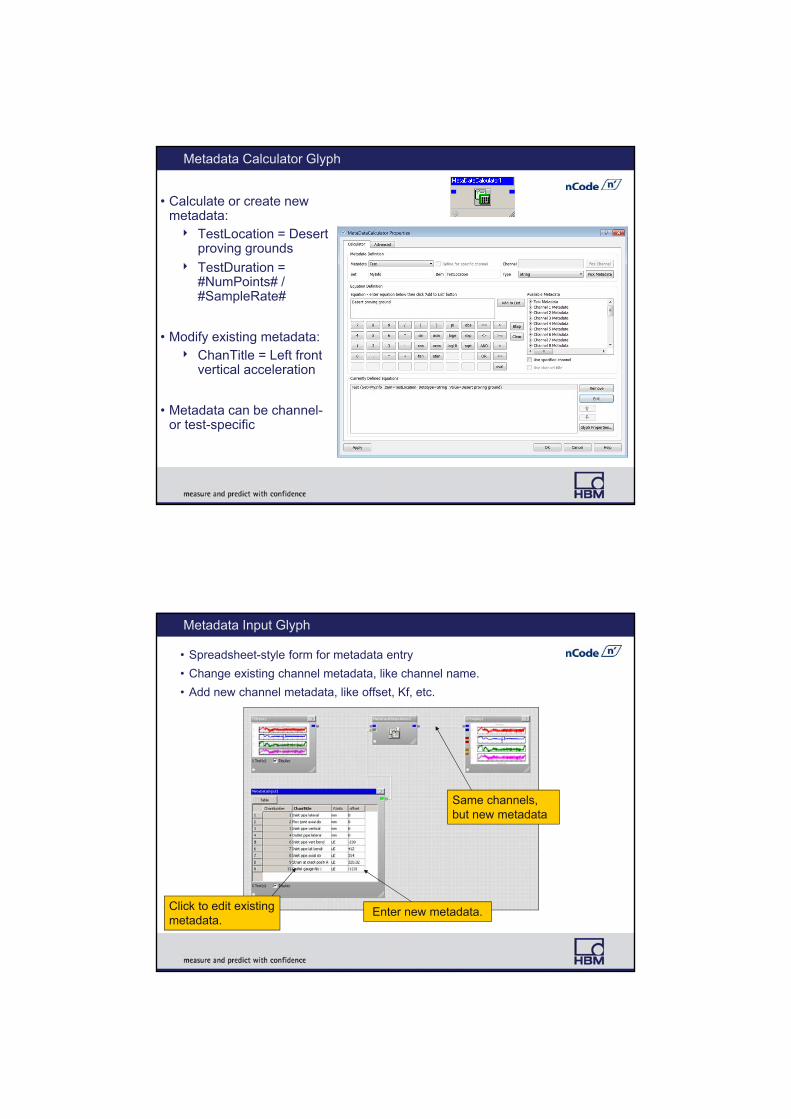
Metadata Calculator Glyph
• Calculate or create new metadata: TestLocation = Desert
proving grounds
TestDuration = #NumPoints# / #SampleRate#
• Modify existing metadata: ChanTitle = Left front
vertical acceleration
• Metadata can be channel-or test-specific
Metadata Input Glyph
• Spreadsheet-style form for metadata entry
• Change existing channel metadata, like channel name.
• Add new channel metadata, like offset, Kf, etc.
Click to edit existing metadata.
Enter new metadata.
Same channels, but new metadata
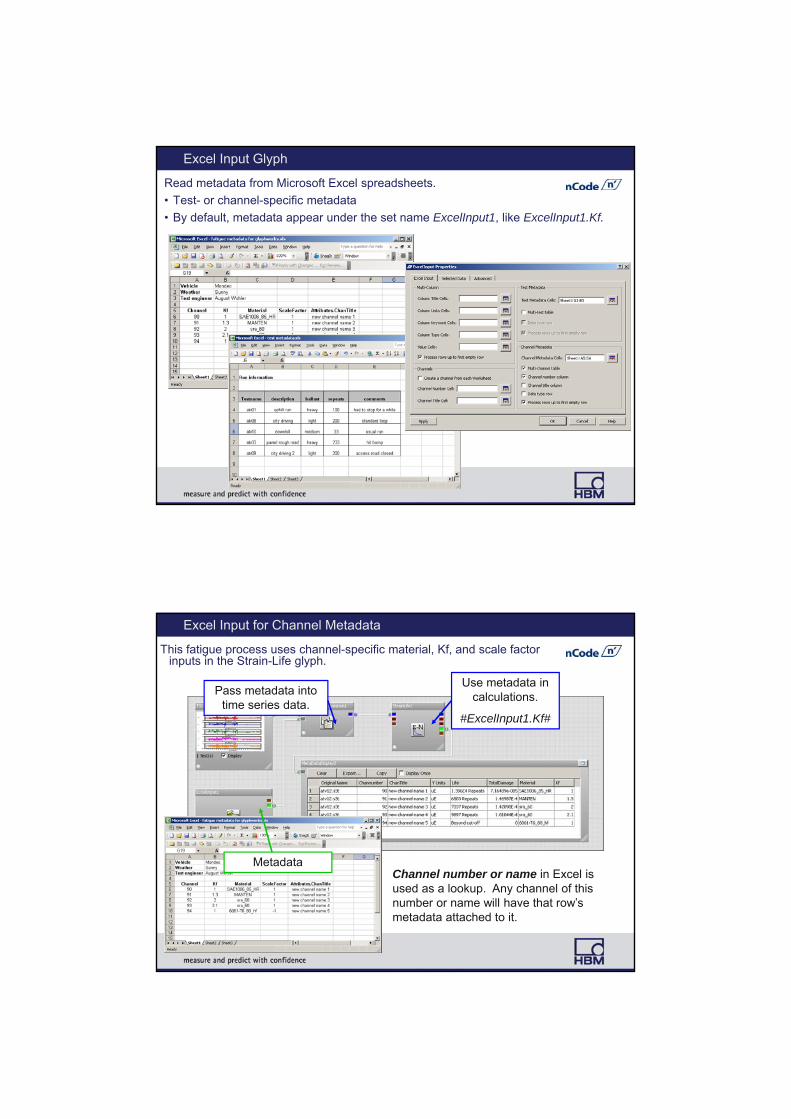
Excel Input Glyph
Read metadata from Microsoft Excel spreadsheets.
• Test- or channel-specific metadata
• By default, metadata appear under the set name ExcelInput1, like ExcelInput1.Kf.
Excel Input for Channel Metadata
This fatigue process uses channel-specific material, Kf, and scale factor inputs in the Strain-Life glyph.
Pass metadata into time series data.
Use metadata in calculations.
#ExcelInput1.Kf#
MetadataChannel number or name in Excel is used as a lookup. Any channel of this number or name will have that row’s metadata attached to it.
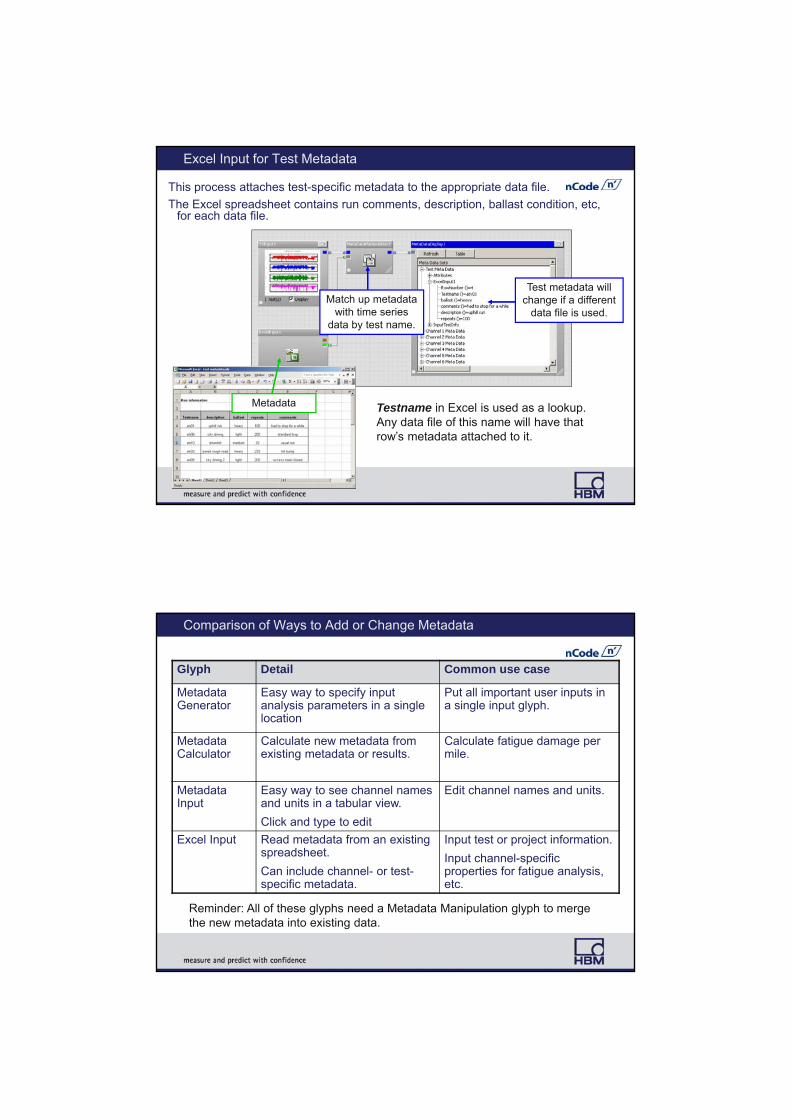
Excel Input for Test Metadata
This process attaches test-specific metadata to the appropriate data file.
The Excel spreadsheet contains run comments, description, ballast condition, etc, for each data file.
Match up metadata with time series
data by test name.
Test metadata will change if a different
data file is used.
Testname in Excel is used as a lookup. Any data file of this name will have that row’s metadata attached to it.
Metadata
Comparison of Ways to Add or Change Metadata
Glyph Detail Common use case
Metadata Generator
Easy way to specify input analysis parameters in a single location
Put all important user inputs in a single input glyph.
Metadata Calculator
Calculate new metadata from existing metadata or results.
Calculate fatigue damage per mile.
Metadata Input
Easy way to see channel names and units in a tabular view.
Click and type to edit
Edit channel names and units.
Excel Input Read metadata from an existing spreadsheet.
Can include channel- or test-specific metadata.
Input test or project information.
Input channel-specific properties for fatigue analysis, etc.
Reminder: All of these glyphs need a Metadata Manipulation glyph to merge the new metadata into existing data.

Hands-on Exercise
• Using test01.s3t data from demo\example3 directory, create rainflow histograms using the default settings.
• Look at metadata before and after the rainflow glyph. What metadata describe the run duration?
• Normalize the rainflow results by the duration of the original time series to get cycles per hour. Hint: Use the Arithmetic glyph.
Course Outline
1. Introduction
2. Using GlyphWorks: the basics
3. Importing and exporting data
4. Graphically displaying data
5. Manipulating and analyzing data
6. Editing data and automated anomaly detection
7. Combining tests, runs, or events
8. Super Glyph
9. Miscellaneous
Bas
ic
1. Using Metadata in Calculations
2. Studio Display Glyph for Reporting
3. Advanced Features Fatigue analysis and fatigue editing
Crack Growth
Frequency
Analysis of Rotating Machinery
Accelerated Testing
Optimized Testing
GlyphBuilder
Adv
ance
d

nCode GlyphWorks Training
Studio Display Glyph for Reporting
Studio Display
• Create a sophisticated report in GlyphWorks.
• Summarize channel data in many ways on a single report page.
See GlyphWorks Worked Example #10.
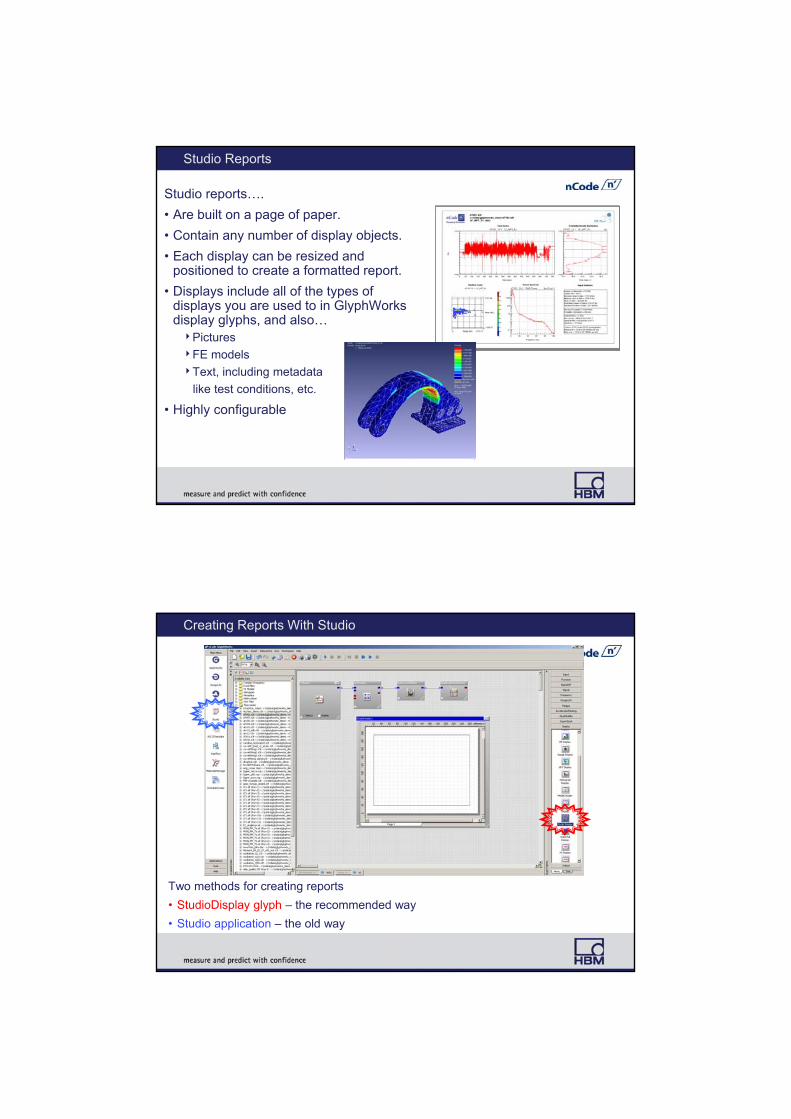
Studio Reports
Studio reports….
• Are built on a page of paper.
• Contain any number of display objects.
• Each display can be resized and positioned to create a formatted report.
• Displays include all of the types of displays you are used to in GlyphWorks display glyphs, and also…Pictures
FE models
Text, including metadata
like test conditions, etc.
• Highly configurable
Creating Reports With Studio
Two methods for creating reports
• StudioDisplay glyph – the recommended way
• Studio application – the old way
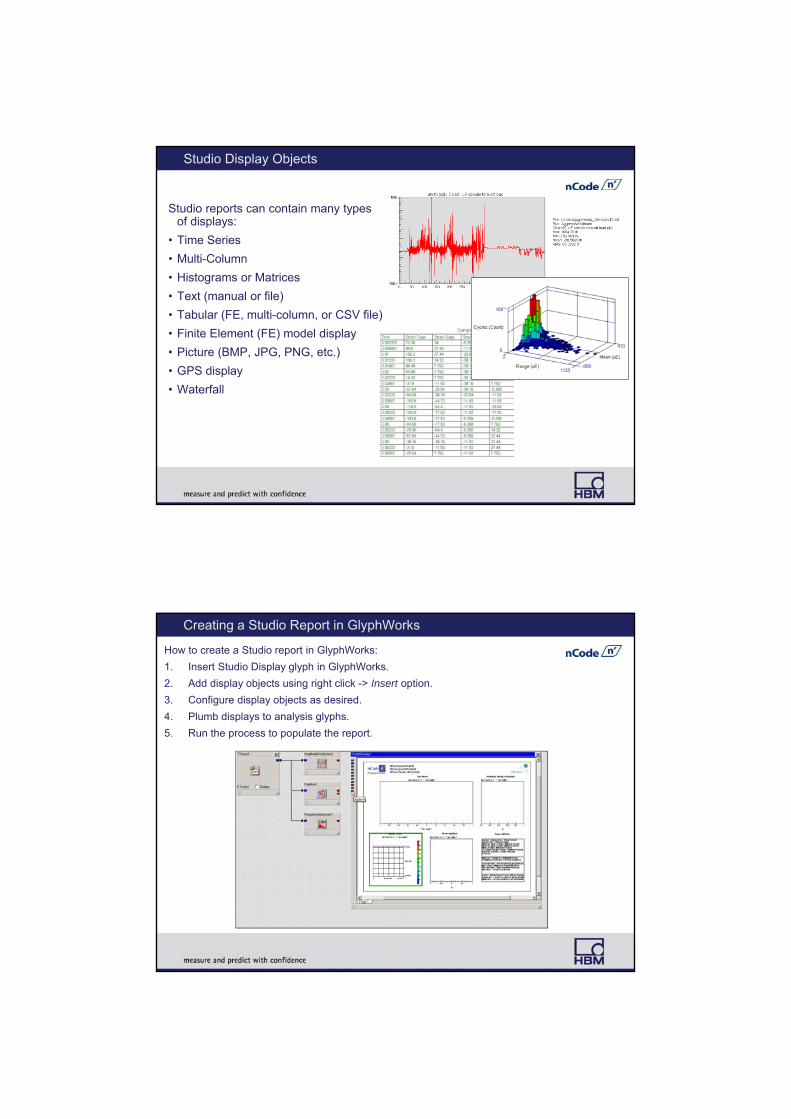
Studio Display Objects
Studio reports can contain many types of displays:
• Time Series
• Multi-Column
• Histograms or Matrices
• Text (manual or file)
• Tabular (FE, multi-column, or CSV file)
• Finite Element (FE) model display
• Picture (BMP, JPG, PNG, etc.)
• GPS display
• Waterfall
Creating a Studio Report in GlyphWorks
How to create a Studio report in GlyphWorks:
1. Insert Studio Display glyph in GlyphWorks.
2. Add display objects using right click -> Insert option.
3. Configure display objects as desired.
4. Plumb displays to analysis glyphs.
5. Run the process to populate the report.
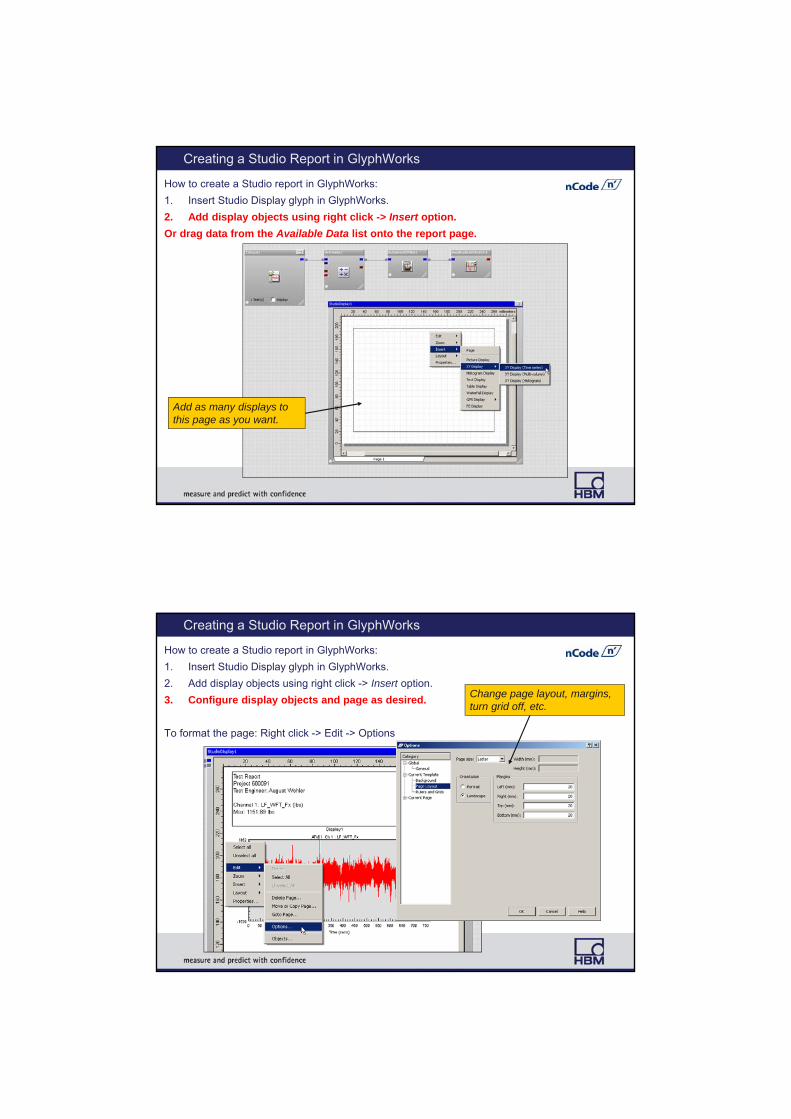
Creating a Studio Report in GlyphWorks
How to create a Studio report in GlyphWorks:
1. Insert Studio Display glyph in GlyphWorks.
2. Add display objects using right click -> Insert option.
Or drag data from the Available Data list onto the report page.
Add as many displays to this page as you want.
Creating a Studio Report in GlyphWorks
How to create a Studio report in GlyphWorks:
1. Insert Studio Display glyph in GlyphWorks.
2. Add display objects using right click -> Insert option.
3. Configure display objects and page as desired.
To format the page: Right click -> Edit -> Options
Change page layout, margins, turn grid off, etc.
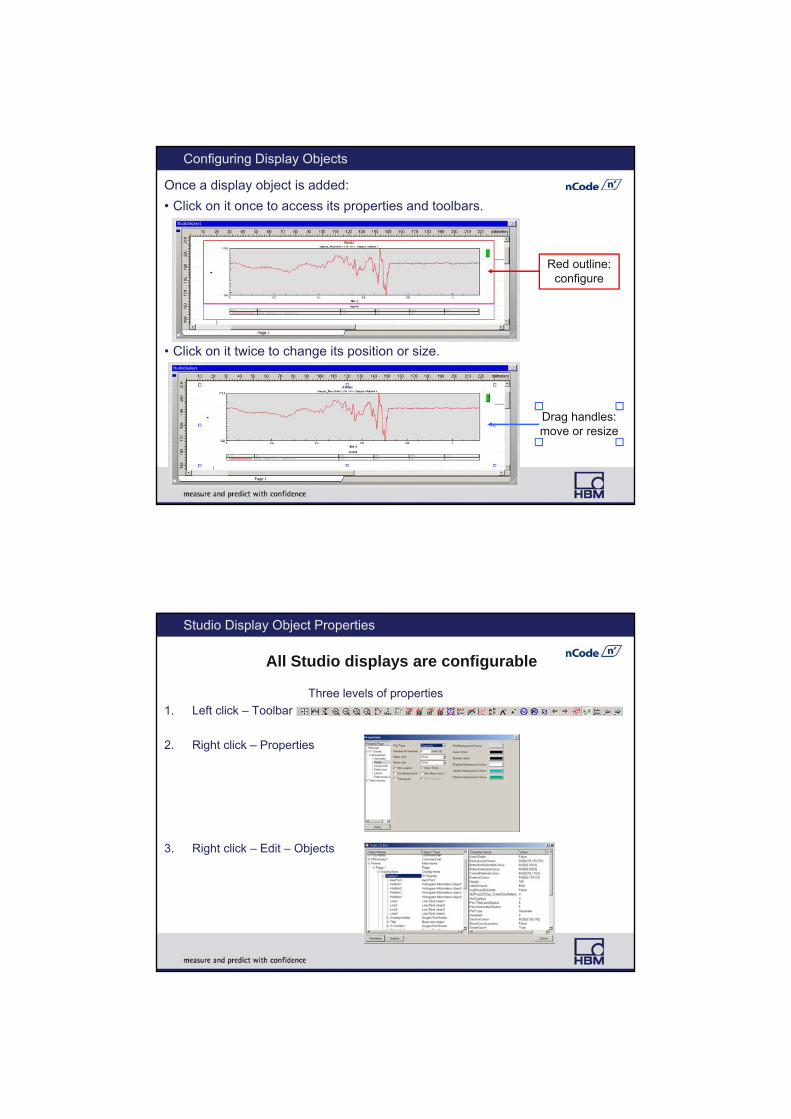
Configuring Display Objects
Once a display object is added:
• Click on it once to access its properties and toolbars.
• Click on it twice to change its position or size.
Red outline: configure
Drag handles: move or resize
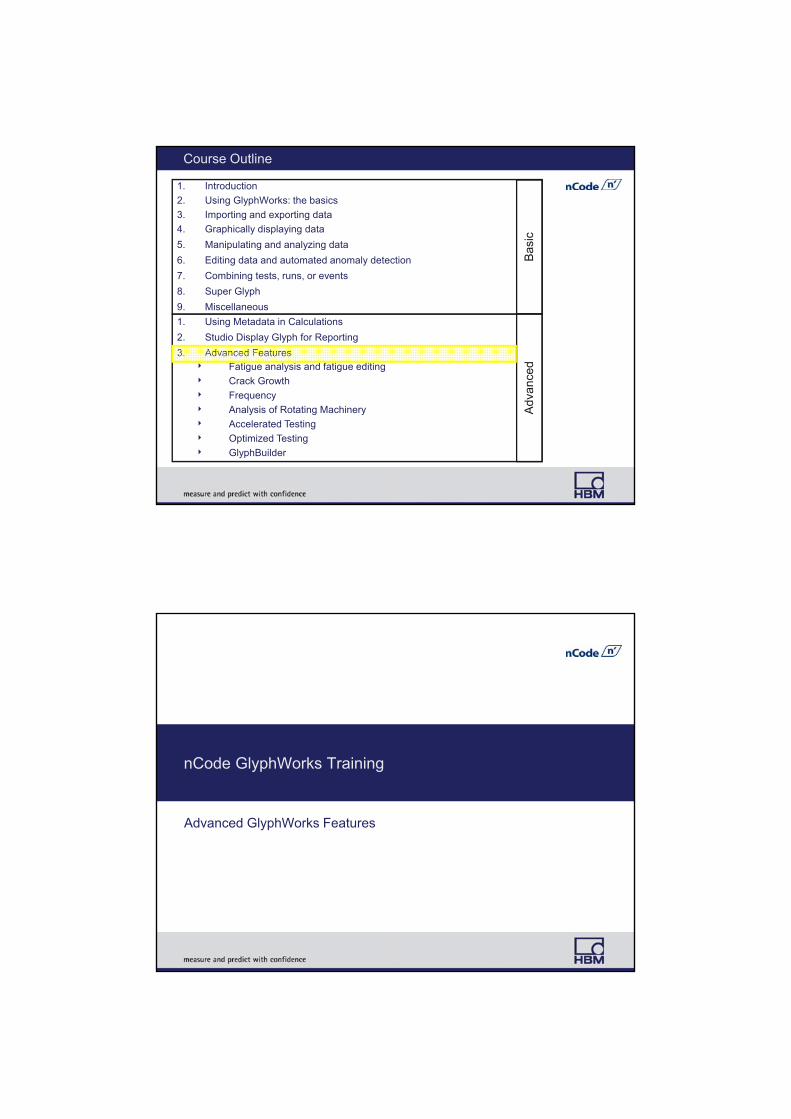
Studio Display Object Properties
Three levels of properties
1. Left click – Toolbar
2. Right click – Properties
3. Right click – Edit – Objects
All Studio displays are configurable

Creating a Studio Report in GlyphWorks
Display lights up when cursor is over input pad to show connections.
How to create a Studio report in GlyphWorks:
• Insert Studio Display glyph in GlyphWorks.
• Add display objects using right click -> Insert option.
• Configure display objects as desired.
• Plumb displays to analysis glyphs.
• Run the process to populate the report.
Displaying Metadata
Text Display supports metadata
• Example: Channel = #ChanNumber# is displayed as Channel = 1 when the process is run.
• Metadata are available by pick list once data has been run into the Studio Display glyph.

Exporting Studio Reports
PicturesHTMLWordPowerPointPDF
Check ‘Output All Channels’ to create a hardcopy report with separate pages for each channel.
Export as pictures, Web pages, Word, PowerPoint, and PDF documents.
Enhanced Export to Microsoft Word
• Export text and tables directly into Word as text and table objects.
• Append multiple tests directly into one Word document.
• Use your own ‘template’ document as the starting point for each exported Word doc.

More About Reports
Metadata Display and Data Values Display glyphs have an output option for displaying tables of results in Studio Display reports.
Hands-on Exercise
Worked Example #10
“Creating a Studio Report in GlyphWorks”
Objective: in this exercise, you will learn to….
• Create a GlyphWorks process that analyzes data and populates the StudioDisplay report.
• Export the report to HTML and Microsoft Word outputs.
Course Outline
1. Introduction
2. Using GlyphWorks: the basics
3. Importing and exporting data
4. Graphically displaying data
5. Manipulating and analyzing data
6. Editing data and automated anomaly detection
7. Combining tests, runs, or events
8. Super Glyph
9. Miscellaneous
Bas
ic
1. Using Metadata in Calculations
2. Studio Display Glyph for Reporting
3. Advanced Features Fatigue analysis and fatigue editing
Crack Growth
Frequency
Analysis of Rotating Machinery
Accelerated Testing
Optimized Testing
GlyphBuilder
Adv
ance
d
nCode GlyphWorks Training
Advanced GlyphWorks Features
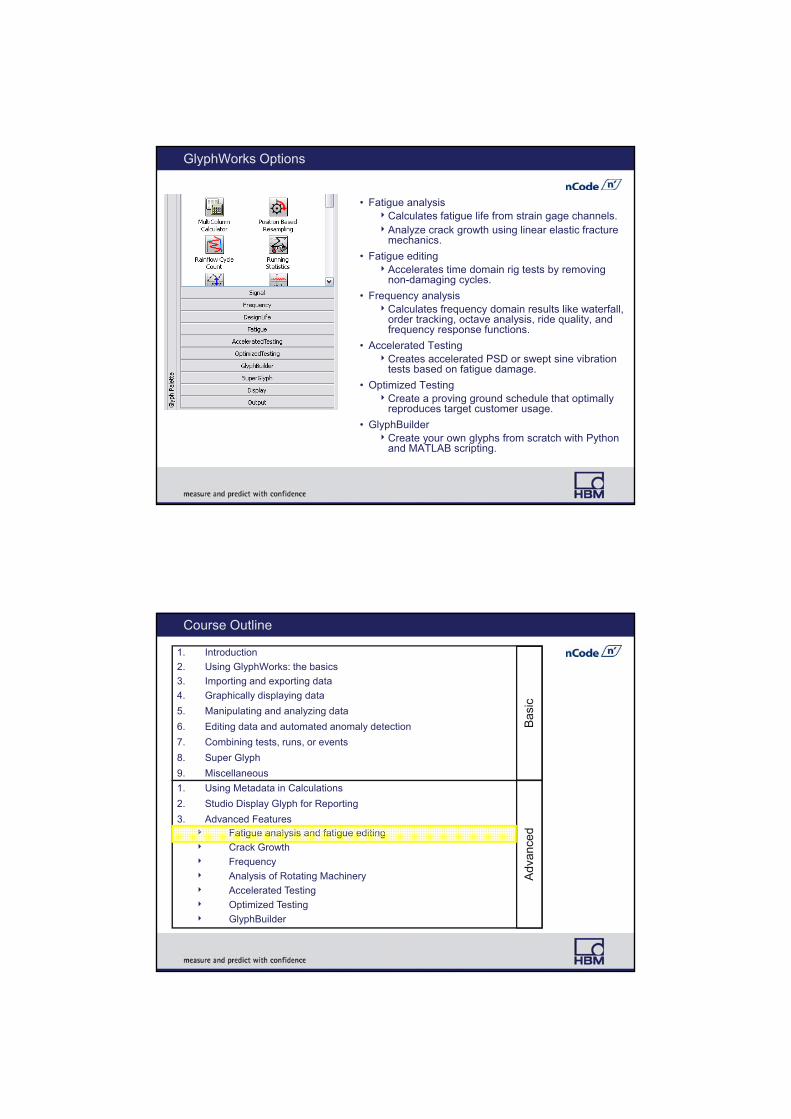
GlyphWorks Options
• Fatigue analysis Calculates fatigue life from strain gage channels.Analyze crack growth using linear elastic fracture
mechanics.
• Fatigue editing Accelerates time domain rig tests by removing
non-damaging cycles.
• Frequency analysisCalculates frequency domain results like waterfall,
order tracking, octave analysis, ride quality, and frequency response functions.
• Accelerated TestingCreates accelerated PSD or swept sine vibration
tests based on fatigue damage.
• Optimized TestingCreate a proving ground schedule that optimally
reproduces target customer usage.
• GlyphBuilderCreate your own glyphs from scratch with Python
and MATLAB scripting.
Course Outline
1. Introduction
2. Using GlyphWorks: the basics
3. Importing and exporting data
4. Graphically displaying data
5. Manipulating and analyzing data
6. Editing data and automated anomaly detection
7. Combining tests, runs, or events
8. Super Glyph
9. Miscellaneous
Bas
ic
1. Using Metadata in Calculations
2. Studio Display Glyph for Reporting
3. Advanced Features Fatigue analysis and fatigue editing
Crack Growth
Frequency
Analysis of Rotating Machinery
Accelerated Testing
Optimized Testing
GlyphBuilder
Adv
ance
d

nCode GlyphWorks Training
GlyphWorks Fatigue
GlyphWorks Fatigue Theory Guide
Look under Manuals – Contents – Fatigue Theory Guide
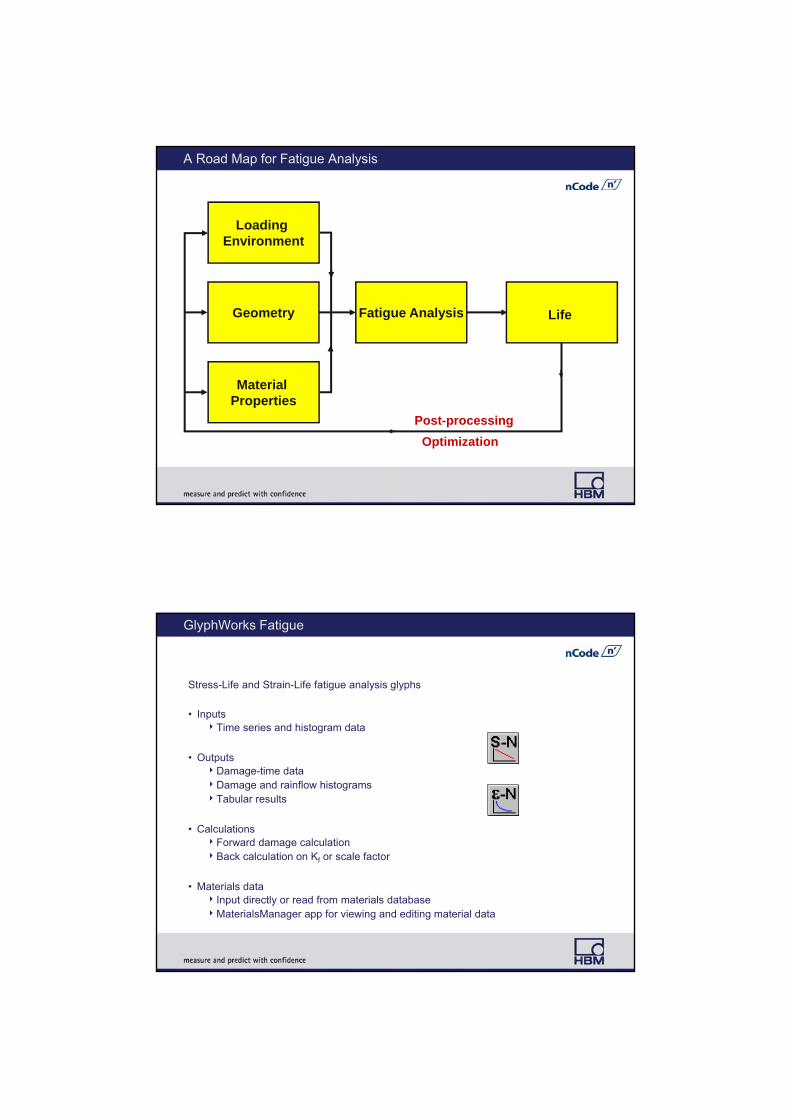
A Road Map for Fatigue Analysis
Fatigue Analysis Life
Loading Environment
Geometry
Material Properties
Post-processing
Optimization
GlyphWorks Fatigue
Stress-Life and Strain-Life fatigue analysis glyphs
• InputsTime series and histogram data
• OutputsDamage-time dataDamage and rainflow histogramsTabular results
• CalculationsForward damage calculationBack calculation on Kf or scale factor
• Materials data Input directly or read from materials databaseMaterialsManager app for viewing and editing material data
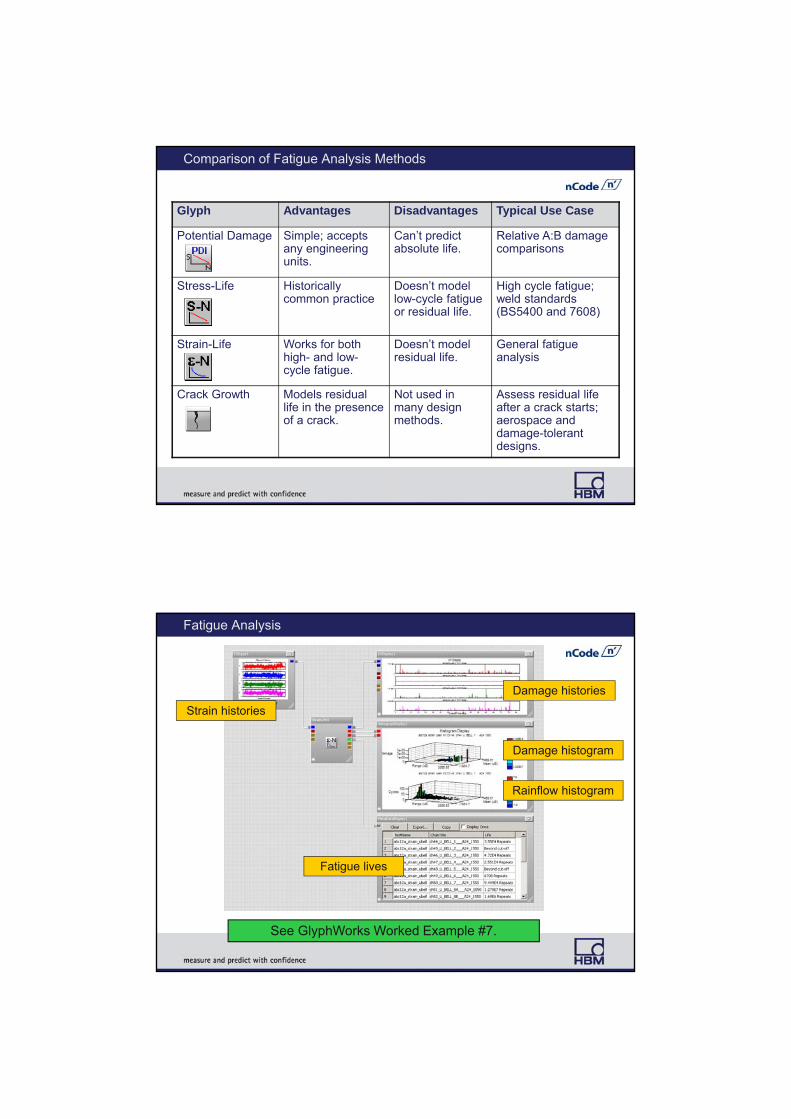
Comparison of Fatigue Analysis Methods
Glyph Advantages Disadvantages Typical Use Case
Potential Damage Simple; accepts any engineering units.
Can’t predict absolute life.
Relative A:B damage comparisons
Stress-Life Historically common practice
Doesn’t model low-cycle fatigue or residual life.
High cycle fatigue; weld standards (BS5400 and 7608)
Strain-Life Works for both high- and low-cycle fatigue.
Doesn’t model residual life.
General fatigue analysis
Crack Growth Models residual life in the presence of a crack.
Not used in many design methods.
Assess residual life after a crack starts; aerospace and damage-tolerant designs.
Fatigue Analysis
See GlyphWorks Worked Example #7.
Strain histories
Damage histories
Damage histogram
Rainflow histogram
Fatigue lives
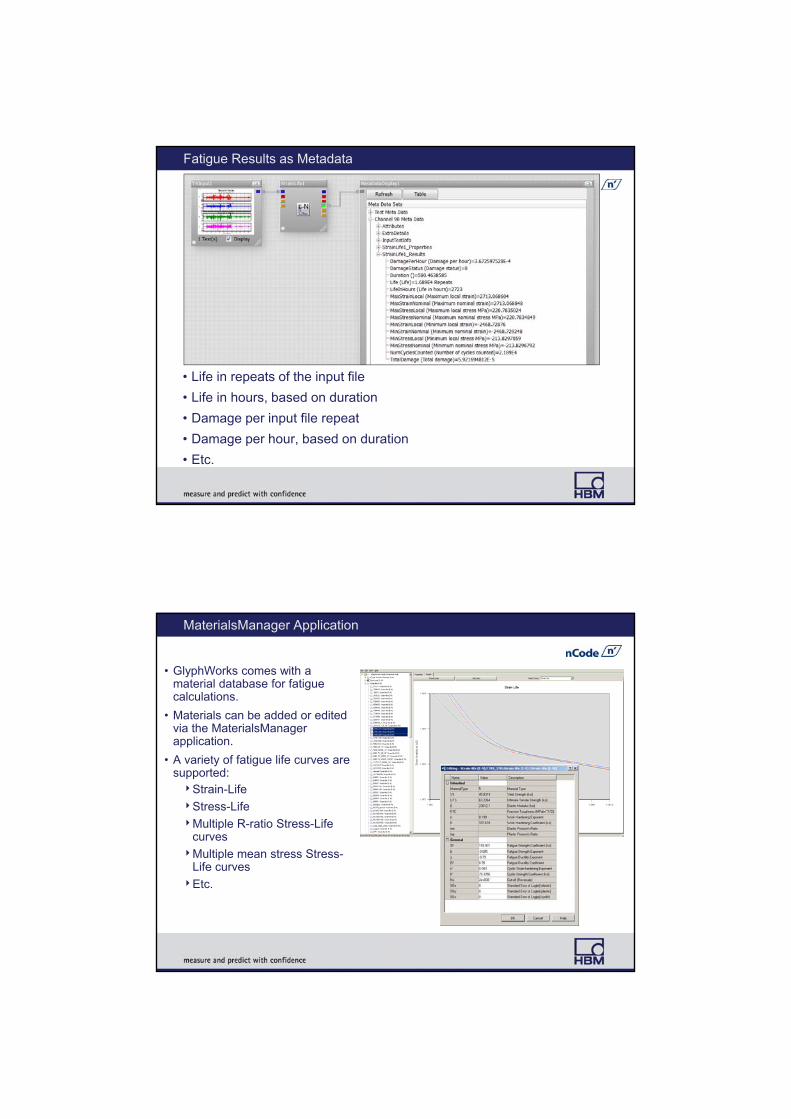
Fatigue Results as Metadata
• Life in repeats of the input file
• Life in hours, based on duration
• Damage per input file repeat
• Damage per hour, based on duration
• Etc.
MaterialsManager Application
• GlyphWorks comes with a material database for fatigue calculations.
• Materials can be added or edited via the MaterialsManagerapplication.
• A variety of fatigue life curves are supported:Strain-Life
Stress-Life
Multiple R-ratio Stress-Life curves
Multiple mean stress Stress-Life curves
Etc.
Hands-on Exercise
Worked Example #7
“Strain-Life Fatigue Analysis and Fatigue Editing”
Objective: In this exercise, you will learn to….
• Create a GlyphWorks process that analyzes the fatigue life of strain data using the Strain-Life method.
• Review and edit fatigue materials data using the MaterialsManager.
• Create a GlyphWorks process that edits time series data based on damaging cycles to create an accelerated durability test.
nCode GlyphWorks Training
GlyphWorks Fatigue:
Some Advanced Use Cases

Schedule Damage Summation
Both SN and EN fatigue analysis glyphs can efficiently analyze schedules.
• Schedule file (.sch), or
• Multiple tests with repeats
Results include
•Total damage
•Damage per event
•% damage contribution
See GlyphWorks Worked Example #22.
Durability Test Methods
Method nCode Software
Constant amplitude GlyphWorks
Block cycle GlyphWorks
Time domain (RPC) GlyphWorks Fatigue Edit
Frequency domain (PSD) GlyphWorks Accelerated Testing
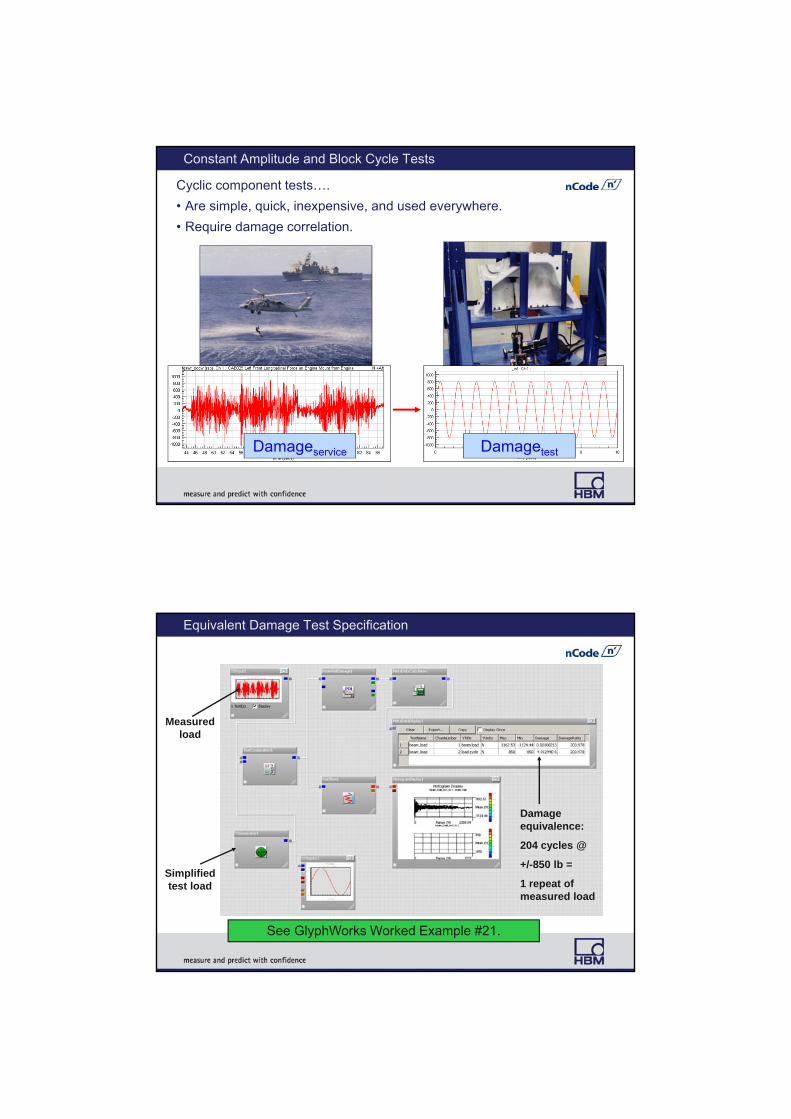
Constant Amplitude and Block Cycle Tests
Cyclic component tests….
• Are simple, quick, inexpensive, and used everywhere.
• Require damage correlation.
Damageservice Damagetest
Equivalent Damage Test Specification
See GlyphWorks Worked Example #21.
Measured load
Simplified test load
Damage equivalence:
204 cycles @
+/-850 lb =
1 repeat of measured load

Fatigue Damage Editing for Time Domain Tests
The Damage Editing glyph identifies sections of time histories to be removed, while retaining a specified proportion of fatigue damage.
Damage time histories
Edit feature list
Graphically displays fatigue edits and deletes marked sections.
Edited data for shorter rig test
Unedited data for rig test
See GlyphWorks Worked Example #7.
nCode GlyphWorks Training
GlyphWorks Fatigue:
Creep and Rupture at Elevated Temperature

Creep
Nabarro‐Herring Creep • Atoms diffuse from
stressed face to unstressed face
Max shear stress
Diffusing atomsOriginal grain shape
New grain shape
Min shear stress
Creep rupture• Voids develop on grain boundaries
• Voids grow through atom diffusion and void coalescence
Void growth by diffusion
Voids on grain boundary
Creep: Inelastic deformation and damage due to combination of high temperature and stress levels. Ultimately this can lead to loss of function or rupture.
0 Kelvin
Melting point
½ melting point
Room temp
Creep
No Creep
GlyphWorks Creep Analysis
• Furnace subjected to 3½ hour repetitive thermal loading cycle
• Maximum static constrained stress of 300MPa
• How long will it last?
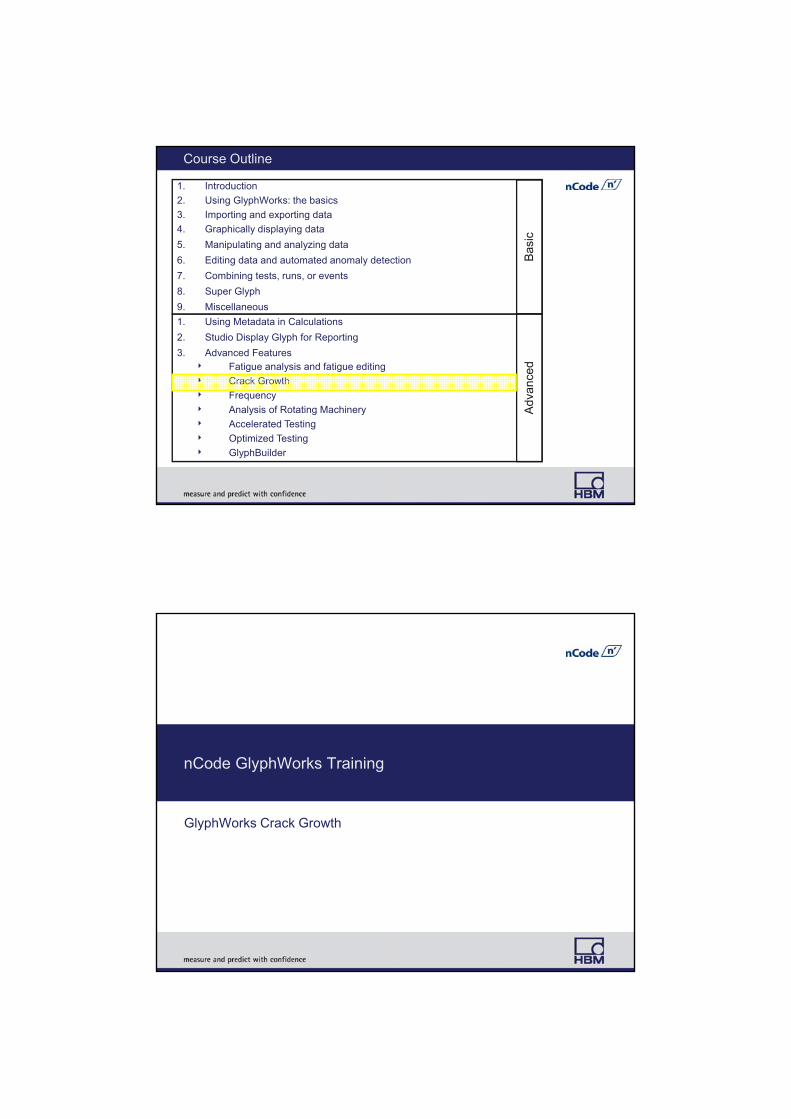
Course Outline
1. Introduction
2. Using GlyphWorks: the basics
3. Importing and exporting data
4. Graphically displaying data
5. Manipulating and analyzing data
6. Editing data and automated anomaly detection
7. Combining tests, runs, or events
8. Super Glyph
9. Miscellaneous
Bas
ic
1. Using Metadata in Calculations
2. Studio Display Glyph for Reporting
3. Advanced Features Fatigue analysis and fatigue editing
Crack Growth
Frequency
Analysis of Rotating Machinery
Accelerated Testing
Optimized Testing
GlyphBuilder
Adv
ance
d
nCode GlyphWorks Training
GlyphWorks Crack Growth

What if a Crack Exists?
K describes the severity of the stress field.
Y is the geometry factor relating stress concentration to crack shape and length.
a = length of crack.
Stress from strain gage or FE of un-cracked component
aYK aYK
Unstable brittle fracture occurs when the applied K exceeds K1c , a material property.
An existing crack results in very high stresses – so high that another parameter called stress intensity factor (K) is needed to describe its severity.
A Road Map for Fatigue Analysis
Fatigue Analysis Life
Loading Environment
Geometry
Material Properties
Post-processing
Optimization
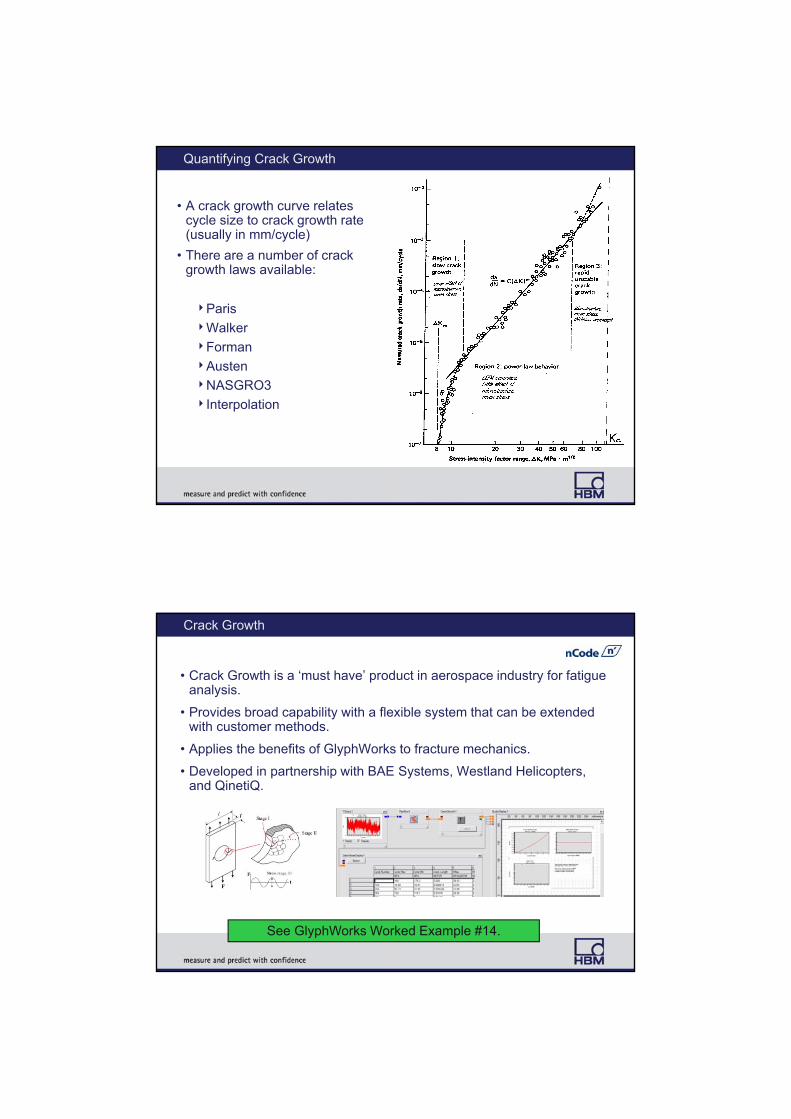
Quantifying Crack Growth
• A crack growth curve relates cycle size to crack growth rate (usually in mm/cycle)
• There are a number of crack growth laws available:
Paris
Walker
Forman
Austen
NASGRO3
Interpolation
Crack Growth
• Crack Growth is a ‘must have’ product in aerospace industry for fatigue analysis.
• Provides broad capability with a flexible system that can be extended with customer methods.
• Applies the benefits of GlyphWorks to fracture mechanics.
• Developed in partnership with BAE Systems, Westland Helicopters, and QinetiQ.
See GlyphWorks Worked Example #14.
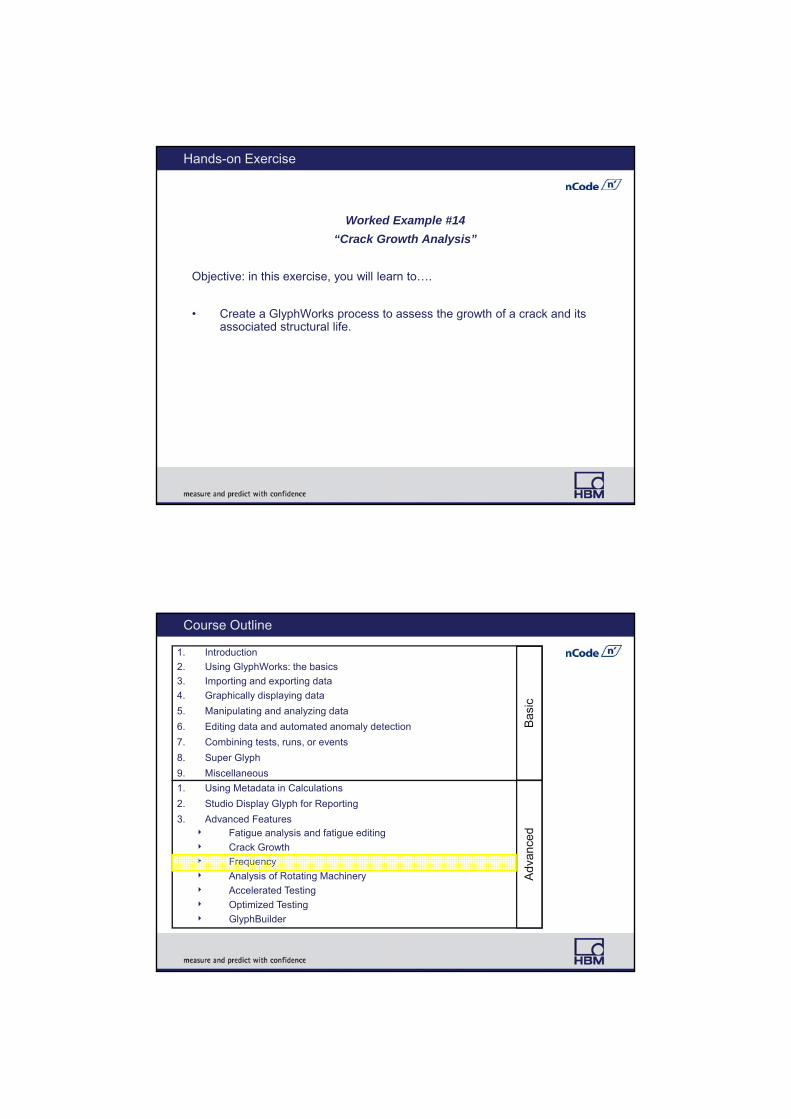
Hands-on Exercise
Worked Example #14
“Crack Growth Analysis”
Objective: in this exercise, you will learn to….
• Create a GlyphWorks process to assess the growth of a crack and its associated structural life.
Course Outline
1. Introduction
2. Using GlyphWorks: the basics
3. Importing and exporting data
4. Graphically displaying data
5. Manipulating and analyzing data
6. Editing data and automated anomaly detection
7. Combining tests, runs, or events
8. Super Glyph
9. Miscellaneous
Bas
ic
1. Using Metadata in Calculations
2. Studio Display Glyph for Reporting
3. Advanced Features Fatigue analysis and fatigue editing
Crack Growth
Frequency
Analysis of Rotating Machinery
Accelerated Testing
Optimized Testing
GlyphBuilder
Adv
ance
d

nCode GlyphWorks Training
GlyphWorks Frequency
Frequency Product Option
• The Frequency product option provides additional frequency capability beyond PSDs and filtering.
• Applications could include:
Engine run-up vibration analysis using waterfall plots
Basic acoustic assessment using octave analysis
Vehicle ride quality analysis using ISO 2631 standard
Transfer function analysis such as seat vibration transmissibility
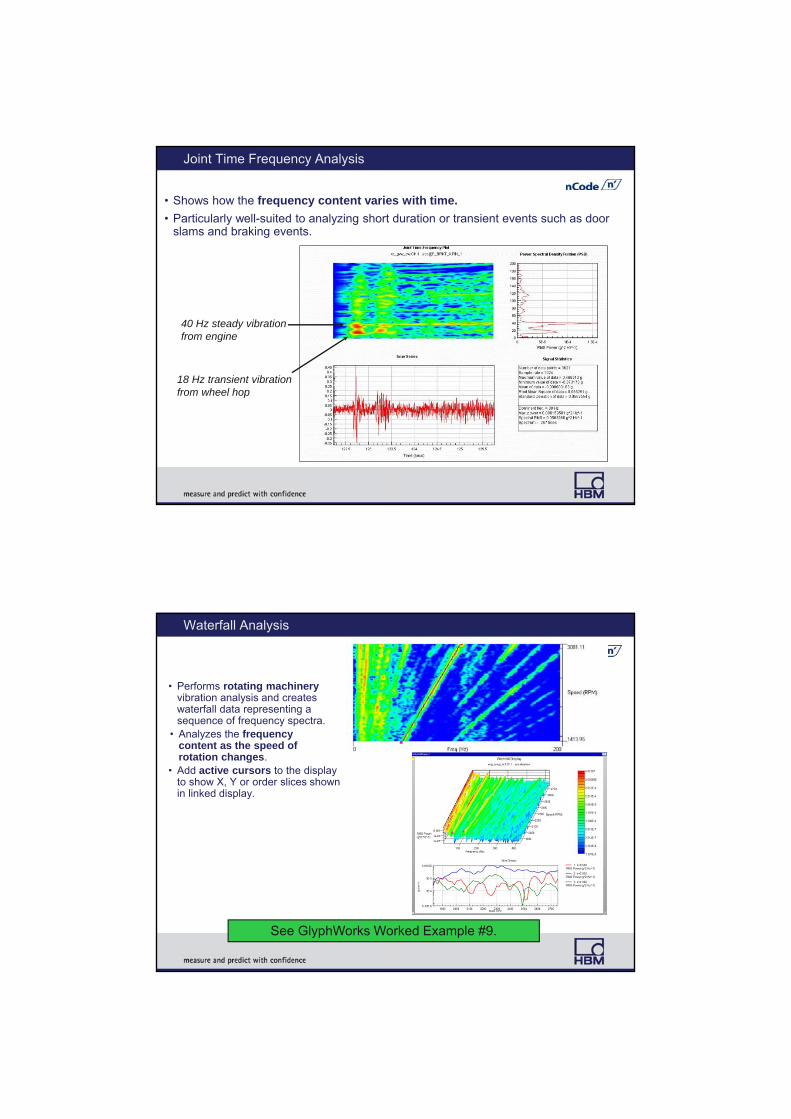
Joint Time Frequency Analysis
• Shows how the frequency content varies with time.
• Particularly well-suited to analyzing short duration or transient events such as door slams and braking events.
40 Hz steady vibration from engine
18 Hz transient vibration from wheel hop
Waterfall Analysis
• Performs rotating machineryvibration analysis and creates waterfall data representing a sequence of frequency spectra.
• Add active cursors to the display to show X, Y or order slices shown in linked display.
See GlyphWorks Worked Example #9.
• Analyzes the frequency content as the speed of rotation changes.

Order Tracking Filter
• Filter on order rather than a frequency band.
• Order filtering uses a speed channel to set filter characteristics.
Example: Remove the once-per-rev (1st order) wobble from an unbalanced shaft.
Retain or remove an order from time series data.
Remove 1st order
1st order gone
Octave Analysis
• Calculates RMS levels in octave and third octave bands (plus 1/6, 1/12 and 1/24 fractional octave bands).
• Two types of input:
PSD spectral results are re-binned into octave bands.
Time series data are filtered using multiple Butterworth filters as per ANSI S1.11 –2004 standard.
• Weighting functions:
Acoustic weighting functions are built in for dB A, B, C noise weighting.
Ride quality weighting functions are built-in for ISO 2631/1 whole-body vibration Wk, Wd, Wfweighting.
User defined weighting
See GlyphWorks Worked Example #12.
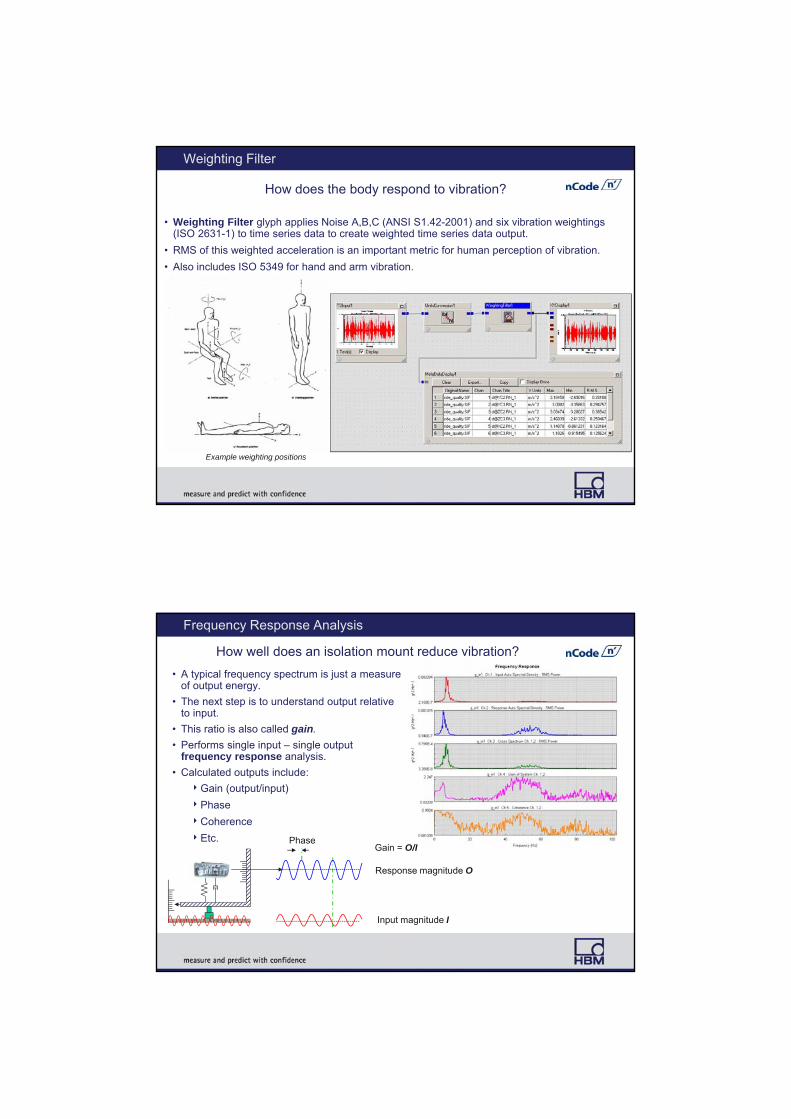
Weighting Filter
How does the body respond to vibration?
• Weighting Filter glyph applies Noise A,B,C (ANSI S1.42-2001) and six vibration weightings (ISO 2631-1) to time series data to create weighted time series data output.
• RMS of this weighted acceleration is an important metric for human perception of vibration.
• Also includes ISO 5349 for hand and arm vibration.
Example weighting positions
Frequency Response Analysis
• A typical frequency spectrum is just a measure of output energy.
• The next step is to understand output relative to input.
• This ratio is also called gain.
• Performs single input – single output frequency response analysis.
• Calculated outputs include:
Gain (output/input)
Phase
Coherence
Etc.
Input magnitude I
Phase
Response magnitude O
Gain = O/I
How well does an isolation mount reduce vibration?

Hands-on Exercise
Worked Example #9
“Waterfall Analysis of Rotating Machinery”
Objective: In this exercise, you will learn to….
• Create a GlyphWorks process that analyzes noise and vibration of rotating machinery.
-- OR --
Worked Example #12
“Ride Quality Analysis: Calculating Vibration Dose Values”
Objective: in this exercise, you will learn to….
• Create a GlyphWorks process to analyze the effects of vibration on the human body per ISO standard 2631.
Course Outline
1. Introduction
2. Using GlyphWorks: the basics
3. Importing and exporting data
4. Graphically displaying data
5. Manipulating and analyzing data
6. Editing data and automated anomaly detection
7. Combining tests, runs, or events
8. Super Glyph
9. Miscellaneous
Bas
ic
1. Using Metadata in Calculations
2. Studio Display Glyph for Reporting
3. Advanced Features Fatigue analysis and fatigue editing
Crack Growth
Frequency
Analysis of Rotating Machinery
Accelerated Testing
Optimized Testing
GlyphBuilder
Adv
ance
d
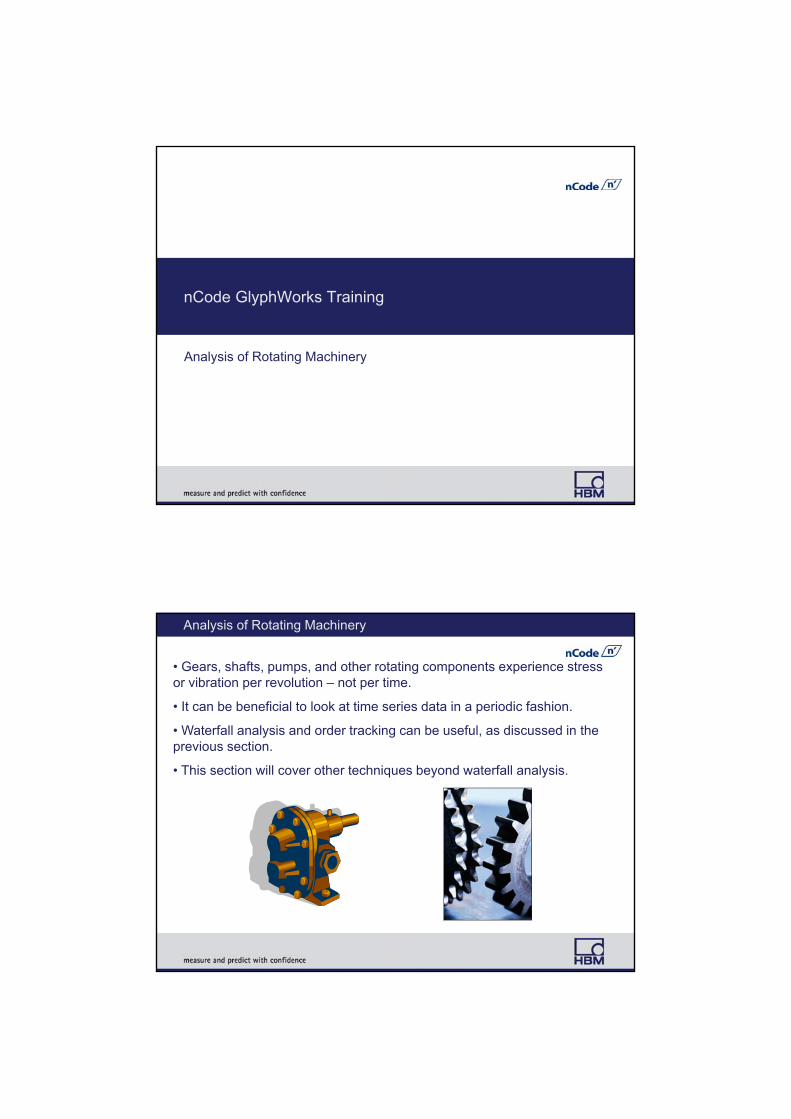
nCode GlyphWorks Training
Analysis of Rotating Machinery
Analysis of Rotating Machinery
• Gears, shafts, pumps, and other rotating components experience stress or vibration per revolution – not per time.
• It can be beneficial to look at time series data in a periodic fashion.
• Waterfall analysis and order tracking can be useful, as discussed in the previous section.
• This section will cover other techniques beyond waterfall analysis.
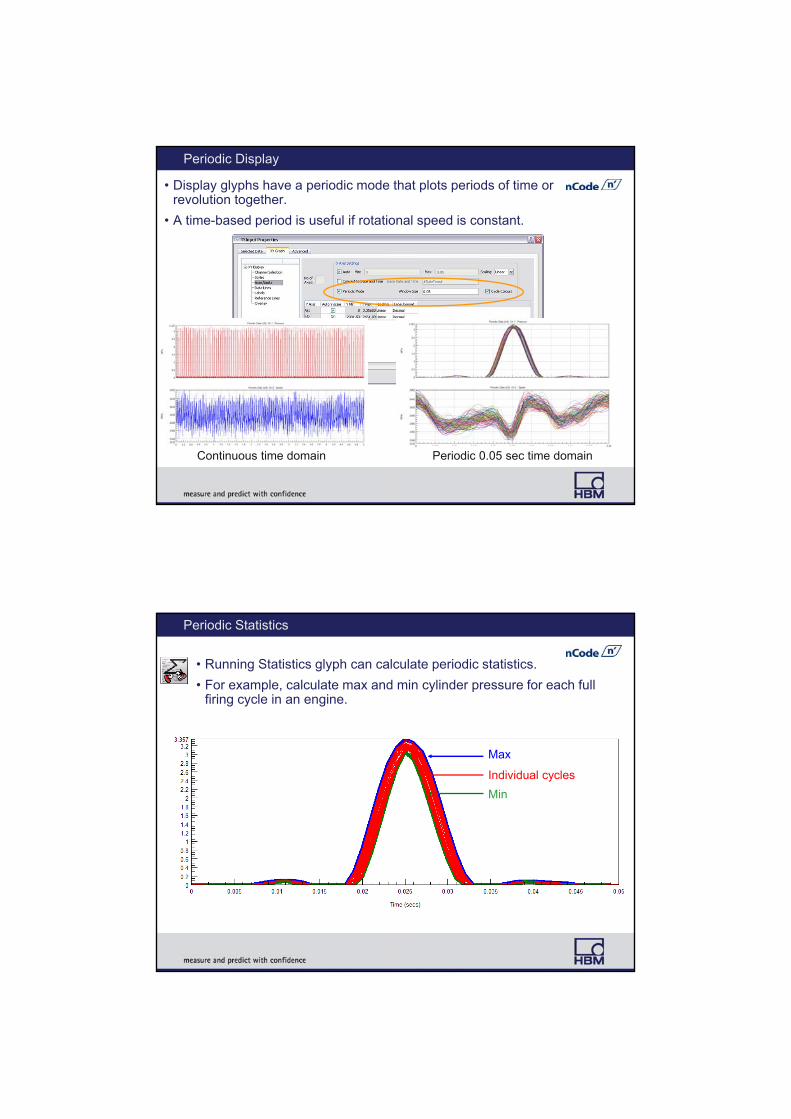
Periodic Display
• Display glyphs have a periodic mode that plots periods of time or revolution together.
• A time-based period is useful if rotational speed is constant.
Continuous time domain Periodic 0.05 sec time domain
Periodic Statistics
• Running Statistics glyph can calculate periodic statistics.
• For example, calculate max and min cylinder pressure for each full firing cycle in an engine.
Max
Individual cycles
Min
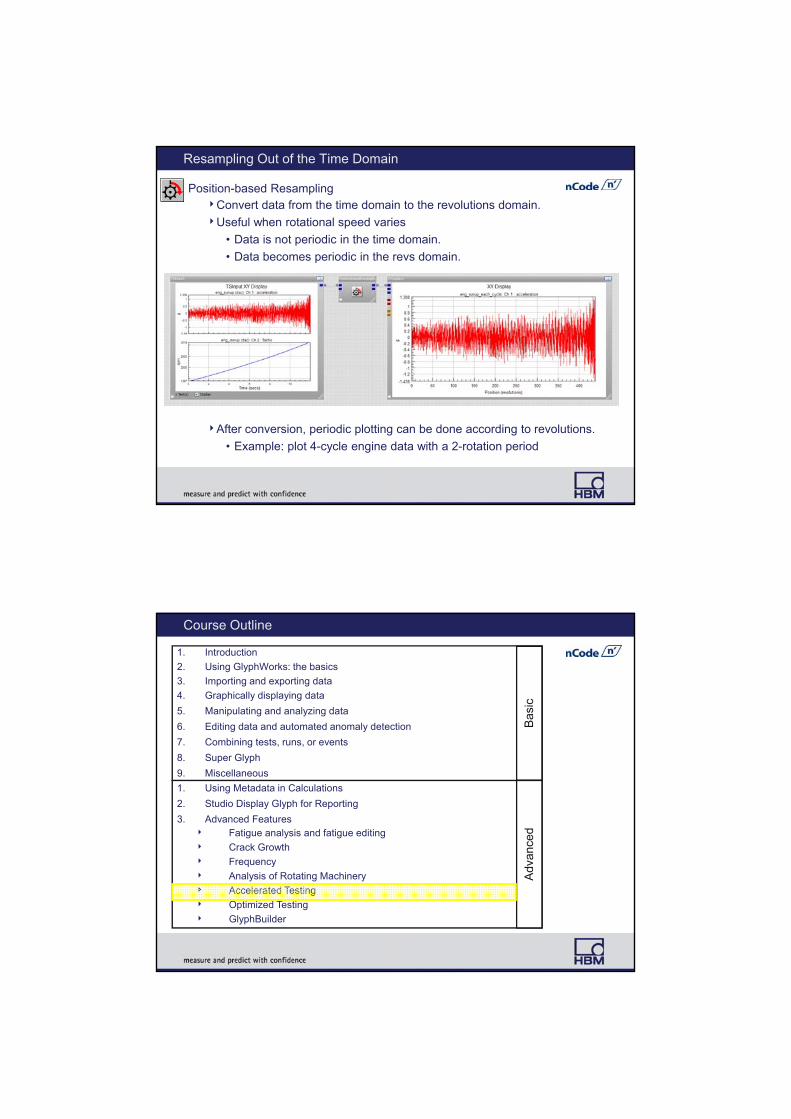
Resampling Out of the Time Domain
Position-based ResamplingConvert data from the time domain to the revolutions domain.
Useful when rotational speed varies
• Data is not periodic in the time domain.
• Data becomes periodic in the revs domain.
After conversion, periodic plotting can be done according to revolutions.
• Example: plot 4-cycle engine data with a 2-rotation period
Course Outline
1. Introduction
2. Using GlyphWorks: the basics
3. Importing and exporting data
4. Graphically displaying data
5. Manipulating and analyzing data
6. Editing data and automated anomaly detection
7. Combining tests, runs, or events
8. Super Glyph
9. Miscellaneous
Bas
ic
1. Using Metadata in Calculations
2. Studio Display Glyph for Reporting
3. Advanced Features Fatigue analysis and fatigue editing
Crack Growth
Frequency
Analysis of Rotating Machinery
Accelerated Testing
Optimized Testing
GlyphBuilder
Adv
ance
d
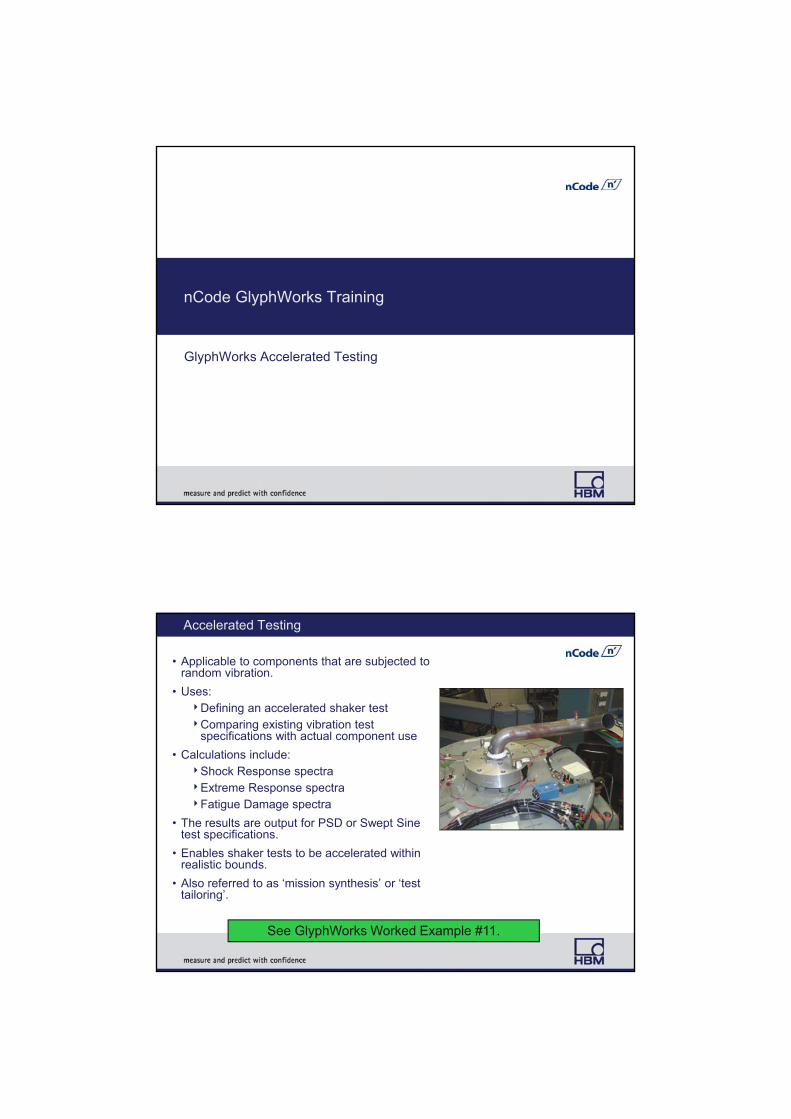
nCode GlyphWorks Training
GlyphWorks Accelerated Testing
Accelerated Testing
• Applicable to components that are subjected to random vibration.
• Uses:Defining an accelerated shaker testComparing existing vibration test
specifications with actual component use
• Calculations include: Shock Response spectraExtreme Response spectraFatigue Damage spectra
• The results are output for PSD or Swept Sine test specifications.
• Enables shaker tests to be accelerated within realistic bounds.
• Also referred to as ‘mission synthesis’ or ‘test tailoring’.
See GlyphWorks Worked Example #11.
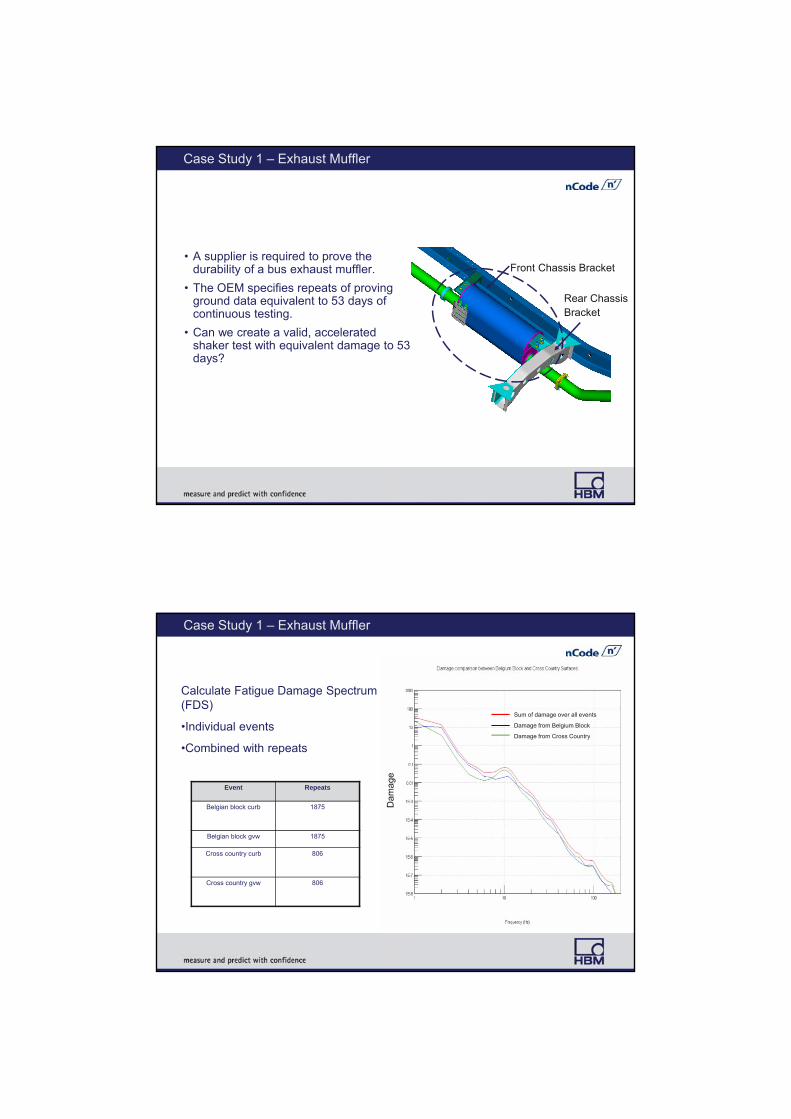
Case Study 1 – Exhaust Muffler
• A supplier is required to prove the durability of a bus exhaust muffler.
• The OEM specifies repeats of proving ground data equivalent to 53 days of continuous testing.
• Can we create a valid, accelerated shaker test with equivalent damage to 53 days?
Front Chassis Bracket
Rear Chassis Bracket
Case Study 1 – Exhaust Muffler
Sum of damage over all events
Damage from Belgium Block
Damage from Cross Country
Event Repeats
Belgian block curb 1875
Belgian block gvw 1875
Cross country curb 806
Cross country gvw 806
Calculate Fatigue Damage Spectrum (FDS)
•Individual events
•Combined with repeats
Dam
age
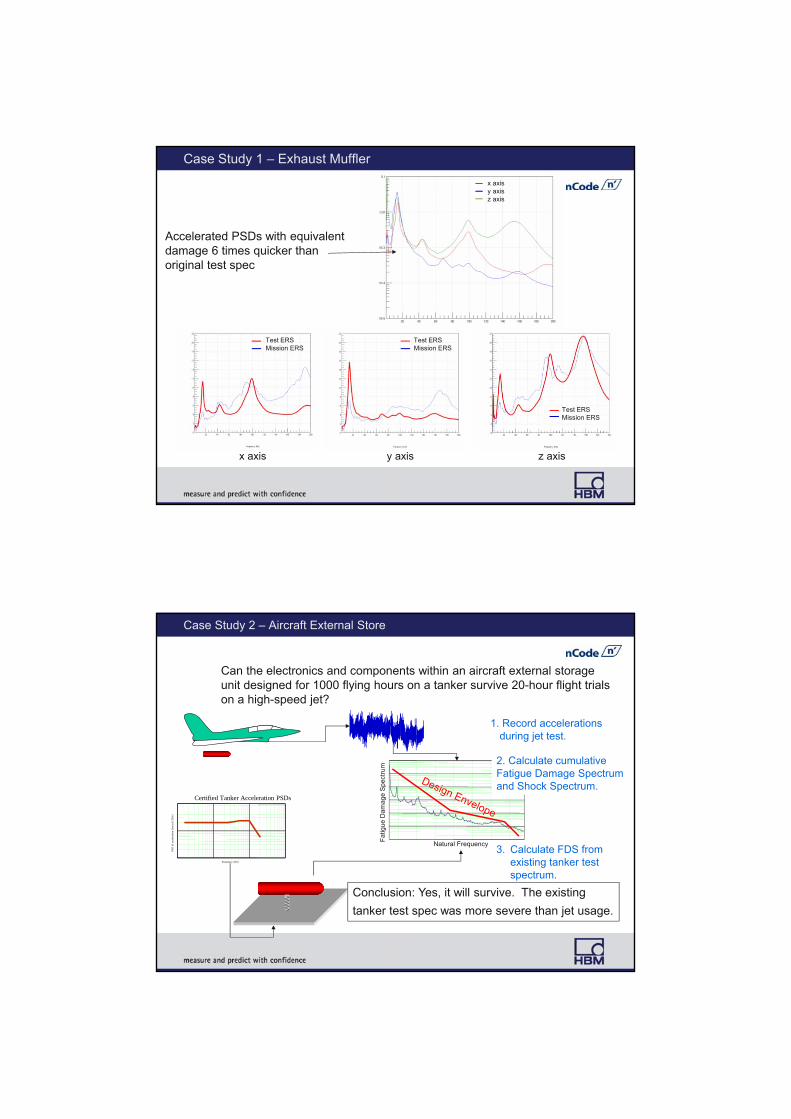
Test ERSMission ERS
x axis
Test ERSMission ERS
y axis
Test ERSMission ERS
z axis
x axisy axisz axis
Case Study 1 – Exhaust Muffler
Accelerated PSDs with equivalent damage 6 times quicker than original test spec
Case Study 2 – Aircraft External Store
Fat
igue
Dam
age
Spe
ctru
m
Natural Frequency
Certified Tanker Acceleration PSDs
Frequency [Hz]
PSD
ofac
cele
ratio
n[(
m/s
/s)^
2/H
z]
1. Record accelerations during jet test.
2. Calculate cumulative Fatigue Damage Spectrum and Shock Spectrum.
3. Calculate FDS from existing tanker test spectrum.
Conclusion: Yes, it will survive. The existing
tanker test spec was more severe than jet usage.
Can the electronics and components within an aircraft external storage unit designed for 1000 flying hours on a tanker survive 20-hour flight trials on a high-speed jet?
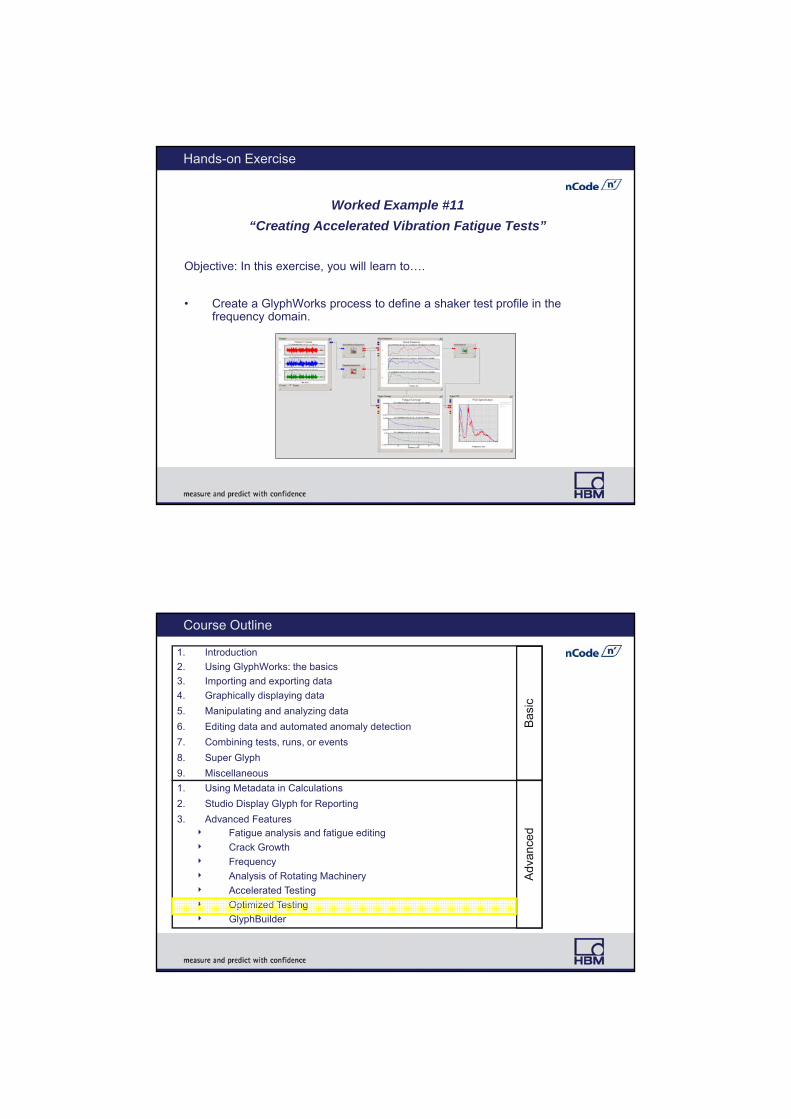
Hands-on Exercise
Worked Example #11
“Creating Accelerated Vibration Fatigue Tests”
Objective: In this exercise, you will learn to….
• Create a GlyphWorks process to define a shaker test profile in the frequency domain.
Course Outline
1. Introduction
2. Using GlyphWorks: the basics
3. Importing and exporting data
4. Graphically displaying data
5. Manipulating and analyzing data
6. Editing data and automated anomaly detection
7. Combining tests, runs, or events
8. Super Glyph
9. Miscellaneous
Bas
ic
1. Using Metadata in Calculations
2. Studio Display Glyph for Reporting
3. Advanced Features Fatigue analysis and fatigue editing
Crack Growth
Frequency
Analysis of Rotating Machinery
Accelerated Testing
Optimized Testing
GlyphBuilder
Adv
ance
d

nCode GlyphWorks Training
GlyphWorks Optimized Testing
Optimized Testing
Key Benefits:
• Significantly reduce proving ground track usage.
• Optimize testing schedules and reduce testing time.
• Understand how real world usage compares to track data.
• Rapidly compare different proving grounds or duty cycles.
Optimized Testing provides the ability for engineers to answer:What is the optimum proving ground schedule?
What is the best mix of surfaces, weight conditions, speeds, and maneuvers?
What is the ratio of proving ground miles to road miles?
How does proving ground A correlate to proving ground B?
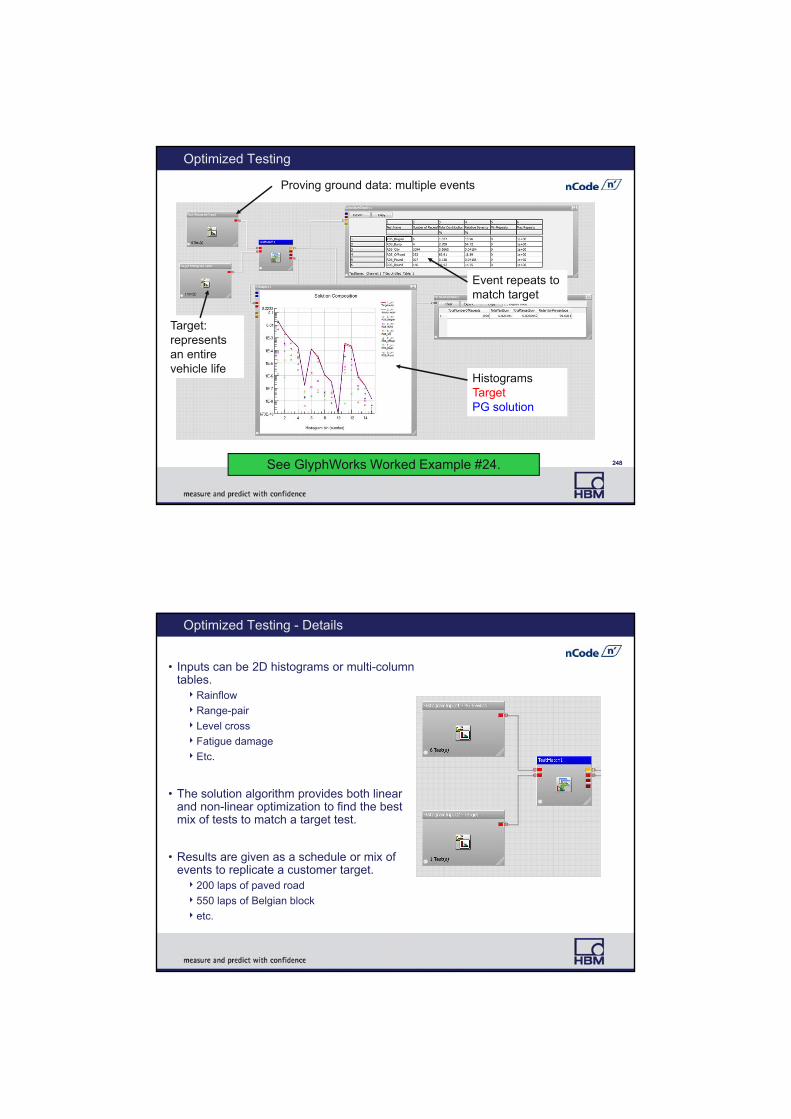
Optimized Testing
248248
Proving ground data: multiple events
Target: represents an entire vehicle life
Event repeats to match target
See GlyphWorks Worked Example #24.
HistogramsTargetPG solution
Optimized Testing - Details
• Inputs can be 2D histograms or multi-column tables.Rainflow
Range-pair
Level cross
Fatigue damage
Etc.
• The solution algorithm provides both linear and non-linear optimization to find the best mix of tests to match a target test.
• Results are given as a schedule or mix of events to replicate a customer target.200 laps of paved road
550 laps of Belgian block
etc.

Hands-on Exercise
Worked Example #24
“Optimized Testing”
Objective: in this exercise, you will learn to….
• Create a GlyphWorks process to define a proving ground schedule that replicates an entire life of a vehicle.
Course Outline
1. Introduction
2. Using GlyphWorks: the basics
3. Importing and exporting data
4. Graphically displaying data
5. Manipulating and analyzing data
6. Editing data and automated anomaly detection
7. Combining tests, runs, or events
8. Super Glyph
9. Miscellaneous
Bas
ic
1. Using Metadata in Calculations
2. Studio Display Glyph for Reporting
3. Advanced Features Fatigue analysis and fatigue editing
Crack Growth
Frequency
Analysis of Rotating Machinery
Accelerated Testing
Optimized Testing
GlyphBuilder
Adv
ance
d
nCode GlyphWorks Training
GlyphWorks GlyphBuilder
What’s the Need for Scripting?
Generally scripting is not necessary because GlyphWorks….
• Handles multiple channels, multiple files, multiple events.
• Has 100+ glyphs that can be combined to analyze data in a multitude of ways.
But sometimes it’s necessary to create your own glyph to….
• Replicate an in-house standard.
• Perform an ‘out of the box’ or specialty analysis.
• Link together GlyphWorks’ capabilities with external applications.
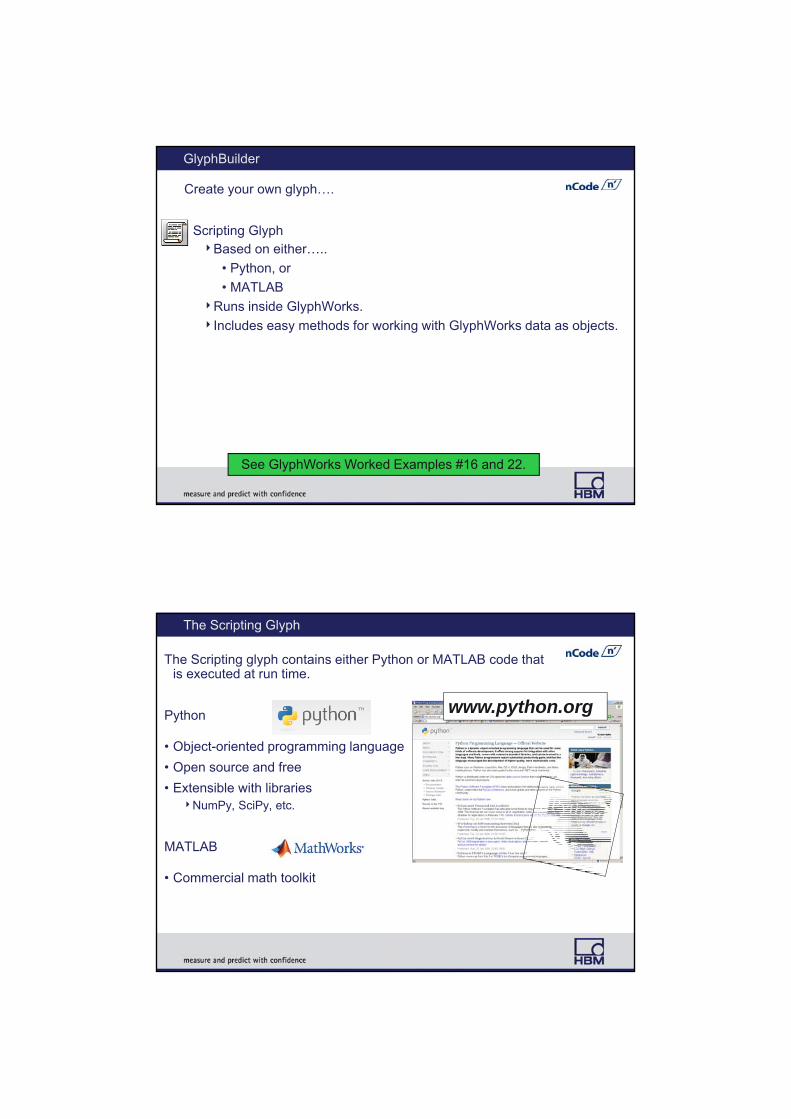
GlyphBuilder
Create your own glyph….
• Scripting GlyphBased on either…..
• Python, or
• MATLAB
Runs inside GlyphWorks.
Includes easy methods for working with GlyphWorks data as objects.
See GlyphWorks Worked Examples #16 and 22.
The Scripting Glyph
The Scripting glyph contains either Python or MATLAB code that is executed at run time.
Python
• Object-oriented programming language
• Open source and free
• Extensible with librariesNumPy, SciPy, etc.
MATLAB
• Commercial math toolkit
www.python.org

How the Scripting Glyph Works with Python
• The Scripting glyph contains Python commands that are executed at run time.
• Includes easy methods for communicating with GlyphWorks. GetInputTimeSeries, CopyMetaData, etc.
How the Scripting Glyph Works with MATLAB
• The Scripting glyph contains MATLAB commands that are executed at run time.
• Read MATLAB data files (.mat) directly.
• Includes easy methods for communicating with GlyphWorks GetInputTimeSeries, CopyMetaData, etc.
MATLAB surface plot
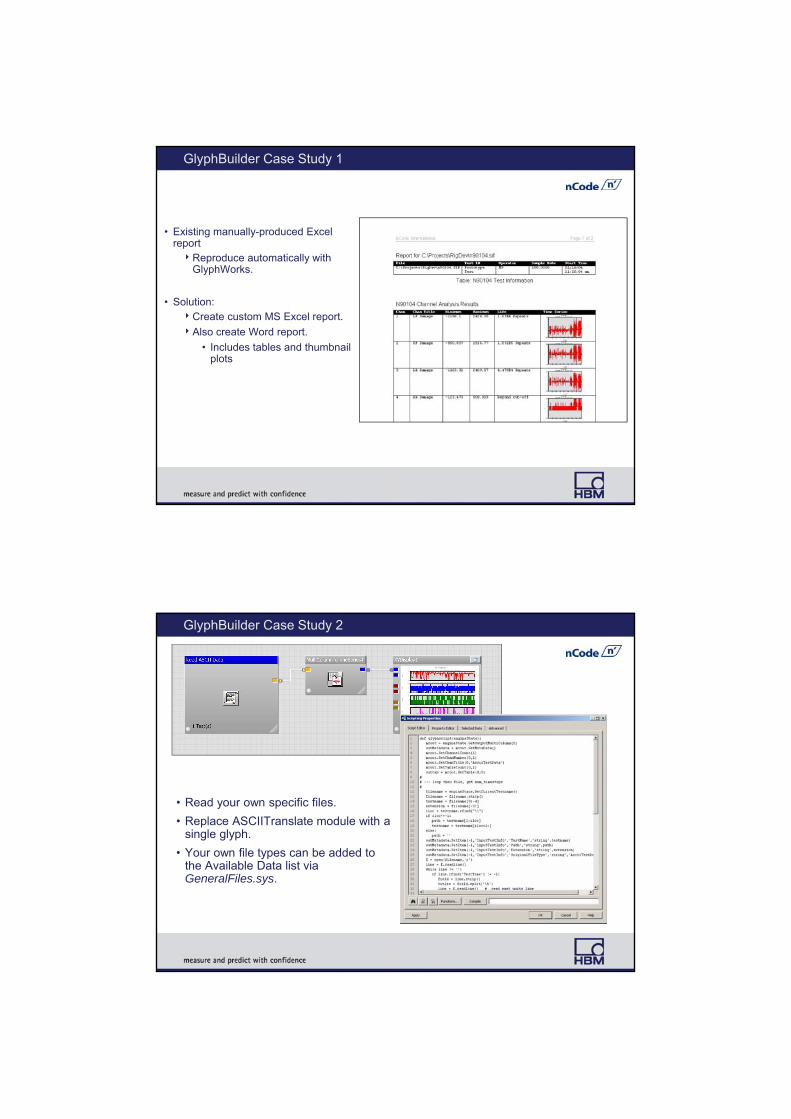
GlyphBuilder Case Study 1
• Existing manually-produced Excel reportReproduce automatically with
GlyphWorks.
• Solution:Create custom MS Excel report.
Also create Word report.
• Includes tables and thumbnail plots
GlyphBuilder Case Study 2
• Read your own specific files.
• Replace ASCIITranslate module with a single glyph.
• Your own file types can be added to the Available Data list via GeneralFiles.sys.
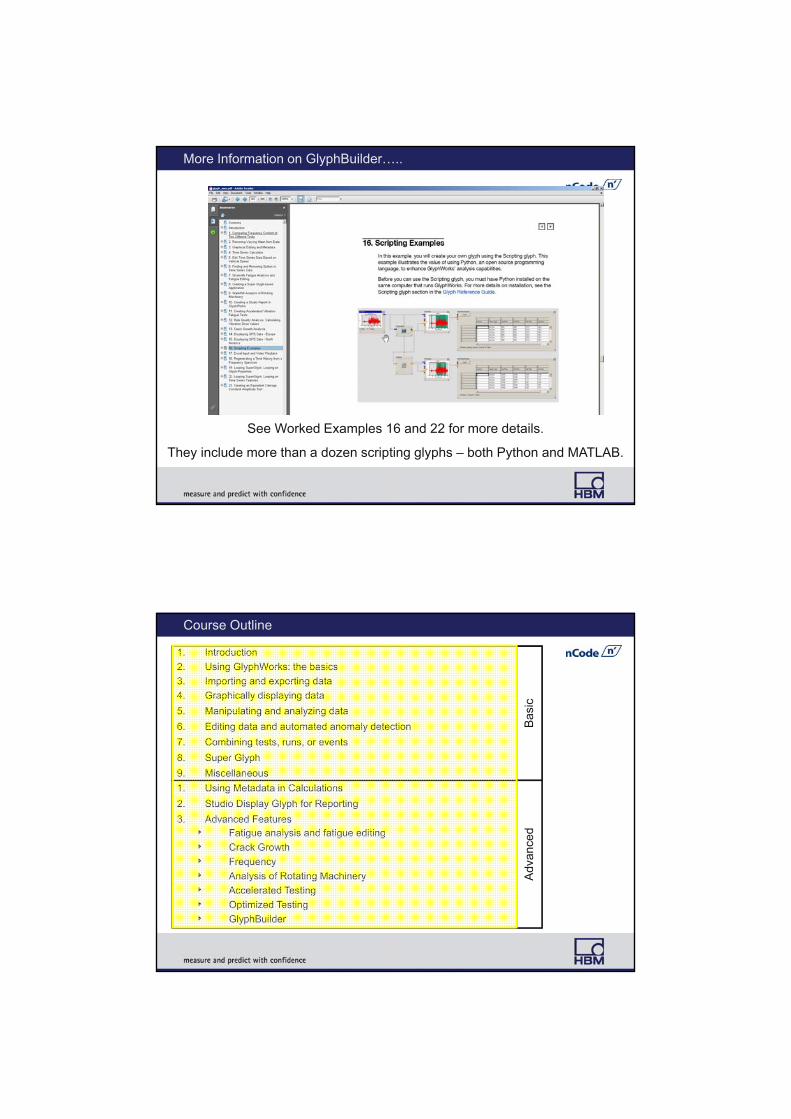
More Information on GlyphBuilder…..
See Worked Examples 16 and 22 for more details.
They include more than a dozen scripting glyphs – both Python and MATLAB.
Course Outline
1. Introduction
2. Using GlyphWorks: the basics
3. Importing and exporting data
4. Graphically displaying data
5. Manipulating and analyzing data
6. Editing data and automated anomaly detection
7. Combining tests, runs, or events
8. Super Glyph
9. Miscellaneous
Bas
ic
1. Using Metadata in Calculations
2. Studio Display Glyph for Reporting
3. Advanced Features Fatigue analysis and fatigue editing
Crack Growth
Frequency
Analysis of Rotating Machinery
Accelerated Testing
Optimized Testing
GlyphBuilder
Adv
ance
d
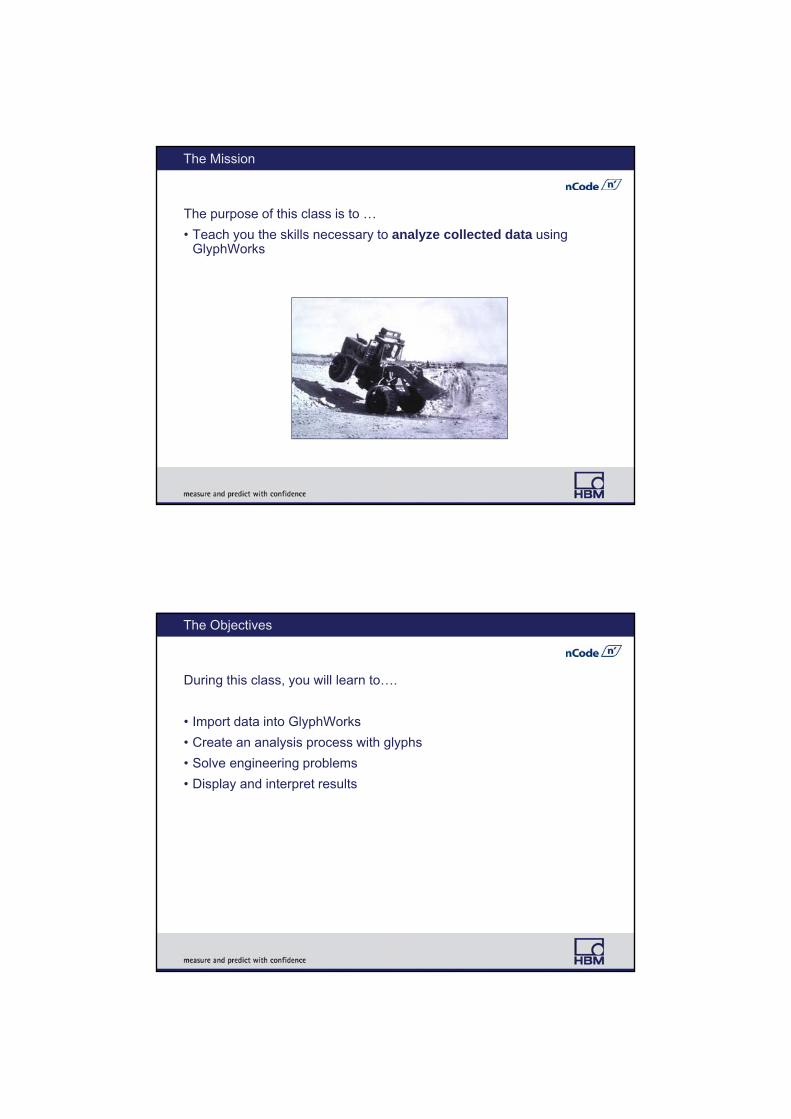
The Mission
The purpose of this class is to …
• Teach you the skills necessary to analyze collected data using GlyphWorks
The Objectives
During this class, you will learn to….
• Import data into GlyphWorks
• Create an analysis process with glyphs
• Solve engineering problems
• Display and interpret results

HBM, Inc. (HBM-nCode)Travelers Tower 126555 Evergreen Rd, Ste. 700Southfield, MI 48076
Tel: (248) 350 8300
HBM United Kingdom Limited (HBM-nCode) Advanced Manufacturing Park Technology Centre, Brunel Way, Catcliffe,Rotherham South Yorkshire S60 5WG
Tel: +44 (0)114 254 1246
nCode Institute
Thank you for your time.
Please provide training feedback at:
www.tinyurl.com/nCodeTrainingFeedback

HBM United Kingdom Limited (nCode Products)Advanced Manufacturing Park Technology Centre Tel: +44 (0) 114 254 1246Brunel Way, Catcliffe, Rotherham Fax: +44 (0) 114 254 1245South Yorkshire, S60 5WG Email: [email protected]
HBM United Kingdom Limited (Test Lab)Unit 20a Molyneux Business Park Tel: +44 (0) 1629 735 821Whitworth Road, Darley Dale, Near Matlock Fax: +44 (0) 1629 735 822Derbyshire, DE4 2HJ Email: [email protected]
HBM (nCode Germany)Carl-Zeiss-Ring 11-13 Tel: +49 (0) 89 960 5372 16D-85737 Ismaning Fax: +49 (0) 89 92 333 92Germany Email: [email protected]
HBM (nCode France)Saint James Park Tel: +33 (0) 13018 20203 chemin de la dîme Fax: +33 (0) 13018 2019F-95700 Roissy en France Email: [email protected]
HBM Inc (nCode Products)26555 Evergreen Road, Suite 700 Tel: +1 (248) 350-8300Southfield Fax: +1 (248) 350-1678MI 48076 Email: [email protected]
HBM (nCode Shanghai Division)Unit 401, Building 9 Tel: +86 (0) 21 6113 3679No.99 TianZhou Road Fax: +86 (0) 21 6125 1313Shanghai 200233 Email: [email protected]
Spectris Co., Ltd. HBM Division (nCode Products)2-2-3 Takasago, Urawa-ku Tel: +81 (0) 48 814 0251Saitama City, Saitama Pref. Fax: +81 (0) 48 814 0252330-0063, Japan Email: [email protected]
www.hbm.com/ncode


