
Global social preferences and the demand for socially responsible products: empirical evidence from a pilot study on fair trade consumers1
Leonardo Becchetti Università Tor Vergata, Roma, Facoltà di Economia, Dipartimento di Economia e Istituzioni, Via
Columbia 2, 00133 Roma. E-Mail : [email protected]
Furio Camillo Rosati Università Tor Vergata, Roma, Facoltà di Economia, Dipartimento di Economia e Istituzioni, Via
Columbia 2, 00133 Roma. E-Mail : [email protected]
We analyze behaviour and motivations of a sample of about one thousand consumers purchasing “fair trade (FT) goods”, i. e. food and artisan goods which include socially responsible (SR) characteristics and a price premium for primary product producers with respect to equivalent non SR products. By estimating a simultaneous two-equation treatment regression model we find that FT products have less than unit income elasticity and their demand is negatively (positively) correlated with geographical distance from the nearest shop (age and awareness of SR criteria). Awareness of SR criteria depends, in turn, on a series of factors (consumption habits, membership of volunteer associations) which, indirectly (via increased awareness), significantly affect consumption. We also measure consumers’ willingness to pay in excess for the SR features of FT products with a contingent evaluation approach and find that it is positively correlated with awareness of SR criteria.
Keywords: fair trade, social preferences, willingness to pay. JEL Numbers: D109, F14, H23
1The paper is CEIS working paper n. 209. MIUR 2002 and 2003 Globalisation project contribution is gratefully acknowledged. A special thank goes to Eleonora d’Agosto, Paola de Meo and Livia Venturini for their precious research assistance. We are gratefully indebted to all those who collaborated to the survey. Among them the CLCs of Grumo Nevano, S.Arpino, Roma, Parma and fair trade world shops of Rome, Albano Laziale, Ostia, Ladispoli, Bari, Eboli, Pavia, Ancona, Milano, Napoli, L’Aquila, Avezzano, Sora, Lodi, Bologna, Trento and Parma. The paper and the research on FT has greatly benefited from comments and suggestions received during presentations at the 2005 Annual meeting of the EARIE and at the 2005 Meeting of the European Center for Studies on Income Inequality (ECINEQ) and at seminars in different seminars held at SOAS in London and at the Universities of Catania, Copenhagen, Macerata, Milano Bicocca, Newcastle, Pisa, Trento and Verona. We thank F. Adriani, M. Bagella, L. Bruni, R. Cellini, L. Debenedictis, L. Lambertini, F. Perali, G. Piga, P. Scaramozzino, R. Sugden, C. Whilborg, L. Zarri and S. Zamagni and all participants to these seminars for comments and suggestions received. The usual disclaimer applies.

2
Global social preferences and the demand for socially responsible products: empirical evidence from a pilot study on fair trade consumers
We analyze behaviour and motivations of a sample of about one thousand consumers purchasing “fair trade (FT) goods”, i. e. food and artisan goods which include socially responsible (SR) characteristics and a price premium for primary product producers with respect to equivalent non SR products. By estimating a simultaneous two-equation treatment regression model we find that FT products have less than unit income elasticity and their demand is negatively (positively) correlated with geographical distance from the nearest shop (age and awareness of SR criteria). Awareness of SR criteria depends, in turn, on a series of factors (consumption habits, membership of volunteer associations) which, indirectly (via increased awareness), significantly affect consumption. We also measure consumers’ willingness to pay in excess for the SR features of FT products with a contingent evaluation approach and find that it is positively correlated with awareness of SR criteria.
Keywords: fair trade, social preferences, willingness to pay. JEL Numbers: D109, F14, H23
1. Introduction The need to explain so many puzzles which cannot be fully accounted for by the standard self-
interested preference approach has led economists to focus their attention on fields such as those of
intrinsic motivation, non pecuniary incentives, inequity aversion and social preferences.
Some recent empirical achievements in these fields are leading to an integration of contract and
principal-agent theories into a broader framework which considers not only pecuniary, but also non
pecuniary incentives to agent’s behaviour (Fehr-Falk, 2002). Without this broadened perspective on
the scope of human action it is hard to explain why pecuniary incentives may not work and how, in
some cases, they may even be crowded out by stronger non pecuniary motivations (Gneezy-
Rustichini, 2000).
An important strand of this new literature analyses how choices of many workers (and consumers),
which are apparently inconsistent with predictions from standard microeconomic theory, may be
3
explained by social preferences.2 Another parallel path of this literature develops models of
reciprocity which try to capture elements of inequity aversion (Fehr-Schmidt, 1999; Fehr and
Schmidt, 2001; Sobel, 2002). The standard inequity aversion literature hinges on the problems of
externalities among coworkers and argues that workers productivity is affected not just by personal,
but also by relative wages (Agell and Lundborg, 1999; Bewley, 1999, Campbell and Kamlani,
1999).
The scope of our paper is to enlarge the research focus in the field of social preferences and inequity
aversion by showing with an empirical analysis how global market integration has led to a
compression of distances and to an enlargement of the potential reference group considered when
social preferences are formulated.3
In our case the focus is shifted from workers to consumers living in global markets. We argue that
the progressive integration and reduction of virtual distances leads a share of “concerned”
consumers to care about distant people, integrating them in the set of their relevant reference group.
In a parallel way, we may conceive our research as extending the concept of inequity aversion to the
behaviour of consumers, by arguing that also their constrained optimisation, exactly as that of
workers, is affected by inequity aversion. The difference in our case is, again, that the reference
group is no longer represented by working colleagues, but by poor producers living in far countries,
which globalisation makes virtually closer.
This extended framework of inequity aversion and social preference theories helps us to explain
why these “socially responsible” consumers are willing to pay more, coeteris paribus, for products
incorporating social goals and, specifically, for supporting inclusion of those who have not in
distant countries of the world.
2 According to a standard definition in the literature "A person exhibits social preferences if he does not only care about the material resources allocated to her but also cares about the material resources allocated to other relevant reference agents" (Fehr-Falk, 2002). 3 On the interaction between globalization and social values see also Whalley (2005).

4
The experiment of our paper consists in building a survey and administering it to a sample of
around one thousand “socially responsible” consumers buying “fair trade” products. FT products
are food and artisan goods which include socially responsible (hereafter, also SR) characteristics
and a price premium for primary product producers with respect to equivalent non SR products (see
section 2 for a detailed definition of FT). These products therefore represent an interesting
benchmark on which consumers’ SR preferences may be tested.
In the survey we are not only able to identify the determinants of expenditure in fair trade products
and the relationship of the latter with traditional (income, distance) and intrinsic motivation related
(knowledge and approval of socially responsible features of the products) factors. We are also able
to measure directly the determinants of the willingness to pay in excess for the socially responsible
features of such products, thereby extracting social preferences of the interviewed consumers.
The paper is divided into six sections (including introduction and conclusions). In the second
section we illustrate the characteristics of fair trade products, focusing specifically on their social
responsibility features. In the third section we illustrate the survey design and present descriptive
findings. In the fourth section we illustrate descriptive findings. In the fifth section we comment our
econometric results. The sixth section concludes.
2. A definition of fair trade Recent surveys seem to show that the reduction of distance induced by technological progress has
increased the importance of global public goods and the sensitiveness of the public opinion toward
social responsibility in general and, more specifically, toward the preservation of the environment
and the fight to poverty in less developed countries.4 This increased awareness has generated a
4 In a recent survey the “2003 Corporate social responsibility monitor” finds that the amount of consumers looking at social responsibility in their choices jumped from 36 percent in 1999 to 62 percent in 2001 in Europe. In addition, more than one in five consumers reported having either rewarded or punished companies based on their perceived social performance and more than a
5
series of “grassroot” welfare initiatives which focus on socially responsible (or socially concerned)
saving and consumption.
One of them is built up by zero profit importers, distributors and retailers (called fair traders)5 of
food and artisan products which have been partially or wholly manufactured by poor rural
communities in developing countries. To be labeled as such, fair trade products need to respect a
series of social and environmental criteria.
The criteria are the following:
i) definition of a “fair price”, which is higher than the market price paid on primary products by
local intermediaries or transnationals in the food industry. This criterion does not necessarily
represent a violation of market principles for two reasons. First, buyers of primary products are
usually highly concentrated and exploit their market power to conclude transactions at prices which
are far below the value of primary producers’ marginal product.6 Second, fair trade products
quarter of share-owning Americans took into account ethical considerations when buying and selling stocks. The Social Investment Forum reports that in the US in 1999, there was more than $2 trillion worth of assets invested in portfolios that used screens linked to the environment and social responsibility. 5 The definition of fair trade considered in this paper is quite different from the traditional meaning of “Fair trade” used in the field of industrial organization. From the 1930s onward (although there are antecedents going back to 1900), in both the US and the UK, the term refers to schemes that industry trade associations used to regulate competition among members, usually by requiring that prices be posted in advance and that no transactions take place except at posted prices. During the Great Depression in the U.S., such schemes were part of the National Recovery Act. In the more recent literature fair trade indicates "arguments that relate to certain conditions under which trade, and the production of traded goods, should minimally take place” (Maseland and Vaal, 2002). In this framework fair trade generally refers to the absence of duties, controls and dumping practices in international trade (for a similar use of the term see also Mendoza and Bahadur, 2002; Bhagwati, 1996; Stiglitz, 2002; Suranovic, 2002).The fair trade products we refer to in this paper are, on the contrary, food and artisan products which obtain the fair trade label since their production process follow some criteria for social and environmental sustainability, established by the movement of fair trade importers and retailers (Moore, 2004). 6 Support for the existence of monopsonistic labour markets for unskilled workers, not just in LDCs but also in developed countries, is provided by several authors (Manning, 2003; Card and Krueger, 2000). Manning (2003) argues that it is not necessary to think of the mining or mill town in the early days of the Industrial Revolution to conceive the existence of monopsony or of thin labour markets. Labour markets may be thin not just in presence of a single employer, but also when employers are few and collude, or in the presence of geographical distance and labour differentiation. The first two cases may well apply to producers in LDCs countries. Evidence of employers’ excess market power in LDCs countries is provided by several empirical papers. Terrell

6
(exactly as “green” products) can be more properly considered as a kind of contingent good, that is,
a bundle of traditional characteristics and SR features, and therefore cannot be compared with
standard non SR products. From this point of view, the introduction of fair trade (hereafter also FT)
products may be seen as reducing market incompleteness and increasing welfare of consumers with
social preferences (or inequity aversion) which did not have the opportunity of buying such
products before;7 ii) opportunity of prefinancing production, therefore breaking the monopoly of
local moneylenders and reducing the impact of credit rationing which severely affects small
uncollateralized producers; iii) price stabilization mechanisms which insulate risk averse primary
product producers from the high volatility of commodity prices; iv) intervention to improve
working conditions and to remove factors leading to child labour, not through a ban on products
incorporating child labour, but through a monetary integration of their low household income;8 v)
preferential inclusion in the fair trade distribution chain of projects reinvesting part of the surplus
and El Hamidi (2001) find that minimum wages reduce inequality and increase employment on a large sample of workers in Costa Rica. Several papers find similar results on minimum wage policies in Brazil (Camargo, 1984; Gonzaga et al., 1999; Carneiro, 2002; Lemos, 2004). We argue that evidence bases on published empirical papers is underestimated because of a selection bias. The more the labour market is informal and characterized by exploitation, the more difficult it is that it can be object of a systematic empirical analysis. To quote evidence from reliable reports not object of systematic empirical research, the US state department signals that in 2003 there were about 109 000 children working in dangerous conditions in Ivory Coast, the source of 4 percent of the world's cocoa. Starbucks financed an independent study of working conditions in the Guatemala coffee sector in 2002. The study was undertaken by the Commission for the Verification of Codes of Conduct (COVERCO) and released in February 2000, reporting extensive violation of labor law in the areas of wages, health care, and hours. COVERCO conducted another report on living and working conditions on Guatemalan coffee plantations in March 2003. However, it should be emphasized that our labour market story is just an example of a more widespread phenomenon. We could think of alternative examples in which self-employed farmers sell their crops to a single exporter. For instance, Conley and Udry 2003, in describing the functioning of the pineapple production in Ghana, report that farmers plant and grow their crops, while an exporter is usually in charge of harvesting and shipping the fruits to Europe. 7 For the theoretical debate of the role and impact of Fair Trade at micro and aggregate level see also Becchetti and Solferino (2004), Hayes (2004) and Leclair (2002). Our empirical analysis will show in the next sections that this welfare effect is significant. Revealed preferences of interviewed consumers show that they buy SR products and that they are willing to pay in excess of market price for the SR features of FT products (see section 5). 8 The child labour literature clearly evidences that the most effective strategy to reduce child labour is represented by raising poor household income. Several empirical studies demonstrate that when

7
arising from the fair price in the provision of local public goods (health, education, job training); vi)
attention to the environmental sustainability of productive processes; vii) full information on how
the price is determined in the different transactions occurring along the value chain; viii) creation of
long run relationships between importers and producers and provision of “business angel” and
export services to the latter (i.e. information about consumers tastes in foreign markets, non tariff
trade barriers, import regulations, etc.) which are essential for building up producer capacity and
technological skills which may eventually evolve toward changes in productive activities. With
respect fair trade may be conceived as a temporary income-support and inclusion mechanism aimed
to promote the transition to higher-return activities (Leclair 2002).
A final “hidden effect” of FT is its capacity of triggering imitation in social responsibility from
traditional producers. Becchetti and Solferino (2003 and 2004) demonstrate that the entry of a FT
producer triggers SR imitation of the profit maximising incumbent in under reasonable parametric
conditions on consumers’ social preferences, in static and dynamic horizontal differentiation
duopolies in which competition is played on prices and social responsibility.
The European Fairtrade Labeling Organization, FLO, certified in 2003 315 organizations,
representing almost 500 first level producer structures and around 1,500,000 families of farmers and
workers from 40 countries (Moore 2004). FT products were sold by 2,700 dedicated outlets (called
world shops) and by 43,000 supermarkets across Europe (7,000 in the US).
FT products have achieved significant market shares in specific segments such as the ground coffee
market in the EU (2%), the banana market in Switzerland (15%) the roast and ground coffee market
in the UK (7.2%) and the tea market in Germany (2.5%) (Moore, 2004, Cafedirect, 2003)
Consistently with predictions on FT indirect effects in the literature, the diffusion of forms
of socially responsible consumption, such as fair trade, is accompanied by a wide range of imitation
household income passes a given threshold, it triggers the decision to send children to school (luxury axiom) (Basu, 1999; Basu and Van, 1998).

8
strategies enacted by traditional producers. Many more companies9 are starting advertising not only
price and quality, but also their socially responsible actions.10 Social labeling and corporate
responsibility is gradually becoming an important competitive feature in real and financial markets.
One of the examples of partial socially responsible imitation is given by the supermarkets
decision of selling FT products. This example is particularly relevant as it helped FT importers to
reduce distributional bottlenecks determined by the limited diffusion of dedicated FT outlets. The
choice of distributing the products also through the large scale distribution has been criticized by
some consumers arguing that social responsibility of world shops is superior (they sell only FT
products and actively promote information about them) to that of supermarkets (they include FT
products within their traditional product range and do not actively promote knowledge of FT
criteria).
Given the social relevance of this phenomenon the goal of our survey is that of studying for
the first time characteristics of FT consumption, including a special focus on the competition
9 On 2003 one of the world's biggest players in the coffee market, the US consumer good company Procter & Gamble, announced it would begin offering Fair Trade certified coffee through one of its specialty brands. Following Procter & Gamble's decision to start selling a Fair Trade coffee, also Kraft Foods, another coffee giant, committed itself to purchasing sustainably grown coffee. Furthermore, Kraft will buy 5m pounds of Rainforest Alliance certified coffee in the first year, according to an agreement between Kraft Foods and the Rainforest Alliance (EFTA Advocacy Newsletter n° 9). In Italy, the Fair Trade certification brand TransFair Italy certifies specific fair trade products sold by consumers good distribution companies and multinationals such as Coop, Carrefour, Sma, Pam, Gs, Conad ( http://www.macfrut.com/ita/conv_2003/relazioni/162benvenuti_f2.pdf). On October the 7th, 2000 the BBC announces that “Nestle has launched a fair trade instant coffee as it looks to tap into growing demand among consumers.” The BBC comments the news saying that “Ethical shopping is an increasing trend in the UK, as consumers pay more to ensure poor farmers get a better deal.” and reports the comment of Fiona Kendrick, Nestle's UK head of beverages, arguing that “Specifically in terms of coffee, fair trade is 3% of the instant market and has been growing at good double-digit growth and continues to grow." 10 Corporate perception by consumers (90 percent of respondents) is by far the most selected item (against ethical values of managers, tax incentives and relationship with stakeholders) when a sample of interviewed socially responsible companies is asked about reasons for their socially responsible behaviour in the “2003 Corporate social responsibility monitor” (downloadable at http://www.bsdglobal.com/issues/sr.asp). This finding is consistent with our hypothesis that ethical imitation is today a relevant competitive feature in product markets.
9
between FT “pioneers” (world shops) and “partial imitators” (large scale distribution) and its impact
on consumers habits and on the willingness to pay for FT products.
3. The survey The survey has been designed with the purpose of studying habits and characteristics of FT
consumers. It has therefore an in built selection bias which excludes from the sample all consumers
not purchasing FT products. If we also consider that the willingness to fill the questionnaire is
expected to be positively related with individuals’ praise for FT initiatives, a second selection bias
may add to the first one.
For these reasons our paper does not aim to evaluate the aggregate relevance of FT purchases.11 Its
first goal is to show the existence of consumers with social preferences and inequity aversion which
purchase fair trade products and are willing to pay in excess for these products with respect to
equivalent ones without socially responsible characteristics. Its second goal is to investigate the
determinants of expenditure in fair trade products, and, in particular, the impact on it of income,
geographical distance and consumers’ awareness of the criteria described in the previous section.
11 Information on this issue can be found on a recent survey on a balanced sample of the Italian population (Demos & Pi / Coop, 2004), showing that 40 percent of the population declares to have purchased at least once in a year FT products and 20 percent to have more frequent purchasing habits of these products. In a parallel UK survey, Bird and Hughes (1997) classify consumers as ethical (23 percent), semi-ethical (56 percent) and selfish (17 percent). 18 percent of the surveyed consumers declares to be willing to pay a premium for SR products. In Belgium De Pelsmacker, Driesen and Rayp (2003) show, on a representative sample, that 10 percent of consumers are willing to pay the positive price difference between a fair trade and a traditional coffee. In February 2004, a research undertaken by the market research company TNS Emnid in Germany on a representative sample of the population finds that 2.9% of those interviewed buy Fair Trade products regularly, 19% rarely, and 6% almost never. 35% of respondents said they support the idea, but do not buy (www.fairtrade.net/sites/aboutflo/aboutflo). On the crucial role of ethical consumers in Fair Trade see also Hayes (2004).
10
The questionnaire on which our survey is based12 includes questions about: i) purchasing habits of
FT consumers; ii) awareness of the eight FT criteria; iii) qualities and/or disservices in the FT
product chain; iv) consumers’ willingness to pay in excess for the SR features of FT products.
The survey contains several controls which allow us to rule out inconsistent answers. A first filter is
for consumers declaring that they buy products for their informational transparency at question 7
and judge information on products absolutely insufficient at question 9. The second filter is for
consumers which provide inconsistent responses while answering to questions 6 and 20, in which
they are asked whether they purchase their products in both world shops and supermarkets. The
third filter is about the knowledge of the fair price criteria asked in both questions 15 and 27.1. The
fourth filter is obtained by combining information from question 18 (knowledge that products are
also sold in the large scale distribution) and question 20 where consumers are asked to judge the
production range in the large scale distribution. The use of these filters leads to the exclusion from
the sample of a total of 42 consumers giving inconsistent answers.
4. Descriptive findings
4.1 Expenditure habits
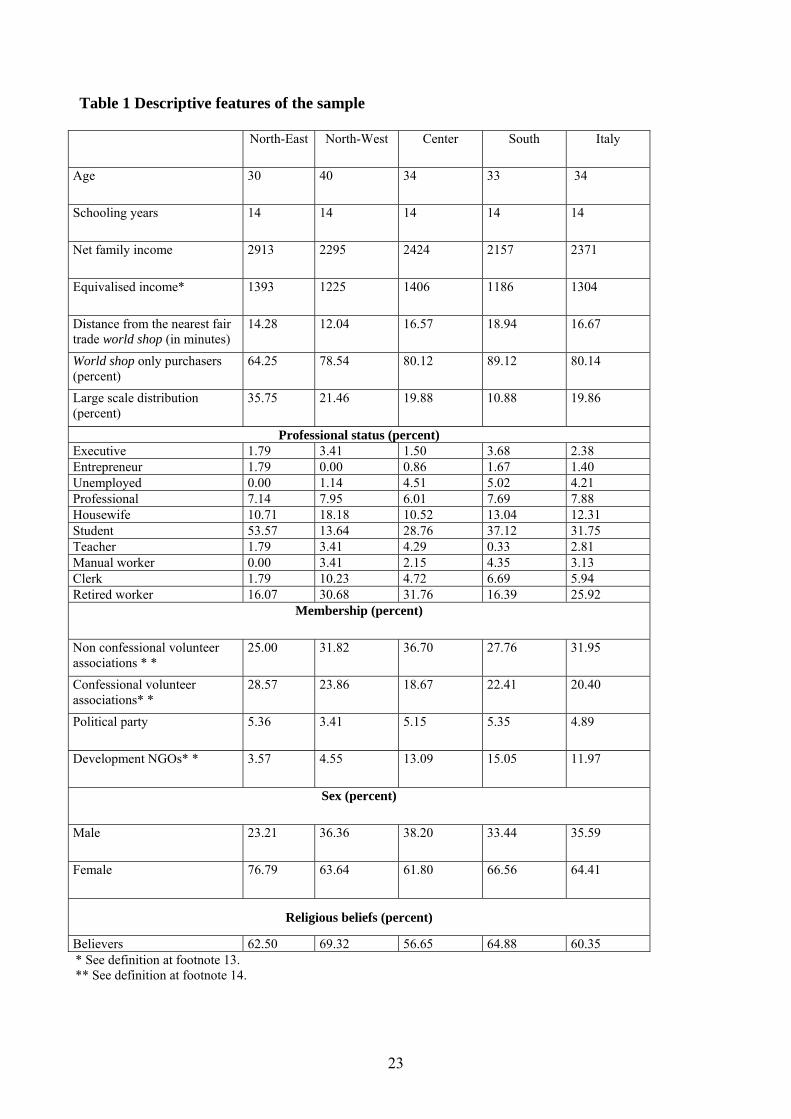
Descriptive findings, summarized in Table 1, show that the average net family income13 in the
sample is 2,371 euros, while equivalised income14 is 1,304 euros. The average number of schooling
years is 14 (corresponding to the first year of University in the Italian education system). Average
distance from the nearest FT outlet is around 17 minutes. Around 80 percent of the interviewed
consumers declare to buy in world shops only. About 20 percent of them are students. The second
largest group is that of retired workers (26 percent), followed by housewives (12 percent) and
12 The questionnaire is attached in the Appendix C. 13 Average net family income is calculated as monthly after tax (wage) family income minus or plus all other (nonwage) monthly income flows (i.e. mortgages, housing rents, etc.) 14 We compute equivalised income by using the OECD approximation in which any additional adult is weighted .5 and any children .3 [AE = 1 + 0.5 (Nadults – 1) + 0.3 Nchildren]. We conventionally assume that the second component of the family is an adult and those from the third on are children.

11
professionals (8 percent). 32 percent of them are members of non confessional volunteer
associations, 20 percent of confessional volunteer associations, 12 percent of development NGOs.15
60 percent believe in God. Females are slightly less than two thirds of the sample.
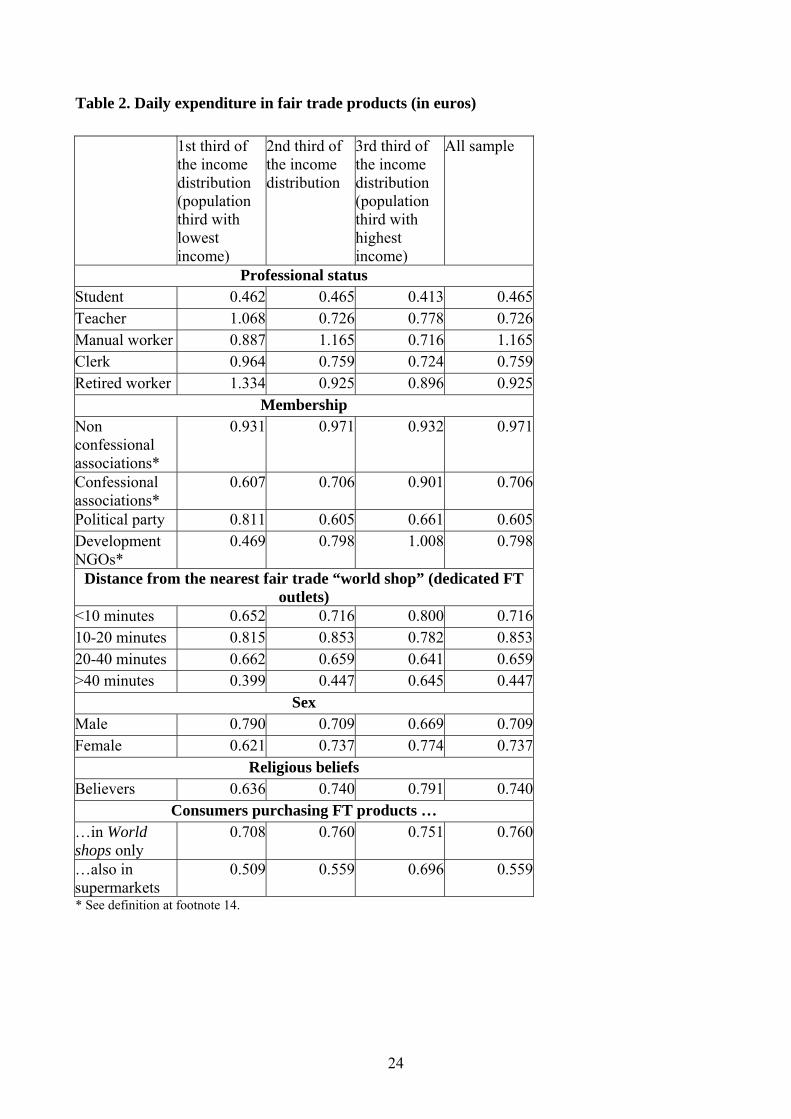
A first important descriptive finding is the average expenditure for Fair Trade products, 75 cents per
day, which amounts approximately to 20 euros per month. Those who spend more are members of
non confessional associations (97 cents) and retired workers (92 cents) (Table 2). As expected,
distance matters and those at more than 40 minute distance from the FT retail shop spend slightly
more than half of those within the 10-20 minute distance from it (.45 against .85 euros daily). In
Table 2 we also observe that average expenditure in fair trade products remains flat when income
changes. The only exception seems to be that of members of confessional associations, whose
expenditure turns from .60 to .90 euros, when moving from the lowest to the highest income
bracket.
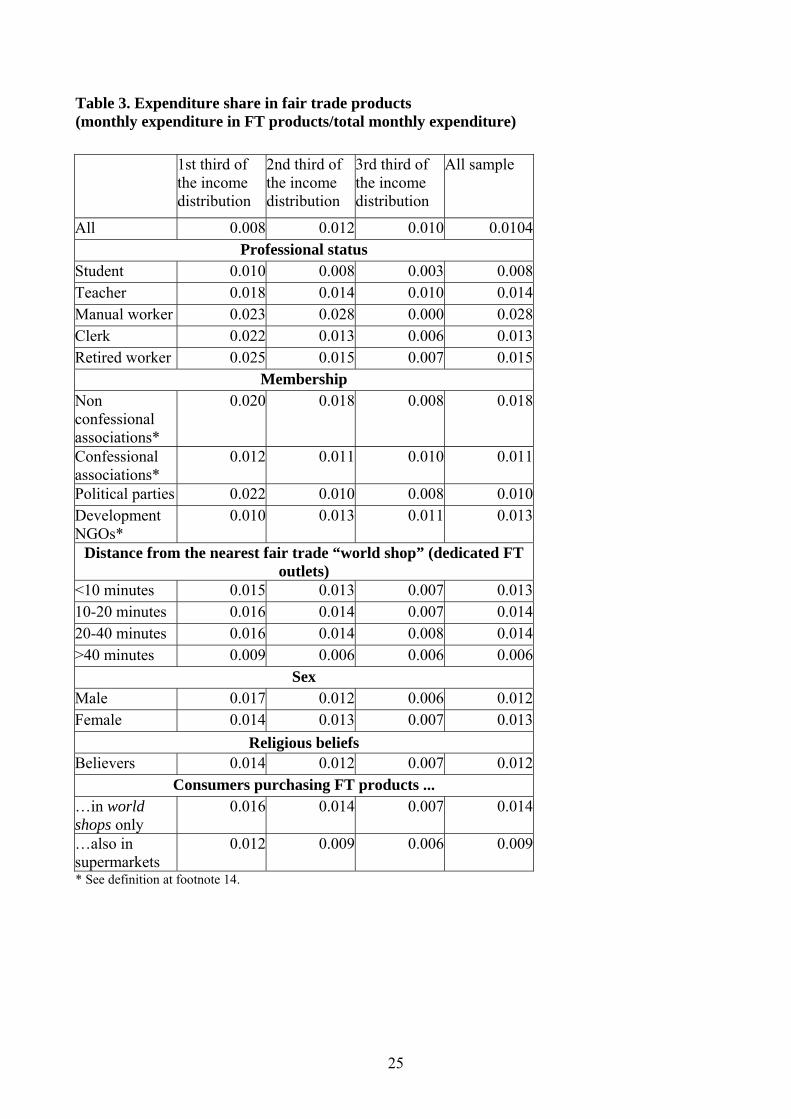
The average expenditure share on family income for fair trade products in the sample is around 1
per cent (Table 3). The share goes up to 1.8 percent for members of non confessional associations
and drops from 1.3 to 0.6 respectively from consumers at no more than 16, to those at more than 40
minute distance. This figure seems very low but we must consider that world shops are not so
widespread and that only a limited range of food and artisan products may be purchased (i.e. tea,
coffee, sugar, pasta, etc.).16
15 For (non) confessional associations we mean stable organisations of individuals with their own legal statute, in which there is explicit reference to the (non) religious motivations which determined their birth and animate their life. These associations may or may not be involved into domestic and international activities working in the field of social justice and sustainable development. For development NGOs we mean organisations which, differently from the above mentioned associations, have an international activity in the field of social justice and sustainable development as their specific goal and reason of existence. 16 In 2004 the average monthly expenditure of the Italian consumer for the range of food products which can be bought in world shops was estimated to be around 32.8 euros. Hence, by imputing an expenditure share of 1/3 to artisan products on the total of FT expenditure (20 euros on average), we can roughly evaluate that FT consumers in our sample shifted, on average, around 45% of the relevant consumption share from non FT to FT products.
12
These first descriptive findings seem to show that distance from the nearest outlet has effects on
consumption, as it is expected to be for food products which must be purchased with some
frequency in time. They also show that, at the moment, fair trade products are far from being luxury
goods, as it is generally believed by the traditional press due to their nonnegative price differential
with respect to equivalent non SR products. Based on our descriptive evidence, the purchasing habit
of FT products seems to be still conceived as a symbolic action implemented with a lump sum
consumption almost insensitive to income.
4.2 Awareness of SR criteria
A crucial competitive factor for socially responsible vis à vis traditional products is consumers’
knowledge and awareness of the SR features of the products.
As already specified in the previous section we may identify at least eight socially responsible
criteria in FT products (see section 2). The first criterion is that of fair price. Consumer awareness
of this criterion is the highest (75 percent) and jumps to 82-83 percent for volunteers actively
involved in either confessional and non confessional associations (Table 4).
When we move to a second important criterion (prefinancing of production) we observe a dramatic
drop in awareness (36 percent), which goes up to 57 percent for volunteers actively involved in non
confessional associations and down to 31 percent for manual workers. Knowledge of the price
stabilization criteria is even lower (30 percent), down to 24 percent for teachers and retired workers
and up to 42 percent for members of non confessional associations. 53 percent among volunteers
working in non confessional associations (from now on also non confessional volunteers), but only
35 percent among students, know that through FT products it is possible to increase investment in
public goods in local producers communities. Knowledge of the commitment to improve producers
working conditions (and to fight child labour through integration of household income) is much
more widespread, up to 80 percent among non confessional volunteers and back to 52 percent

13
among manual workers. Commitment to environmental sustainability is perceived by around 52
percent of the sample (63 percent among volunteers and 38 percent among manual workers),
informational transparency by 40 percent of the sample (57 percent of non confessional volunteers
and only 46 percent of students), while the FT’s capacity of building of long run relationship with
provision of export services only by 27 percent of the overall sample (23 percent among students
and 41 percent among non confessional volunteers).
4.3 Evaluation of fair trade rules and policies
Independence and heterogeneity of retail outlets seem to be a value for consumers, since only 35
percent of them would be happy if products were to be sold in franchising. This value drops to 27
percent for volunteers in non religious associations, while it goes up to 50 percent for those active in
political parties. The share of consumers which would welcome a common ethical label in Europe
is much higher than 50 percent and goes up to 88 percent for teachers. These results may be
interpreted by arguing that SR consumers desire uniformity and easy recognition in label standards
since it may contribute to solve the problem of informational asymmetry, but prefer variety when it
comes to retailers characteristics.17 Descriptive findings on this specific point are obviously subject
to a selection bias since all those interviewed are world shop customers.
4.4 The relationship between dedicated fair trade outlets (”world shops”) and supermarkets
The importance of the role of distance when selling food products introduces one of the dilemmas
of the fair trade movement. World shops have very thin margins (usually reinvested in education
projects) and their diffusion depends on the strength of seller’s preferences for solidarity more than
17 Extended descriptive evidence on these points is omitted for reasons of space and available from the authors upon request.

14
on profit maximizing behaviour. Producers’ “solidarity spirits” must be much stronger than those of
FT consumers since starting up and operating a business requires much more effort and motivation
than just purchasing FT products. This explains why FT retail outlets are not so widespread. This
distributional bottleneck is a serious problem when selling food products which are generally
purchased (at least some of them) with high frequency and within a limited distance from
consumers residence. Fair trade importers have therefore started to use large scale distribution
(together with world shops) to sell their products, even though many consumers and producers find
it contradictory with their principles (or, at least, would require large scale distribution to adopt the
same SR criteria of the FT value chain).
Our survey investigates consumers’18 perception of the problem finding that 67 percent of them
knows that products are sold also in the large scale distribution, but only 17 percent buys them also
there. The share of those favourable to buy from the large scale distribution would become higher
(around 50 percent), would the latter adopt the same criteria of the fair trade movement (Tables are
omitted for reasons of space and available upon request).
4.5 Evaluation of the quality of products and services of the FT chain
Consumers identify the reduced range of FT products as the main problem when interviewed about
the quality of products and services in the FT chain (31 percent of the overall sample, up to 38
percent for entrepreneurs and down to 22 percent for retired workers) (Table 5). A second concern
is about location of FT outlets (28 percent of the sample). As expected this figure goes up to 45
percent for consumers at more than 40 minute distance from the nearest FT shop and up to 40
percent for those purchasing FT products also in the large scale distribution. A smaller share of
consumers (higher in case of professionals and students) complains about the absence of online
sales (13 percent). 12 percent of consumers points out the limited opening time of FT shops (12
15
percent). This problem is more important for executives (27 percent). Complaints about lack of
courtesy and scarce competence of the world shop personnel come only from, respectively, 5 and 9
percent of the sample.
5. Econometric findings
All results presented so far in the descriptive analysis are obviously subject to composition effects
(the close relationship between two variables may be affected by a third hidden factor strongly
associated to one of them). To evaluate the statistical and economic significance of the net effect of
each factor on a given dependent variable we provide econometric estimates in the sections which
follow.
5.1 The treatment regression model for the evaluation of direct and indirect determinants of
FT consumption
When in a first econometric exercise we look with two separate estimates at the determinants of the
demand for FT products and of awareness of FT criteria we find that the dependent variable of the
second regression (awareness of FT criteria) has a strong and significant impact on the dependent
variable of the first regression (demand for FT products).19 We therefore realise that we need to
estimate jointly the two regression model if we want to disentangle the direct effect of a regressor
(e.g. membership to an association of non confessional volunteers) on the demand for FT products,
from its indirect effect via increased awareness of FT criteria.
The best candidate for addressing these linkages is a treatment effect model estimated with a full
maximum likelihood. The model considers the effect of an endogenously chosen binary treatment
18 Remember that all our consumers are interviewed outside world shop outlets. 19 In order to control for the robustness of this findings to endogeneity and reverse causality we also performed an instrumental variable estimate where knowledge of the FT criteria is instrumented by the length of purchasing habits in the world shop, since the latter variable is definitely determining the former, while not being at risk of being caused by current FT expenditure. Results are omitted for reasons of space and available from the authors upon request.
16
(in our case the knowledge of at least 5 FT criteria)20 on another endogenous continuous variable
(the demand of FT products), where the two endogenous variables are conditional on two sets of
independent variables.
More formally, we write the system as
(1.1)
( ) ( ) ( ) ( )
( )
0 1 2 3 4 5 6
1
7 81 1
log( ) log( ) log log log log
log
i i i i i
n m
i j j k i ij k
Y Male Distance Income Age School FidelWS
FidelLS Awareness Macroarea X
α α α α α α α
α α γ δ ε−
= =
= + + + + + + +
+ + + +∑ ∑
(1.2)( ) ( ) ( ) ( )
( )
0 1 2 3 4 5
1
61 1
log log log log
log
i i i i i
n m
i j j k i ij k
Awareness Male Income Age School FidelWS
FidelLS Macroarea X v
β β β β β β
β θ ξ−
= =
= + + + + + +
+ + +∑ ∑
where in (1.1) Yi is the daily expenditure in FT products of the ith consumer, Distance is the
distance from the nearest FT world shop, Income is consumer family income, Age is consumer age,
School is the number of schooling years, FidelWS and FidelLS are, respectively, the duration of
purchasing habits in the FT world shop and in the large scale distribution. To these regressors we
add three geographical dummies measuring respectively consumer location in the North-East,
North-West or South area and a set of additional controls (the variables Xi) for professional status,
faith and membership.
In (1.1) Awareness is a dummy which takes the value of one if consumers know at least five of the
eight FT criteria and zero otherwise. Awareness is also the binary dependent variable of the second
equation (1.2) of the system, where regressors are all those of the first equation (with the obvious
exception of the Awareness and Distance variables). In the two equation system (v) and (ε) are
bivariate normal random variables with zero mean and covariance matrix 1
σ ρρ⎡ ⎤⎢ ⎥⎣ ⎦
. The likelihood
function for the joint estimation of (1.1) and (1.2) is provided by Maddala (1983) and Green (2000).
20 We arbitrarily define this threshold but we also make a sensitivity analysis around it looking at
17
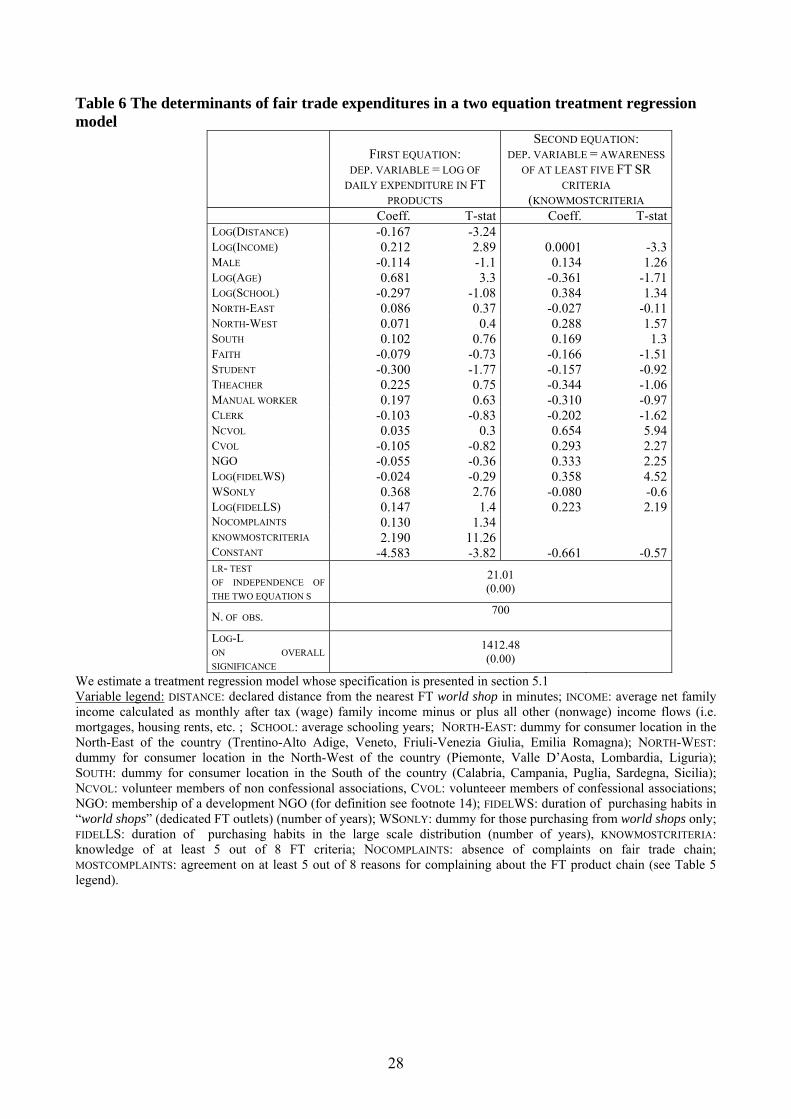
Results of the simultaneous two equation treatment regression model confirm the validity of our
specification choice (Table 6). The null hypothesis of the independence of the two equations (ρ=0)
is rejected by the LR test confirming the need of estimating them jointly. Awareness of at least five
of the eight FT criteria has the strongest impact on the demand for FT products among regressors of
the first equation raising three times the amount of expenditure, net of the impact of additional
controls. By inspecting the effects of other regressors we find that membership of non confessional
and confessional volunteers association affects demand for FT products not directly, but only (and
quite significantly) through awareness of FT criteria. Coefficient magnitudes indicate that the first
variable (non confessional association membership) raises by 65 percent the likelihood of being
aware of at least 5 criteria which, in turn, raises FT expenditure by a factor of three in the first
equation. Hence, its indirect impact on the last variable is expected to be of the order of 195
percent. A similar result is found for the impact of duration of purchasing habits in a world shop.
This variable affects the demand for FT products not directly, but via awareness of FT criteria.
These results confirm that dedicated FT outlets effectively perform their role of increasing sales
through enhanced awareness of SR features of FT products. Consider though that purchasing habits
in the large scale distribution significantly affect awareness as well, but with a coefficient which is
lower than that of habits in world shops.
We also find that income has a direct positive effect on the demand for FT products, while it affects
negatively the treatment variable (awareness of FT criteria). Hence, FT products are more sensitive
to income than what appears to be when we do not consider that richer consumers are less aware of
FT criteria. Similar opposite effects are found for age, which has a positive direct effect on
expenditure, but a negative indirect effect through reduced awareness of FT criteria. With regard to
the age effect, it is impossible to understand, in our cross-sectional estimate, whether the age-
awareness relationship hides a cohort effect or not. We strongly suspect that this is the case, if we
the impact of the knowledge of 4 or 6 criteria. Results are substantially unchanged and are available from the authors upon request.
18
consider that knowledge of fair trade is more widespread among the young and that fair trade itself
is a quite recent phenomenon. This may lead us to believe that fair trade purchases should rise in the
future, assuming that the current generation will buy more once becoming older and wealthier.21
An important policy suggestion which this joint estimate may reveal is that the growth in awareness
of FT criteria by older and wealthier consumers may have a strong potential impact on FT product
demand.
5.2 The determinants of complaints about overall quality of FT chain
To identify the determinants of complaints on the overall quality of the FT chain we estimate the
following probit model
( ) ( ) ( ) ( )
( )
0 1 2 3 4 5 6
3 1
71 1
log( ) log log log log
log
i i i i i
n
i k k k i ik j
Y Male Distance Income Age School FidelWS
FidelLS Macroarea X
α α α α α α α
α β γ ε−
= =
= + + + + + + +
+ + +∑ ∑(2)
where Yi is a dichotomic variable which takes the value of one if consumers respond affirmatively
about perception of the disservice i (i=limited range of food, limited range of clothing, limited range
of giftware, absence of on-line sales, scarce professional experience of world shop personnel,
unsatisfactory location of the FT outlet, reduced opening time of world shops, scarce courtesy of
world shop personnel) and regressors are those described in section 5.1.
A first relevant finding is that distance from the nearest FT outlet positively affects the probability
of complaining about distance (Table 7). This is an important control of the quality and reliability
of the distance variable. Family income is significantly and positively related to complaints on
distance and on the limited range of FT products. The limited range of products is also a concern for
volunteers in non confessional associations. A quite relevant point is that purchasing habits of FT
21 Consider that we measure net income but we do not have any proxy of wealth which could be correlated with age, thereby explaining part of the significant age effect in our estimates.
19
products in the large scale distribution have significant impact on the probability of complaining
about the limited range of FT products. Consumers location in the South also has significant and
positive effects on the likelihood that consumers complain about the limited range of food and
artisan products and negative impact on the probability of complaining about scarce competence of
world shop personnel.
5.3 The determinants of the willingness to pay for SR features of FT products
In our questionnaire consumers are asked to indicate their willingness to pay in excess for FT
products with respect to equivalent products without SR characteristics.22
The demand is repeated imagining different distances between the two competing products and
considering the alternative of FT products sold in the large scale distribution and not in world
shops (questions 29-34 in the questionnaire reported in the Appendix C).
As it is well known the literature on contingent valuation highlights some potential biases arising
from the investigation of the willingness to pay for a given good based on a direct demand on it
from survey data Mitchel-Carson (1989) Diamond-Hausman (1994). A first bias is represented by
strategic behaviour when the responder knows that his response may affect the decision on the
quantity of a public good and service provided. A second bias arises when the hypothetic scenario
prospected by the interviewed is too unrealistic. The bias may be reduced if the respondent is
familiar with such scenario. A third bias is the so called “embedding effect”. Many empirical results
show that quantitative responses tend to be strikingly similar in spite of the different situations
presented within the same scenario. The rationale is that the individual have a clear idea of their
general WTP for a given good, but not on its exact quantitative amount and on its variation
22 In a technical Appendix available upon request (Appendix A) we show that, given a reasonable specification of consumer preferences, this question exactly measures the relative weight of the social preference argument in consumer’s utility function.

20
according to changes in the side conditions prospected in the hypothetical demands. The fourth is an
upward bias on WTP findings generated by the desire of the respondent to please the interviewer.
Given the structure of our survey, we believe that answers on the willingness to pay for the SR
features of FT products are likely to be affected mainly by the last two biases. Such biases are more
likely to distort the quantitative data on the willingness to pay and the total number of positive
responses while they should not affect the signs of the determinants of the willingness to pay in
econometric estimates For this reason we focus on econometric findings and not on descriptive
results on the average WTP declared by sample respondents (a detailed discussion of this last
finding is nonetheless discussed in Appendix A).
We therefore estimate the determinants of consumer willingness to pay in excess for the socially
responsible features of the product following a treatment regression approach similar to that shown
in section 5.1
(3.1)
( ) ( ) ( ) ( ) ( )
( )
0 1 2 3 4 5 6
1
7 81 1
( ) log log log log log
log
ijl ij i i i i
n m
i i r r k i ijlr k
Log Wpaysoc Virtdist DLS Income Age School FidelWS
FidelLS Awareness Macroarea X
α α α α α α α
α α γ δ ε−
= =
= + + + + + + +
+ + + +∑ ∑(3.2)
( ) ( ) ( ) ( )
( )
0 1 2 3 4 5 6
1
71 1
log( ) log log log log
log
i ij i i i i
n m
i j j k i ij k
Awareness Male Virstdist Income Age School FidelWS
FidelLS Macroarea X v
β β β β β β β
β θ ξ−
= =
= + + + + + + +
+ + +∑ ∑where (in 3.1) Wpaysocijl is a continuous variable measuring the declared willingness to pay in
excess for the SR features of the FT product of consumer i at the jth (0, 15, 30 minute) virtual
distance from the lth type of (FT dedicated outlet or supermarket) retailer. Virtdistij is the jth virtual
distance at which the consumer i is expected to buy the product, DLS is a dummy taking the value
of one if the product is “virtually” purchased in the large scale distribution and zero otherwise.
Other regressors are defined as in section 5.1.
Consider that the specific structure of our model is such that any individual i (i=1,..,n) gives j*l
different answers with (j=1,..,3) and (l=1,2) for a total number of n*6 observations. Estimating the
21
model with a standard least square procedure would not keep into account that observations are
correlated within individuals, thereby leading to an underestimation of the variance (i.e. the
residual variance of the 6 responses given by the same individual is expected to be lower because
observations are correlated). Therefore we correct with the clustering approach our standard errors
incorporating the assumption that observations are dependent within individuals.
Another difference with the previous model is that virtual distance and virtual purchasing place
(world shops or supermarkets) do not obviously enter in the second equation.
As in the case of the demand for FT products (Table 6), the independence between the two
equations is not rejected, even though at a lower level of significance (Table 8). Furthermore, we
find that purchasing the product from the large scale distribution reduces by 47 percent the declared
willingness to pay in excess, while doubling the virtual distance reduces it by 24 percent.
Awareness of FT criteria is, again, a crucial variable. Knowledge of at least 5 of the 8 fair trade
criteria23 raises by 77 percent the willingness to pay in excess for FT products. No other variables
are significant in the first equation.
In the second equation awareness of fair trade criteria is affected by several regressors. The
probability of knowing at least 5 of the 8 FT criteria is 47 percent lower when age doubles, 67
percent (25 percent) higher for volunteers in non confessional (confessional) associations, 18
percent higher when duration of consumption habits in world shops doubles. Duration of
consumption in supermarkets has no impact on the willingness to pay.24
6. Conclusions
23 We perform a robustness check to see how our findings are sensitive to a change in the number of criteria used to define our dichotomous variable. Results are substantially unchanged in sign and significance (and slightly in magnitude) if we consider four or six criteria. These findings are omitted for reasons of space and available from the authors upon request. 24 We perform individual equation estimates on the determinants of the willingness to pay in excess where each FT criteria enters individually in the equation. With this approach we find that the two criteria affecting more the dependent variable are the local public good investment and long run relationship criteria. Results are omitted for reasons of space and available from the authors upon request.
22
The compression of distance generated by global integration of real and financial markets is
inevitably going to enlarge the reference group considered by individuals’ having “social
preferences”. If previous research showed that workers and consumers decisions were not taken in
isolation, but crucially considering status and choices of peers and neighbours, our paper shows that
in the era of global market integration the reference group is inevitably going to be much broader.
We in fact show that consumers in industrialised countries may be affected in their choices by the
sense of solidarity and interdependence with distant people.
More specifically, we illustrate that this subgroup of “concerned consumers” is ready to pay more
for the SR features of a special kind of products (FT products), aimed at supporting development
and inclusion in global markets of commodity producers in distant countries.
Results from our estimates highlight that awareness of socially responsible criteria is a fundamental
competitive factor of FT products. If this is the case, their demand needs to be properly estimated
with a simultaneous model in which consumption is affected directly by various controls (including
income and geographical distance from the nearest outlet) and, indirectly, by all those factors
significantly affecting awareness of socially responsible criteria.
Our findings also show that the behaviour of world shops (investing much more in education of
consumer awareness than in traditional marketing policies) is rational, given the specific features of
their product.
Finally, obtained results suggest that the future development of the FT chain depends on two crucial
issues: i) the capacity of the FT movement of extending its outreach when investing in promotion
and knowledge of FT products; ii) the solution of the problem of distributional bottlenecks of FT
products.
23
Table 1 Descriptive features of the sample
North-East North-West Center South Italy
Age 30 40 34 33 34
Schooling years 14 14 14 14 14
Net family income 2913 2295 2424 2157 2371
Equivalised income* 1393 1225 1406 1186 1304
Distance from the nearest fair trade world shop (in minutes)
14.28 12.04 16.57 18.94 16.67
World shop only purchasers (percent)
64.25 78.54 80.12 89.12 80.14
Large scale distribution (percent)
35.75 21.46 19.88 10.88 19.86
Professional status (percent) Executive 1.79 3.41 1.50 3.68 2.38 Entrepreneur 1.79 0.00 0.86 1.67 1.40 Unemployed 0.00 1.14 4.51 5.02 4.21 Professional 7.14 7.95 6.01 7.69 7.88 Housewife 10.71 18.18 10.52 13.04 12.31 Student 53.57 13.64 28.76 37.12 31.75 Teacher 1.79 3.41 4.29 0.33 2.81 Manual worker 0.00 3.41 2.15 4.35 3.13 Clerk 1.79 10.23 4.72 6.69 5.94 Retired worker 16.07 30.68 31.76 16.39 25.92
Membership (percent)
Non confessional volunteer associations * *
25.00 31.82 36.70 27.76 31.95
Confessional volunteer associations* *
28.57 23.86 18.67 22.41 20.40
Political party 5.36 3.41 5.15 5.35 4.89
Development NGOs* * 3.57 4.55 13.09 15.05 11.97
Sex (percent)
Male 23.21 36.36 38.20 33.44 35.59
Female 76.79 63.64 61.80 66.56 64.41
Religious beliefs (percent)
Believers 62.50 69.32 56.65 64.88 60.35 * See definition at footnote 13. ** See definition at footnote 14.
24
Table 2. Daily expenditure in fair trade products (in euros) 1st third of
the income distribution (population third with lowest income)
2nd third of the income distribution
3rd third of the income distribution (population third with highest income)
All sample
Professional status Student 0.462 0.465 0.413 0.465Teacher 1.068 0.726 0.778 0.726Manual worker 0.887 1.165 0.716 1.165Clerk 0.964 0.759 0.724 0.759Retired worker 1.334 0.925 0.896 0.925
Membership Non confessional associations*
0.931 0.971 0.932 0.971
Confessional associations*
0.607 0.706 0.901 0.706
Political party 0.811 0.605 0.661 0.605Development NGOs*
0.469 0.798 1.008 0.798
Distance from the nearest fair trade “world shop” (dedicated FT outlets)
<10 minutes 0.652 0.716 0.800 0.71610-20 minutes 0.815 0.853 0.782 0.85320-40 minutes 0.662 0.659 0.641 0.659>40 minutes 0.399 0.447 0.645 0.447
Sex Male 0.790 0.709 0.669 0.709Female 0.621 0.737 0.774 0.737
Religious beliefs Believers 0.636 0.740 0.791 0.740
Consumers purchasing FT products … …in World shops only
0.708 0.760 0.751 0.760
…also in supermarkets
0.509 0.559 0.696 0.559
* See definition at footnote 14.
25
Table 3. Expenditure share in fair trade products (monthly expenditure in FT products/total monthly expenditure) 1st third of
the income distribution
2nd third of the income distribution
3rd third of the income distribution
All sample
All 0.008 0.012 0.010 0.0104Professional status
Student 0.010 0.008 0.003 0.008Teacher 0.018 0.014 0.010 0.014Manual worker 0.023 0.028 0.000 0.028Clerk 0.022 0.013 0.006 0.013Retired worker 0.025 0.015 0.007 0.015
Membership Non confessional associations*
0.020 0.018 0.008 0.018
Confessional associations*
0.012 0.011 0.010 0.011
Political parties 0.022 0.010 0.008 0.010Development NGOs*
0.010 0.013 0.011 0.013
Distance from the nearest fair trade “world shop” (dedicated FT outlets)
<10 minutes 0.015 0.013 0.007 0.01310-20 minutes 0.016 0.014 0.007 0.01420-40 minutes 0.016 0.014 0.008 0.014>40 minutes 0.009 0.006 0.006 0.006
Sex Male 0.017 0.012 0.006 0.012Female 0.014 0.013 0.007 0.013
Religious beliefs Believers 0.014 0.012 0.007 0.012
Consumers purchasing FT products ... …in world shops only
0.016 0.014 0.007 0.014
…also in supermarkets
0.012 0.009 0.006 0.009
* See definition at footnote 14.

26
Table 4 Awareness of fair trade criteria (percent of sample respondents who are aware)
FAIR PRICE
PREFINANCING
PRICE STABILISATION
PROVISION OF LOCAL
PUBLIC GOODS LABOUR ENVIRONMENT TRANSPARENCY
LONG RUN RELATION
SHIP All sample 74.9 359 297 391 669 516 409 270
Professional status Executive 77.3 22.7 13.6 36.4 54.5 36.4 45.1 18.2 Entrepreneur 76.9 38.5 30.8 46.2 69.2 69.2 46.2 30.8 Unemployed 69.2 33.3 23.1 35.9 64.1 43.6 28.2 12.8 Housewife 83.3 44.7 36.8 51.8 74.6 56.1 47.4 36.8 Professional 76.7 39.7 39.7 50.7 79.5 61.6 46.6 31.5 Student 73.1 33.3 25.5 35.0 61.2 47.6 46.3 23.5 Teacher 65.4 46.2 23.1 46.2 76.9 42.3 30.8 34.6 Manual worker
65.5 31.0 27.6 24.1 51.7 37.9 31.0 24.1
Clerk 80.0 32.9 32.5 39.2 70.4 56.7 41.3 28.3 Retired worker
69.1 45.5
23.6
34.5 70.9 56.4 30.9 2
Affiliation Non confessional associations*
83.4
56.7
41.7
52.8 79.5 63.5 57.3 41.4 Confessional associations*
82.7
41.3
35.2
43.9 71.9 57.7 46.9 32.1
Political parties
68.1
40.4
31.9
34.0 61.7 51.1 36.1 23.4
Development NGOs*
73.9
43.5
42.6
50.4 71.3 61.7 46.9 33.9
Sex Male 76.0 36.8 32.7 38.6 65.8 52.0 41.5 30.7 Female 74.3 35.4 28.3 39.4 67.5 51.4 40.5 24.9
Religious beliefs Believers 76.0 36.9 28.8 40.3 67.2 49.5 39.1 26.0
Consumers purchasing FT products .. . …in World shops only
75.9 37.6 29.5 39.866.9 52.6 42.2 27.4
…also in supermarkets
70.7 28.7 32.3 35.967.1 46.7 34.7 24.5
Fair price: premium on the market price paid to primary product producers by local intermediaries or food transnationals. Prefinancing: anticipated financing aimed to reduce the impact of credit rationing on small uncollateralized producers. Price stabilization: price stabilization mechanisms which insulate risk averse primary product producers from the high volatility of commodity prices; Labour: intervention to improve working conditions and to remove factors leading to child labour through monetary integration of poor household income; Pgoods: preferential inclusion in the fair trade chain of projects reinvesting part of the surplus arising from the fair price in the provision of local public goods (health, education, job training). Environment: attention to the environmental sustainability of production processes; Longrun: creation of long run relationships between importers and producers and provision through them of export services. For further details and discussion of these criteria see section 3.* See definition at footnote 14.

27
Table 5. Evaluation of the main limits in the quality of product and services of the FT chain
NOPROD NOONLINE
BADPROFES
BADPLACE BADTIME BADPERS
All sample .314 .125 .053 .280 .122 .088 Professional Status
Executive 0.318 0.136 0.091 0.227 0.273 0.136 Entrepreneur 0.385 0.154 0 0.154 0.154 0.077 Unemployed 0.231 0.128 0.077 0.385 0.154 0.154 Housewife 0.342 0.079 0.053 0.272 0.140 0.105 Professional 0.274 0.192 0.055 0.274 0.123 0.041 Student 0.296 0.166 0.065 0.310 0.112 0.078 Teacher 0.379 0.034 0.069 0.172 0 0.138 Manual worker 0.346 0.1 0.029 0.283 0.133 0.096 Clerk 0.308 0.077 0.077 0.231 0.038 0.115 Retired worker 0.218 0.072 0.036 0.218 0.127 0.018
Membership Non confessional associations*
0.368 0.143 0.078 0.264 0.130 0.091
Confessional associations* 0.337 0.117 0.061 0.230 0.130 0.071
Political parties* 0.319 0.064 0.085 0.340 0.106 0.106
Development NGOs 0.348 0.148 0.070 0.252 0.130 0.096
Consumers purchasing FT products .. …in World shops only 0.323 0.128 0.058 0.252 0.118 0.084 …also in supermarkets 0.281 0.114 0.030 0.407 0.132 0.114
Religious beliefs Believer 0.340 0.134 0.060 0.274 0.129 0.093
Sex Male 0.292 0.137 0.064 0.275 0.114 0.105 Female 0.326 0.118 0.047 0.283 0.126 0.079
Distance from the nearest FT outlet <10 minutes 0.359 0.111 0.066 0.159 0.123 0.099 10-20 minutes 0.303 0.152 0.050 0.259 0.146 0.082 20-40 minutes 0.313 0.125 0 .042 0.448 0.115 0.078 >40 minutes 0.217 0.058 0.043 0.449 0.058 0.130 Legend: NOPROD: limits in the FT product range; NOONLINE: absence of on-line sales; BADPROFES: scarce professional experience of the world shop personnel; BADPLACE: unsatisfactory location of the FT outlet; BADTIME: reduced opening time of FT world shops; BADPERS: scarce courtesy of the world shop personnel. * See definition at footnote 15.
28
Table 6 The determinants of fair trade expenditures in a two equation treatment regression model
FIRST EQUATION:
DEP. VARIABLE = LOG OF DAILY EXPENDITURE IN FT
PRODUCTS
SECOND EQUATION: DEP. VARIABLE = AWARENESS
OF AT LEAST FIVE FT SR CRITERIA
(KNOWMOSTCRITERIA Coeff. T-stat Coeff. T-stat LOG(DISTANCE) -0.167 -3.24 LOG(INCOME) 0.212 2.89 0.0001 -3.3 MALE -0.114 -1.1 0.134 1.26 LOG(AGE) 0.681 3.3 -0.361 -1.71 LOG(SCHOOL) -0.297 -1.08 0.384 1.34 NORTH-EAST 0.086 0.37 -0.027 -0.11 NORTH-WEST 0.071 0.4 0.288 1.57 SOUTH 0.102 0.76 0.169 1.3 FAITH -0.079 -0.73 -0.166 -1.51 STUDENT -0.300 -1.77 -0.157 -0.92 THEACHER 0.225 0.75 -0.344 -1.06 MANUAL WORKER 0.197 0.63 -0.310 -0.97 CLERK -0.103 -0.83 -0.202 -1.62 NCVOL 0.035 0.3 0.654 5.94 CVOL -0.105 -0.82 0.293 2.27 NGO -0.055 -0.36 0.333 2.25 LOG(FIDELWS) -0.024 -0.29 0.358 4.52 WSONLY 0.368 2.76 -0.080 -0.6 LOG(FIDELLS) 0.147 1.4 0.223 2.19 NOCOMPLAINTS 0.130 1.34 KNOWMOSTCRITERIA 2.190 11.26 CONSTANT -4.583 -3.82 -0.661 -0.57 LR- TEST
OF INDEPENDENCE OF THE TWO EQUATION S
21.01 (0.00)
N. OF OBS. 700
LOG-L ON OVERALL SIGNIFICANCE
1412.48 (0.00)
We estimate a treatment regression model whose specification is presented in section 5.1 Variable legend: DISTANCE: declared distance from the nearest FT world shop in minutes; INCOME: average net family income calculated as monthly after tax (wage) family income minus or plus all other (nonwage) income flows (i.e. mortgages, housing rents, etc. ; SCHOOL: average schooling years; NORTH-EAST: dummy for consumer location in the North-East of the country (Trentino-Alto Adige, Veneto, Friuli-Venezia Giulia, Emilia Romagna); NORTH-WEST: dummy for consumer location in the North-West of the country (Piemonte, Valle D’Aosta, Lombardia, Liguria); SOUTH: dummy for consumer location in the South of the country (Calabria, Campania, Puglia, Sardegna, Sicilia); NCVOL: volunteer members of non confessional associations, CVOL: volunteeer members of confessional associations; NGO: membership of a development NGO (for definition see footnote 14); FIDELWS: duration of purchasing habits in “world shops” (dedicated FT outlets) (number of years); WSONLY: dummy for those purchasing from world shops only; FIDELLS: duration of purchasing habits in the large scale distribution (number of years), KNOWMOSTCRITERIA: knowledge of at least 5 out of 8 FT criteria; NOCOMPLAINTS: absence of complaints on fair trade chain; MOSTCOMPLAINTS: agreement on at least 5 out of 8 reasons for complaining about the FT product chain (see Table 5 legend).

29
Table 7. Limitation of fair trade products as perceived by consumers (probit estimates) MOREFOOD MOREDR
ESS MOREOBJECT
BADTIME BADPERS BADPLACE NOPROD NOONLINE
MALE -0.043 (-1.55)
(-.054) -1.42
-0.027 (-0.73)
-0.015 (-0.58)
0.037 (1.78)
0.005 (0.16)
-0.059 (-1.68)
0.006 (0.25)
LOG(DISTANCE) 0.0001 (0.19)
-0.0008 (-0.57)
0.001 (0.87)
-0.001 (-1.31)
0.0006 (0.86)
0.007 (6.02)
-0.002 (-1.52)
-0.0008 (-0.86)
LOG(INCOME) -00006 (-0.47)
-0.00004 (-1.52)
0.0001(1.93)
-0.0001 (-0.22)
-0.00002 (-1.29)
0.00005 (2.54)
-0.00003 (-1.32)
0.00001 (0.71)
LOG(AGE) 0.040 (0.72)
-.123 (-1.65)
0.184 (2.48)
-0.015 (-0.31)
-0.046 (-1.17)
-0.076 (-1.12)
0.024 (0.34)
-0.060 (-1.25)
LOG(SCHOOL) 0.034 (0.46)
0.070 (0.70)
-0.111 (-1.16)
0.115 (1.57)
0.0228 (0.43)
0.012 (0.13)
0.030 (0.32)
0.207 (2.77)
FAITH 0.023 (0.80)
0.008 (0.21)
0.075 (1.98)
-0.00003 (-0.00)
0.011 (0.52)
0.030 (0.86)
0.030 (0.82)
0.041 (1.68)
STUDENT 0.032 (0.69)
-0.021 (-0.35)
0.089 (1.46)
-0.028 (-0.70)
-0.041 (-1.39)
0.025 (0.45)
0.010 (0.18)
0.068 (1.68)
THEACHER -0.016 (-0.20)
0.187 (1.75)
-0.024 (-0.22)
-0.090 (-1.34)
0.012 (0.21)
-0.067 (-0.71)
0.013 (0.12)
-0.045 (-0.70)
MANUAL WORKER
-0.023 (-0.26)
0.133 (1.17)
-0.210 (-2.01)
-0.006 (-0.22)
0.076 (1.13)
-0.123 (-1.30)
0.138 (1.24)
-0.029 (-0.34)
CLERK 0.010 (0.30)
0.067 (1.49)
0.015 (0.35)
-0.006 (-0.22)
0.003 (0.13)
-0.002 (-0.05)
0.011 (0.25)
-0.023 (-0.80)
NCVOL 0.023 (0.78)
-0.006 (-0.15)
0.049 (1.26)
0.002 (0.08)
0.008 (0.40)
-0.037 (-1.05)
0.068 (1.83)
0.031 (1.23)
CVOL 0.012 (0.34)
0.052 (1.11)
0.033 (0.75)
0.051 (1.60)
-0.032 (-1.35)
-0.082 (-2.01)
0.008 (0.19)
-0.014 (-0.47)
NGO 0.077 (1.84)
0.062 (1.13)
0.024 (0.46)
0.001 (0.03)
0.004 (0.13)
-0.065 (-1.36)
0.047 (0.92)
0.008 (0.22)
LOG(FIDELLS) 0.114 (4.51)
0.122 (3.13)
0.091 (2.45)
-0.009 (-0.34)
-0.002 (-0.13)
0.052 (1.53)
-0.002 (-0.06)
-0.046 (-1.71)
LOG(FIDELWS) . 0.016 (0.74)
0.049 (1.70)
-0.060 (-2.14)
0.013 (0.68)
-0.013 (-0.90)
-0.056 (-2.16)
0.047 (1.75)
0.002 (0.12)
NORTH-EAST -0.099 ( -1.70)
-0.114 (-1.41)
-0.078 (-1.00)
0.029 (0.53)
0.015 (0.35)
-.0128 (-1.89)
-0.018 (-0.24)
-0.080 (-1.85)
NORTH-WEST -0.004 (-0.08)
-0.020 (-0.31)
-0.104 (-1.69)
0.038 (0.87)
0.042 (1.19)
-0.155 (-2.67)
-0.100 (-1.72)
-0.045 (-1.12)
SOUTH 0.071 (1.89)
0.147 (2.96)
0.018 (0.37)
0.035 (1.01)
-0.064 (-2.50)
-0.083 (-1.97)
-0.015 (-0.32)
-0.010 (-0.34)
Num. Obs. 793 793 793
769 793 793 793 793
LR (χ2) (18) 40.87
(18) 44.22
(18) 36.70
(17) 14.71
(18) 21.85
(18) 81.55
(18) 21.16
(18) 32.01
Pseudo R2 0.0016 0.0403 0.0348 0.0246 0.0457 0.0862 0.0211 0.0526 Variable legend: (t-stats in parenthesis) DISSERVICES: MOREPROD: limits in the FT food product range; MOREDRESS: limits in the FT clothing product range; MOREOBJECT limits in the FT giftware product range; NOONLINE: absence of on-line sales; BADPROFES: scarce professional experience of the FT personnel; BADPLACE: unsatisfactory location of the FT outlet; BADTIME: reduced opening time of FT shops; BADPERS: scarce courtesy of the FT world shop personnel. REGRESSORS: DISTANCE: declared distance from the nearest FT world shop in minutes; INCOME: average net family income calculated as monthly after tax (wage) amily income minus or plus all other (nonwage) income flows (i.e. mortgages, housing rents, etc.); SCHOOL: average schooling years; NORTH-EAST: dummy for consumer location in the North-East of the country (Trentino-Alto Adige, Veneto, Friuli-Venezia Giulia, Emilia Romagna); NORTH-WEST: dummy for consumer location in the North-West of the country (Piemonte, Valle D’Aosta, Lombardia, Liguria); SOUTH: dummy for consumer location in the South of the country (Calabria, Campania, Puglia, Sardegna, Sicilia); NCVOL: volunteer members of non confessional associations, CVOL: volunteer members of confessional associations; NGO: member of a development NGO (for definition see footnote 15); FIDELWS: duration of purchasing habits in world shops (dedicated FT outlets) (number of years); WSONLY: dummy for those purchasing from world shops only; FIDELLS: duration of purchasing habits in the large scale distribution (number of years).

30
Table 8 The determinants of the willingness to pay in excess for the SR features of FT products
FIRST EQUATION: DEP. VARIABLE =
WILLINGNESS TO PAY IN EXCESS FOR THE SR
FEATURES OF FT PRODUCTS
SECOND EQUATION: DEP. VARIABLE = AWARENESS
OF AT LEAST FIVE FT SR CRITERIA
(KNOWMOSTCRITERIA Coeff. T-stat Coeff. T-stat DLS -0.478 -8.73 LOG(VIRTDISTANCE) -0.246 -15.94 LOG(INCOME) -0.119 -1.04 -1.49 -0.001 MALE 0.079 1.66 0.029 0.27 LOG(AGE) 0.044 0.18 -0.470 -2.04 LOG(SCHOOL) -0.193 -1.3 0.334 1.15 NORTH-EAST -0.213 -0.84 0.014 0.06 NORTH-WEST -0.023 -0.13 0.224 1.23 SOUTH 0.203 1.3 0.187 1.27 FAITH 0.122 1.02 -0.050 -0.43 STUDENT -0.021 -0.12 -0.174 -0.99 THEACHER 0.320 0.92 -0.363 -1.03 MANUAL WORKER 0.109 0.33 -0.281 -0.76 CLERK 0.027 0.2 -0.071 -0.55 NCVOL -0.109 -0.76 0.676 5.97 CVOL -0.044 -0.31 0.250 1.87 NGO -0.108 -0.62 0.391 2.42 LOG(FIDELWS) 0.132 1.38 0.186 1.72 WSONLY -0.164 -1.16 -0.044 -0.31 LOG(FIDELLS) -0.087 -0.73 -0.050 -0.43 KNOWMOSTCRITERIA 0.774 2.07 CONSTANT 3.14 2.35 1.03 1.91
LR- TEST OF INDEPENDENCE OF THE TWO EQUATION S
3.19 (0.07)
N. OF OBS. 4053
LOG-L ON OVERALL SIGNIFICANCE
-10337.6 (0.00)
We estimate a treatment regression model whose specification is presented in section 5.3 Variable legend. The dependent variable of the first equation Wpaysocijl is the declared willingness to pay in excess for the SR features of the FT product of consumer i at the jth distance from the FT shop (0, 15, 30 minute distance) from the lth type of retailer (FT world shop or supermarket). Information on these variables is drawn from questions 29-34 in the attached survey). Virtdistij is the “virtual” distance at which the consumer i buys the product, DLS is a dummy taking value of one (zero) if the “virtual” purchase is done in the large scale distribution (world shops). Other regressors are defined as in section 5.1.
31
References Adriani F. Becchetti L., 2005, Fair trade: a “third generation welfare” mechanism to make globalisation sustainable, CEIS Working Paper, n. 171 Agell, J., Lundborg P., “Survey Evidence on Wage Rigidity and Unemployment: Sweden in the 1990s”, forthcoming Scandinavian Journal of Economics (2002). Akerlof G.A. (1982), “Labor contract as partial gift exchange”, The Quarterly Journal of Economics, XCVII 4 Anderson, S., 1987, Spatial competition and price leadership, International Journal of Industrial Organization, 5( 4), pp. 369-98 Bahadur C., Mendoza R., 2002, Toward Free and Fair Trade: A Global Public Good Perspective, Challenge, 45, pp. 21-62 Basu, K. (1999) Child Labour, cause, consequence and cure, with remarks on interantional labour standards, Journal of Economic literature, vol. 37, pp. 1083-1119. Basu, K. and P.H. Van, (1998), “The Economics of Child Labor” American Economic Review 88, 412-427 Becchetti L., Solferino N, 2003, On ethical product differentiation, CEIS working paper n 188. Becchetti L., Solferino N, 2004, The dynamics of ethical product differentiation and the habit formation of socially responsible consumers, Working Paper AICCON-Università di Bologna Bewley, Truman F., 1999, Why Wages Don’t Fall During A Recession, (Cambridge, Mass.: Harvard University Press,. Bhagwati J., 1996, Fair Trade and Harmonization: Prerequisites for Free Trade? Volume 1: Economic Analysis: Introduction, Cambridge and London: MIT Press. Bird, K. & Hughes, D.: 1997, ‘Ethical consumerism: the case of “fairly-traded” coffee, Business Ethics: a European Review, 6, 3, pp.159-167 Cairncross, F, 1997, The death of distance, Londra, Orion. Camargo, J., 1984. Minimum Wage in Brazil Theory, Policy and Empirical Evidence. Pontificia Universidade Catolica Discussion Paper 67. Campbell, Carl M., and Kunal S. Kamlani, “The Reasons for Wage Rigidity: Evidence from a Survey of Firms,“ The Quarterly Journal of Economics, 3 (1997), 759 -89 Card, D., Krueger, A. B., 2000, Minimum wages and empoyment. A case study of the fast food industry in West virginia and in Pennsylvania American Economic Review, 90(5), pp. 1397-1420 Carneiro, F., 2002. Uma Resenha Empirica sobre os Efeitos do Salario Minimo no Mercado de Trabalho Brasileiro. In: The Jobs Report, The World Bank, Washington, forthcoming.
32
Conley and Udry (2003) “Learning about a New Technology: Pineapple in Ghana” Paper n. 817 Yale – Economic Growth Center Demos & Pi / Coop, 2004, Osservatorio sul Capitale sociale Virtù e valori degli italiani, Indagine 2004 D’aspremont, C., J.J.Gabsewicz , J.F., Thisse, 1979, On Hotelling’s stability in competition, Econometrica, 47, 114-1150. DeBenedictis L., R. Helg, 2002, Globalizzazione, Rivista di Politica Economica, marzo-aprile, De Pelsmacker, P. Driesen L. Rayp G., 2003, Are fair trade labels good business ? ethics and coffee buying intentions. Workign paper University of Gent. Diamond, Peter A. and Jerry A. Hausman (1994). "Contingent Valuation: Is Some Number Better than No Number." Journal of Economic Perspectives, 8(4):45-64. El-Hamidi, F. Terrell, K., 2001,The Impact of Minimum Wages on Wage Inequality and Employment in the Formal and Informal Sector in Costa RicaDavidson Institute Working paper n.479 European Fair Trade Association, 2001, EFTA Yearbook, www.eftafairtrade.org. Fehr E., Schmidt K. (1999), “ A theory of fairness, competition and cooperation”, Quarterly Journal of Economics 114: 817-868 Fehr, E., K. M. Schmidt, 2002, \The Economics of Fairness and Reciprocity", in: M. Dewatripont et.al. (eds.) Advances in Economic Theory, Eight World Congress of the Econometric Society, Cambridge: Cambridge University Press, Vol. 1, 208-257. Fehr E., Falk A. Psychological Foundations of Incentives, in: European Economic Review 46 (2002), 687-724 Gneezy U., Rustichini A. (2000), “Pay enough or don’t pay at all ”, Quarterly Journal of Economics 115: 791-810 Hotelling, H., 1929, Stability in competition, Economic Journal, 39,41-57. Gonzaga, G., Machado, D., 2002. Rendimento e Precos. In Abreu, M. (Ed.) Estatisticas do Seculo XX, IBGE, Rio de Janeiro. Giddens, A., 2000, Runaway world: how globalisation is reshaping our lives, London, Routledge. Greene, W.H., 2000, Econometric Analysis, 4th ed. Upper Saddle River, NJ, Prentice-Hall Hayes, M., 2004, Strategic management implication of the ethical consumer http://www.fairtraderesearch.org Leclair, M. S., 2002, Fighting the tide: Alternative trade organizations in the era of global free trade, World Development 30 (7): 1099–122
33
Lemos S.,, 2004, The Effects of the Minimum Wage in the Formal and Informal Sectors in Brazil, University of Leicester and IZA Bonn Discussion Paper No. 1089 Maddala, G.S., 1983, Limited-dependent and qualitative variables in econometrics. Cambridge: Cambridge University Press. Manning, A., 2003 The Real Thin Theory: Monopsony in Modern Labour Markets”, Labour Economics, 2003, 10, 105-134 Maseland R & Vaal A De,2002, How fair is fair trade?, De Economist. 150(3), pp. 251-272 Mitchell, Robert C.; Richard T. Carson. 1989. “Using Surveys to Value Public Goods: The Contingent Valuation Method.” Resources for the Future, Washington, D.C., Number of Pages: 463. Moore, G., 2004, The Fair Trade Movement: parameters, issues and future research, Journal of Business Ethics, 53, 73-86 Robertson, R., 1992, Globalisation, Londra, Sage. Sobel, J., 2002, Social Preferences and Reciprocity, mimeo, University of California, San Diego. Stiglitz J., 2002, Globalization and its discontents ,.Publisher Information: New York and London: Norton Publication. Suranovic S., 2002, International Labour and Environmental Standards Agreements: Is This Fair Trade?, The World Economy, 25(2 ), pp. 231-245 Waters, M., 2001, Globalisation, New York, Rutgers. Whalley, J., 2005, Globalization and Values, CESifo Working paper series, CESifo Women and Children: The Precarious Lives behind the Grains of Coffee, A Summary http://www.coverco.org/eng/media/WomenandChildren.pdf Zamagni, S., 2002, Complessità relazionale e comportamento economico, materiali per un nuovo paradigma della relazionalità, Il Mulino, Bologna.
34
Appendix A NOT TO BE PUBLISHED The extraction of the relative preference for social responsibility from econometric estimates of the willingness to pay in excess for the SR features of FT products Consumers interviewed in our survey are asked, at questions 29-34, about their willingness to pay in excess for a FT product with respect to an equivalent non FT product. Let us assume, as a first approximation, that the interviewed consumers have standard Cobb-Douglas preferences
SR NSRU x x yα β γ= (A.1) where xSR is the FT good, xNSR is an equivalent good, whose only difference from the previous one is in the absence of SR features, and y represents all other goods. Under a standard linear budget constraint the demand for the FT and for the equivalent non FT good will be respectively
SR
SRX
mxp
αα β γ
=+ +
(A.2) and NSR
NSRX
mxp
βα β γ
=+ +
(A.3),
the difference between the two being SR NSRSR X NSR Xx p x p m α β
α β γ−
− =+ +
(A.4)
Hence, when estimating specification
log[ ] log( ) logSR NSRSR X NSR Xx p x p m α β
α β γ⎛ ⎞−
− = + ⎜ ⎟+ +⎝ ⎠ (A.5),
we are exactly measuring with the intercept the magnitude of individual social preferences. In our estimate the second term of the above expression is around 2.6 giving an abnormal preference premium for social responsibility with α-β=13.5, which is obviously incompatible with constant returns to scale α+β=1. The Cobb-Douglas, though, is a special case of a more general class of Constant Elasticity of Substitution functions. Its main limit25 is the assumption of a constant unit elasticity of substitution between the two inputs. We argue that SR consumers are likely to have less than unit elasticity of substitution given the character of their preferences (e. g. they are likely to less than double expenditure in non SR products with respect to SR products if the ratio of the SR to the non SR price doubles). This assumption appears consistent with motivation and behaviour of SR consumers and, more specifically, with the reluctance of many of them to buy FT products in supermarkets (see section 4.4).26 We therefore calculate the preference differential between SR and non SR goods by assuming that consumers have CES utility function, U = A[αXSR
δ + (1 - α) XNSR δ]1/δ (A.6)
obtaining the following optimal demand for the socially responsible goods
1 1(1 )SR SR NSR
SRX X X
mxp p p
σ
σ σ σ
αα α− −
⎛ ⎞= ⎜ ⎟⎜ ⎟ + −⎝ ⎠
(A.7) where 11
σδ=
− or the elasticity of substitution.
Under the CES specification the difference between demand for SR and non SR products becomes
25 The CES function shares the Cobb-Douglas function's homogeneity of degree one. This causes the income-consumption curves to be rays through the origin. Also, the income elasticity of demand is unity for both products. The Cobb-Douglas function is restrictive in an additional way with respect to the CES function. Its price consumption curve is horizontal, with the resulting unit price elasticity of (uncompensated) demand. The amount of good is independent of the price of good X, as are income shares for X and Y. The CES formulation does not share this restriction. 26 Consider also that, under the extreme case of boycott, of some non FT products the elasticity of substitution falls to zero.

35
1 1 1 1(1 ) (1 )SR NSR SR SR
SR SR NSR NSR NSR SR
SR X NSR X X XX X X X X X
m mx p x p p pp p p p p p
σ σ
σ σ σ σ σ σ σ σ
α αα α α α− − − −
⎛ ⎞ ⎛ ⎞− = −⎜ ⎟ ⎜ ⎟⎜ ⎟ ⎜ ⎟+ − + −⎝ ⎠ ⎝ ⎠
(A.8) Since in our question we demand about the willingness to pay assuming that the two goods have the same price we may simplify the formula to
( )( )11 11
(1 )SR NSRSR X NSR Xmx p x p p
p pσσ σ
σ σ σ σα αα α
−− −
⎡ ⎤− = − −⎢ ⎥⎣ ⎦ + − (A.9)
Hence, when we estimate the specification log[ ] log( ) log
SR NSRSR X NSR Xx p x p m q− = + (A.10) in the CES case we have
( )1 1(1 )
q pσσ
σσ σ
α αα α
− − −=
+ − (A.11)
Under the assumption of a less than unit elasticity of substitution our estimated value is compatible with constant returns to scale in the utility function. More specifically, by assuming an average weekly expenditure in food products of 40 euros, our estimated value of the intercept is consistent with α=.99 and σ=.1. If we remove the assumption of constant returns to scale in the utility function we may obtain more reasonable and reduced relative preferences for social responsibility (and, more specifically, a preference structure where weight for SR products is less than 13 times larger than that of non SR products as in the Cobb-Douglas case where we assumed unit elasticity of substitution).

36
Appendix B NOT TO BE PUBLISHED Table A1 The determinants of fair trade expenditures (dep. Var.: daily expenditure in FT products)
LOG(DISTANCE) -0.220 (-3.86)
-0.223 (-3.86)
-0.212 (-3.63)
-0.208 (-3.63)
-.188 (-3.46)
-0.150 (-2.87)
LOG(INCOME) -0.009 (-0.11)
-0.004 (-0.06)
0.010 (0.12)
0.066 (0.76)
0.141 (1.69)
0.154 (1.88)
MALE 0.013 (0.14)
0.010 (0.11)
-0.019 (-0.21)
-0.071 (-0.85)
-0.081 (-0.98)
LOG(AGE) 0.738 (5.36)
0.735 (5.27)
0.371 (2.14)
0.400 (2.42)
0.437 (2.58)
LOG(SCHOOL) 0.223 (0.94)
0.243 (1.02)
0.065 (0.29)
-0.061 (-0.28)
-0.108 (-0.51)
NORTH-EAST -0.071 (-0.36)
-0.018 ( -0.09)
0.100 (0.53)
0.094 (0.49)
NORTH-WEST 0.284 (1.99)
0.289 (2.00)
0.324 (2.36)
0.270 (2.01)
SOUTH 0.166 (1.42)
0.191 (1.61)
0.211 (1.92)
0.176 (1.66)
FAITH -0.103 (-1.15)
-0.156 (-1.77)
-0.128 (-1.47)
STUDENT -0.519 (-3.48)
-0.360 (-2.52)
-0.347 (-2.45)
THEACHER -0.048 (-0.19)
0.111 (0.52)
0.127 (0.60)
MANUAL WORKER -0.023 (-0.06)
0.124 (0.31)
0.138 (0.35)
CLERK -0.219 (-2.01)
-0.191 (-1.91)
-0.171 (-1.74)
NCVOL 0.572 (6.57)
0.461 (5.19)
CVOL 0.081 (0.77)
0.038 (0.37)
NGO 0.232 (2.06)
0.173 (1.53)
LOG(FIDELWS) 0.252 (3.43)
0.188 (2.56)
WSONLY 0.353 (2.92)
0.350 (2.91)
LOG(FIDELLS) 0.273 (3.37)
0.245 (3.13)
KNOWMOSTCRITERIA 0.466
(5.44) NOCOMPLAINTS 0.127
(1.38) CONSTANT -0.274
(-0.42) -3.473 (-3.76)
-3.709 (-3.96)
-2.12 (-1.93)
-3.438 (-3.20)
-3.700 (-3.41)
N. OF OBS. 725 701 701 701 701 701
F- TEST ON OVERALL SIGNIFICANCE
(2, 722) 7.59
(5, 695) 9.79
(8, 692) 7.28
(13, 687) 5.85
(19, 681) 12.15
( 21, 679) 13.14
ADJ. R2 0.021 0.063 0.069 0.088 0.212 0.241 Variable legend: DISTANCE: declared distance from the nearest FT world shop in minutes; INCOME: average net family income calculated as monthly after tax family income minus or plus all other income flows (i.e. mortgages, housing rents, etc.) ; SCHOOL: average schooling years; NORTH-EAST: dummy for consumer location in the North-East of the country (Trentino-Alto Adige, Veneto, Friuli-Venezia Giulia, Emilia Romagna); NORTH-WEST: dummy for consumer location in the North-West of the country (Piemonte, Valle D’Aosta, Lombardia, Liguria); SOUTH: dummy for consumer location in the South of the country (Calabria, Campania, Puglia, Sardegna, Sicilia); NCVOL: volunteer member of non confessional associations, CVOL: volunteer member of confessional associations; NGO: members of a development NGO (for definition see footnote 15); FIDELWS: duration of FT purchasing habits (number of years); WSONLY: dummy for those purchasing from world shops only; FIDELGDO: duration of purchasing habits of FT products in supermarkets (number of years); KNOWMOSTCRITERIA: knowledge of at least 5 out of 8 FT criteria; NOCOMPLAINTS: absence of complaints on fair trade chain.

37
Table A2 The determinants of awareness of fair trade criteria FAIRPRICE PREFIN STABPRICE LABOUR ENVIROMN LONGRUN TRANSPAR PUBGOODINV MALE* .00065
(0.02) -.013
(-0.35) .030
(0.85) -.059
(-1.67) -.023
(-0.60) .014
(0.42) -.048
(-1.26) -.034
(-0.90) LOG(INCOMIND) .000015
(0.70) -.00001 (-0.39)
-.00006 (-2.03)
-3.03e-06 (-0.14)
-.00003 (-1.03)
-.00002 (-0.76)
-.00003 (-1.24)
-8.44e-07 (-0.039
AGE -.108 (-1.82)
.067 (0.91)
-.032 (-0.47)
-.185 (-2.61)
-.175 (-2.26)
-.152 (-2.23)
-.328 (-4.32)
-.086 (-1.15)
EDUCATION .183 (2.33)
.153 (1.52)
.135 (1.41)
.199 (2.28)
.108 (.08)
.103 (1.11)
-.040 (-0.40)
.036 (0.36)
FEDE* -.009 (-0.27)
.027 (0.70)
-.039 (-1.05)
-.040 (-1.13)
-.101 (-2.54)
-.063 (-1.73)
-.093 (-2.31)
-.007 -0.18
STUDENT -.095 (-1.83)
.038 (0.63)
-.038 (-0.68)
-.132 (-2.25)
-.131 (-2.10)
-.074 (-1.39)
-.054 (-0.89)
-.084 (-1.41)
THEACHER -.111 (-1.17)
.127 (1.12)
-.119 (-1.22)
.083 (0.84)
-.066 (-0.58)
.083 (0.81)
-.035 (-0.31)
.098 (0.90)
MANUAL WORKER
-.044 (-0.47)
-.016 (-0.14)
-.022 (-0.20)
-.073 (-0.69)
-.136 (-1.14)
.026 (0.24)
-.071 (-0.61)
-.143 (-1.27)
CLERK -.006 (-0.17)
-.108 (-2.47)
-.034 (-0.83)
-.058 (-1.35)
-.015 (-0.33)
-.039 (-0.98)
-.032 (-0.70)
-.071 (-1.62)
NCVOL .09 (2.72)
.290 (7.43)
.111 (2.96)
.132 (3.61)
.110 (2.73)
.162 (4.45)
.180 (4.51)
.144 (3.65)
CVOL .079 (2.08)
.065 (1.39)
.083 (1.87)
.077 (1.81)
.112 (2.38)
.078 (1.79)
.111 (2.33)
.058 (1.25)
NGO -.041 (-0.89)
.105 (1.90)
.129 (2.47)
.026 (0.53)
.08 (1.45)
.089 (1.75)
.036 (0.66)
.149 (2.70)
LOG(FIDELLS) .039 (1.14)
.04 (1.06)
.05 (1.43)
.045 (1.19)
.103 (2.57)
.012 (0.35)
.047 (1.22)
.027 (0.71)
WSONLY .044 (1.10)
.057 (1.19)
-.084 (-1.82)
-.006 (-0.13)
.083 (1.70)
-.006 (-0.13)
.063 (1.30)
.041 (0.86)
LOG(FIDELWS) .050 (2.10)
.129 (4.60)
.139 (5.18)
.104 (3.92)
.098 (3.36)
.111 (4.27)
.127 (4.33)
.117 (4.11)
NORTH-EAST .043 (0.66)
-.054 (-0.68)
-.043 (-0.57)
.019 (0.26)
.085 (1.05)
.009 (0.12)
.018 (0.22)
.022 (0.27)
NORTH-WEST .089 (1.71)
-.057 (-0.89)
-.005 (-0.08)
.119 (2.06)
.02 (0.30)
.098 (1.63)
-.04 (-0.61)
.079 (1.23)
SOUTH .016 (0.40)
-.014 (-0.29)
-.007 (-0.15)
.037 (0.84)
.024 (0.49)
-.020 (-0.45)
-.028 (-0.57)
-.017 (-0.35)
Number of obs 793 793 793 793 793 793 793 793 LR χ2 (18) 51.14 130.03 80.12 77.44 70.65 75.60 91.52 65.70 Pseudo R2 0.0595 0.1251 0.0807 0.0794 0.0646 0.0792 0.0846 0.0614 Variable legend: AWARENESS OF FAIR TRADE CRITERIA Fair price: premium on the price paid on primary products by local intermediaries or food transnationals. Prefinancing: anticipated financing which reduces the impact of credit rationing of small uncollateralized producers. Price stabilization: price stabilization mechanisms which insulate risk averse primary product producers from the volatility of commodity prices; Labour: the intervention to improve working conditions and to remove factors leading to child labour through monetary integration of poor household income; Pgoods: preferential inclusion in the fair trade chain of projects reinvesting part of the surplus arising from the fair price in the provision of local public goods (health, education, job training). Environment: attention to the environmental sustainability of production processes; Longrun: creation of long run relationships between importers and producers and provision through them of export services). For further details on these criteria see section 3. REGRESSORS. NUMDISTANCE: declared distance from the nearest FT world shop in minutes; INCOMEM: average net family income is calculated as monthly after tax family income minus or plus all other income flows (i.e. mortgages, housing rents, etc.) ; SCHOOL: average schooling years; NORTH-EAST: dummy for consumer location in the North-East of the country (Trentino-Alto Adige, Veneto, Friuli-Venezia Giulia, Emilia Romagna); NORTH-WEST: dummy for consumer location in the North-West of the country (Piemonte, Valle D’Aosta, Lombardia, Liguria); SOUTH: dummy for consumer location in the South of the country (Calabria, Campania, Puglia, Sardegna, Sicilia); NCVOL: volunteer member of non confessional associations, CVOL: volunteer member of confessional associations; NGO: membership of an NGO; FIDELLS: duration of purchasing habits in “world shops” (dedicated FT outlets) (number of years); WSONLY: dummy for those purchasing from world shops only; FIDELLS: duration of purchasing habits in the large scale distribution (number of years). For details and discussion of these criteria see section 3

38
Appendix C QUESTIONNAIRE
1. How long have you been buying FT products in world shops?
One year Three years Five years More than 5 years
2. What you generally buy in world shops? (max. three answers in
descending order of priority: 1 the most important,..,3 the least important)
Food Textile\clothing Musical instruments |artisan products Other _______________
3. What is the frequency of your FT purchases?
More than once in a month At least once in a month Every two-three months One-two times a year Less than once a year
4. How much do you spend on average for any purchase?
< 5 € 5 – 10 € 10 – 25 € > 25 €
5. How much do you spend for FT products?
_________ € a week _________ € a month _________ € every six months _________ € a year
6. Do you buy FT products always in the same FT shop ?
Yes Yes because I do not know other world shops No, also in other world shops No, also in the large scale distribution
7. Reasons for buying FT products (max. three answers in descending order of priority: 1 the most important,..,3 the least important)
Ethics Higher transparency in the product chain More confidence in product quality Price/quality convenience Ethnic features of the product
8. Distance from the nearest world shop
< 10 minutes 10 – 20 minutes 20 – 40 minutes > 40 minutes
Evaluation of FT products
9. How do you judge information on products?
Exhaustive Incomplete Difficult to find Never seen
10. How do you judge the quality of FT food products?
Scarce Sufficient Good Very good
11. How do you judge the quality of FT non food products?
Scarce Sufficient Good Very good
12. For which kind of products you would like to have an extended
range in world shops ? (max. three answers in descending order of priority)
Food Clothing Giftware Other ________________________
13. Which limits and/or disservices do you find in world shops ? (max. three answers in descending order of priority)
Lack of personnel courtesy Reduced opening time Limited product range Bad location Scarce professional assistance No on line purchases
Knowledge of FT 14. How did you know FT?
Friends Promotional campaigns Fairs/exhibitions/conferences Media Advertising World Shops Other _______________
15. D o you know the meaning of “fair price” ?
Yes Not perfectly No
16. What do you like more when entering a world shop ? (max.
three answers in descending order of priority)
Ethnic environment Courtesy/kindness of the personnel Originality of products Opportunity to share values and of social aggregation Other ____________________________________
17. How do you judge the idea of a common European label for FT products ?
Very useful to increase FT product sales Useful but not fundamental to sell this kind of products Not important because world shops give enough
guarantee I don’ know
Fair trade and large scale distribution
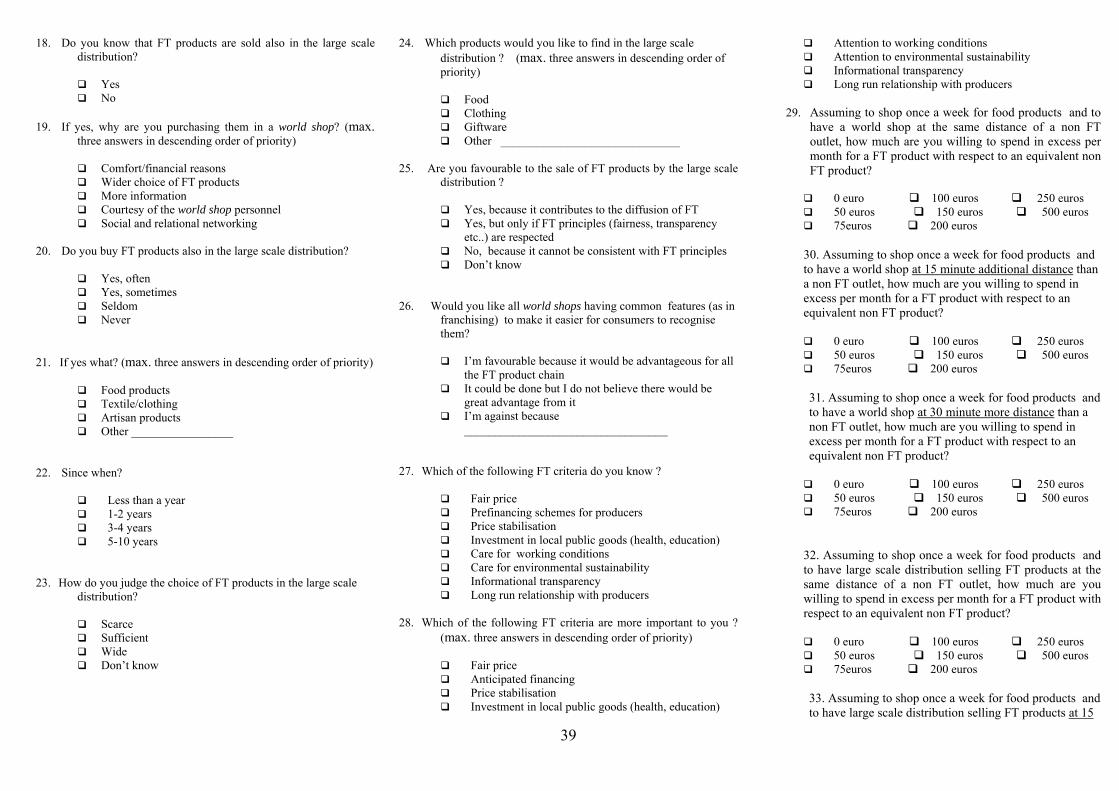
39
18. Do you know that FT products are sold also in the large scale distribution?
Yes No
19. If yes, why are you purchasing them in a world shop? (max.
three answers in descending order of priority)
Comfort/financial reasons Wider choice of FT products More information Courtesy of the world shop personnel Social and relational networking
20. Do you buy FT products also in the large scale distribution?
Yes, often Yes, sometimes Seldom Never
21. If yes what? (max. three answers in descending order of priority)
Food products Textile/clothing Artisan products Other _________________
22. Since when?
Less than a year 1-2 years 3-4 years 5-10 years
23. How do you judge the choice of FT products in the large scale distribution?
Scarce Sufficient Wide Don’t know
24. Which products would you like to find in the large scale distribution ? (max. three answers in descending order of priority)
Food Clothing Giftware Other ______________________________
25. Are you favourable to the sale of FT products by the large scale
distribution ?
Yes, because it contributes to the diffusion of FT Yes, but only if FT principles (fairness, transparency
etc..) are respected No, because it cannot be consistent with FT principles Don’t know
26. Would you like all world shops having common features (as in franchising) to make it easier for consumers to recognise them?
I’m favourable because it would be advantageous for all the FT product chain
It could be done but I do not believe there would be great advantage from it
I’m against because __________________________________
27. Which of the following FT criteria do you know ?
Fair price Prefinancing schemes for producers Price stabilisation Investment in local public goods (health, education) Care for working conditions Care for environmental sustainability Informational transparency Long run relationship with producers
28. Which of the following FT criteria are more important to you ?
(max. three answers in descending order of priority)
Fair price Anticipated financing Price stabilisation Investment in local public goods (health, education)
Attention to working conditions Attention to environmental sustainability Informational transparency Long run relationship with producers
29. Assuming to shop once a week for food products and to
have a world shop at the same distance of a non FT outlet, how much are you willing to spend in excess per month for a FT product with respect to an equivalent non FT product?
0 euro 100 euros 250 euros 50 euros 150 euros 500 euros 75euros 200 euros
30. Assuming to shop once a week for food products and to have a world shop at 15 minute additional distance than a non FT outlet, how much are you willing to spend in excess per month for a FT product with respect to an equivalent non FT product? 0 euro 100 euros 250 euros 50 euros 150 euros 500 euros 75euros 200 euros
31. Assuming to shop once a week for food products and to have a world shop at 30 minute more distance than a non FT outlet, how much are you willing to spend in excess per month for a FT product with respect to an equivalent non FT product?
0 euro 100 euros 250 euros 50 euros 150 euros 500 euros 75euros 200 euros
32. Assuming to shop once a week for food products and to have large scale distribution selling FT products at the same distance of a non FT outlet, how much are you willing to spend in excess per month for a FT product with respect to an equivalent non FT product?
0 euro 100 euros 250 euros 50 euros 150 euros 500 euros 75euros 200 euros
33. Assuming to shop once a week for food products and to have large scale distribution selling FT products at 15
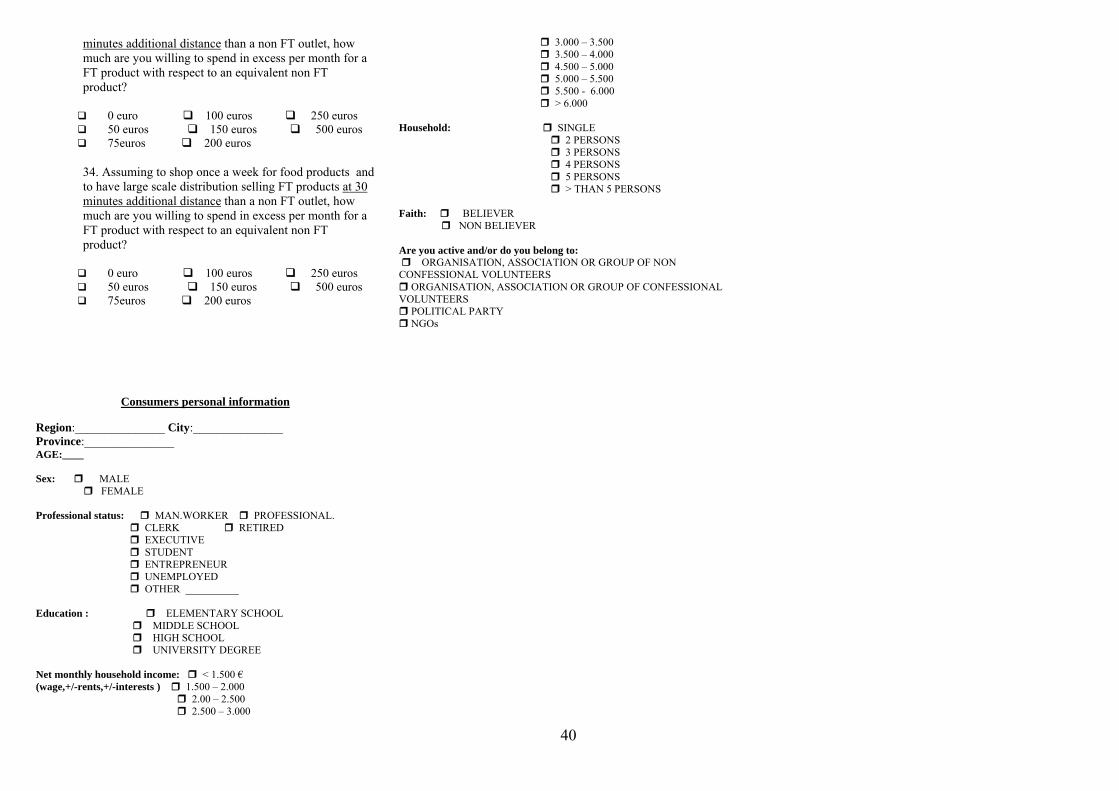
40
minutes additional distance than a non FT outlet, how much are you willing to spend in excess per month for a FT product with respect to an equivalent non FT product? 0 euro 100 euros 250 euros 50 euros 150 euros 500 euros 75euros 200 euros
34. Assuming to shop once a week for food products and to have large scale distribution selling FT products at 30 minutes additional distance than a non FT outlet, how much are you willing to spend in excess per month for a FT product with respect to an equivalent non FT product? 0 euro 100 euros 250 euros 50 euros 150 euros 500 euros 75euros 200 euros
Consumers personal information Region:_______________ City:_______________ Province:_______________ AGE:____ Sex: MALE FEMALE Professional status: MAN.WORKER PROFESSIONAL.
CLERK RETIRED EXECUTIVE STUDENT ENTREPRENEUR UNEMPLOYED OTHER __________
Education : ELEMENTARY SCHOOL MIDDLE SCHOOL HIGH SCHOOL UNIVERSITY DEGREE
Net monthly household income: < 1.500 € (wage,+/-rents,+/-interests ) 1.500 – 2.000
2.00 – 2.500 2.500 – 3.000
3.000 – 3.500 3.500 – 4.000 4.500 – 5.000 5.000 – 5.500 5.500 - 6.000 > 6.000
Household: SINGLE
2 PERSONS 3 PERSONS 4 PERSONS 5 PERSONS > THAN 5 PERSONS
Faith: BELIEVER
NON BELIEVER Are you active and/or do you belong to: ORGANISATION, ASSOCIATION OR GROUP OF NON CONFESSIONAL VOLUNTEERS
ORGANISATION, ASSOCIATION OR GROUP OF CONFESSIONAL VOLUNTEERS
POLITICAL PARTY NGOs


