
Global-scale mathematical models of social evolution:
investigating the development of the modern world
Tom Currie College of Life & Envoronmental Sciences, University of Exeter
att att att1P U S att
att
ijj i
u
US
att defsuccess
att def
P Pp
P P


• Many diffe


• Also, great variation around the world as to the scale and complexity of different societies
• Many questions can be asked:– Why did complex societies
develop in some places but not others?
– How does social complexity evolve?
• Understanding the past can help explain the modern world
“history’s broadest pattern”
Modelling the evolution of sociopolitcal complexity
• Many theories have been proposed to explain the origins and development of social and political complexity
• Often formulated as verbal models• Mathematical models and simulations can play
an important role in testing the logic and plausibility of different theories
• Provide more precise predictions that allow us to test competing hypotheses against data

Ultrasocial norms and institutions
• Ultrasocial norms and institutions are those cultural traits that enable humans to live and cooperate in huge groups of genetically unrelated individuals
• They are characterized by the tension between benefits they yield at the higher level of social organization and costs born by lower-level units
• Examples include governance by professional bureaucracies, education systems producing literate elites, and generalized trust (propensity to trust and help individuals outside of one’s ethnic group)

Warfare and the Steppe frontier

General Logic of the Model• The goal of the model is to understand under what conditions the cultural norms
and institutions that enable larger scale organization will spread • Cultural multilevel selection (CMLS) –
– ultrasocial traits: costly within-group, but increase the competitive ability between groups
• Groups compete with each other via warfare, with winning group subsuming the defeated
• We model two broad group of factors that affect between group selection:– Technology
• productive (agricultural) technologies (presence of agriculture as necessary precondition for complex society)
• military technologies (affect probability of successful attack) – Geography
• Affect presence of agriculture• Ability of polities to attack and defend other polities

Conceptual core of the model
spread of military technologies
intensification of warfare
evolution of ultrasocial traits
rise of large-scale societies

Background Ecology• Deserts
– agriculture cannot occur in deserts (< 250 mm of annual rainfall)• Rivers
– When flowing through deserts rivers make irrigated agriculture possible
• Eurasian Steppe – Home of pastoralist nomads (lack of agriculture until after 1500 CE)– source of military innovations (e.g. chariot and cavalry)
• Mountains – Rugged landscape more easy to defend
• Sea Coasts– Coastal cells can also initiate attacks against other coastal cells within
a certain distance
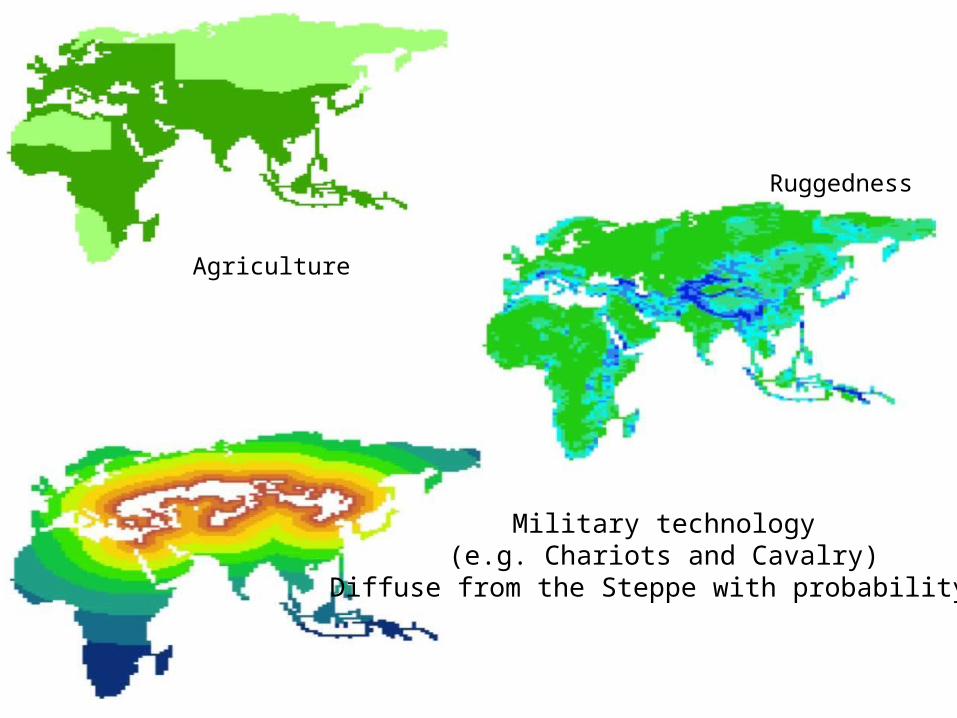
Agriculture
Ruggedness
Military technology (e.g. Chariots and Cavalry)
Diffuse from the Steppe with probability σ

The modeled period, area, and spatial units
• The model simulates social evolution during the period between 1500 BCE and 1500 CE
• All modeled interactions take place within a two-dimensional rectangular grid of cells (100 km x 100 km)
• Modeled area includes Eurasia and Africa (the ‘Old World’)• Each agricultural cell is occupied by a ‘community’ • Each ‘community’ is characterized by two binary vectors of
cultural traits. – U, contains nultra “ultrasociality traits”
– M, contains nmil of military technology (MilTech) traits

• Communities are aggregated within multicell ‘polities’
• A polity can also consist of a single community and at the beginning of the simulation all polities start with just one cell
• Polities engage in warfare which, if successful, can result in victors conquering cells from other polities
• Polities can also disintegrate • Ultrasociality traits characterizing each
community can change by mutation, or by cultural assimilation, while MilTech traits change by diffusion
0000000000
0001000000

Warfare• Warfare occurs between neighbouring polities (warfare between two polities is initiated with probability
p) • Littoral cells can also initiate a sea-born attack on other littoral cells within the distance dsea
• The success of attack is determined by the relative powers (P) of the attacking and defending polities.
• The power of attacker determined by:
• The power of the defending polity is determined by:
• When attack is successful, the defending cell is annexed by the attacking polity
attatt
ijj i
u
US
att att att1P U S
def def def def1P U S E
att defsuccess
att def
P Pp
P P
Averageultrasociality
Polity size
Effect of elevation

Sociocultural Evolution• Dynamics of ultrasociality traits are governed by two processes: mutation and ethnocide • Mutation process operates as follows
• Ethnocide can occur when a defeated cell is annexed by the winning polity • The probability of ethnocide is increased by the number of MilTech traits possessed by
the attacker and decreased by the mountainous terrain (elevation) of the defender:
• Parameter εmin specifies the probability of ethnocide in the situation when the attacker possesses none of the MilTech traits
• If ethnocide occurs, then the values of the ultrasociality vector in the losing cell are set to the values of the attacking cell
0 1μ01
μ10
ethnocide min max min att 1 def( )p M E
μ01 << μ10
Average Miltech

Polity Disintegration• Polities can also collapse• Every time step each polity can dissolve into
the constituent communities with the probability pdisint
disint 0 s ap S U Baseline probability of disintegration

Model parameters
Parameter Explanationβ effect of average ultrasociality on power εmin minimum probability of ethnocide (with all MilTech = 0)
εmax maximum probability of ethnocide (with all MilTech = 1)
δ0 baseline probability of disintegration (for S = 0 and U = 0
δs effect of polity size on probability of disintegration
δa effect of average ultrasociality on probability of disintegration
μ01 probability of mutation to an ultrasocial trait
μ10 probability of ultrasocial trait mutating to non-ultrasocial trait
γ effect of elevation on defensive powerγ1 effect of elevation on the probability of ethnocide
σ probability of Miltech diffusiondsea distance to sea attack
10 ultrasociality loci, 5 miltech loci
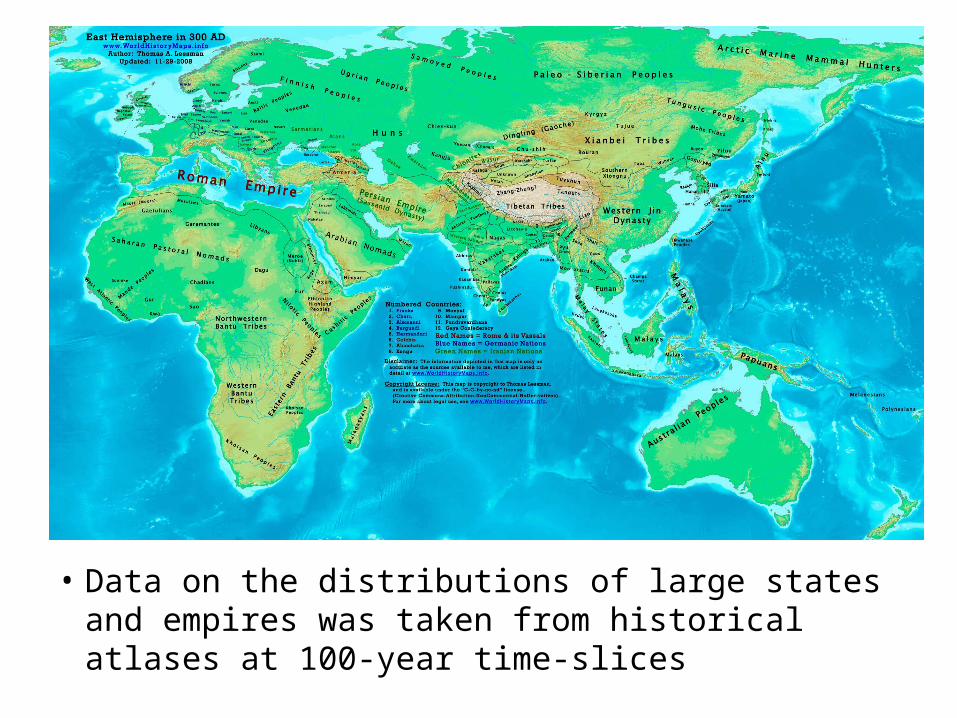
• Data on the distributions of large states and empires was taken from historical atlases at 100-year time-slices

Data are entered into a GIS using the same grid as in the simulation

“Imperial density”

Real Data Simulated Data
Overall model fitR2 ≈ 0.65


Model Era 1 Era 2 Era 3 Overall
Full model 0.56 0.65 0.47 0.65
No elevation effect on defensive power (γ = 0) 0.43 0.68 0.53 0.65
No elevation effect on ethnocide (γ1 = 0) 0.45 0.59 0.40 0.59
No elevation effects (γ = γ1 = 0) 0.31 0.46 0.35 0.48
No effect of MilTech on ethnocide (εmin = εmax= 0.2) 0.09 0.10 0.02 0.17
No effect of MilTech on ethnocide (εmin = εmax= 0.5) 0.08 0.08 0.02 0.16
No effect of MilTech on ethnocide (εmin = εmax= 1) 0.04 0.10 0.00 0.15
No effect of the Steppe (MilTech seeded randomly) 0.03 0.11 0.00 0.17
Null model (no effects of MilTech* and elevation) 0.04 0.17 0.00 0.16

(B)
Distance Class (x 1000 km)
0 1 2 3 4 5 6 7 8
Ave
rage
Imp
eria
l De
nsity
0
2
4
6
8
10
(A)
Century-20 -15 -10 -5 0 5 10 15
Ter
rito
ry o
f the
Lar
ges
t Sta
te (
mln
km
2 , log
-sca
le)
0.1
0.3
1
3
10ChariotWarfare
CavalryWarfare
Military technology (e.g. Chariots and Cavalry)

Spatially-explicit regression analyses
Statistical Model AIC R2 Agriculture Steppe Elevation Horse
Full 16489.5 0.54 0.10 –0.28 –0.09 0.27
Only horse warfare 17031.6 0.43 – – – 0.38
Full without horse 17077.9 0.42 0.11 –0.47 –0.10 –
Steppe & agriculture 17163.5 0.40 0.10 –0.44 – –
Steppe & elevation 17324.0 0.36 – –0.48 –0.10 –
Only steppe 17365.5 0.35 – –0.45 – –
Agricult. & elevation 18336.8 0.07 0.13 – –0.08 –
Only agriculture 18343.6 0.06 0.12 – – –
Only elevation 18518.9 <0.001 – – –0.07 –
Dependent variable – Imperial densityPredictor variables - Agriculture since 1500BC - Distance from the Steppe - Elevation - presence of horse-based warfare technology (estimated historical distribution of chariots/cavalry)


Conclusions• Our model shows how warfare may possibly select for the
evolution of ultrasocial norms and institutions• Matching simulated data to real data on the historical distribution
of large states and empires shows that this model is plausible• Turning off the effects of elevation, ethnocide, or the location of
the spread of miltary technology decrease the fit of the model to the data
• Future work will develop other models and examine alternative hypotheses
• Other research suggests that modern nations economic and political development show positive associations with a long history of statehood (e.g. Acemoglu & Robinson 2012), so this model may help to understand variation in development in the modern world

The Cultural Evolution of Economic Growth & Political Stability
• The Deep Roots of the Modern World - $200,000 grant from the Tricoastal Foundation
• Goal is to investigate the social and ecological factors that determine economic growth and political stability using long-term data as part of the Seshat global history database project


Future Directions
• Assess competing hypotheses for the evolution of socio-political complexity
• Improving our understanding of the agricultural resource base that underpins complex societies
• Focus is on the Old World until 1500BC– what about the Americas, and the last 500 years?
• A project proposal to explore some of these directions is under review at the Leverhulme Trust

Duration and productivity of agriculture
KEYAgriculture at:1500AD (Green)0AD (Light Green1000BC (Light Orange) 3000BC (Dark Orange6000BC (Red)
Data from HYDE

Climate Change

Latitude

Trade

The evolution of social complexity in the New World
• Social Complexity and the Bow in the Prehistoric North American Record• Evolutionary Anthropology Volume 22, Issue 3, May/June 2013

The rise of the west and the making of the modern world
• Our model deals with the period 1500BC-1500AD
• Main imperial hotspots were Eygpt, China and parts of the Middle East
• After this time Europe rose to prominence
• Many possible explanations– Opening up of the new world– Changes in military technology– Development of specific institutions
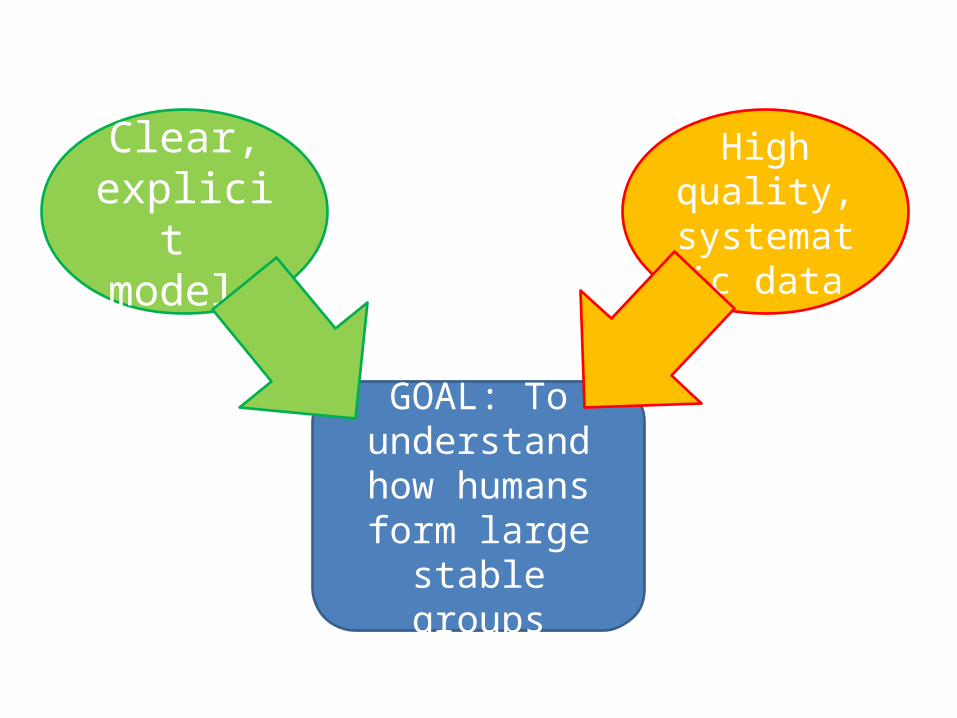
GOAL: To understand how
humans form large stable groups
Clear, explicit models
High quality,
systematic data


Currie et al. (2010), Nature; Currie & Mace (2011) Phil Trans Roy Soc B

Here we extend this approach by creating models that explain where and when the largest, most complex societies arose over a 3000-year period of human history


Limitations of the Approach
• Sampling scheme means we “miss” some historically important polities (e.g. Alexander’s empire)
• Course-grain nature of the underlying ecology and handling of desert (e.g. Iranian plateau) and steppe regions
• Some modelling assumptions can be questioned
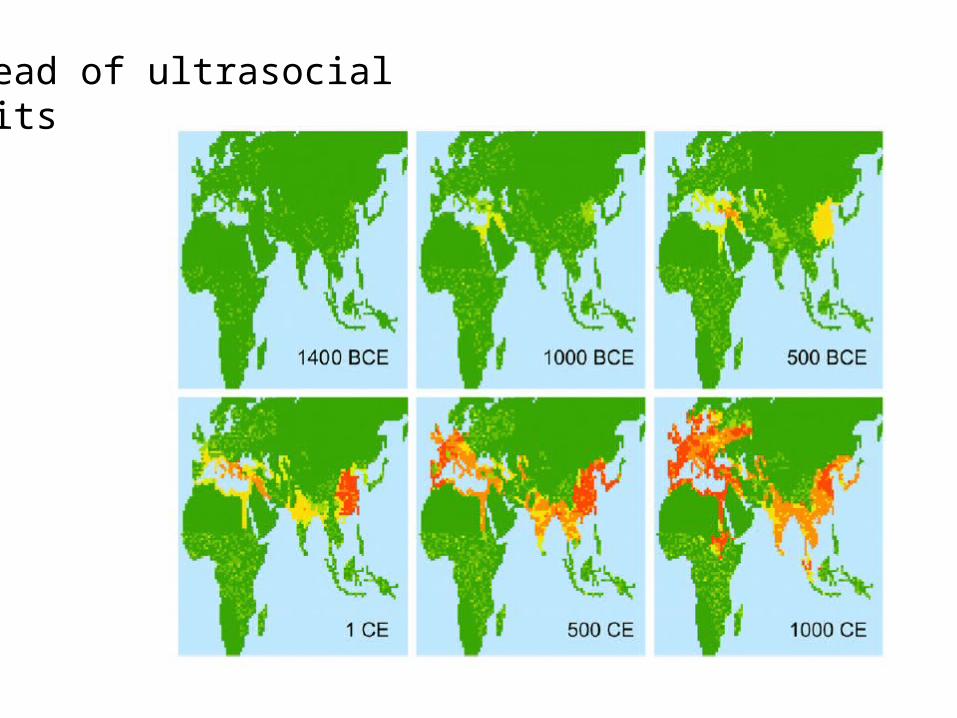
Spread of ultrasocial traits


