GLOBAL REPORT ON DIABETES

WHO Library Cataloguing-in-Publication Data
Global report on diabetes.
1. Diabetes Mellitus – epidemiology. 2. Diabetes Mellitus – prevention and control. 3. Diabetes, Gestational. 4. Chronic Disease. 5. Public Health. I. World Health Organization.
ISBN 978 92 4 156525 7 (NLM classification: WK 810)
© World Health Organization 2016
All rights reserved. Publications of the World Health Organization are available on the WHO website (http://www.who.int) or can be purchased from WHO Press, World Health Organization, 20 Avenue Appia, 1211 Geneva 27, Switzerland (tel.: +41 22 791 3264; fax: +41 22 791 4857; email: [email protected]).
Requests for permission to reproduce or translate WHO publications – whether for sale or for non-commercial distribution – should be addressed to WHO Press through the WHO website (http://www.who.int/about/licensing/copyright_form/index.html).
The designations employed and the presentation of the material in this publication do not imply the expression of any opinion whatsoever on the part of the World Health Organization concerning the legal status of any country, territory, city or area or of its authorities, or concerning the delimitation of its frontiers or boundaries. Dotted and dashed lines on maps represent approximate border lines for which there may not yet be full agreement.
The mention of specific companies or of certain manufacturers’ products does not imply that they are endorsed or recommended by the World Health Organization in preference to others of a similar nature that are not mentioned. Errors and omissions excepted, the names of proprietary products are distinguished by initial capital letters.
All reasonable precautions have been taken by the World Health Organization to verify the information contained in this publication. However, the published material is being distributed without warranty of any kind, either expressed or implied. The responsibility for the interpretation and use of the material lies with the reader. In no event shall the World Health Organization be liable for damages arising from its use.
Design and layout: MEO Design & Communication, meomeo.ch
Printed in France.
3
CONTENTS
Preface
Acknowledgements
Executive summary
Background
Part 1: Global burden of diabetes1.1 Mortality from high blood glucose, including diabetes1.2 Prevalence of diabetes and associated risk factors1.3 Burden and trends in the complications of diabetes1.4 Summary
Part 2: Preventing diabetes2.1 Population-based prevention2.2 Preventing diabetes in people at high risk2.3 Summary
Part 3: Managing diabetes3.1 Diagnosis and early detection3.2 Management of diabetes – core components3.3 Integrated management of diabetes and other chronic health conditions3.4 Access to essential medicines and basic technologies3.5 Summary
Part 4. National capacity for prevention and control of diabetes: a snapshot4.1 National policies and plans for diabetes4.2 National guidelines and protocols4.3 Availability of essential medicines and technologies4.4 Surveillance and monitoring4.5 Summary
Conclusions and recommendations
AnnexesAnnex A. Current WHO recommendations for the diagnostic criteria for diabetes
and intermediate hyperglycaemiaAnnex B. Methods for estimating diabetes prevalence, overweight and obesity
prevalence, mortality attributable to high blood glucose, and price of insulin
4
5
6
10
2021253031
34354042
464749545861
666869717474
76
8283
84
4 PrEfACE
PrEfACE
Diabetes is on the rise. No longer a disease of predominantly rich
nations, the prevalence of diabetes is steadily increasing everywhere,
most markedly in the world’s middle-income countries.
Unfortunately, in many settings the lack of effective policies to create
supportive environments for healthy lifestyles and the lack of access to
quality health care means that the prevention and treatment of diabetes,
particularly for people of modest means, are not being pursued.
When diabetes is uncontrolled, it has dire consequences for health
and well-being.
In addition, diabetes and its complications impact harshly on the finances
of individuals and their families, and the economies of nations. People
with diabetes who depend on life-saving insulin pay the ultimate price
when access to affordable insulin is lacking.
In an effort to address this growing health challenge, since early this decade world leaders have committed
to reducing the burden of diabetes as one of four priority noncommunicable diseases (NCDs).
As part of the 2030 Agenda for Sustainable Development, Member States have set an ambitious target to
reduce premature mortality from NCDs – including diabetes – by one third; achieve universal health coverage;
and provide access to affordable essential medicines – all by 2030.
We have an enormous task at hand, which is why I welcome this first WHO Global report on diabetes. The
report makes an important contribution to our understanding of diabetes and its consequences.
It advances our understanding of trends in diabetes prevalence, of the contribution of high blood glucose
(including diabetes) to premature mortality, and of what action governments are taking to prevent and
control diabetes.
From the analysis it is clear we need stronger responses not only from different sectors of government, but
also from civil society and people with diabetes themselves, and also producers of food and manufacturers
of medicines and medical technologies.
The report reminds us that effectively addressing diabetes does not just happen: it is the result of collective
consensus and public investment in interventions that are affordable, cost-effective and based on the best
available science.
Please join me in ensuring that the findings of this report are used and its recommendations implemented so
that we may indeed halt the rise in diabetes.
Dr Margaret Chan
Director-General
WHO
5ACk NOwl EDGEMEN T S
This report benefited from the dedication, support and expertise of a number of WHO staff and
external collaborators.
Staff from WHO headquarters: Gojka Roglic coordinated and produced the report in collaboration with
an editorial team comprising Cherian Varghese, Leanne Riley and Alison Harvey. Etienne Krug and Ala
Alwan provided strategic direction. Statistical analysis was provided by Melanie Cowan and Stefan Savin.
Timothy Armstrong, Nicholas Banatvala, Douglas Bettcher, Francesco Branca, Edouard Tursan d’Espaignet,
Suzanne Hill, Ivo Kocur, Cécile Macé, Silvio Mariotti, Colin Mathers, Leendert Nederveen, Chizuru Nishida,
Laura Sminkey, Gretchen Stevens, Meindert Van Hilten, Temo Waqanivalu and Stephen Whiting provided
technical input. The country profiles (available online) were prepared by Melanie Cowan with assistance
from Nisreen Abdel Latif, Maggie Awadalla, Sebastian Brown, Alison Commar, Karna Dhiravani, Jessica
Sing Sum Ho, Kacem Iaych, Andre Ilbawi, Xin Ya Lim, Leanne Riley, Slim Slama and Juana Willumsen.
Elena Altieri provided communications support. Joel Tarel, Hélène Dufays and Melissa Foxman Burns provided
administrative support.
Staff from WHO regional offices: Alberto Barcelo, Padmini Angela De Silva, Gampo Dorji, Jill Farrington,
Gauden Galea, Anselm Hennis, Warrick Junsuk Kim, Hai-Rim Shin, Steven Shongwe, Slim Slama, and
Thaksaphon Thamarangasi reviewed the draft report and provided technical input.
WHO wishes to thank the following external contributors and reviewers whose expertise made this report possible:
Stephen Colagiuri, Pamela Donggo, Edward Gregg, Viswanathan Mohan, Nigel Unwin, Rhys Williams and
John Yudkin for providing guidance on content.
James Bentham, Goodarz Danaei, Mariachiara Di Cesare, Majid Ezzati, Kaveh Hajifathalian, Vasilis Kontis,
Yuan Lu and Bin Zhou for data analyses and estimates.
David Beran, Stephen Colagiuri, Edward Gregg, Viswanathan Mohan, Ambady Ramachandran,
Jeffrey Stephens, David Stuckler, John Yudkin, Nicholas Wareham, Rhys Williams and Ping Zhang for writing
sections of the report.
Peter Bennett, Pascal Bovet, David Cavan, Michael Engelgau, Ayesha Motala, Simon O’Neill, Eugene Sobngwi,
Nikhil Tandon and Jaakko Tuomilehto for peer review.
Angela Burton for technical editing.
ACkNOwlEDGEMENTSACkNOwlEDGEMENTS
6 E xECu T IvE SuMMAry
ExECuTIvE SuMMAry
Diabetes is a serious, chronic disease that occurs either when the pancreas does not produce enough insulin
(a hormone that regulates blood sugar, or glucose), or when the body cannot effectively use the insulin it
produces. Diabetes is an important public health problem, one of four priority noncommunicable diseases
(NCDs) targeted for action by world leaders. Both the number of cases and the prevalence of diabetes have
been steadily increasing over the past few decades.
GlOBAl BurDEN
Globally, an estimated 422 million adults were living with diabetes in 2014, compared to 108 million in 1980. The global prevalence (age-standardized) of diabetes has nearly doubled since 1980, rising from 4.7% to
8.5% in the adult population. This reflects an increase in associated risk factors such as being overweight or
obese. Over the past decade, diabetes prevalence has risen faster in low- and middle-income countries than
in high-income countries.
Diabetes caused 1.5 million deaths in 2012. Higher-than-optimal blood glucose caused an additional
2.2 million deaths, by increasing the risks of cardiovascular and other diseases. Forty-three percent of
these 3.7 million deaths occur before the age of 70 years. The percentage of deaths attributable to high
blood glucose or diabetes that occurs prior to age 70 is higher in low- and middle-income countries than in
high-income countries.
Because sophisticated laboratory tests are usually required to distinguish between type 1 diabetes (which
requires insulin injections for survival) and type 2 diabetes (where the body cannot properly use the insulin it
produces), separate global estimates of diabetes prevalence for type 1 and type 2 do not exist. The majority
of people with diabetes are affected by type 2 diabetes. This used to occur nearly entirely among adults, but
now occurs in children too.
COMPlICATIONS
Diabetes of all types can lead to complications in many parts of the body and can increase the overall risk
of dying prematurely. Possible complications include heart attack, stroke, kidney failure, leg amputation,
vision loss and nerve damage. In pregnancy, poorly controlled diabetes increases the risk of fetal death and
other complications.
ECONOMIC IMPACT
Diabetes and its complications bring about substantial economic loss to people with diabetes and their
families, and to health systems and national economies through direct medical costs and loss of work and
wages. While the major cost drivers are hospital and outpatient care, a contributing factor is the rise in cost
for analogue insulins 1 which are increasingly prescribed despite little evidence that they provide significant
advantages over cheaper human insulins.
1. These are insulins derived from human insulin by modifying its structure to change the pharmacokinetic profile.
7E xECu T IvE SuMMAry
PrEvENTING DIABETES
Type 1 diabetes cannot be prevented with current knowledge. Effective approaches are available to prevent
type 2 diabetes and to prevent the complications and premature death that can result from all types of
diabetes. These include policies and practices across whole populations and within specific settings (school,
home, workplace) that contribute to good health for everyone, regardless of whether they have diabetes, such
as exercising regularly, eating healthily, avoiding smoking, and controlling blood pressure and lipids.
Taking a life-course perspective is essential for preventing type 2 diabetes, as it is for many health conditions.
Early in life, when eating and physical activity habits are formed and when the long-term regulation of energy
balance may be programmed, there is a critical window for intervention to mitigate the risk of obesity and
type 2 diabetes later in life.
No single policy or intervention can ensure this happens. It calls for a whole-of-government and whole-of-
society approach, in which all sectors systematically consider the health impact of policies in trade, agriculture,
finance, transport, education and urban planning – recognizing that health is enhanced or obstructed as a
result of policies in these and other areas.
MANAGING DIABETES
The starting point for living well with diabetes is an early diagnosis – the longer a person lives with undiagnosed
and untreated diabetes, the worse their health outcomes are likely to be. Easy access to basic diagnostics,
such as blood glucose testing, should therefore be available in primary health-care settings. Established
systems for referral and back-referral are needed, as patients will need periodic specialist assessment or
treatment for complications.
For those who are diagnosed with diabetes, a series of cost-effective interventions can improve their
outcomes, regardless of what type of diabetes they may have. These interventions include blood glucose
control, through a combination of diet, physical activity and, if necessary, medication; control of blood
pressure and lipids to reduce cardiovascular risk and other complications; and regular screening for damage
to the eyes, kidneys and feet, to facilitate early treatment. Diabetes management can be strengthened
through the use of standards and protocols.
Efforts to improve capacity for diagnosis and treatment of diabetes should occur in the context of integrated
noncommunicable disease (NCD) management to yield better outcomes. At a minimum, diabetes and
cardiovascular disease management can be combined. Integrated management of diabetes and tuberculosis
and/or HIV/AIDS can be considered where there is high prevalence of these diseases.
NATIONAl CAPACITy fOr PrEvENTION AND CONTrOl Of DIABETES
National capacity to prevent and control diabetes as assessed in the 2015 NCD Country Capacity Survey varies
widely by region and country-income level. Most countries report having national diabetes policies, as well
as national policies to reduce key risk factors and national guidelines or protocols to improve management
of diabetes. In some regions and among lower-income countries, however, these policies and guidelines lack
funding and implementation.
In general, primary health-care practitioners in low-income countries do not have access to the basic
technologies needed to help people with diabetes properly manage their disease. Only one in three low- and
8 E xECu T IvE SuMMAry
middle-income countries report that the most basic technologies for diabetes diagnosis and management are
generally available in primary health-care facilities.
Many countries have conducted national population-based surveys of the prevalence of physical inactivity
and overweight and obesity in the past 5 years, but less than half have included blood glucose measurement
in these surveys.
ACCESS TO INSulIN AND OTHEr ESSENTIAl MEDICINES
The lack of access to affordable insulin remains a key impediment to successful treatment and results in
needless complications and premature deaths. Insulin and oral hypoglycaemic agents are reported as
generally available in only a minority of low-income countries. Moreover, essential medicines critical to gaining
control of diabetes, such as agents to lower blood pressure and lipid levels, are frequently unavailable in low-
and middle-income countries. Policy and programme interventions are needed to improve equitable access.
CONCluSIONS AND rECOMMENDATIONS
This first WHO Global report on diabetes underscores the enormous scale of the diabetes problem, and also
the potential to reverse current trends. The political basis for concerted action to address diabetes is there,
woven into the Sustainable Development Goals, the United Nations Political Declaration on NCDs, and the
WHO NCD Global Action Plan. Where built upon, these foundations will catalyse action by all.
Countries can take a series of actions, in line with the objectives of the WHO NCD Global Action Plan 2013–2020,
to reduce the impact of diabetes:
y Establish national mechanisms such as high-level multisectoral commissions to ensure political commitment,
resource allocation, effective leadership and advocacy for an integrated NCD response, with specific attention
to diabetes.
y Build the capacity of ministries of health to exercise a strategic leadership role, engaging stakeholders across
sectors and society. Set national targets and indicators to foster accountability. Ensure that national policies
and plans addressing diabetes are fully costed and then funded and implemented.
y Prioritize actions to prevent people becoming overweight and obese, beginning before birth and in early
childhood. Implement policies and programmes to promote breastfeeding and the consumption of healthy
foods and to discourage the consumption of unhealthy foods, such as sugary sodas. Create supportive built
and social environments for physical activity. A combination of fiscal policies, legislation, changes to the
environment and raising awareness of health risks works best for promoting healthier diets and physical
activity at the necessary scale.
y Strengthen the health system response to NCDs, including diabetes, particularly at primary-care level.
Implement guidelines and protocols to improve diagnosis and management of diabetes in primary health
care. Establish policies and programmes to ensure equitable access to essential technologies for diagnosis
and management. Make essential medicines such as human insulin available and affordable to all who
need them.
y Address key gaps in the diabetes knowledge base. Outcome evaluations of innovative programmes intended
to change behaviour are a particular need.
9E xECu T IvE SuMMAry
y Strengthen national capacity to collect, analyse and use representative data on the burden and trends
of diabetes and its key risk factors. Develop, maintain and strengthen a diabetes registry if feasible and
sustainable.
There are no simple solutions for addressing diabetes but coordinated, multicomponent intervention can make
a significant difference. Everyone can play a role in reducing the impact of all forms of diabetes. Governments,
health-care providers, people with diabetes, civil society, food producers and manufacturers and suppliers of
medicines and technology are all stakeholders. Collectively, they can make a significant contribution to halt
the rise in diabetes and improve the lives of those living with the disease.

BACkGrOuND
11BACkGrOuND
kEy MESSAGES
Diabetes is a chronic, progressive disease characterized by elevated levels of blood glucose.
Diabetes of all types can lead to complications in many parts of the body and can increase the overall risk of dying prematurely.
Countries have committed to halt the rise in diabetes, to reduce diabetes-related premature mortality and to improve access to essential diabetes medicines and basic technologies.
Effective tools are available to prevent type 2 diabetes and to improve management to reduce the complications and premature death that can result from all types of diabetes.
Diabetes is a serious, chronic
disease that occurs either when
the pancreas does not produce
enough insulin (a hormone that
regulates blood glucose), or when
the body cannot effectively use
the insulin it produces (1). Raised
blood glucose, a common effect of
uncontrolled diabetes, may, over
time, lead to serious damage to the
heart, blood vessels, eyes, kidneys
and nerves. More than 400 million
people live with diabetes.
Type 1 diabetes (previously known
as insulin-dependent, juvenile
or childhood-onset diabetes) is
characterized by deficient insulin
production in the body. People
with type 1 diabetes require daily
administration of insulin to regulate
the amount of glucose in their
blood. If they do not have access
to insulin, they cannot survive.
The cause of type 1 diabetes is
not known and it is currently not
preventable. Symptoms include
excessive urination and thirst,
constant hunger, weight loss,
vision changes and fatigue.
Type 2 diabetes (formerly called
non-insulin-dependent or adult-
onset diabetes) results from the
body’s ineffective use of insulin.
Type 2 diabetes accounts for the
vast majority of people with diabetes
around the world (1). Symptoms
may be similar to those of type 1
diabetes, but are often less marked
or absent. As a result, the disease
may go undiagnosed for several
years, until complications have
already arisen. For many years type 2
diabetes was seen only in adults but
it has begun to occur in children.
Impaired glucose tolerance (IGT) and impaired fasting glycaemia (IFG) are intermediate conditions
in the transition between normal
blood glucose levels and diabetes
(especially type 2), though the
transition is not inevitable. People
with IGT or IFG are at increased risk
of heart attacks and strokes.

12 BACkGrOuND
Gestational diabetes (GDM) is a
temporary condition that occurs
in pregnancy and carries long-
term risk of type 2 diabetes (2). The condition is present when
blood glucose values are above
normal but still below those
diagnostic of diabetes (3). Women
with gestational diabetes are
at increased r isk of some
complications during pregnancy
and delivery, as are their infants.
Gestational diabetes is diagnosed
through prenatal screening,
rather than reported symptoms.
rISk fACTOrS fOr DIABETES
Type 1. The exact causes of
type 1 diabetes are unknown. It
is generally agreed that type 1
diabetes is the result of a complex
interaction between genes and
environmental factors, though
no specific environmental risk
factors have been shown to cause
a significant number of cases. The
majority of type 1 diabetes occurs
in children and adolescents.
Type 2. The risk of type 2 diabetes
is determined by an interplay of
genetic and metabolic factors.
Ethnicity, family history of
diabetes, and previous gestational
diabetes combine with older age,
overweight and obesity, unhealthy
diet, physical inactivity and
smoking to increase risk.
Excess body fat, a summary
measure of several aspects of diet
and physical activity, is the strongest
risk factor for type 2 diabetes, both
in terms of clearest evidence base
and largest relative risk. Overweight
and obesity, together with physical
inactivity, are estimated to cause
a large proportion of the global
diabetes burden (4). Higher waist
circumference and higher body mass
index (BMI) are associated with
increased risk of type 2 diabetes,
though the relationship may
vary in different populations (5). Populations in South-East Asia,
for example, develop diabetes at a
lower level of BMI than populations
of European origin (6).
Several dietary practices are linked
to unhealthy body weight and/or
type 2 diabetes risk, including
high intake of saturated fatty
acids, high total fat intake and
inadequate consumption of dietary
fibre (7, 8, 9). High intake of sugar-
sweetened beverages, which
contain considerable amounts
of free sugars, 1 increases the
likelihood of being overweight
or obese, particularly among
children (10, 11). Recent evidence
further suggests an association
between high consumption of
sugar-sweetened beverages and
increased risk of type 2 diabetes
(7, 12, 13, 14).
Early childhood nutrition affects
the risk of type 2 diabetes later in
life. Factors that appear to increase
risk include poor fetal growth,
low birth weight (particularly if
followed by rapid postnatal catch-
up growth) and high birth weight
(15, 16, 17, 18, 19, 20, 21).
Active (as distinct from passive)
smoking increases the risk of
type 2 diabetes, with the highest
risk among heavy smokers (22). Risk remains elevated for about
1. This includes “all monosaccharides and disaccharides added to foods by the manufacturer, cook, or consumer, plus sugars naturally present in honey, syrups, and fruit juices”. Source: Joint WHO/FAO Expert Consultation, WHO Technical Report Series 916 Diet, Nutrition, and the Prevention of Chronic Diseases. Geneva, WHO, 2003.
Overweight and obesity are the
strongest risk factors for type 2 diabetes
13BACkGrOuND
10 years after smoking cessation,
falling more quickly for lighter
smokers (23).
Gestational diabetes. Risk factors
and risk markers for GDM include
age (the older a woman of
reproductive age is, the higher
her risk of GDM); overweight or
obesity; excessive weight gain
during pregnancy; a family history
of diabetes; GDM during a previous
pregnancy; a history of stillbirth
or giving birth to an infant with
congenital abnormality; and excess
glucose in urine during pregnancy
(24). Diabetes in pregnancy and
GDM increase the risk of future
obesity and type 2 diabetes
in offspring.
COMPlICATIONS Of DIABETES
When diabetes is not well
managed, complications develop
that threaten health and endanger
life. Acute complications are a
significant contributor to mortality,
costs and poor quality of life.
Abnormally high blood glucose
can have a life-threatening impact
if it triggers conditions such as
diabetic ketoacidosis (DKA) in
types 1 and 2, and hyperosmolar
coma in type 2. Abnormally low
blood glucose can occur in all
types of diabetes and may result in
seizures or loss of consciousness. It
may happen after skipping a meal
or exercising more than usual,
or if the dosage of anti-diabetic
medication is too high.
Over time diabetes can damage
the heart, blood vessels, eyes,
kidneys and nerves, and increase
the risk of heart disease and
stroke. Such damage can result
in reduced blood flow, which –
combined with nerve damage
(neuropathy) in the feet – increases
the chance of foot ulcers, infection
and the eventual need for limb
amputation. Diabetic retinopathy
is an important cause of blindness
and occurs as a result of long-
term accumulated damage to the
small blood vessels in the retina.
Diabetes is among the leading
causes of kidney failure.
Uncont ro l led d iabetes in
pregnancy can have a devastating
ef fect on both mother and
child, substantially increasing
the risk of fetal loss, congenital
malformations, stillbirth, perinatal
death, obstetric complications,
and maternal morbidity and
mortality. Gestational diabetes
increases the risk of some adverse
outcomes for mother and offspring
during pregnancy, childbir th
and immediately after delivery
(pre-eclampsia and eclampsia in
the mother; large for gestational
age and shoulder dystocia in
the offspring) (25). However, it
is not known what proportion of
obstructed births or maternal and
perinatal deaths can be attributed
to hyperglycaemia.
The combination of increasing
prevalence of diabetes and
increasing lifespans in many
populations with diabetes may be
leading to a changing spectrum
of the types of morbidity that
accompany diabetes. In addition
to the traditional complications
described above, diabetes has
been associated with increased
rates of specific cancers, and
increased rates of physical and
cognitive disability (26). This
diversification of complications
and increased years of life spent
with diabetes indicates a need to
better monitor the quality of life
of people with diabetes and assess
Diabetes can damage the heart, blood vessels, eyes, kidneys and nerves, leading to disability and premature death
14 BACkGrOuND
the impact of interventions on
quality of life.
ECONOMIC IMPACT Of DIABETES
Diabetes imposes a large economic
burden on the global health-care
system and the wider global
economy. This burden can be
measured through direct medical
costs, indirect costs associated
with productivity loss, premature
mortality and the negative impact
of diabetes on nations’ gross
domestic product (GDP).
Direct medical costs associated
with diabetes include expenditures
for preventing and treating
diabetes and its complications.
These include outpatient and
emergency care; inpatient hospital
care; medications and medical
supplies such as injection devices
and self-monitoring consumables;
and long-term care.
Based on cost estimates from a
recent systematic review, it has
been estimated that the direct
annual cost of diabetes to the
world is more than US$ 827 billion
(27, 28). The International Diabetes
Federation (IDF) estimates that
total global health-care spending
on diabetes more than tripled
over the period 2003 to 2013 – the
result of increases in the number
of people with diabetes and
increases in per capita diabetes
spending (29).
While the major diabetes cost
drivers are hospital inpatient and
outpatient care, a contributing
factor to this increase is the rise in
expenditure on patented, branded
medicines used to treat people
with diabetes, including both new
oral treatments for type 2 diabetes
and analogue insulins 1. None of
these preparations has yet been
included in the WHO Model list of essential medicines, 2 because
systematic evidence reviews
find that they provide little or no
advantage over cheaper generic
alternatives (30).
The increase in total global
diabetes health expenditure is
expected to continue. Low- and
middle- income countries will carry
a larger proportion of this future
global health-care expenditure
burden than high-income countries.
Catastrophic medical expenditure. Besides the economic burden
on the health-care system and
national economy, diabetes can
impose a large economic burden
on people with diabetes and their
families in terms of higher out-of-
pocket health-care payments and
loss of family income associated
with disability and premature loss
of life.
The relationship between diabetes
and the risk of catastrophic
medical expenditure by individuals
and families has been explored
in 35 developing countries. This
research found that people with
diabetes had a significantly greater
chance of incurring catastrophic
medical expenditure compared
to similar individuals without
diabetes. Health insurance was not
significantly related to lower risks of
1. These are insulins derived from human insulin by modifying its structure to change the pharmacokinetic profile.
2. WHO's Model list of essential medicines comprises a set of medicines that satisfy the priority health-care needs of the population, meaning they should be available at all times, in adequate amounts and in appropriate dosage forms, at a price the community can afford.
People with diabetes are
more likely to incur catastrophic personal
health expenditure
15BACkGrOuND
catastrophic medical expenditure.
The effects were more marked in
lower-income countries (31).
Impact on national economies. One study estimates that losses
in GDP worldwide from 2011 to
2030, including both the direct and
indirect costs of diabetes, will total
US$ 1.7 trillion, comprising US$ 900
billion for high-income countries
and US$ 800 billion for low- and
middle-income countries (32).
DIABETES AND THE GlOBAl PuBlIC HEAlTH AGENDA
Diabetes is recognized as an
important cause of premature
death and disability. It is one of four
priority noncommunicable diseases
(NCDs) targeted by world leaders
in the 2011 Political Declaration on
the Prevention and Control of NCDs
(33). The declaration recognizes
that the incidence and impacts of
diabetes and other NCDs can be
largely prevented or reduced with
an approach that incorporates
evidence-based, af fordable,
cost-effective, population-wide
and multisectoral interventions.
To catalyse national action, the
World Health Assembly adopted a
comprehensive global monitoring
framework in 2013, comprised of
nine voluntary global targets to
reach by 2025 (see Box 1, page 16).
This was accompanied by the
WHO Global action plan for the prevention and control of NCDs 2013 – 2020 (WHO NCD Global
Action Plan), endorsed by the 66th
World Health Assembly (34), which
provides a roadmap and policy
options to attain the nine voluntary
global targets. Diabetes and its key
risk factors are strongly reflected
in the targets and indicators of the
global monitoring framework and
the WHO NCD Global Action Plan.
These commitment s were
deepened in 2015 by the United
Nations General Assembly’s
adoption of the 2030 Agenda for
Sustainable Development (35). In this context, countries have
agreed to take action to achieve
ambitious targets by 2030 – to
reduce premature mortality from
NCDs by one-third; to achieve
universal health coverage; and
to provide access to affordable
essential medicines.
To halt the rise in obesity and type 2
diabetes it is imperative to scale-up
population-level prevention. Policy
measures are needed to increase
access to affordable, healthy
foods and beverages; to promote
physical activity; and to reduce
exposure to tobacco. Mass media
campaigns and social marketing
can influence positive change and
make healthy behaviours more the
norm. These strategies have the
potential to reduce the occurrence
of type 2 diabetes and may also
reduce complications associated
with diabetes.
To reduce avoidable mortality from
diabetes and improve outcomes,
access to affordable treatment is
critical. Lack of access to insulin in
many countries and communities
remains a critical impediment
to successful treatment efforts.
Inadequate access to oral
hypoglycaemic medication, and
medication to control blood
pressure and lipids, is also a
barrier. Improved management in
primary care with ongoing support
by community health workers can
lead to better control of diabetes
and fewer complications.
This report builds on ongoing global
work to address NCDs. It aims
to draw focused attention to the
Diabetes is 1 of 4 priority NCDs targeted by world leaders

16 BACkGrOuND
public health challenge of diabetes
and to generate momentum for
national, regional and global action.
Part 1 presents an overview of
the global prevalence of diabetes,
the burden of mortality related to
blood glucose, and what is known
about the extent of diabetes-
related complications. Part 2
reviews evidence for action to
prevent type 2 diabetes through
population-wide and targeted
interventions. Part 3 discusses
diagnosis and early detection
of diabetes, along with actions
required to improve outcomes for
those living with it. Part 4 gives the
current status of national responses
to diabetes and provides data
on efforts to monitor, prevent
and manage it (diabetes country
profiles are available at www.who.int/diabetes/global-report). The
final section presents conclusions
and recommendations for realizing
the global commitments made to
prevent diabetes and reduce its
health impact.
BOx 1. vOluNTAry GlOBAl TArGETS fOr PrEvENTION AND CONTrOl Of NONCOMMuNICABlE DISEASES TO BE ATTAINED By 2025
Source: (34).

17BACkGrOuND
18 BACkGrOuND
rEfErENCES
1. Definition, Diagnosis and Classification of Diabetes Mellitus and its Complications. Part 1: Diagnosis and Classification of Diabetes Mellitus (WHO/NCD/NCS/99.2). Geneva: World Health Organization; 1999.
2. Bellamy L, Casas JP, Hingorani AD, Williams D. Type 2 diabetes mellitus after gestational diabetes: a systematic review and meta-analysis. Lancet. 2009;373:1773–1779.
3. Diagnostic criteria and classification of hyperglycaemia first detected in pregnancy (WHO/NMH/MND/13.2). Geneva: World Health Organization; 2013.
4. GBD 2013 Risk Factors Collaborators. Global, regional, and national comparative risk assessment of 79 behavioural, environmental and occupational, and metabolic risks or clusters of risks in 188 countries, 1990–2013: a systematic analysis for the Global Burden of Disease Study 2013. Lancet. 2015;386(10010):2287–323.
5. Vazquez G, Duval S, Jacobs DR Jr, Silventoinen K. Comparison of body mass index, waist circumference and waist/hip ratio in predicting incident diabetes: a meta-analysis. Epidemiologic Reviews. 2007;29:115–28.
6. Ramachandran A, Ma RC, Snehalatha C. Diabetes in Asia. Lancet. 2010;375:(9712)408–418.
7. Ley SH, Hamdy, O, Mohan V, Hu FB. Prevention and management of type 2 diabetes: dietary components and nutritional strategies. Lancet. 2014;383(9933):1999–2007.
8. Fats and fatty acids in human nutrition: report of an expert consultation. FAO Food and Nutrition Paper 91. Rome: Food and Agriculture Organization of the United Nations; 2010.
9. Diet, nutrition and the prevention of chronic diseases: report of a Joint WHO/FAO Expert Consultation. WHO Technical Report Series, No. 916. Geneva: World Health Organization; 2003.
10. WHO Guideline: sugars intake in adults and children. Geneva: World Health Organization; 2015.
11. Te Morenga L, Mallard S, Mann J. Dietary sugars and body weight: systematic review and meta analyses of randomised controlled trials and cohort studies. British Medical Journal. 2013;346:e7492.
12. Imamura F, O’Connor L, Ye Z, Mursu J, Hayashino Y, Bhupathiraju SN, Forouhi NG. Consumption of sugar-sweetened beverages, artificially sweetened beverages, and fruit juice and incidence of type 2 diabetes: systematic review, meta-analysis, and estimation of population attributable fraction. British Medical Journal. 2015;351:h3576.
13. The InterAct consortium. Consumption of sweet beverages and type 2 diabetes incidence in European adults: results from EPIC-InterAct. Diabetologia. 2013;56:1520–30.
14. Malik VS, Popkin BM, Bray GA, Després J-P, Willett WC, Hu FB. Sugar-sweetened beverages and risk of metabolic syndrome and type 2 diabetes: a meta-analysis. Diabetes Care. 2010;33:2477–83.
15. Policy brief: Global nutrition targets 2025: Childhood overweight. Geneva: World Health Organization; 2014.
16. Nolan C, Damm P, Prentki Ml. Type 2 diabetes across generations: from pathophysiology to prevention and management. Lancet. 2011;378(9786):169–181.
17. Darnton-Hill I, Nishida C, James WPT. A life-course approach to diet, nutrition and the prevention of chronic diseases. Public Health Nutrition. 2004;7(1A):101–21.
18. Diet, nutrition and the prevention of chronic diseases. Report of a Joint WHO/FAO Expert Consultation. Geneva: World Health Organization; 2003.
19. Johnsson, IW, Haglund B, Ahlsson F, Gustafsson J. A high birth weight is associated with increased risk of type 2 diabetes and obesity. Pediatric Obesity. 2015;10(2):77–83.
20. Whincup PH, Kaye SJ, Owen CG, et al. Birth weight and risk of type 2 diabetes: a systematic review. Journal of the American Medical Association. 2008;300:2886–2897.
21. Harder T, Rodekamp E, Schellong K, Dudenhausen JW, Plagemann A. Birth weight and subsequent risk of type 2 diabetes: a meta-analysis. American Journal of Epidemiology. 2007;165:849–857.
19BACkGrOuND
22. Willi C, Bodenmann P, Ghali WA, Faris PD, Cornuz J. Active smoking and the risk of type 2 diabetes: a systematic review and meta-analysis. Journal of the American Medical Association. 2007;298:(22)2654–2664.
23. Luo J, Rossouw J, Tong E, Giovino GA, Lee CC, Chen C, et al. Smoking and diabetes: does the increased risk ever go away? American Journal of Epidemiology. 2013;178:(6)937–945.
24. Anna V, van der Ploeg HP, Cheung NW, Huxley RR, Bauman AE. Socio-demographic correlates of the increasing trend in prevalence of gestational diabetes mellitus in a large population of women between 1995 and 2005. Diabetes Care. 2008;31:(12)2288–2293.
25. Wendland EM, Torloni MR, Falavigna M, Trujillo J, Dode MA, Campos MA, et al. Gestational diabetes and pregnancy outcomes – a systematic review of the World Health Organization (WHO) and the International Association of Diabetes in Pregnancy Study Groups (IADPSG) diagnostic criteria. BMC Pregnancy Childbirth. 2012;12:(1)23.
26. Wong E, Backholer K, Gearon E, Harding J, Freak-Poli R, Stevenson C, et al. Diabetes and risk of physical disability in adults: a systematic review and meta-analysis. Lancet Diabetes Endocrinology. 2013;1:(2)106–114.
27. NCD Risk Factor Collaboration (NCD-RisC). Worldwide trends in diabetes since 1980: a pooled analysis of 751 population-based studies with 4*4 million participants. Lancet 2016; published online April 7. http://dx.doi.org/10.1016/S0140-6736(16)00618-8.
28. Seuring T, Archangelidi O, Suhrcke M. The economic costs of type 2 diabetes: A global systematic review. PharmacoEconomics. 2015; 33(8): 811–31.
29. IDF Diabetes Atlas, 6th ed. Brussels, International Diabetes Federation; 2013.
30. Singh SR, Ahmad F, Lal A, Yu C, Bai Z, Bennett H. Efficacy and safety of insulin analogues for the management of diabetes mellitus: a meta-analysis. Canadian Medical Association Journal. 2009;180: (4)385–397.
31. Smith-Spangler CM, Bhattacharya J, Goldhaber-Fiebert JD. Diabetes, its treatment, and catastrophic medical spending in 35 developing countries. Diabetes Care. 2012;35:(2)319–326.
32. Bloom DE, Cafiero ET, Jané-Llopis E, Abrahams-Gessel S, Bloom LR, Fathima S, et al. The global economic burden of noncommunicable diseases (Working Paper Series). Geneva: Harvard School of Public Health and World Economic Forum; 2011.
33. Resolution 66/2. Political Declaration of the High-Level Meeting of the General Assembly on the Prevention and Control of Noncommunicable Diseases. In Sixty-sixth session ofthe United Nations General Assembly. New York: United Nations; 2011.
34. Global action plan for the prevention and control of noncommunicable diseases 2013-2020. Geneva: World Health Organization; 2013.
35. Transforming our world: the 2030 Agenda for Sustainable Development (A/RES/70/1). New York: United Nations General Assembly; 2015.

GlOBAl BurDEN Of DIABETES
PArT 1

21Gl OBAl BurDEN Of DIABE T ES
kEy MESSAGES
Diabetes caused 1.5 million deaths in 2012.
Higher-than-optimal blood glucose was responsible for an additional 2.2 million deaths as a result of increased risks of cardiovascular and other diseases, for a total of 3.7 million deaths related to blood glucose levels in 2012.
Many of these deaths (43%) occur under the age of 70.
In 2014, 422 million people in the world had diabetes – a prevalence of 8.5% among the adult population.
The prevalence of diabetes has been steadily increasing for the past 3 decades and is growing most rapidly in low- and middle-income countries.
Associated risk factors such as being overweight or obese are increasing.
Diabetes is an important cause of blindness, kidney failure, lower limb amputation and other long-term consequences that impact significantly on quality of life.
1.1 MOrTAlITy frOM HIGH BlOOD GluCOSE, INCluDING DIABETES
In 2012 there were 1.5 million
deaths worldwide directly caused
by diabetes. It was the eighth
leading cause of death among both
sexes and the fifth leading cause of
death in women in 2012 (1).
Blood glucose levels that are higher-
than-optimal, even if below the
diagnostic threshold for diabetes,
are a major source of mortality and
morbidity. The diagnostic criterion
for diabetes is fasting plasma
glucose ≥ 7.0 mmol/L – a diagnostic
point selected on the basis of
micro-vascular complications such
as diabetic retinopathy. The risk
of macro-vascular disease, such as
heart attack or stroke, however,
starts increasing well before this
diagnostic point (2, 3). To better
understand the full impact of
blood glucose levels on mortality
therefore requires a look at
mortality related to blood glucose
as a risk factor.
The total burden of deaths from
high blood glucose 1 in 2012 has
been estimated to amount to
3.7 million. This number includes
1.5 million diabetes deaths, and an
additional 2.2 million deaths from
1. High blood glucose is defined as a distribution of fasting plasma glucose in a population that is higher than the theoretical distribution that would minimize risks to health (derived from epidemiological studies). Further details on the values used to calculate the estimates presented here can be found in (2). High blood glucose is a statistical concept, not a clinical or diagnostic category.
22 Gl OBAl BurDEN Of DIABE T ES
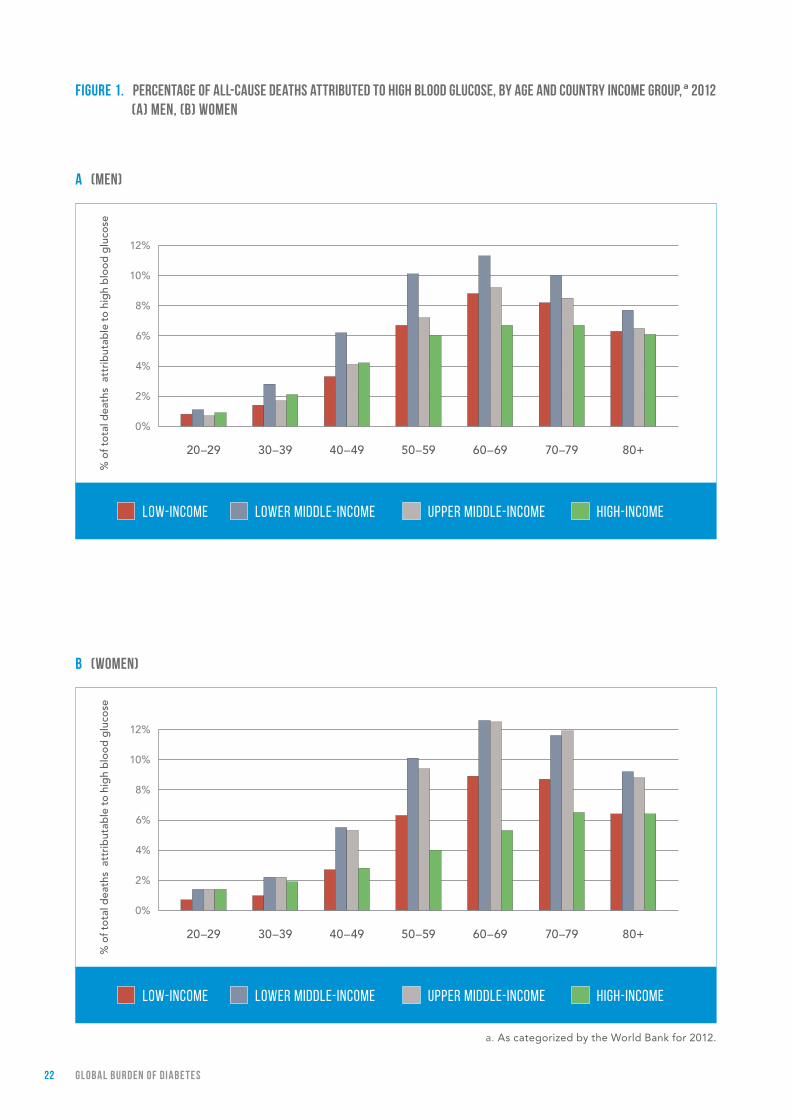
fIGurE 1. PErCENTAGE Of All-CAuSE DEATHS ATTrIBuTED TO HIGH BlOOD GluCOSE, By AGE AND COuNTry INCOME GrOuP, a 2012 (A) MEN, (B) wOMEN
B (wOMEN)
A (MEN)
LOW-INCOME LOWER MIDDLE-INCOME HIGH-INCOMEUPPER MIDDLE-INCOME
% o
f to
tal d
eath
s a
ttri
but
able
to
hig
h b
loo
d g
luco
se
12%
10%
8%
6%
4%
2%
0%
20–29 30–39 40–49 50–59 60–69 70–79 80+
12%
10%
8%
6%
4%
2%
0%
a. As categorized by the World Bank for 2012.
% o
f to
tal d
eath
s a
ttri
but
able
to
hig
h b
loo
d g
luco
se
LOW-INCOME LOWER MIDDLE-INCOME HIGH-INCOMEUPPER MIDDLE-INCOME
30–39 40–49 50–59 60–69 70–79 80+ 20–29
23Gl OBAl BurDEN Of DIABE T ES
to high blood glucose for both
men and women are highest in the
age group 60–69 years.
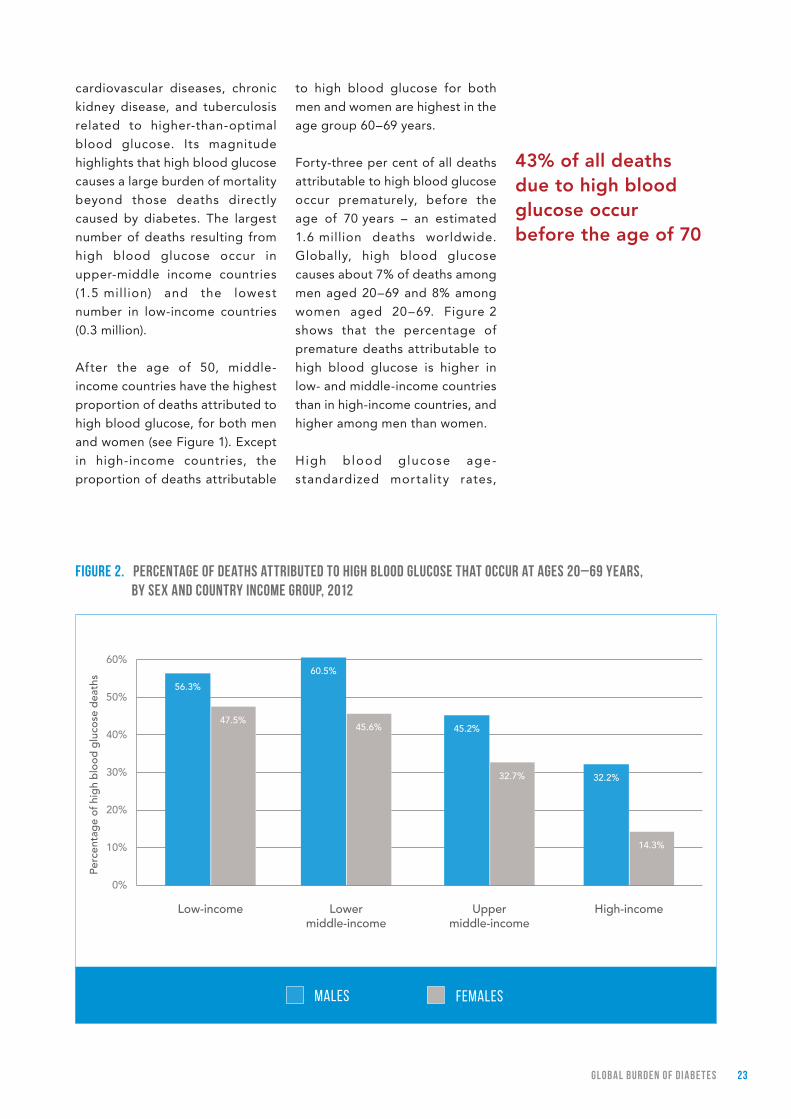
Forty-three per cent of all deaths
attributable to high blood glucose
occur prematurely, before the
age of 70 years – an estimated
1.6 million deaths worldwide.
Globally, high blood glucose
causes about 7% of deaths among
men aged 20–69 and 8% among
women aged 20–69. Figure 2
shows that the percentage of
premature deaths attributable to
high blood glucose is higher in
low- and middle-income countries
than in high-income countries, and
higher among men than women.
High blood glucose age-
standardized mortality rates,
43% of all deaths due to high blood glucose occur before the age of 70
fIGurE 2. PErCENTAGE Of DEATHS ATTrIBuTED TO HIGH BlOOD GluCOSE THAT OCCur AT AGES 20–69 yEArS, By SEx AND COuNTry INCOME GrOuP, 2012
cardiovascular diseases, chronic
kidney disease, and tuberculosis
related to higher-than-optimal
blood glucose. Its magnitude
highlights that high blood glucose
causes a large burden of mortality
beyond those deaths directly
caused by diabetes. The largest
number of deaths resulting from
high blood glucose occur in
upper-middle income countries
(1.5 million) and the lowest
number in low-income countries
(0.3 million).
After the age of 50, middle-
income countries have the highest
proportion of deaths attributed to
high blood glucose, for both men
and women (see Figure 1). Except
in high-income countries, the
proportion of deaths attributable
MALES FEMALES
60%
50%
40%
30%
20%
10%
0%
Low-income Lower middle-income
Upper middle-income
High-income
60.5%
45.6%
32.2%
14.3%
45.2%
32.7%
56.3%
47.5%
Perc
enta
ge
of h
igh
blo
od
glu
cose
dea
ths

24 Gl OBAl BurDEN Of DIABE T ES
which account for differences in
population structure, are highly
variable across WHO regions
(Table 1). Rates are highest in the
WHO Eastern Mediterranean,
South-East Asia, and African
Regions, and much lower in the
remaining regions. In the WHO
TABlE 1. HIGH BlOOD GluCOSE AGE-STANDArDIZED MOrTAlITy rATES PEr 100 000 By wHO rEGION, AGE 20+
Both sexes Female Male
African Region 111.3 110.9 111.1
Region of the Americas 72.6 63.9 82.8
Eastern Mediterranean Region 139.6 140.2 138.3
European Region 55.7 46.5 64.5
South-East Asia Region 115.3 101.8 129.1
Western Pacific Region 67 65.8 67.8
European and South-East Asia
Regions and the Region of the
Americas, high blood glucose
mortality rates are considerably
higher for men than for women.
During the period 2000–2012 the
proportion of premature deaths
fIGurE 3. PErCENTAGE Of All DEATHS ATTrIBuTABlE TO HIGH BlOOD GluCOSE fOr ADulTS AGED 20–69 yEArS, By wHO rEGION AND SEx, fOr yEArS 2000 AND 2012
12%
10%
8%
6%
4%
2%
0%
20122000 2000MEN: WOMEN: 2012
% o
f to
tal d
eath
s at
trib
utab
le t
o hi
gh
blo
od
glu
cose
African Region Region of the Americas
Eastern Mediterranean
Region
European Region
Western Pacific Region
South-East Asia Region
25Gl OBAl BurDEN Of DIABE T ES
(ages 20–69) attributable to high
blood glucose increased for both
sexes across all WHO regions,
except among women in the
WHO European Region (Figure 3).
The increase in the proportion of
deaths attributable to high blood
glucose was highest in the WHO
Western Pacific Region, where the
total number of deaths attributable
to high blood glucose during this
period also increased from 490 000
to 944 000.
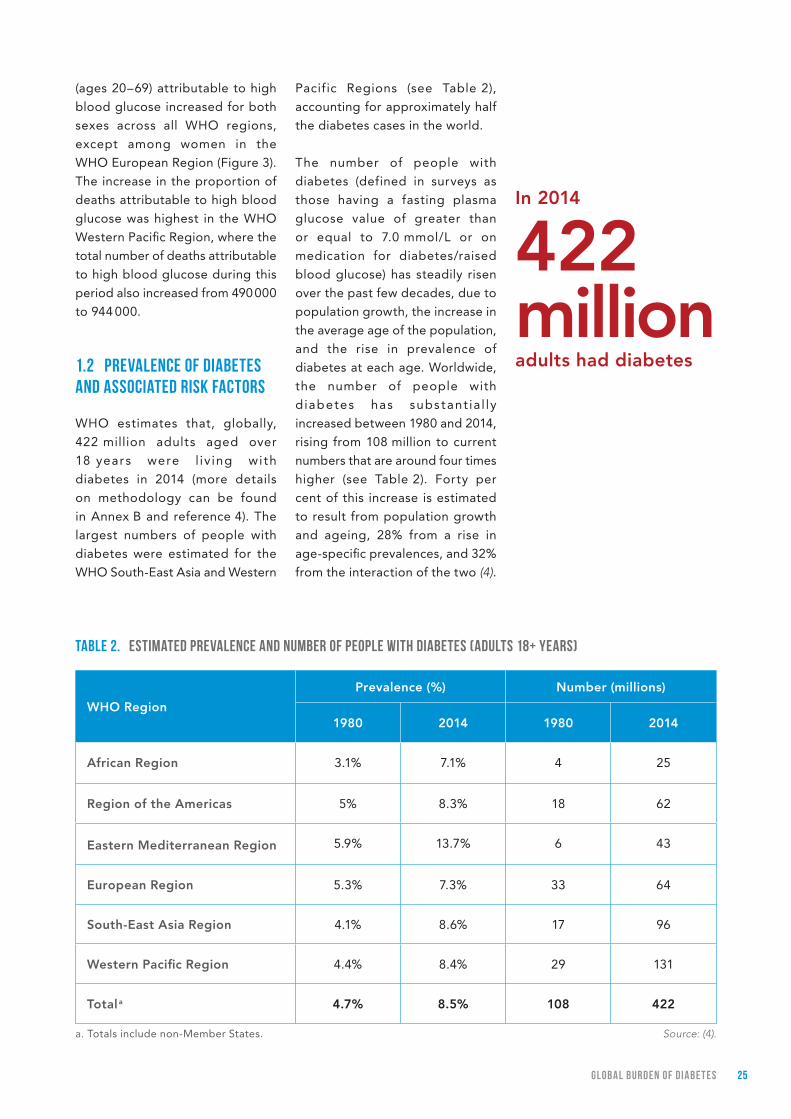
1.2 PrEvAlENCE Of DIABETES AND ASSOCIATED rISk fACTOrS
WHO estimates that, globally,
422 million adults aged over
18 years were l iv ing with
diabetes in 2014 (more details
on methodology can be found
in Annex B and reference 4). The
largest numbers of people with
diabetes were estimated for the
WHO South-East Asia and Western
TABlE 2. ESTIMATED PrEvAlENCE AND NuMBEr Of PEOPlE wITH DIABETES (ADulTS 18+ yEArS)
Pacific Regions (see Table 2),
accounting for approximately half
the diabetes cases in the world.
The number of people with
diabetes (defined in surveys as
those having a fasting plasma
glucose value of greater than
or equal to 7.0 mmol/L or on
medication for diabetes/raised
blood glucose) has steadily risen
over the past few decades, due to
population growth, the increase in
the average age of the population,
and the rise in prevalence of
diabetes at each age. Worldwide,
the number of people with
d iabetes has subs tant ia l ly
increased between 1980 and 2014,
rising from 108 million to current
numbers that are around four times
higher (see Table 2). Forty per
cent of this increase is estimated
to result from population growth
and ageing, 28% from a rise in
age-specific prevalences, and 32%
from the interaction of the two (4).
In 2014
422 million adults had diabetes
a. Totals include non-Member States.
WHO Region
Prevalence (%) Number (millions)
1980 2014 1980 2014
African Region 3.1% 7.1% 4 25
Region of the Americas 5% 8.3% 18 62
Eastern Mediterranean Region 5.9% 13.7% 6 43
European Region 5.3% 7.3% 33 64
South-East Asia Region 4.1% 8.6% 17 96
Western Pacific Region 4.4% 8.4% 29 131
Total a 4.7% 8.5% 108 422
Source: (4).

26 Gl OBAl BurDEN Of DIABE T ES
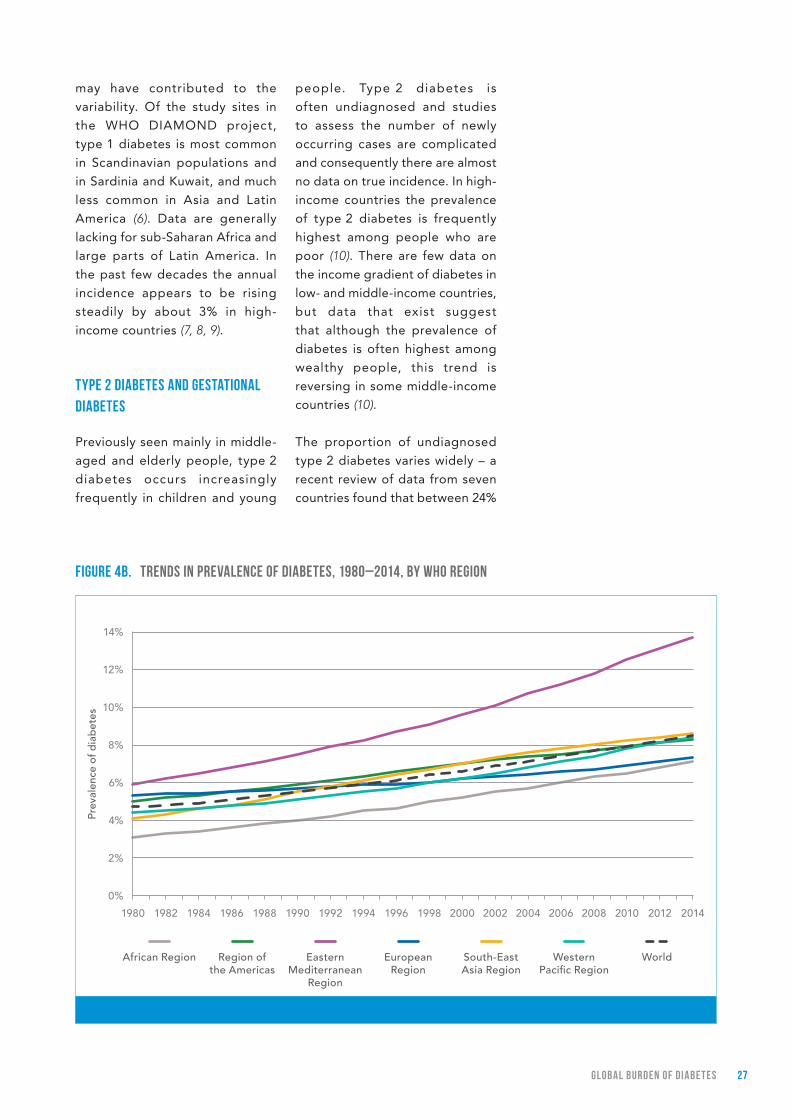
1. Unless otherwise noted, prevalence estimates reported in this section are age-standardized.
In the past 3 decades the
prevalence 1 (age-standardized)
of diabetes has risen substantially
in countries at all income levels,
mirroring the global increase in
the number of people who are
overweight or obese. The global
prevalence of diabetes has grown
from 4.7% in 1980 to 8.5% in 2014,
during which time prevalence has
increased or at best remained
unchanged in every country (4). Over the past decade, diabetes
prevalence has risen faster in
low- and middle-income countries
than in high-income countries
(see Figure 4a). The WHO Eastern
Mediterranean Region has
experienced the greatest rise in
diabetes prevalence, and is now
the WHO region with the highest
prevalence (13.7%) (see Figure 4b).
TyPE 1 DIABETES
Distinguishing between type 1
and type 2 diabetes is not always
easy as it often requires relatively
sophisticated laboratory tests for
pancreas function. Distinct global
estimates of diabetes prevalence
for type 1 and type 2 therefore do
not exist.
Much of our knowledge of the
incidence of type 1 diabetes
relates to children and has been
generated by collaborative
initiatives to develop population-
based, standardized registries
of new cases worldwide, such as
the WHO DIAMOND Project (5). Globally, these registries recorded
large differences in the incidence
and prevalence of type 1 diabetes,
ranging from over 60 to under
0.5 cases annually per 100 000
children aged under 15 years;
differences in case ascertainment
fIGurE 4A. TrENDS IN PrEvAlENCE Of DIABETES, 1980–2014, By COuNTry INCOME GrOuP
10%
8%
6%
4%
2%
0%
1980 1982 1984 1986 1988 1990 1992 1994 1996 1998 2000 2002 2004 2006 2008 2010 2012 2014
Prev
alen
ce o
f dia
bet
es
Low-income Lower middle-income
High-incomeUpper middle-income
World
Diabetes prevalence has doubled since 1980
27Gl OBAl BurDEN Of DIABE T ES
may have contributed to the
variability. Of the study sites in
the WHO DIAMOND project,
type 1 diabetes is most common
in Scandinavian populations and
in Sardinia and Kuwait, and much
less common in Asia and Latin
America (6). Data are generally
lacking for sub-Saharan Africa and
large parts of Latin America. In
the past few decades the annual
incidence appears to be rising
steadily by about 3% in high-
income countries (7, 8, 9).
TyPE 2 DIABETES AND GESTATIONAl DIABETES
Previously seen mainly in middle-
aged and elderly people, type 2
diabetes occurs increasingly
frequently in children and young
people. Type 2 diabetes is
often undiagnosed and studies
to assess the number of newly
occurring cases are complicated
and consequently there are almost
no data on true incidence. In high-
income countries the prevalence
of type 2 diabetes is frequently
highest among people who are
poor (10). There are few data on
the income gradient of diabetes in
low- and middle-income countries,
but data that exist suggest
that although the prevalence of
diabetes is often highest among
wealthy people, this trend is
reversing in some middle-income
countries (10).
The proportion of undiagnosed
type 2 diabetes varies widely – a
recent review of data from seven
countries found that between 24%
fIGurE 4B. TrENDS IN PrEvAlENCE Of DIABETES, 1980–2014, By wHO rEGION
1980 1982 1984 1986 1988 1990 1992 1994 1996 1998 2000 2002 2004 2006 2008 2010 2012 2014
Prev
alen
ce o
f dia
bet
es
12%
14%
10%
8%
6%
4%
2%
0%
African Region European Region
South-East Asia Region
Western Pacific Region
WorldRegion of the Americas
Eastern Mediterranean
Region
28 Gl OBAl BurDEN Of DIABE T ES
and 62% of people with diabetes
were undiagnosed and untreated
(11). Analysis of data from WHO-
supported STEPS surveys in
11 countries underscores the
wide variation in the proportion
of people undiagnosed and
untreated: among people whose
measured blood glucose was at
or above the diagnostic threshold
for diabetes, between 6% and 70%
had been diagnosed with diabetes,
and between 4% and 66% were
taking medication to lower their
blood glucose (12). Even in high-
income countries the proportion
of undiagnosed diabetes can be
as high as 30–50% (13).
The frequency of previously
undiagnosed diabetes in pregnancy
and gestational diabetes varies
among populations but probably
affects 10–25% of pregnancies
(14). It has been estimated that
most (75–90%) of cases of high
blood glucose during pregnancy
are gestational diabetes (15).
ASSOCIATED rISk fACTOrS
Regular physical activity reduces
the risk of diabetes and raised
blood glucose, and is an
important contributor to overall
energy balance, weight control
and obesity prevention – all
risk exposures linked to future
diabetes prevalence (16). The
global target of a 10% relative
reduction in physical inactivity is
therefore strongly associated with
the global target of halting the risk
in diabetes.
However, the prevalence of
physical inactivity globally is of
increasing concern. In 2010, the
latest year for which data are
available, just under a quarter
of all adults aged over 18 years
did not meet the minimum
recommendation for physical
activity per week and were
classified as insufficiently physically
active (16). In all WHO regions and
across all country income groups
women were less active than men,
with 27% of women and 20% of
men classified as insufficiently
physically active. Physical inactivity
is alarmingly common among
adolescents, with 84% of girls and
78% of boys not meeting minimum
requirements for physical activity
for this age. The prevalence of
physical inactivity is highest in
high-income countries where it is
almost double that of low-income
countries. Among WHO regions,
the Eastern Mediterranean Region
showed the highest prevalence
of inactivity in both adults and
adolescents.
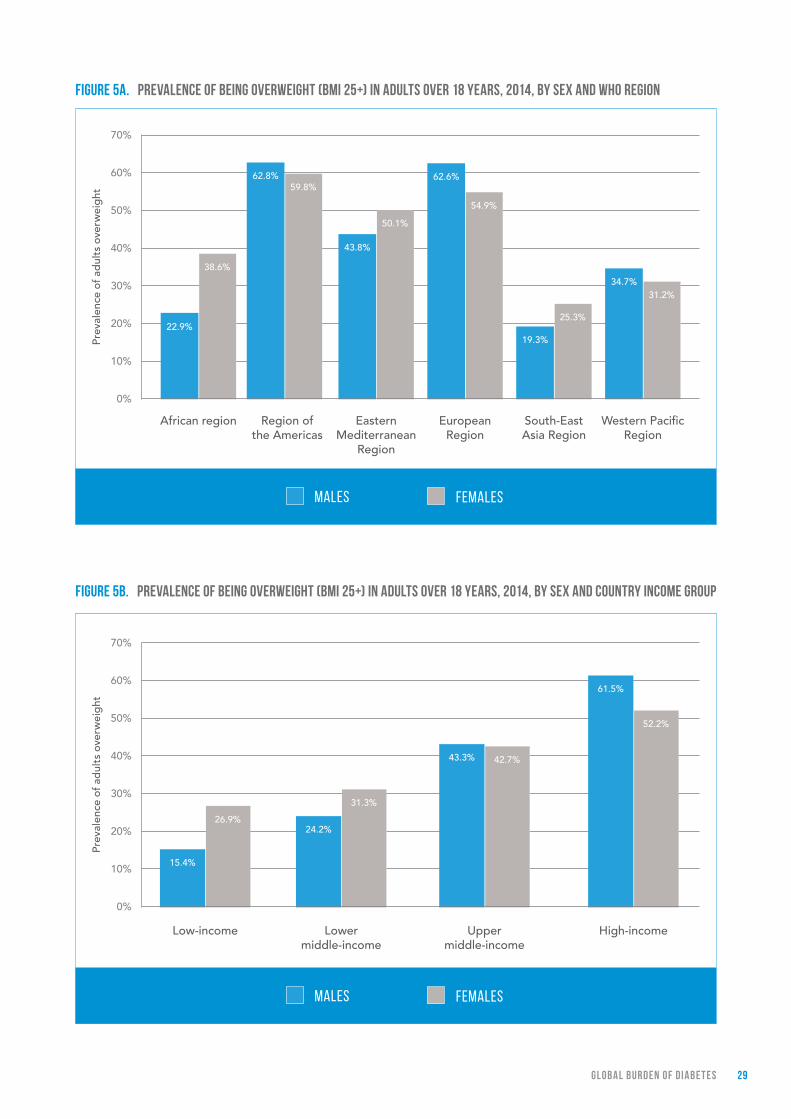
Being overweight or obese is
strongly l inked to diabetes.
Despite the global voluntary
target to halt the rise in obesity by
2025 (16, 17), being overweight or
obese has increased in almost all
countries. In 2014, the latest year
for which global estimates are
available, more than one in three
adults aged over 18 years were
overweight and more than one
in 10 were obese. Women were
more overweight or obese than
men. The prevalence of obesity
was highest in the WHO Region
of the Americas and lowest in the
WHO South-East Asian Region
(see Figure 5a). The proportion
of people who are overweight
or obese increases with country
income level. High- and middle-
income countries have more
than double the overweight and
obesity prevalence of low-income
countries (see Figure 5b).
More than 1 in 3 adults
were overweight and more than
1 in 10 were obese in 2014
29Gl OBAl BurDEN Of DIABE T ES
fIGurE 5A. PrEvAlENCE Of BEING OvErwEIGHT (BMI 25+) IN ADulTS OvEr 18 yEArS, 2014, By SEx AND wHO rEGION
60%
70%
50%
40%
30%
20%
10%
0%
Prev
alen
ce o
f ad
ults
ove
rwei
ght
Region of the Americas
62.8%59.8%
Western Pacific Region
34.7%31.2%
South-East Asia Region
19.3%
25.3%
European Region
62.6%
54.9%
Eastern Mediterranean
Region
43.8%
50.1%
African region
22.9%
38.6%
MALES FEMALES
fIGurE 5B. PrEvAlENCE Of BEING OvErwEIGHT (BMI 25+) IN ADulTS OvEr 18 yEArS, 2014, By SEx AND COuNTry INCOME GrOuP
60%
70%
50%
40%
30%
20%
10%
0%
Prev
alen
ce o
f ad
ults
ove
rwei
ght
Low-income Lower middle-income
Upper middle-income
High-income
15.4%
26.9%24.2%
61.5%
52.2%
31.3%
43.3% 42.7%
MALES FEMALES
30 Gl OBAl BurDEN Of DIABE T ES
1.3 BurDEN AND TrENDS IN THE COMPlICATIONS Of DIABETES
Diabetes, if not well controlled,
may cause blindness, kidney failure,
lower limb amputation and several
other long-term consequences that
impact significantly on quality of
life. There are no global estimates
of diabetes-related end-stage renal
disease, cardiovascular events,
lower-extremity amputations or
pregnancy complications, though
these conditions affect many
people living with diabetes. Where
data are available – mostly from
high-income countries – prevalence,
incidence and trends vary hugely
between countries (18, 19).
lOSS Of vISION
Diabetic retinopathy caused
1.9% of moderate or severe
visual impairment globally and
2.6% of blindness in 2010 (20). Studies suggest that prevalence
of any retinopathy in persons with
diabetes is 35% while proliferative
(vision-threatening) retinopathy
is 7% (21). However, retinopathy
rates are higher among: people
with type 1 diabetes; people
with longer duration of diabetes;
Caucasian populations; and
possibly among people of lower
socioeconomic status (21).
END-STAGE rENAl DISEASE
Pooled data from 54 countries
show that at least 80% of cases of
end-stage renal disease (ESRD) are
caused by diabetes, hypertension
or a combination of the two
(18). The proportion of ESRD
attributable to diabetes alone
ranges from 12–55%. The incidence
of ESRD is up to 10 times as high
in adults with diabetes as those
without. The prevalence of ESRD
is heavily dependent on access
to dialysis and renal replacement
therapy – both of which are highly
variable between (and in some
cases within) countries.
CArDIOvASCulAr EvENTS
Adults with diabetes historically
have a two or three times higher
rate of cardiovascular disease
(CVD) than adults without diabetes
(22). The risk of cardiovascular
disease increases continuously
with rising fasting plasma glucose
levels, even before reaching
levels sufficient for a diabetes
diagnosis (2, 3). The few countries
in north America, Scandinavia
and the United Kingdom of Great
Britain and Northern Ireland that
have studied time trends in the
incidence of cardiovascular events
(myocardial infarction, stroke
or CVD mortality) report large
reductions over the past 20 years
among people with type 1 or
type 2 diabetes (23), although less
than the reduction in the non-
diabetic population. This decrease
has been attributed to reduction
in the prevalence of smoking and
better management of diabetes
and associated CVD risk factors.
lOwEr ExTrEMITy AMPuTATIONS
Diabetes appears to dramatically
increase the risk of lower extremity
amputation because of infected,
non-healing foot ulcers (19). Rates
of amputation in populations with
diagnosed diabetes are typically
10 to 20 times those of non-
diabetic populations, and over the
past decade have ranged from 1.5
to 3.5 events per 1000 persons per
Lower limb amputation rates are 10 to 20 times
higher among people with diabetes
31Gl OBAl BurDEN Of DIABE T ES
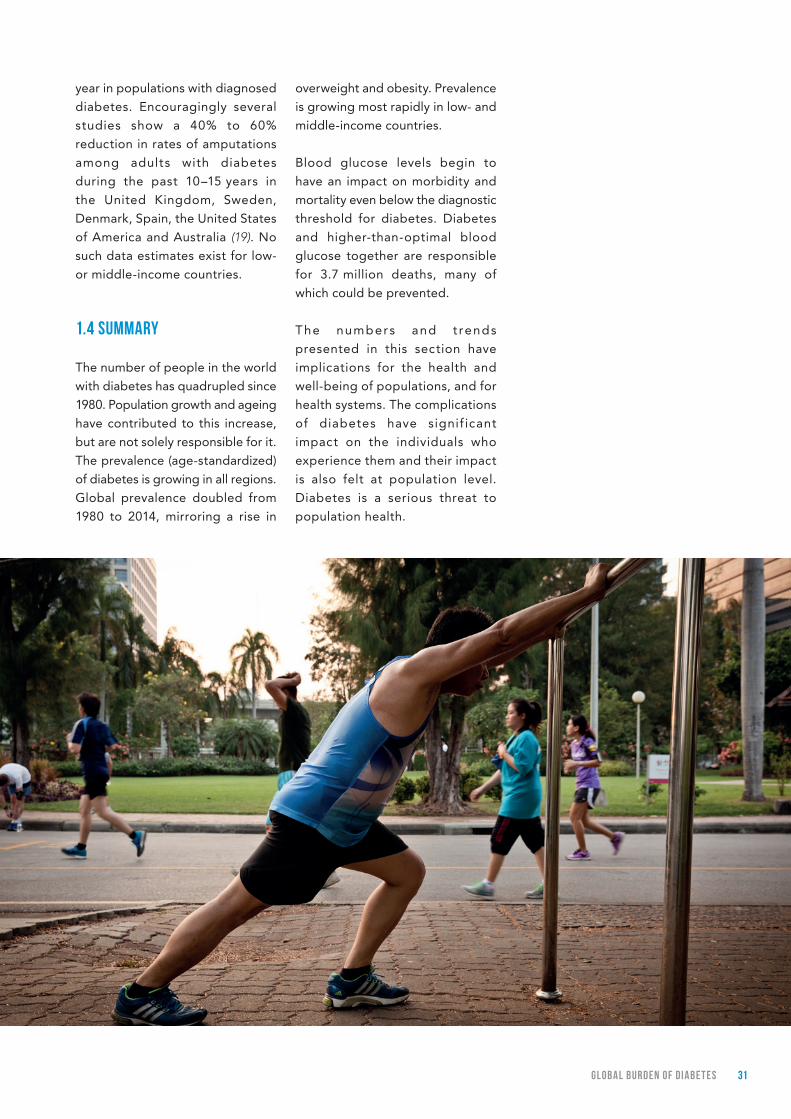
year in populations with diagnosed
diabetes. Encouragingly several
studies show a 40% to 60%
reduction in rates of amputations
among adults with diabetes
during the past 10–15 years in
the United Kingdom, Sweden,
Denmark, Spain, the United States
of America and Australia (19). No
such data estimates exist for low-
or middle-income countries.
1.4 SuMMAry
The number of people in the world
with diabetes has quadrupled since
1980. Population growth and ageing
have contributed to this increase,
but are not solely responsible for it.
The prevalence (age-standardized)
of diabetes is growing in all regions.
Global prevalence doubled from
1980 to 2014, mirroring a rise in
overweight and obesity. Prevalence
is growing most rapidly in low- and
middle-income countries.
Blood glucose levels begin to
have an impact on morbidity and
mortality even below the diagnostic
threshold for diabetes. Diabetes
and higher-than-optimal blood
glucose together are responsible
for 3.7 million deaths, many of
which could be prevented.
The numbers and t rends
presented in this section have
implications for the health and
well-being of populations, and for
health systems. The complications
of diabetes have signif icant
impact on the individuals who
experience them and their impact
is also felt at population level.
Diabetes is a serious threat to
population health.
32 Gl OBAl BurDEN Of DIABE T ES
rEfErENCES
1. WHO Mortality Database [online database]. Geneva: World Health Organization; (http://apps.who.int/healthinfo/statistics/mortality/causeofdeath_query/, accessed 12 January 2016).
2. Singh GM, Danaei G, Farzadfar F, Stevens GA, Woodward M, Wormser D et al. The age-specific quantitative effects of metabolic risk factors on cardiovascular diseases and diabetes: a pooled analysis. PLoS One 2013; 8(7):e65174.
3. Danaei G, Lawes CM, Vander HS, Murray CJ, Ezzati M. Global and regional mortality from ischaemic heart disease and stroke attributable to higher-than-optimum blood glucose concentration: comparative risk assessment. Lancet. 2006;368:(9548)1651–1659.
4. NCD Risk Factor Collaboration (NCD-RisC). Worldwide trends in diabetes since 1980: a pooled analysis of 751 population-based studies with 4*4 million participants. Lancet 2016; published online April 7. http://dx.doi.org/10.1016/S0140-6736(16)00618-8.
5. Incidence and trends of childhood type 1 diabetes worldwide, 1990–1999. Diabetes Medicine. 2006;23:(8)857–866.
6. Tuomilehto J. The emerging global epidemic of type 1 diabetes. Current Diabetes Reports. 2013;13: (6)795–804.
7. Patterson CC, Dahlquist GG, Gyurus E, Green A, Soltesz G. EURODIAB Study Group Incidence trends for childhood type 1 diabetes in Europe during 1989–2003 and predicted new cases 2005–20: a multicentre prospective registration study. Lancet. 2009;373:2027–2033.
8. Dabelea D. The accelerating epidemic of childhood diabetes. Lancet. 2009;373:(9680)1999–2000.
9. Gale EAM. The rise of childhood type 1 diabetes in the 20th century. Diabetes. 2002;51:3353–3361.
10. Diabetes: equity and social determinants. In Equity, social determinants and public health programmes. Blas E, Kuru A, eds. Geneva: World Health Organization; 2010.
11. Gakidou E, Mallinger L, Abbott-Klafter J, Guerrero R, Villalpando S, Ridaura RL, et al. Management of diabetes and associated cardiovascular risk factors in seven countries: a comparison of data from national health examination surveys. Bulletin of the World Health Organization. 2011);89:(3)172–183.
12. Tracking universal health coverage: first global monitoring report. Geneva: World Health Organization; 2015.
13. Beagley J, Guariguata L, Weil C, Motala AA. Global estimates of undiagnosed diabetes in adults.Diabetes Res Clin Pract. 2014;103: 150–160.
14. Jiwani A, Marseille E, Lohse N, Damm P, Hod M, Kahn JG. Gestational diabetes mellitus: results from a survey of country prevalence and practices. Journal of Maternal-Fetal Neonatal Medicine. 2012;25: (6)600–610.
15. Guariguata L, Linnenkamp U, Beagley J, Whiting DR, Cho NH. Global estimates of the prevalence of hyperglycaemia in pregnancy. Diabetes Res Clin Pract. 2014;103, (2) 176–185.
16. Global status report on noncommunicable diseases 2015. Geneva: World Health Organization; 2015.
17. Global action plan for the prevention and control of noncommunicable diseases 2013–2020. Geneva: World Health Organization; 2013.
18. United States Renal Data System. International Comparisons. In United States Renal Data System. 2014 USRDS annual data report: Epidemiology of kidney disease in the United States. Bethesda (MD): National Institutes of Health, National Institute of Diabetes and Digestive and Kidney Diseases; 2014:188–210.
19. Moxey PW, Gogalniceanu P, Hinchliffe RJ, Loftus IM, Jones KJ, Thompson MM, et al. Lower extremity amputations – a review of global variability in incidence. Diabetic Medicine. 2011;28:(10)1144–1153.

33Gl OBAl BurDEN Of DIABE T ES
20. Bourne RR, Stevens GA, White RA, Smith JL, Flaxman SR, Price H, et al. Causes of vision loss worldwide, 1990–2010: a systematic analysis. Lancet Global Health. 2013;1:(6)e339-e349.
21. Yau JW, Rogers SL, Kawasaki R, Lamoureux EL, Kowalski JW, Bek T, et al. Global prevalence and major risk factors of diabetic retinopathy. Diabetes Care. 2012;35:(3)556–564.
22. Emerging Risk Factors Collaboration. Sarwar N, Gao P, Seshasai SR, Gobin R, Kaptoge S, Di Angelantonio E. Diabetes mellitus, fasting blood glucose concentration, and risk of vascular disease: a collaborative meta-analysis of 102 prospective studies. Lancet. 2010 Jun 26;375(9733):2215–22.
23. Barengo NC, Katoh S, Moltchanov V, Tajima N, Tuomilehto J. The diabetes-cardiovascular risk paradox: results from a Finnish population-based prospective study. European Heart Journal. 2008;29:(15)1889–1895.
PrEvENTING DIABETES
PArT 2
35PrE vEN T ING DIABE T ES
The vast majority of the world’s
diabetes cases are type 2 (1). Some
risk factors for type 2 diabetes –
such as genetics, ethnicity and
age – are not modifiable. Others,
such as being overweight or
obese, unhealthy diet, insufficient
physical activity and smoking are
modifiable through behavioural
and environmental changes.
Several effective policy options
are available to facilitate these
behavioural changes and create
supportive environments for
healthy lifestyles. At the individual
level, intensive interventions to
improve diet and physical activity
can prevent or delay the onset
of type 2 diabetes in people at
high risk.
2.1 POPulATION-BASED PrEvENTION
There are strong indications – if
not yet direct evidence – that
population-based programmes
aimed at modifiable risk factors can
reduce the incidence of diabetes
while also lowering blood pressure
and other cardiovascular risk
factors. Population-based data from
Cuba show a fall in type 2 diabetes
during a period of economic crisis
when the population experienced
a reduction in calorie intake and a
simultaneous increase in physical
activity (2), suggesting population-
wide changes in diet and physical
activity do affect type 2 diabetes
prevalence.
Actions to address overweight and
obesity are critical to preventing
type 2 diabetes. Evidence on
what works as a package of
interventions for the prevention
of overweight and obesity is
limited, but much is known about
promotion of healthy diet and
physical activity, which are key
to prevention and attaining the
global obesity and diabetes target
(see Box 1, page 16). Promoting
healthy diets and increasing
kEy MESSAGES
Type 2 diabetes is largely preventable.
Multisectoral, population-based approaches are needed to reduce the prevalence of modifiable diabetes risk factors – such as overweight, obesity, physical inactivity and unhealthy diet – in the general population.
A combination of fiscal policies, legislation, changes to the environment and raising awareness of health risks works best for promoting healthier diets and physical activity.
Diabetes can be delayed or prevented in people who are overweight and have impaired glucose tolerance (IGT). Diet and physical activity interventions are more effective than medication.
36 PrE vEN T ING DIABE T ES
physical activity in the population
will help reduce the occurrence of
obesity and type 2 diabetes, and
will accrue additional benefits by
reducing complications among
people with all types of diabetes
and glucose intolerance. WHO’s
recommendations for healthy diet
and physical activity relevant to
diabetes are summarized in Box 2.
Population-level interventions to
reduce tobacco use may contribute
to prevention of type 2 diabetes,
given emerging evidence of a
link between smoking and type 2
diabetes risk. Active tobacco use
BOx 2. HEAlTHy DIET AND PHySICAl ACTIvITy
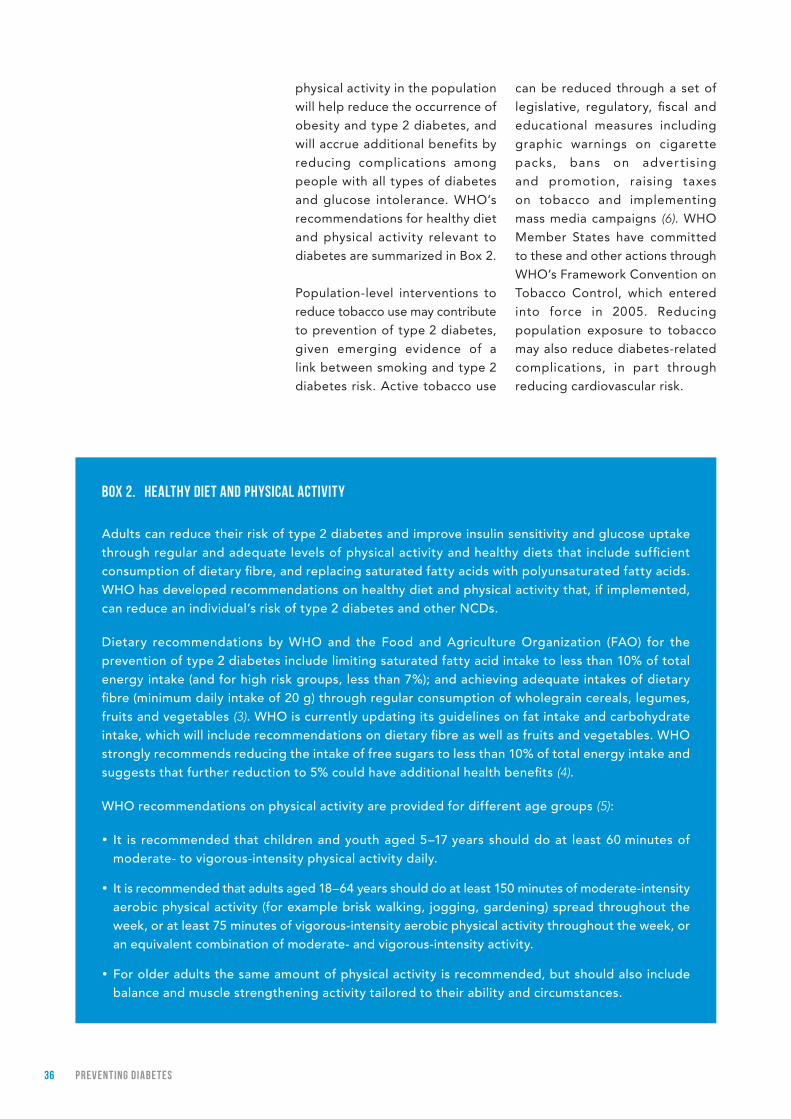
Adults can reduce their risk of type 2 diabetes and improve insulin sensitivity and glucose uptake through regular and adequate levels of physical activity and healthy diets that include sufficient consumption of dietary fibre, and replacing saturated fatty acids with polyunsaturated fatty acids. WHO has developed recommendations on healthy diet and physical activity that, if implemented, can reduce an individual’s risk of type 2 diabetes and other NCDs.
Dietary recommendations by WHO and the Food and Agriculture Organization (FAO) for the prevention of type 2 diabetes include limiting saturated fatty acid intake to less than 10% of total energy intake (and for high risk groups, less than 7%); and achieving adequate intakes of dietary fibre (minimum daily intake of 20 g) through regular consumption of wholegrain cereals, legumes, fruits and vegetables (3). WHO is currently updating its guidelines on fat intake and carbohydrate intake, which will include recommendations on dietary fibre as well as fruits and vegetables. WHO strongly recommends reducing the intake of free sugars to less than 10% of total energy intake and suggests that further reduction to 5% could have additional health benefits (4).
WHO recommendations on physical activity are provided for different age groups (5):
y It is recommended that children and youth aged 5–17 years should do at least 60 minutes of moderate- to vigorous-intensity physical activity daily.
y It is recommended that adults aged 18–64 years should do at least 150 minutes of moderate-intensity aerobic physical activity (for example brisk walking, jogging, gardening) spread throughout the week, or at least 75 minutes of vigorous-intensity aerobic physical activity throughout the week, or an equivalent combination of moderate- and vigorous-intensity activity.
y For older adults the same amount of physical activity is recommended, but should also include balance and muscle strengthening activity tailored to their ability and circumstances.
can be reduced through a set of
legislative, regulatory, fiscal and
educational measures including
graphic warnings on cigarette
packs, bans on adver tising
and promotion, raising taxes
on tobacco and implementing
mass media campaigns (6). WHO
Member States have committed
to these and other actions through
WHO’s Framework Convention on
Tobacco Control, which entered
into force in 2005. Reducing
population exposure to tobacco
may also reduce diabetes-related
complications, in part through
reducing cardiovascular risk.
37PrE vEN T ING DIABE T ES
The rise in diabetes risk factors
has occurred in the context of
changes in the social, economic
and physical environments in which
we are born and live. Population-
based prevention aims not only to
reduce risk factors for diabetes
and NCDs, but also to shape the
broader environments in which
people live, eat, study, work and
play, so that healthy choices are
accessible and easy to make.
No single policy or intervention can
achieve changes of this magnitude.
Such an agenda calls for a “whole-
of-government” approach, in
which all sectors systematically
consider the health impact of
policies in trade, agriculture,
finance, transport, education and
urban planning – recognizing that
health is enhanced or obstructed
as a result of policies in these and
other areas.
A lIfE-COurSE APPrOACH TO PrEvENTING DIABETES
Taking a life-course perspective
is essential for type 2 diabetes
prevention. Early in life, when
eating and physical activity
habits are formed and when the
long-term regulation of energy
balance may be programmed
(7), there is a critical window for
intervention to mitigate the risk
of obesity and type 2 diabetes
later in life (8). The report of the
WHO Commission on Ending
Childhood Obesity (9) provides
a comprehensive, integrated
package of recommendations to
address childhood obesity that
will contribute to the reduction
of risks for developing type 2
diabetes. A life-course approach
to diabetes would also recognize
the increasing risk that comes with
advancing age, and the need to
identify the unique needs for risk
reduction in older adults.
IMPrOvING EArly CHIlDHOOD NuTrITION
Strategies to improve early
childhood nutrition should not be
overlooked among type 2 diabetes
prevention efforts. These actions
must be aimed at improving
maternal health and nutritional
status and infant and young child-
feeding practices, focusing on the
first 1000 days from a woman’s
pregnancy to her child’s second
birthday (3). Specific measures
include promoting the nutritional
well-being of pregnant women;
promotion of breast feeding,
including the implementation of
the Code of Marketing of Breast
Milk Substitutes; improving the
nutritional status of infants and
young children through exclusive
breastfeeding up to 6 months of
age; introducing a variety of safe,
nutritious and adequate foods at
6 months of age to complement
breast feeding (which should
continue until babies are 2 years
of age or more); promoting
growth in height; preventing the
consumption of foods that are
high in energy, fats, sugars and
sodium; and facilitating physical
activity (10).
SuPPOrTIvE ENvIrONMENTS fOr PHySICAl ACTIvITy
The physical or built environment
plays an important role in
facilitating physical activity for
many people. Urban planning
and active transport policies can
ensure that walking, cycling and
other forms of non-motorized
Actions to address overweight and obesity are critical to preventing type 2 diabetes
38 PrE vEN T ING DIABE T ES
transport are accessible and safe
for all. The physical environment
can also provide sports, recreation
and leisure facilities, and ensure
there are adequate safe spaces
for active living for both children
and adults (11). The poorest
groups in society, especially
women, may have less time and
fewer resources to participate in
leisure-time activity, making policy
interventions that target active
transport and incidental physical
activity throughout the day much
more important. Promotion of
stair use – including placement
of physical activity promotion
messages on stairs – as part of a
workplace programme has been
shown to increase awareness and
use of stairs (12).
The sports sector can encourage
regular structured activities,
especially among children and
adolescents, and can strengthen
the link between physical activity,
sports and health. Partnerships
with communities, the private
sector and nongovernmental
organizations can also contribute
to developing facil it ies for
physical activity.
SETTINGS-BASED INTErvENTIONS
Settings-based interventions
can support diabetes prevention
and control. These interventions
reach families and communities
where they live, study, work
and play to implement both
population-wide and individual
high-risk interventions. Settings-
based interventions should
be comprehensive, make use
of existing programmes when
possible and focus on actions
that do not require additional
resources.
A whole-of-school approach that
focuses on improving both diet
and physical activity can be very
effective in improving dietary
patterns both inside and outside
school (13). Successful school-based
physical activity interventions
should result in consistent
improvements in the knowledge,
attitudes and behaviour of children
and, when tested, in physical and
clinical outcomes (14). WHO’s
health-promoting schools initiative
has demonstrated the importance
of highlighting both the impact
on attendance and educational
achievement, as well as the health
benefits of a whole-of-school
approach (15).
Wo r k p l a c e i n t e r v e n t i o n s
addressing diet and physical
activity can be ef fective in
changing behaviours and health-
related outcomes (16). Healthy-
eating messages in cafés and
restaurants have been shown to
stimulate consumption of healthy
food − provided that healthy food
items are made available as part
of the intervention (17). Workplaces
can help develop environments
that are conducive to physical
activity at work and provide
incentives and opportunities for
active commuting to and from
work. Workplaces may offer their
employees free or discounted
vouchers for physical activity
facilities.
fISCAl, lEGISlATIvE AND rEGulATOry MEASurES fOr HEAlTHy DIET
Fiscal measures. Price is often
reported as a barrier to people
buying and consuming healthy
foods. Likewise, policy action to
increase the price of foods high
in fat, sugar and salt can decrease
Policies that increase the price
of foods high in fat, sugar and salt can decrease their
consumption
39PrE vEN T ING DIABE T ES
their consumption (see Box 3).
There is emerging evidence that
appropriately designed fiscal
policies, when implemented
together with other policy actions,
have the potential to promote
healthier diets (18). Fiscal policies
should be considered a key
component of a comprehensive
strategy for prevention and control
of NCDs, including diabetes.
Trade and agricultural policies that promote healthy diets. Trade
measures have proven effective
in reducing the availability of
unhealthy foods and changing
people’s diet. For example, in 2000
Fiji banned the supply of high-fat
mutton flaps under the Trading
Standards Act. Also, in Mauritius,
the reduction of saturated fatty
acids in cooking oil and their
replacement with soya bean oil
is estimated to have changed
consumption patterns for the
best, and reduced average total
cholesterol levels (19). Changes in
agricultural subsidies to encourage
fruit and vegetable production can
be beneficial in increasing their
consumption and improving diet.
Evidence strongly supports the
use of such subsidies and related
policies to facilitate sustained
long-term production, transport
and marketing of healthier
foods (20).
Regulation of marketing of foods high in sugars, fats and salt. There is ample evidence
that the marketing of foods
and non-alcoholic beverages
influences children’s knowledge,
attitudes, beliefs and preferences.
WHO has developed a set
of recommendations and an
implementation framework on
the marketing of foods and non-
alcoholic beverages to children (26). This aims to assist Member States
in designing and implementing
new policies – or strengthening
existing ones – that regulate the
marketing of food to children.
Nutrition labelling is a regulatory
tool that can guide consumers
towards healthier food choices.
BOx 3. THE “SuGAr-SwEETENED BEvErAGE TAx”, MExICO
The prevalence of overweight and obesity in Mexico stands at more than 33% in children and around 70% in adults (21). Mexico has the highest prevalence of diabetes among Organization for Economic Cooperation and Development (OECD) member countries (22), and the highest per capita consumption of soft drinks worldwide (23).
In January 2014 Mexico implemented a nationwide tax on drinks containing added sugar (bebidas azucaradas) that increased their price by over 10%. While it is too early to draw far-reaching conclusions, one analysis estimated that the 10% increase in the price of added-sugar drinks was associated with an 11.6% decrease in the quantity consumed (24).
During the first year of the tax, purchases of taxed sugar-sweetened beverages decreased by an average of 6% compared to what would have been expected without implementation of the tax (25), with higher reductions found in households of low socioeconomic status.
40 PrE vEN T ING DIABE T ES
Nutrition labelling comprises nutrient
declarations and supplementary
nutrition information commonly
referred to as front-of-pack labelling.
The nutrient declarations provide
quantitative information and
usually appear on small print on
the back of packages; front-of-pack
labelling is designed to assist in
interpreting nutrient declarations.
Front-of-pack labelling may also
encourage manufacturers to make
the composition of retail food
products healthier, to achieve
competitive advantages or to
avoid unfavourable disclosures
about food composition. There is
evidence that simple, front-of-pack
labels on packaged foods, or point-
of-purchase information in grocery
stores, cafés or restaurants, can
be beneficial to support healthier
options, as can menu labelling (27).
EDuCATION, SOCIAl MArkETING AND MOBIlIZATION
Consumer awarenes s and
knowledge of healthy diet and
physical activity can be achieved
through sustained media and
educational campaigns aimed at
increasing consumption of healthy
foods (or reducing consumption
of less healthy ones), and
increasing physical activity. These
campaigns have greater impact
and are more cost-effective when
used within multicomponent
strategies (28). For example, a
social marketing campaign in
Tonga using netball to promote
physical activity among women as
part of a national NCD campaign
has resul ted in increased
participation both in netball and
leisure-time physical activity by
women (29).
2.2 PrEvENTING DIABETES IN PEOPlE AT HIGH rISk
Research in different parts of the
world has shown that intensive
interventions that change people’s
diet, increase physical activity and
lead to the loss of excess body
weight can prevent type 2 diabetes
in people with impaired glucose
tolerance, with or without impaired
fasting glucose. For example, the
Diabetes Prevention Program
(DPP) in the USA (30), the Finnish
Diabetes Prevention Study (DPS)
(31) and the Chinese Da Qing Study
showed that active intervention,
lasting 2 to 6 years, could have
extended benefits for glycaemic
and cardiovascular outcomes that
last for 10 to 20 years (32).
S e v e r a l p h a r m a c o l o g i c a l
inter ventions (for example,
metformin and acarbose) have
also been shown to prevent or
delay type 2 diabetes but, in the
majority of studies, this is not as
effective as changes in diet and
physical activity, and the effect
dissipates after discontinuation
of the medication (33, 34).
Knowledge gained from these
proof-of-concept studies confirms
that type 2 diabetes can be
delayed or prevented, but turning
this knowledge into large-
scale impact brings significant
challenges. The success of these
programmes depends on the
feasibility of identifying, assessing
and successfully involving high-
risk groups (see Box 4). Careful
decisions are required about how
to assess diabetes risk, how to
support those identified as high-
risk, and how to ensure care for
those diagnosed with diabetes
as a result of the risk assessment.
The individual or high-risk
Interventions that promote healthy diet, physical activity
and weight loss can prevent type 2 diabetes in people
at high risk
41PrE vEN T ING DIABE T ES
BOx 4. ExAMPlES Of TOOlS TO ASSESS THE rISk Of HAvING CurrENT Or fuTurE DIABETES
Measurement of blood glucose remains the best predictor of type 2 diabetes risk, though a wide and ever-increasing range of biomarkers has been reported to predict future development of type 2 diabetes. The risk of having or developing type 2 diabetes can also be assessed using tools that cover variables such as age, sex, history of GDM and family history of diabetes, as well as clinical measures of body mass index, waist circumference and waist-hip ratio. Several tools that assess the risk of having undiagnosed or future diabetes have been developed and adapted for use in diverse populations:
y FINRISK: a simple score adapted for use in several countries, using age, BMI, waist circumference, history of anti-hypertensive drug treatment and high blood glucose, physical activity, and daily consumption of fruits, berries or vegetables to estimate risk (35).
y AUSDRISK: a 10-item questionnaire that estimates risk of progression to type 2 diabetes over 5 years. Its scoring includes questions based on age, sex, ethnicity, family history of diabetes, history of abnormal glucose metabolism, smoking status, current hypertensive treatment, physical activity, fruit and vegetable consumption, and waist circumference (36).
y IDRS (Indian Diabetes Risk Score): a simplified risk score for identifying undiagnosed diabetic subjects using four simple parameters – age, waist circumference, family history of diabetes and physical activity. IDRS is an inexpensive and simple tool for screening for risk of undiagnosed diabetes (37).
approach needs to be translated
into well-defined strategies for
implementation at community
level and in national programmes,
in accordance with available
resources. It has the potential to
overwhelm primary care services,
where the responsibility for
intervention usually lies.
There is no universal answer
regarding the advisability of
population screening for type 2
diabetes risk. Assessment of
diabetes risk should not be
confused with the total risk
approach to cardiovascular disease
risk in which diabetes is included
as one component. Diabetes is not
only a risk factor for CVD, it also
has its own specific complications.
However, given the overlap of
diabetes and CVD risk factors,
combined screening for risk of both
conditions is a rational approach.
The decision to systematically look
for people at high risk of diabetes
and CVD is a strategic one specific
to each health-care setting, and
will depend, at least in part, on
the numbers likely to be identified
and the resources available to
adequately deal with them (see
also Chapter 4 for early detection
of undiagnosed diabetes).
Whether or not intensive individual
interventions are made available,
and whether or not systematic
assessment of risk is undertaken,
primary health-care services must
be equipped to manage people
with high risk of type 2 diabetes.
Clinical vigilance alone, even in
the absence of systems for early
detection of type 2 diabetes or
systematic risk prediction, will
identify people who are at high
42 PrE vEN T ING DIABE T ES
risk for future development of
type 2 diabetes. These people
should receive (as a minimum)
repeat counselling on weight loss,
diet, physical activity and smoking.
While type 2 diabetes is potentially
preventable, the causes and risk
factors for type 1 diabetes remain
unknown and prevention strategies
have not yet been successful
(see Box 5).
2.3 SuMMAry
Much type 2 diabetes results from
modifiable risk factors that can
be reduced using a combination
of approaches at population
and individual levels. Creating
supportive policy, social and
physical environments for healthy
lifestyles is a key aspect of type 2
diabetes prevention. Sustaining
the lifestyle changes needed to
reduce risk requires supportive
family and social networks, as well
as an enabling food system and
physical environment. Healthy
food and opportunities for physical
activity must be available and
affordable.
BOx 5. TOwArDS PrEvENTION Of TyPE 1 DIABETES
A variety of immunological approaches have been successful at preventing a disease similar to human type 1 diabetes in laboratory animals. As a result, hope has emerged that analogous interventions in humans might prevent type 1 diabetes or significantly slow the decline in beta cell function that characterizes the condition. Effective intervention of this nature could significantly reduce the incidence of type 1 diabetes and its long-term complications, greatly enhancing quality of life for people living with it.
Primary prevention trials involving dietary modification have been conducted with infants identified through genetic screening as being at highest risk of developing type 1 diabetes. Tested interventions and factors have included early exposure to cows’ milk; the age of introduction of solid foods; supplementation with an omega-3 fatty acid; and supplementation with vitamin D. None of the trials has shown a reduction in type 1 incidence.
Other trials have focused on relatives of people with type 1 diabetes. Two large randomized clinical trials have explored the use of vitamin B6 supplementation in adults and children who are related to people with type 1 diabetes and are pancreatic islet antibody-positive, with negative results. Injected insulin and oral insulin have also been explored as preventive interventions in children with antibodies to insulin. The overall results were negative but a subgroup with the highest concentration of anti-insulin antibodies at the start of the trial showed some delay in onset.
Other approaches, as yet unsuccessful, have been treatment of people at high risk with nasal insulin, low-dose cyclosporine and with a monoclonal antibody.
Source: (38)
Much type 2 diabetes results from risk factors
that can be reduced using a combination
of approaches at population and
individual levels.
43PrE vEN T ING DIABE T ES
The WHO Global NCD Action
Plan 2013–2020 sets out policy
options for reducing modifiable
NCD risk factors. Scaled-up
implementation of these should
reduce the occurrence of type 2
diabetes. Achieving the global
voluntary target to halt the rising
trend of obesity and diabetes
will, however, require innovation
and the scaling-up in particular of
interventions to promote healthy
diets and physical activity, as well
as innovative ways to measure
impact and expand the evidence
base fo r popu la t ion -w ide
prevention.
Implementation of ef fec tive
strategies to reduce modifiable
risk factors for diabetes and
other NCDs frequently face
powerful industry opposition.
Trade measures and regulatory
policies such as taxes on foods
and beverages; restriction of
marketing of unhealthy foods and
non-alcoholic beverages; and
implementing ef fective front-
of-package labelling frequently
face opposition from industry.
Interference by food and beverage
companies in policy-making and
conflicts of interest can lead to
the adoption of industry self-
regulatory schemes that tend to
be less effective than government
regulation.
A whole-of-government approach,
and even a whole-of-society
approach, is essential to the success
of most of these strategies. Without
support from the highest level of
government, it may be difficult to
engage effectively with other key
sectors, such as trade, industry,
agriculture and education.
As noted by the WHO Commission
on Ending Childhood Obesity, a
comprehensive approach is needed
to change the environmental
factors that encourage weight gain
and obesity (9). Action is required
both to increase physical activity
and healthy diet, and to reduce
sedentary behaviours and intake
of unhealthy foods and beverages.
Particular consideration should
be given to the impact of these
interventions on populations of
lower socioeconomic status, who
often lack access to healthier
foods and opportunities for
physical activity.
44 PrE vEN T ING DIABE T ES
rEfErENCES
1. Definition, diagnosis and classification of diabetes mellitus and its complications. Part 1: Diagnosis and classification of diabetes mellitus. WHO/NCD/NCS/99.2. Geneva: World Health Organization; 1999.
2. Franco M, Bilal U, Orduñez P, Benet M, Morejon A, Caballero B et al. Population-wide weight loss and regain in relation to diabetes burden and cardiovascular mortality in Cuba 1980-2010: repeated cross sectional surveys and ecological comparison of secular trends. British Medical Journal. 2013;346.
3. Diet, nutrition and the prevention of chronic diseases. Report of a joint WHO/FAO expert consultation. WHO Technical Report series No 916. Geneva: World Health Organization; 2003.
4. Sugars intake for adults and children. Guidelines. Geneva: World Health Organization; 2015.
5. Global recommendations on physical activity for health. Geneva: World Health Organization; 2010.
6. Tobacco. WHO Fact Sheet No 339. Geneva: World Health Organization; 2015.
7. Vickers MH. Early life nutrition, epigenetics and programming of later life disease. Nutrients. 2014;6:(6)2165–2178.
8. Global nutrition targets 2025: Childhood overweight [policy brief]. Geneva: World Health Organization; 2014.
9. Commission on Ending Childhood Obesity. Geneva: World Health Organization; 2015.
10. Darnton-Hill I, Nishida C, James WP. A life course approach to diet, nutrition and the prevention of chronic diseases. Public Health Nutrition. 2004;7:(1A)101–121.
11. Mozaffarian D, Afshin A, Benowitz NL, Bittner V, Daniels SR, Franch HA. Population approaches to improve diet, physical activity, and smoking habits: a scientific statement from the American Heart Association. Circulation. 2012;126:(12)1514–1563.
12. Interventions on diet and physical activity. What works. Geneva: World Health Organization; 2009.
13. School policy framework: implementation of the WHO global strategy on diet, physical activity and health. Geneva: World Health Organization; 2008.
14. Kahn EB, Ramsey LT, Brownson RC, Heath GW, Howze EH, Powell KE, et al. The effectiveness of interventions to increase physical activity. A systematic review. American Journal of Preventive Medicine. 2002;22:(4 Suppl)73–107.
15. Health-promoting schools. A healthy setting for living, learning and working. Geneva: World Health Organization; 1998.
16. Task Force on Community Preventive Services. A recommendation to improve employee weight status through worksite health promotion programs targeting nutrition, physical activity or both. American Journal of Preventive Medicine. 2009;37:358–359.
17. Preventing noncommunicable diseases in the workplace through diet and physical activity. WHO/World Economic Forum report of a joint event. Geneva: World Health Organization/World Economic Forum; 2008.
18. Fiscal policy options with potential for improving diets for the prevention of noncommunicable diseases (NCDs). Geneva: World Health Organization; 2015.
19. Uusitalo U, Feskens EJ, Tuomilehto J, Dowse G, Haw U, Fareed D, et al. Fall in total cholesterol concentration over 5 years in association with changes in fatty acid composition of cooking oil in Mauritius: cross sectional survey. British Medical Journal. 1996;313:(7064)1044–1046.
20. Wallinga D. Agricultural policy and childhood obesity: a food systems and public health commentary. Health Affairs (Millwood). 2010;29:(3)405–410.
21. Gutierrez J, River-Dommarco J, Shamah-Levy T, et al. Encuesta Nacional de Salud y Nutricion 2012. Resultados Nacionales [National Health and Nutrition Survey, 2012. National Results]. Mexico: National Institute of Public Health; 2012.

45PrE vEN T ING DIABE T ES
22. Organization of Economic Cooperation and Development. Health at a Glance 2015. Washington DC: Brookings Institution Press; 2015.
23. EuroMonitor International. Passport Global Market Information Database [http://www.euromonitor.com/passport]
24. Colchero MA, Salgado JC, Unar-Munguia M, Hernandez-Avila M, Rivera-Dommarco JA. Price elasticity of the demand for sugar-sweetened beverages and soft drinks in Mexico. Economics and Human Biology. 2015;19:129–137.
25. Colchero MA, Popkin BM, Rivera JA, Ng SW. Beverage purchases from stores in Mexico under the excise tax on sugar sweetened beverages: observational study. British Medical Journal. 2016;352:h6704.
26. Set of recommendations on the marketing of foods and non-alcoholic beverages to children. Geneva: World Health Organization; 2010.
27. Kelly B. Front-of-pack labelling: a comprehensive review. Geneva: World Health Organization (in press).
28. Cecchini M, Sassi F, Lauer JA, Lee YY, Guajardo-Barron V, Chisholm D. Tackling of unhealthy diets, physical inactivity, and obesity: health effects and cost-effectiveness. Lancet. 2010;376:(9754)1775–1784.
29. Turk T, Latu N, Cocker-Palu E, Liavaa V, Vivili P, Gloede S, et al. Using rapid assessment and response to operationalise physical activity strategic health communication campaigns in Tonga. Health Promotion Journal of Australia. 2013;24:(1)13–19.
30. Knowler WC, Barrett-Connor E, Fowler SE, Hamman RF, Lachin JM, Walker EA, et al. Reduction in the incidence of type 2 diabetes with lifestyle intervention or metformin. New England Journal of Medicine. 2002;346:(6)393–403.
31. Uusitupa M, Peltonen M, Lindstrom J, Aunola S, Ilanne-Parikka P, Keinanen-Kiukaanniemi, et al. Ten-year mortality and cardiovascular morbidity in the Finnish Diabetes Prevention Study – secondary analysis of the randomized trial. PLoS.One. 2009;4:(5)e5656.
32. Li G, Zhang P, Wang J, Gregg EW, Yang W, Gong Q, et al. The long-term effect of lifestyle interventions to prevent diabetes in the China Da Qing Diabetes Prevention Study: a 20-year follow-up study. Lancet. 2008;371:(9626)1783–1789.
33. Merlotti C, Morabito A, Pontiroli AE. Prevention of type 2 diabetes; a systematic review and meta-analysis of different intervention strategies. Diabetes, Obesity and Metabolism. 2014;16:(8)719–727.
34. Orozco LJ, Buchleitner AM, Gimenez-Perez G, Roque IF, Richter B, Mauricio D. Exercise or exercise and diet for preventing type 2 diabetes mellitus. Cochrane Database of Systematic Reviews. 2008;(3):CD003054.
35. Lindstrom J, Tuomilehto J. The diabetes risk score: a practical tool to predict type 2 diabetes risk. Diabetes Care. 2003;26:(3)725–731.
36. Chen L, Magliano DJ, Balkau B, Colagiuri S, Zimmet PZ, Tonkin AM, et al. AUSDRISK: an Australian type 2 diabetes risk assessment tool based on demographic, lifestyle and simple anthropometric measures. Medical Journal of Australia. 2010;192:(4)197–202.
37. Mohan V, Sandeep S, Deepa M, Gokulakrishnan K, Datta M, Deepa R. A diabetes risk score helps identify metabolic syndrome and cardiovascular risk in Indians – the Chennai Urban Rural Epidemiology Study (CURES-38). Diabetes, Obesity and Metabolism. 2007;9:(3)337–343.
38. Skyler JS. in International textbook on diabetes mellitus, 4 ed. Chichester, UK; Wiley Blackwell, 2015, pp. 541–549.

PArT 3MANAGING DIABETES
47MANAGING DIABE T ES
kEy MESSAGES
People with diabetes can live long and healthy lives if their diabetes is detected and well-managed.
Good management using a standardized protocol can potentially prevent complications and premature death from diabetes using: a small set of generic medicines; interventions to promote healthy lifestyles; patient education to facilitate self-care; regular screening for early detection and treatment of complications through a multidisciplinary team.
Facilities for diabetes diagnosis and management should be available in primary health-care settings, with an established referral and back-referral system.
In countries with a high burden of diabetes and tuberculosis or HIV/AIDS, there is frequent coexistence of these conditions and integrated management is recommended.
Access to essential medicines (including life-saving insulin) and technologies is worryingly limited in low- and middle-income countries.
Well-structured health services
can provide the key interventions
and regular follow-up necessary
to help people with diabetes
live long and relatively healthy
lives, even though it is a chronic,
progressive disease. Many of these
interventions are known to be
cost-effective or cost-saving, and
are feasible even in low-resource
settings (1, 2, 3). Controlling blood
glucose levels and cardiovascular
disease risk through counselling
to promote a healthy diet and
physical activity, and through
use of medicines, is considered a
“best buy” for reducing the health
impact of NCDs.
Encouragingly, reductions in the
rates of several diabetes-related
compl icat ions (amputat ion,
cardiovascular disease, vision loss,
end-stage renal disease) have been
observed in countries that have
adequate data to examine trends
over time (4). Where reductions in
complications have been observed
at population level they are likely
to be the result of improvements in
the management of key risk factors
such as smoking, blood pressure
and lipid levels, and blood glucose,
along with improvements in the
organization and quality of care.
3.1 DIAGNOSIS AND EArly DETECTION
The starting point for living well
with diabetes is an early diagnosis
– the longer a person lives with
undiagnosed and untreated
diabetes, the worse the health
outcomes are likely to be. Easy
48 MANAGING DIABE T ES
access to basic diagnostics for
diabetes is therefore essential and
diagnosis should be available in
primary health-care settings.
Type 1 diabetes often presents
with symptoms that prompt the
patient to contact health services
–thirst, weight loss and copious
urination. Type 2 diabetes often
shows no symptoms, and some
patients contact health services
because of a complication such
as vision loss, heart attack or
limb gangrene. Type 2 diabetes
develops slowly and there is
often a very long period of time
in which the disease is present but
undetected.
Diabetes is diagnosed by measuring
glucose in a blood sample taken
while the patient is in a fasting
state, or 2 hours after a 75 g oral
load of glucose has been taken (see
Annex A). Diabetes can also be
diagnosed by measuring glycated
haemoglobin (HbA1c), even if the
patient is not in a fasting state
(5). HbA1c reflects the average
blood glucose concentration over
the past few weeks, rather than
the blood glucose concentration
at that moment (reflected by
the fasting and 2-hour blood
glucose measurements mentioned
above). However, the test is
more costly than blood glucose
measurement (5).
Blood glucose measurement to
diagnose diabetes should be
available at the primary health-
care level. If laboratory analysis
of venous plasma glucose is not
feasible, point-of-care devices that
measure glucose in capillary blood
and meet current International
Standardization Organization
(ISO) standards are an acceptable
alternative. Unfortunately, testing
devices and supplies are often not
available where or when necessary –
one survey found the availability of
blood glucose meters ranged from
21% to 100% in facilities visited in
five developing countries (6).
EArly DETECTION Of TyPE 2 DIABETES
Whether people should be
screened or not for type 2 diabetes
is a much-debated question and
currently there is no definitive
evidence from randomized trials
to answer it. Some evidence
suggests there are benefits to
early detection and treatment,
largely because the reduced
lead time between onset and
diagnosis speeds the treatment
of cardiovascular risk factors –
particularly improved management
of lipids and blood pressure (7).
The decision to put in place (or
not put in place) systems for
early detection is a strategic one
that depends on a number of
factors. Screening programmes
will increase the number of
clinically diagnosed cases of
type 2 diabetes and as such will
increase the health-care system
workload, not only in dealing with
the process of early detection
but, more importantly, in dealing
with the increased number of
clinically diagnosed cases that will
be found (8). No system should be
established without consideration
of whether local health-care
resources are sufficient to cope
with this extra workload. Simply
adding new cases to a health-
care system without additional
investment will, in the absence of
compensating efficiencies, result in
poorer average care (9).
The longer a person lives with undiagnosed and
untreated diabetes, the worse their
health outcomes are likely to be
49MANAGING DIABE T ES
3.2 MANAGEMENT Of DIABETES – COrE COMPONENTS
People with diabetes require
access to systematic, ongoing and
organized care delivered by a team
of skilled health-care providers.
Outcomes can be improved at
the primary care level with basic
interventions involving medication,
health education and counselling,
and consistent follow-up. This
systematic care should include
a periodic review of metabolic
control and complications, an
agreed and continually updated
diabetes care plan, and access
to person-centred care provided
by a multidisciplinary team. New
technologies such as telemedicine
and mobile phone technology are
also increasingly being used and
have the potential to reach remote
areas (see Box 7).
While most treatment and tests
can be done at primary care level,
periodic referral for specialist
care is required, for example, for
comprehensive eye examinations,
laser and surgical treatment of eye
complications, complex kidney
function tests, and tests of the
heart and arteries in the limbs.
All cases of acute cardiovascular
disease, diabetic coma, kidney
failure and infected foot ulcers
should be managed in a hospital.
BOx 6. PEN fA’A, SAMOA: ISlAND fAMIlIES COME TOGETHEr TO COMBAT NCDS, IMPrOvE HEAlTH AND SAvE lIvES
Half of all adults in Samoa are at high risk of developing NCDs such as cancer, diabetes and heart disease. Despite improvements in overall health over the past few decades, the island has a high and growing prevalence of NCDs.
In response to this public health threat, PEN Fa’a Samoa (an adaptation of WHO PEN protocols), with support from WHO, was initiated in November 2014 in several demonstration sites. PEN Fa’a Samoa has three main pillars: early detection of NCDs, NCD management, and increased community awareness. The model takes advantage of existing community structures where extended families continue to play a significant role in daily life and culture. Each village in Samoa has a women’s committee representative whose role is to liaise with government agencies to facilitate early NCD detection.
In communities where the pilot has been implemented, over 92% of the target population has now been reached, thanks in large part to efforts by women’s committee representatives to inform and encourage villagers to participate. Of those screened, 12.7% of people aged over 40 years have been tested and found to have hyperglycaemia. Through the PEN Fa’a Samoa implementation, members of the community with abnormal results are referred to a management team at the district health facility and seen by a physician who discusses a management and treatment plan with them, and prescribes medication and behaviour changes. Trained community women representatives then help patients carry out their treatment plan. The Ministry of Health and the National Health Service, with the support of WHO, aim to replicate PEN Fa’a Samoa in more villages on the island to achieve full implementation by the end of 2016.
50 MANAGING DIABE T ES
National guidelines and management
protocols developed for (or adapted
to) individual settings are useful
tools in achieving a standardized and
consistent management approach.
They should cover these basic
principles of diabetes management:
y Interventions to promote and
suppor t healthy l i fes t y les,
including healthy diet, physical
activity, avoidance of tobacco
use and harmful use of alcohol.
y Medication for blood glucose
control – insulin or oral hypo-
glycaemic agents as required.
y Medication to control cardio-
vascular disease risk.
y Regular exams for early detection
of complications: comprehensive
eye examination 1, measurement
of urine protein, and assessment
of feet for signs of neuropathy.
y Standard criteria for referral of
patients from primary care to
secondary or tertiary care.
1. Comprehensive eye examination includes visual acuity, intraocular pressure measurement and dilated examination of the retina and the optic nerve head, with retinal imaging strongly recommended.
BOx 7. IMPrOvING DIABETES MANAGEMENT uSING MOBIlE TECHNOlOGy
SMS-based programmes can contribute to the prevention and management of diabetes in a way that is acceptable to patients and the general population. Interventions studied span the disease spectrum, using one-way and two-way SMS messages to provide information, medication reminders, and increase patient-provider communication.
Reviews of existing clinical studies indicate that text messaging can be effective in promoting positive health behaviour change and disease management for people with diabetes (10). When properly designed, mobile diabetes support has generated a statistically significant improvement in areas such as patient glycaemic control in the short-term and long-term (over 6 months), and medication adherence (11, 12).
The mRamadan initiative, Senegal
During Ramadan, a lack of understanding of safe ways to manage the fasting tradition can lead to severe health problems and complications for people with diabetes. Every year during Ramadan, health authorities in Senegal witness a peak in the urgent hospitalization of people with uncontrolled diabetes.
The Government of Senegal was keen to use mobile technology to improve access to support during Ramadan for people with diabetes, and began a programme in 2014 with technical support from WHO and the International Telecommunications Union (ITU). The programme sent SMS tips and advice to enrolled diabetics during Ramadan to promote good health behaviours during and between fasting periods. This included reminders for people to drink at least 1 litre of water each morning before beginning the fast; information for health-care providers on medication use; and which foods to avoid when breaking a fast in the evening. In a qualitative review, users reported it as a helpful source of support. When the mRamadan programme was run in 2015 for a second round the programme saw 12 000 self-recruited users, highlighting demand and the potential for further expansion.
1. Comprehensive eye examination includes visual acuity, intraocular pressure measurement and dilated examination of the retina and the optic nerve head, with retinal imaging strongly recommended.
51MANAGING DIABE T ES
y Integrated management of
diabetes and other diseases
(see Diabetes and other NCDs,
page 55).
The effectiveness of diabetes
management ultimately depends
on people’s compliance with
recommendations and treatment.
Patient education is therefore
an important component of
diabetes management. Patients
need to understand the principles
and importance of a healthy
diet, adequate physical activity,
avoidance of tobacco and harmful
use of alcohol, adherence to
medication, foot hygiene and
appropriate footwear, and the
need for periodic assessment
of metabolic control and the
presence or progression of
complications (13).
INTErvENTIONS TO PrOMOTE HEAlTHIEr EATING AND PHySICAl ACTIvITy
All people with diabetes need
counselling on healthy diet and
regular physical activity, adapted
to their capabilities. Existing
guidelines for dietary management
of type 2 diabetes do not give
ident ical recommendat ions,
but all agree on: a lower calorie
intake for overweight and obese
patients, and replacing saturated
fats with unsaturated fats (14); intake of dietary fibre equal to or
higher than that recommended
for the general population (15); and avoiding added sugars,
tobacco use and excessive use of
alcohol (16). Education of patients
in groups is a cost-effective
strategy (13).
It has been suspected for some time
that energy restriction through a
very low-calorie diet can lead to
the reduction of symptoms or to
the reversal of hyperglycaemia
typical of type 2 diabetes – the
reversal may be maintained so
long as weight is not regained (17) (see Box 8).
Energy restr ic t ion through
bariatric (or metabolic) surgery to
reduce the size of the stomach is
now established as an effective
treatment for severe obesity-
related type 2 diabetes, at least
in communities and health-care
contexts where necessary resources
are available. The disappearance
of diabetes that occurs in a large
number of diabetic patients after
bariatric surgery often happens
within days of surgery, similar
to that which occurs at the
start of a very low-calorie diet,
before weight loss – indicating
the possible role of gut-related
hormones in glucose metabolism.
Depending on the surgical
technique, reduction in excess
body weight ranges from 54–72%
(18). However, many health-
care settings lack the required
resources for this type of surgery,
making such treatment accessible
to only a few.
In addition to general health
benefits, physical activity appears
to have a beneficial effect on insulin
action, blood glucose control
and metabolic abnormalities
associated with diabetes. Physical
activity can also be beneficial in
reducing cardiovascular disease
risk factors. Activity should be
regular and ideally combine
aerobic exercise with resistance
training (19).
Blood glucose control is important in preventing and slowing the progression of complications
52 MANAGING DIABE T ES
BlOOD GluCOSE CONTrOl
The role of blood glucose control
in preventing the development
and progression of complications
has been proven in both type 1
and type 2 diabetes, with an
especially strong relationship
between intensive blood glucose
control and neuropathy and diabetic
retinopathy (20, 21). In most patients
with diabetes, blood glucose levels
can be adequately managed with
medicines included in the WHO Model list of essential medicines
(22). These are metformin, gliclazide,
and short-acting and intermediate-
acting human or animal insulin.
Blood glucose control should
be monitored through regular
measurement. People with
type 1 diabetes and gestational
diabetes need strict control of
blood glucose which is difficult to
accomplish and monitor in primary
health care, so they will need more
frequent referral to higher levels of
health care.
Glycated haemoglobin (HbA1c)
is the method of choice for
BOx 8. rEvErSING TyPE 2 DIABETES, BArBADOS
Barbados has a 19% prevalence of diabetes among adults. One in three adults is obese; two out of three are overweight or obese; and under one in 10 adults eats five or more portions of fresh fruit and vegetables a day.
The Barbados Diabetes Reversal Study is designed to test the feasibility of an 8-week, low-calorie diet, with follow-up support for 6 months on diet and physical activity, to reverse type 2 diabetes.
Ten men and 15 women aged 26–68 years participated in the study. All had been diagnosed with type 2 diabetes in the previous 6 years, none was on insulin, and their body mass indices ranged from 27–53. All glucose-lowering medication ceased at the start of the study. Participants consumed a predominantly liquid diet consisting of four portions a day, each of 190 calories. Participants were also encouraged to eat low-carbohydrate, high-fibre vegetables.
By week 8, average weight loss was 10 kg. Several people saw improvements in blood glucose levels and in blood pressure. Three months after finishing the 8-week diet, 17 participants had fasting plasma glucose (FPG) below the diagnostic threshold for diabetes compared to three at the start, and despite remaining off glucose-lowering medication. For nine of the 12 participants on medication for hypertension at the start of the study, blood pressure fell sufficiently that they could stop taking hypertension medication by the 8th week.
Participants have so far articulated several challenges in participating in the study, including the monotony of the low-calorie diet phase, the high cost of fresh fruits and vegetables, and feeling poorly equipped to prepare non-starchy vegetables, even with provided recipes. There was resounding agreement that the most challenging times are in social settings, where there is peer pressure to consume food and drink.
A key element of the programme’s success has been the support participants have received from family, friends and each other (particularly through the use of social media). However, their experiences also demonstrate the everyday difficulties of undertaking this approach in a context of widespread obesity.
53MANAGING DIABE T ES
monitoring glycaemic control in
diabetes. An advantage of using
HbA1c is that the patient does not
need to be in a fasting state. Ideally
it should be measured twice a year
in people with type 2 diabetes
and more frequently in those with
type 1 diabetes. However, HbA1c
testing is more costly than glucose
measurement, and therefore less
readily available. If HbA1c testing is
not available, fasting or post-meal
blood glucose is an acceptable
substitute.
Self-monitoring of blood glucose
is recommended for patients
receiving insulin, and to have a
plan of action with their health
provider on how to adjust insulin
dosage, food intake and physical
activity according to their blood
glucose levels. Availability of
self-monitoring devices and strips
has not been assessed globally.
Anecdotal evidence suggests that
self-monitoring is not available
for a vast majority of people on
insulin treatment – cost being
cited as the most frequent reason.
Some data indicate that less
costly self-monitoring by urine
glucose measurement could be
an acceptable alternative when
blood glucose self-monitoring is
not possible (23).
MEDICATION fOr ASSOCIATED CArDIOvASCulAr DISEASE rISk fACTOrS
Comprehensive reduction of
cardiovascular disease risk factors,
including the control of blood
pressure and lipids in addition to
blood glucose, is of vital importance
in preventing the development of
cardiovascular disease in diabetes,
but also in preventing microvascular
complications. This can be achieved
with generic medicines from WHO Model list of essential medicines
(22) (thiazide diuretic, ACE-inhibitor,
beta blockers, statin).
SCrEENING fOr EArly DETECTION AND TrEATMENT Of COMPlICATIONS
Current treatment of diabetes does
not prevent all complications, but
the progress of complications can
be slowed by early interventions
(13). People with diabetes should
have periodic, comprehensive
eye examinations. Timely laser
photocoagulation and good
control of blood glucose can
prevent or delay the onset of
irreversible vision loss, though this
is not always accessible or available
in low- and middle-income
countries. Measurement of urine
protein will reveal early kidney
damage, and the progression to
kidney failure can be slowed by
essential drugs routinely used to
treat hypertension. Kidney failure
is treated by dialysis or a kidney
transplant. Proper footwear and
regular examination of feet for
signs of neuropathy, impaired
blood flow and skin changes can
prevent foot ulcers that often lead
to gangrene and limb amputation.
Rehabilitation services such as
physiotherapy and occupational
therapy can help minimize the
impact of complications on
people’s functioning (see Box 9).
HuMAN rESOurCES
A range of health professionals
is required for the care and
treatment of diabetes, including
physicians, nurses, dieticians and
specialists such as obstetricians,
ophtha lmo log i s t s , va scu la r
surgeons and physiotherapists.
54 MANAGING DIABE T ES
But in many settings, access
to even the most basic health
professionals with appropriate
training in diabetes management
is not available. While more
and bet ter-t ra ined hea l th
professionals could rectify this
problem, in many situations it is
not a realistic solution. However
there are examples of innovative
solutions, including up-skilling
available health professionals to
deliver diabetes care (see Box 10)
and training lay people to deliver
protocol-driven care. WHO PEN
includes management protocols
for non-medically qualified health-
care workers.
3.3 INTEGrATED MANAGEMENT Of DIABETES AND OTHEr CHrONIC HEAlTH CONDITIONS
Diabetes management should be
integrated with management of
other NCDs, and in some settings
tuberculosis and HIV/AIDS, to
improve equity, efficiency and
outcomes. Diabetes is frequently
comorbid with a range of other
diseases and conditions, the
BOx 9. rEHABIlITATION fOllOwING DIABETES-rElATED AMPuTATION, TAJIkISTAN
The physical complications associated with diabetes, including poor vascularization, can cause lower-limb wounds that may lead to amputation. Without proper care and support this can profoundly limit a person’s ability to work, play a full family role and enjoy recreational activities. Furthermore, people with diabetic wounds require close attention to prevent infection and deterioration that can lead to death. Rehabilitation services play a fundamental role across the continuum of care for people with diabetes, helping prevent complications and providing interventions to keep people mobile and active.
Approximately half of the 5000 people with diabetes that report to Tajikistan’s Republican Endocrinology Hospital every year require rehabilitation services. The International Committee of the Red Cross/Special Fund for the Disabled provides technical support to Tajikistan’s only physical rehabilitation centre, which provides multidisciplinary care to people with diabetes and associated complications.
The team of physiotherapists, prosthetists and social workers, provide holistic interventions that help people work and participate in society. Key aspects of their interventions include:
y assessment and provision of assistive devices;
y physical rehabilitation, including strengthening, endurance and gait training for those with lower-limb amputations;
y facilitating return to work;
y providing education on self-management to prevent deterioration.
While the rehabilitation service has seen encouraging outcomes (increasing functional independence, participation in society and continuation of livelihood) in the lives of people with diabetes, knowledge of rehabilitation services among the public and all levels of the health-care system remains poor. Work is being done to increase the awareness of rehabilitation services and the important role they play in diabetic care.
55MANAGING DIABE T ES
BOx 10. BuIlDING CAPACITy fOr DIABETES MANAGEMENT, THAIlAND
The increasing burden of diabetes and the demand for better care have made capacity-building essential for Thailand’s recently introduced diabetes management system and practice guidelines. The system includes diabetes risk assessment and screening; assessment of chronic complications and their risks; and clinical care schemes in primary, secondary and tertiary care settings with a referral system and designated outcome indicators.
There are regular training courses for building capacity. Basic training courses (3 to 5 days) are implemented by the Diabetes Association of Thailand and the Thai Society of Diabetes Educators for diabetes care teams, including nurses, dietitians, pharmacists and physiotherapists. Over the past 10 years this course has trained more than 6000 health-care providers. A 4-month training course for nurses responsible for managing diabetes has been established by the Thailand Nursing and Midwifery Council and Faculty of nursing, Mahidol University. Currently, there are more than 1000 disease-manager nurses. In addition, a 5-day camp for practicing physicians treating type 1 diabetes is run by the Diabetes Association of Thailand and the Endocrine Society of Thailand, alongside annual scientific meetings.
Thailand’s Ministry of Public Health has developed the “simple diabetes care” concept for village and district public health volunteers to enable them to visit patients at home and encourage their adherence to medical advice, treatment and regular follow-up appointments. This has lowered the rate of undiagnosed cases from 53% to 31%; increased the number of patients attending health-care facilities; and increased the annual rate of vascular risk assessments and detection of early stage of chronic diabetic complications. A specific training course for foot and wound care has resulted in a declining rate of foot ulcers and amputations. Capacity-building of care teams in providing standard care for diabetes in children and adolescents is now underway.
interactions of which have an
impact on its management. In
addition to cardiovascular diseases,
ageing-related conditions such as
cognitive decline and physical
disability have emerged as frequent
comorbid conditions with diabetes.
Depression is two to three times
more common in people with
diabetes than in those without, for
example (24).
The epidemiological transition
occurring in many low- and middle-
income countries is characterized
by the coexistence of established
infectious disease alongside
emerging NCD epidemics (25). Some of these diseases interact,
mediated by shared risk factors
(25), and their management may
be complicated by drug-disease
and drug-drug interactions. The
increasing longevity of people
with HIV/AIDS, for example, is
accompanied by a rising incidence
and prevalence of insulin resistance
and type 2 diabetes among them,
some of which may be related to
antiretroviral treatment (25, 26).
DIABETES AND OTHEr NCDS
Diabetes has close links with
other NCDs and their risk factors.
Recommended management of
high cardiovascular disease risk, for
56 MANAGING DIABE T ES
example, includes blood glucose
control and counsell ing (for
healthy diet and physical activity),
and, similarly, management of
diabetes includes anti-hypertensive
medications at lower levels of blood
pressure than for non-diabetics
(13). An organized and integrated
health system is necessary to
deliver optimal diabetes care.
Relatively simple measures can be
implemented, including standard
protocols and clear referral
pathways between dif ferent
health-care providers and different
levels of care.
A core set of such interventions is
defined in the WHO PEN package,
which includes interventions for
detection, prevention, treatment
and care of diabetes, cardiovascular
disease, chronic respiratory disease
and cancer through a primary
health-care approach (13). They are
evidence-based, cost-effective and
feasible for implementation – even
in low-resource settings. WHO
PEN equips both physicians and
non-physician health workers in
primary care.
WHO PEN specifies the minimum
essentia l resources needed
to implement it s protocols:
cardiovascular risk prediction
charts, essential medicines and
basic technologies, and costing
tools for decision-makers. WHO
PEN also guides policy-makers
in the assessment of health
system gaps and the process
of the patient visit, including
prescribing medication, the
content of counselling and the
frequency of follow-ups. Explicit
criteria for referral to higher
levels of care are provided. A
simplified medical record stores
key information in an organized
way and serves as a reminder to
follow-up actions that should be
taken at each visit.
I f ef fec tively implemented,
WHO PEN can strengthen health
systems, improve the quality of
NCD (including diabetes) care, and
support the attainment of global
NCD targets (see Box 1, page 16)
WHO PEN implementation may
facilitate post-disaster health
system recovery and provide
continuity of care for people with
NCDs. The swift implementation
of WHO PEN in the Philippines
following Typhoon Haiyan in 2013
resulted in increased availability of
trained health service providers;
improved availability of essential
equipment, supplies and medicines;
functional referral systems; and
the use of monitoring tools, within
3 months (27).
DIABETES AND TuBErCulOSIS
Diabetes is a known risk factor for
tuberculosis (28) and is associated
with poorer tuberculosis outcomes,
while tuberculosis is associated
with worsening glycaemic control
(29). Since a number of countries
have both a high and increasing
diabetes prevalence and a
substantial burden of tuberculosis,
this interaction has significant
implications for management of
both diseases.
Active bi-directional screening has
been reported to be associated
with the detection of more
tuberculosis and diabetes (30) and there have been reports
of the successful piloting and
implementation of bi-directional
screening policies. For example, in
India, a pilot study demonstrated
the feasibility of screening
tuberculosis patients for type 2

57MANAGING DIABE T ES
diabetes (31), and the National
Tuberculosis Programme was
subsequently revised to implement
this intervention across India.
WHO’s Collaborative Framework
for Care and Control of Tuberculosis
and Diabetes provides guidelines
to establish mechanisms of
collaboration, including joint
coordinat ion, b i -d i rec t ional
surveillance and screening of
tuberculosis and type 2 diabetes,
and guidelines for detection
and management of diabetes
in tuberculosis patients (and
vice versa) (32).
rEOrIENTING HEAlTH SySTEMS
Many health-care systems have
evolved to respond to acute, infectious
disease and are not organized to
manage the demographic and
epidemiogic transition towards
noncommunicable diseases. The
presence of lifelong or long-term
comorbidities requires not just a
rethinking of service delivery but
also a reorientation of the entire
health system in order to rise to
the challenge of joint management
of diabetes and other diseases.
Expanding universal health
coverage and access to integrated,
people-centred health services
would facilitate this reorientation.
Universal health coverage aims to
ensure that all people have access
to health promotion, preventive,
curative and rehabilitative health
services of sufficient quality to
be effective, while also ensuring
that people do not suffer financial
hardship when paying for these
services. People should not be
forced into poverty because of
the cost of health care, like the
catastrophic personal health
expenditure required of many
people with diabetes. Inclusion
of diabetes-related services in
universal health coverage provides
patient protection.
All countries can take action
to move more rapidly towards
universal health coverage. Key
factors in determining which
services are prioritized by countries
are the epidemiological context,
health systems development, levels
of socioeconomic development
and people’s expectations. There
is considerable diversity in health-
care systems around the world
and systems need to be flexible,
locally adaptable, innovative
and accessible to address the
increasing challenge of diabetes
and other diseases.
M o v i n g a w a y f r o m t h e
compartmentalization of health
services, or “silos,” towards
integrated health services is a
way to improve care and also to
advance universal health coverage
by increasing the efficiency and
effectiveness of service delivery.
The total cardiovascular disease
(CVD) risk approach, for example,
enables integrated management
of hypertension, diabetes and
other cardiovascular risk factors in
primary care, and targets available
resources at those most likely to
develop heart attacks, strokes
and diabetes complications
(33). Integrated health services
can deliver a continuum of
health promotion, d isease
prevention, diagnosis, treatment,
rehabilitation and palliative care
services, through the different
levels and sites of care within the
health system over the course of
a lifetime.
People should not be forced into poverty because of the cost of diabetes care
58 MANAGING DIABE T ES
Orienting these services around
people’s needs, not just diseases,
and approaching them as
participants of care, not just
beneficiaries, will help ensure that
people receive the right care at the
right time. WHO’s Global strategy on people-centred and integrated health services outlines different
pathways to empower and engage
people; to strengthen health
governance and accountability;
to reorient the model of health-
care services; to coordinate
services; and to create an enabling
environment (34).
3.4 ACCESS TO ESSENTIAl MEDICINES AND BASIC TECHNOlOGIES
All people with type 1 diabetes,
and many with type 2, require
medication to reduce their blood
glucose levels. A discussion of
diabetes management must
therefore include a closer look at
access to essential medicines and
basic technologies.
An increas ing number of
costly blood-glucose lowering
medicat ions are becoming
available, but WHO’s Model list of essential medicines contains
effective, established and cost-
effective treatments that should
form the basis of therapeutic
options. This applies not just for
low- and middle-income resource
settings but high-income settings
too, as there is the chance that
expenditure on non-essential
medicines in these countries may
contribute to catastrophic health
expenditure (35, 36). Availability
in public health-care settings can
depend on the inclusion of the
medicine on countries’ National
Essential Medicines Lists (NEML),
and whether the NEML serves as
basis for procurement, training of
staff, reimbursement systems and
prescription decisions.
Governments should secure
funding for essential medicines
and technologies to diagnose and
manage diabetes. Affordability
depends mainly on the use of
generic medicines and their
use should be promoted – and
their quality assured – through
a strong national regulatory
system. Responsible use of
medicines can be promoted by
the implementation of evidence-
based guidelines and treatment
protocols. Along with better
procurement and policies for
generic substitution, affordability
for patients or for the system
(if medicines are given free to
patients or if a national health
insurance system is in place) could
be improved by regulation of mark-
ups in the supply chain, and tax or
tariff exemption (see Box 11).
INSulIN AND OrAl HyPOGlyCAEMIC AGENTS
People with type 1 diabetes
require insulin for survival –
without insulin, even for a short
time, these individuals may face
life-threatening consequences.
Yet an array of international
and national barriers interact to
hamper access to insulin, and
many in low- and middle-income
countries do not receive this
essential treatment (39, 40).
The insulin market is dominated
by a small number of multinational
manufacturers, with a few, smaller
producers making up only 4% of
the market by volume (41). This
limited competition can potentially
59MANAGING DIABE T ES
BOx 11. IMPrOvING ACCESS TO INSulIN AND OrAl MEDICINES fOr DIABETES, MOlDOvA
Although insulin is on WHO’s Model list of essential medicines, access in resource-poor settings can still be a problem because of international and national barriers – not just because of costs but also because of access issues.
The Republic of Moldova – where around one in eight adults (12.3% of the population) has diabetes or reduced tolerance to glucose (37) – has tried to address these issues within its broader health systems strengthening. Financial access to services improved with the introduction of mandatory health insurance in 2002, which became fully operational in 2004. Health expenditure as a percentage of state budget has increased to an appropriate and stable level. There has been an expansion of coverage of basic health services, enabling universal access to primary health care and pre-hospital emergency care, and additional benefits introduced to expand coverage to drugs prescribed in outpatient settings.
Positive developments in the last decade relating to pharmaceuticals that are of relevance to diabetes include: increased funding for public reimbursement of outpatient drugs; introduction of external reference pricing; inclusion of insulin in the list of reimbursed drugs since 2013; and introduction of mandatory generic prescribing (38). All Moldovan citizens are now entitled to free access to oral medicines for diabetes and insulin: there are three types of insulin and four oral medicines for diabetes that are 100% reimbursable.
Previously, insulin shortages had been reported by both patient representatives and doctors which were thought to be the result of distribution problems, ineffective systems for monitoring stock levels, and the high number of tests required by the quality control system that caused delays in supply. There has been a change in the procurement of insulin since 2013, with a move from a national tender programme to decentralized procurement by pharmacies. In principle, such a move was expected to lead to several positive changes: a more reliable supply; increased choice of insulin types; greater availability across the country; and shorter travel times for patients.
There is still some way to go but the general view of clinicians and patients is that great progress has been made. The Republic of Moldova has also recognised that access to medicines needs to be addressed in parallel to creating a health system able to manage all aspects of diabetes care.
increase insulin prices. Additional
factors in the insulin market that
may impact price include different
insulin formulations coming off-
patent, as well as the considerable
increase in use of analogue insulin.
Both of these factors affect the
price of insulin before it ever
arrives in a given country. Figure 6
shows that low-income countries
generally pay most for insulin while
high and middle-income countries
pay least (42).
Governments’ decisions about
insulin purchasing– tendering
practices, choice of supplier, choice
of products and delivery devices
– can have a huge impact on
budgets and on costs to end users.
Governments may recoup high costs
by charging mark-ups to patients. In
Mozambique, for example, insulin
purchased from local wholesalers
was 25% to 125% more expensive
than that purchased through
international tenders (43). In
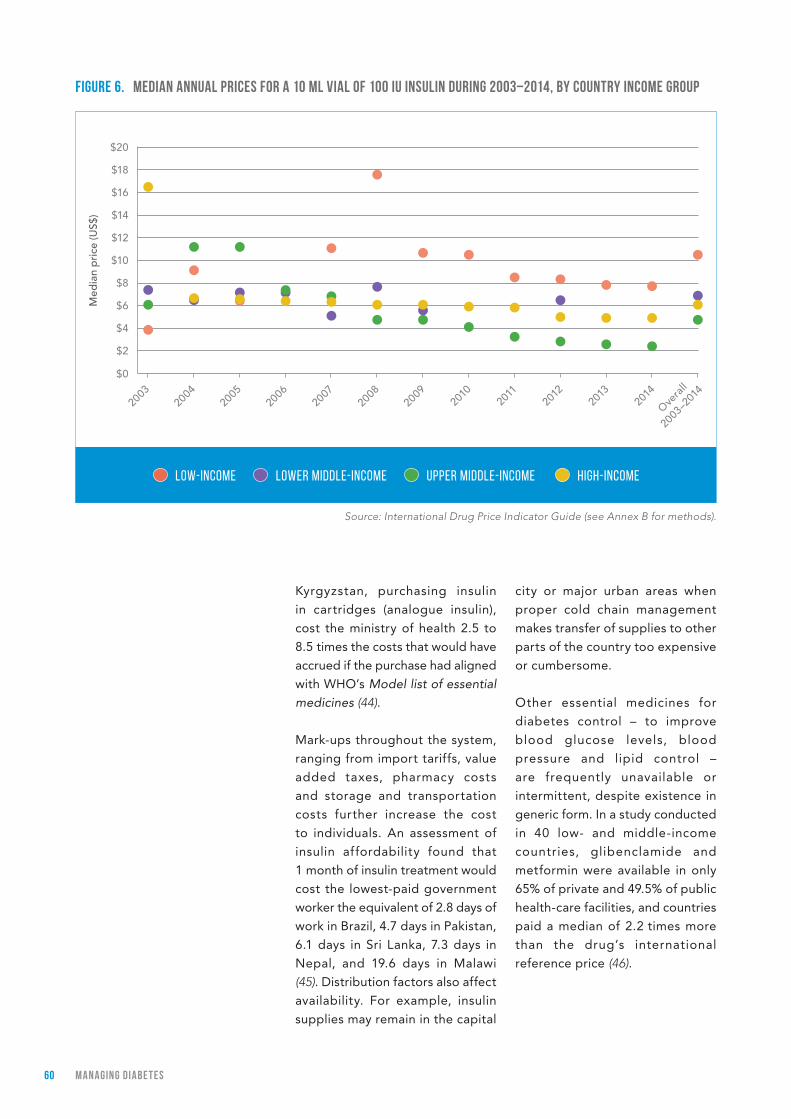
60 MANAGING DIABE T ES
Kyrgyzstan, purchasing insulin
in cartridges (analogue insulin),
cost the ministry of health 2.5 to
8.5 times the costs that would have
accrued if the purchase had aligned
with WHO’s Model list of essential medicines (44).
Mark-ups throughout the system,
ranging from import tariffs, value
added taxes, pharmacy costs
and storage and transportation
costs further increase the cost
to individuals. An assessment of
insulin affordability found that
1 month of insulin treatment would
cost the lowest-paid government
worker the equivalent of 2.8 days of
work in Brazil, 4.7 days in Pakistan,
6.1 days in Sri Lanka, 7.3 days in
Nepal, and 19.6 days in Malawi
(45). Distribution factors also affect
availability. For example, insulin
supplies may remain in the capital
city or major urban areas when
proper cold chain management
makes transfer of supplies to other
parts of the country too expensive
or cumbersome.
Other essential medicines for
diabetes control – to improve
blood glucose levels, blood
pressure and lipid control –
are frequently unavailable or
intermittent, despite existence in
generic form. In a study conducted
in 40 low- and middle-income
countries, glibenclamide and
metformin were available in only
65% of private and 49.5% of public
health-care facilities, and countries
paid a median of 2.2 times more
than the drug’s international
reference price (46).
fIGurE 6. MEDIAN ANNuAl PrICES fOr A 10 Ml vIAl Of 100 Iu INSulIN DurING 2003‒2014, By COuNTry INCOME GrOuP
Source: International Drug Price Indicator Guide (see Annex B for methods).
High-incomeUpper middle-incomeLow-income Lower middle-income
2003
2004
2005
2006
2007
2008
2009
2010
2011
2012
2013
2014
Ove
rall
2003
–201
4
Med
ian
pri
ce (U
S$)
$12
$14
$16
$18
$20
$10
$8
$6
$4
$2
$0
61MANAGING DIABE T ES
INJECTION DEvICES
Insulin must be injected, meaning
syringes are also a survival need
for people using insulin. Value
added taxes are frequently
applied to syringes, which are
not readily available in the public
sector. If syringes are purchased
by the public sector, quantities
are often insufficient and not
linked to insulin purchases (6). Pen injection devices and insulin
cartridges have some advantages
over traditional syringes (being
more practical when multiple daily
injections of insulin are required)
but their cost prohibits their use
for many patients.
3.5 SuMMAry
A cluster of cost-ef fective
interventions lies at the heart of
improving diabetes outcomes:
blood glucose control through a
combination of diet, physical activity
and, if necessary, medication;
control of blood pressure and lipids
to reduce cardiovascular risk and
other complications; and regular
screening and early intervention
for damage to the eyes, kidneys
and feet. This set of interventions
appears simple but carrying them
out depends on appropriate
structures for health-care delivery
such as access to essential
medicines and technologies,
protocols for management in
primary care, appropriate training
of health-care providers, referral
systems involving specialists,
and the active participation and
motivation of the patient.
Currently, primary health-care
services in many countries do not
have the capacity to diagnose
and manage diabetes (see Part 4).
Building this capacity is a priority
to achieve better outcomes for
people with diabetes, and to meet
global targets to halt the rise in
obesity and diabetes and reduce
premature mortality from NCDs.
Diabetes management can be
strengthened even in low-resource
settings through implementation
of the standards and protocols
such as the WHO PEN package.
Ef forts to improve capacity
for diagnosis and treatment of
diabetes should be undertaken
in the context of integrated NCD
management. At a minimum,
diabetes and cardiovascular disease
management can be integrated.
Integrated management of
diabetes and TB and/or HIV/AIDS
can be considered where there is
high prevalence of these diseases.
Improving access to essential
medicines is a vital aspect
of achieving universal health
coverage and of improving health
systems’ capacity to prevent and
manage diabetes and other NCDs
(47). Diabetes has been described
as a tracer condition for assessing
health system performance (48, 49) for many reasons: it is well-
defined, fairly easy to diagnose,
and common; and because optimal
management of diabetes requires
the coordinated involvement of a
variety of health-care providers
at multiple levels of the health-
care system, ongoing monitoring,
access to essential medicines
and technologies, and active
patient participation. Solutions for
improving diabetes management
could therefore provide lessons for
management of other NCDs.
The costs of diabetes management
are high but they are likely to be
dwarfed by the economic costs of
poor or non-existent care in the
Diabetes management can be strengthened through implementation of standards and protocols, even in low-resource settings
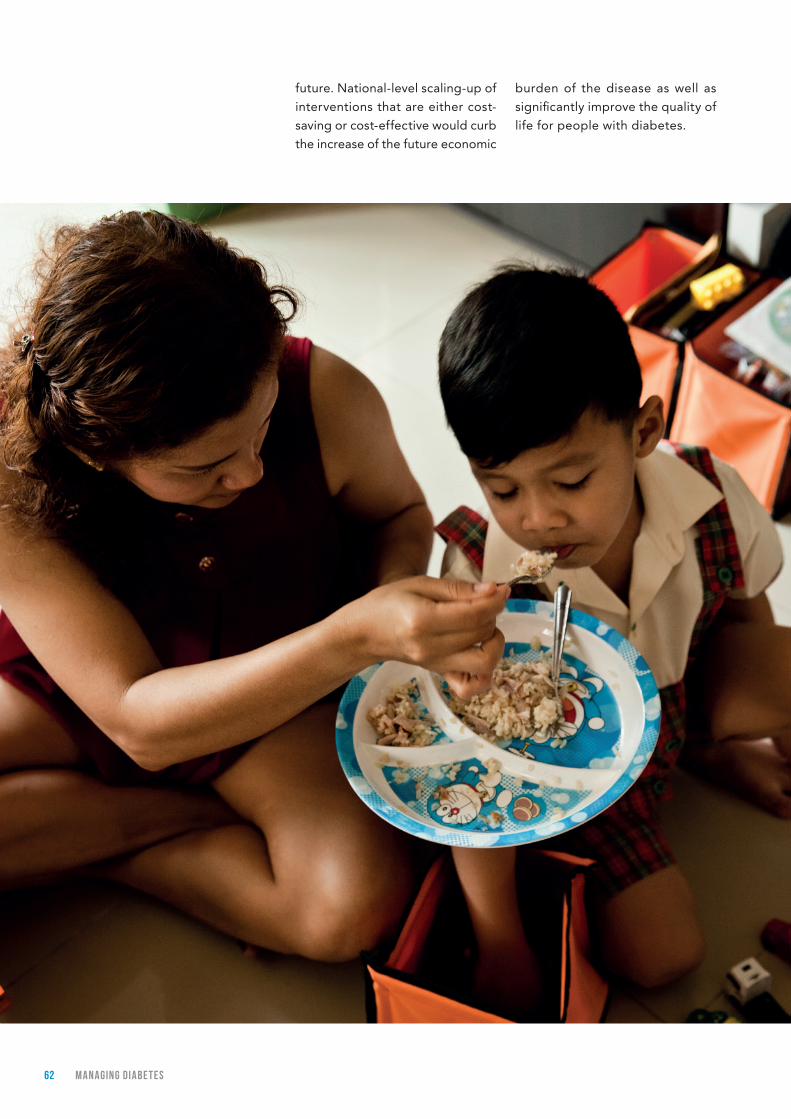
62 MANAGING DIABE T ES
future. National-level scaling-up of
interventions that are either cost-
saving or cost-effective would curb
the increase of the future economic
burden of the disease as well as
significantly improve the quality of
life for people with diabetes.
63MANAGING DIABE T ES
rEfErENCES
1. Venkat Narayan KM, Zhang P, Kanaya AM, Williams DE, Engelgau MM, Imperatore G, et al. Diabetes: the pandemic and potential solutions. In: Disease control priorities in developing countries, 2 ed. Washington DC: World Bank; 2006:591–603.
2. Li R, Zhang P, Barker LE, Chowdhury FM, Zhang X. Cost-effectiveness of interventions to prevent and control diabetes mellitus: a systematic review. Diabetes Care. 2010;33:(8)1872–1894.
3. Williams DRR. The economics of diabetes care: a global perspective. In: International textbook of diabetes mellitus , 4th ed. Chichester, UK: Wiley Blackwell; 2015.
4. Harding JL, Shaw JE, Peeters A, Guiver T, Davidson S, Magliano DJ. Mortality trends among people with type 1 and type 2 diabetes in Australia: 1997–2010. Diabetes Care. 2014;37:(9)2579–2586.
5. Use of glycated haemoglobin (HbA1c) in the diagnosis of diabetes mellitus. Geneva: World Health Organization; 2011.
6. Beran D, Yudkin JS. Looking beyond the issue of access to insulin: what is needed for proper diabetes care in resource-poor settings. Diabetes Research and Clinical Practice. 2010;88:(3)217–221.
7. Herman WH, Ye W, Griffin SJ, Simmons RK, Davies MJ, Khunti K et al. Early detection and treatment of type 2 diabetes reduce cardiovascular morbidity and mortality: A simulation of the results of the Anglo-Danish-Dutch study of intensive treatment in people with screen-detected diabetes in primary care (ADDITION-Europe). Diabetes Care. 2015;38:(8)1449–1455.
8. Basu S, Millett C, Vijan S, Hayward RA, Kinra S, Ahuja R, et al. The health system and population health implications of large-scale diabetes screening in India: a microsimulation model of alternative approaches. PLoS.Med. 2015;12:(5) e1001827.
9. Screening for Type 2 diabetes. Report of a WHO and International Diabetes Federation meeting WHO/NMH/MNC/03.1. Geneva: World Health Organization; 2003.
10. Free C, Phillips G, Galli L, Watson L, Felix L, Edwards P, et al. The effectiveness of mobile-health technology-based health behaviour change or disease management interventions for health care consumers: a systematic review. PLoS Med. 2013;10:e1001362.
11. Liang X, Wang Q, Yang X, Cao J, Chen J, Mo X, et al. Effect of mobile phone intervention for diabetes on glycaemic control: a meta-analysis. Diabetes Medicine. 2011;28:455-463.
12. Vervloet, M., Dijk, L. van, Bakker, D.H. de, Souverein, P.C., Santen-Reestman, J., Vlijmen, B. van, Aarle, M.C.W. van, Hoek, L.S. van der, Bouvy, M.L. Short- and long-term effects of real-time medication monitoring with short message service (SMS) reminders for missed doses on the refill adherence of people with Type 2 diabetes: evidence from a randomised controlled trial. Diabetic Medicine: 2014, 31(7), 821-828.
13. Implementation tools: Package of Essential Noncommunicable (PEN) Disease Interventions for Primary Health Care in Low-Resource Settings. Geneva: World Health Organization; 2013.
14. Fats and fatty acids in human nutrition: report of an expert consultation. FAO Food and Nutrition Paper 91. Rome: Food and Agriculture Organization of the United Nations; 2010.
15. Ley SH, Hamdy O, Mohan V, Hu FB. Prevention and management of type 2 diabetes: dietary components and nutritional strategies. Lancet. 2014;383:(9933)1999–2007.
16. Guideline: Sugars intake for adults and children. Geneva: World Health Organization; 2015.
17. Taylor R. Type 2 diabetes: etiology and reversibility. Diabetes Care. 2013;36:(4)1047–1055.
18. Maggard-Gibbons M, Maglione M, Livhits M, Ewing B, Maher AR, Hu J, et al. Bariatric surgery for weight loss and glycemic control in non-morbidly obese adults with diabetes: a systematic review. Journal of the American Medical Association. 2013;309:(21)2250–2261.
19. Hayes C, Kriska A. Role of physical activity in diabetes management and prevention. Journal of the American Dietetic Association. 2008;108:(4 Suppl 1)S19–S23.

64 MANAGING DIABE T ES
20. The effect of intensive treatment of diabetes on the development and progression of long-term complications in insulin-dependent diabetes mellitus. The Diabetes Control and Complications Trial Research Group. New England Journal of Medicine. 1993;329:(14)977–986.
21. Intensive blood-glucose control with sulphonylureas or insulin compared with conventional treatment and risk of complications in patients with type 2 diabetes (UKPDS 33). UK Prospective Diabetes Study (UKPDS) Group. Lancet. 1998;352:(9131)837–853.
22. WHO Model list of Essential Medicines. Geneva: World Health Organization; 2015.
23. Worth R, Home PD, Johnston DG, Anderson J, Ashworth L, Burrin JM, et al. Intensive attention improves glycaemic control in insulin-dependent diabetes without further advantage from home blood glucose monitoring: results of a controlled trial. British Medical Journal (Clinical Research Edition). 1982;285:(6350)1233–1240.
24. Roy T, Lloyd CE. Epidemiology of depression and diabetes: a systematic review. Journal of Affective Disorders. 2012;142:Suppl, S8-21.
25. Oni T, Youngblood E, Boulle A, McGrath N, Wilkinson RJ, Levit NS. Patterns of HIV, TB, and non-communicable disease multi-morbidity in peri-urban South Africa – a cross sectional study. BMC Infectious Diseases. 2015;15:20. doi:10.1186/s12879-015-0750-1.
26. Reid MJA, Tsima BM, Kirk B. HIV and diabetes in Africa. African Journal of Diabetes Medicine. 2012;20(2);28-32.
27. Martinez RE, Quintana R, Go JJ, Villones MS, Marquez MA. Use of the WHO Package of Essential Noncommunicable Disease Interventions after Typhoon Haiyan. Western Pacific Surveillance Response Journal. 2015;6:Suppl 1, 18–20.
28. Jeon CY, Murray MB. Diabetes mellitus increases the risk of active tuberculosis: a systematic review of 13 observational studies. PLoS Medicine. 2008;5:(7)e152.
29. Riza AL, Pearson F, Ugarte-Gil C, Alisjahbana B, van de Vijver S, Panduru NM, et al. Clinical management of concurrent diabetes and tuberculosis and the implications for patient services. Lancet Diabetes Endocrinology. 2014;2:(9)740–753.
30. Jeon CY, Harries AD, Baker MA, Hart JE, Kapur A, Lonnroth K, et al. Bi-directional screening for tuberculosis and diabetes: a systematic review. Tropical Medicine and International Health. 2010;15: (11)1300–1314.
31. Screening of patients with tuberculosis for diabetes mellitus in India. Tropical Medicine and International Health. 18;(5):636–645.
32. Collaborative framework for care and control of tuberculosis and diabetes. Geneva: World Health Organization; 2011.
33. Global status report on noncommunicable diseases. Geneva: World Health Organization; 2014.
34. WHO global strategy on people-centred and integrated health services. Interim report. Geneva: World Health Organization; 2015.
35. Luo J, Avorn J, Kesselheim AS. Trends in Medicaid reimbursements for insulin from 1991 through 2014. Journal of the American Medical Association Internal Medicine. 2015;175:(10)1681–1686.
36. Tylee T, Hirsch IB. Costs associated with using different insulin preparations. Journal of the American Medical Association. 2015;314:(7)665–666.
37. Republic of Moldova STEPS survey 2013: Fact sheet. Geneva: World Health Organization; 2014.
38. WHO Regional Office for Europe, Better noncommunicable disease outcomes: challenges and opportunities for health systems. Republic of Moldova country assessment. Copenhagen: World Health Organization; 2014.
39. Beran D. Improving access to insulin: what can be done? Diabetes Management. 2011;1:67–76.
40. Beran D, Perrin C, Billo N, Yudkin JS. Improving global access to medicines for non-communicable diseases. Lancet Global Health. 2014;2:(10)e561-e562.
65MANAGING DIABE T ES
41. Schultz K. The global diabetes care market. Novo Nordisk. 2011. Novo Nordisk.
42. International Drug Price Indicator Guide. Management Sciences for Health. Washington DC; Management Sciences for Health; 2015.
43. Beran D, Yudkin, JS, de Courten M. Access to care for patients with insulin-requiring diabetes in developing countries: case studies of Mozambique and Zambia. Diabetes Care. 2005;28:(9)2136–2140.
44. Beran D, Abdraimova A, Akkazieva B, McKee M, Balabanova D, Yudkin JS. Diabetes in Kyrgyzstan: changes between 2002 and 2009. International Journal of Health Planning Management. 2013;28:(2)e121-e137.
45. Mendis S, Fukino K, Cameron A, Laing R, Filipe A Jr, Khatib O, et al. The availability and affordability of selected essential medicines for chronic diseases in six low- and middle-income countries. Bulletin of the World Health Organization. 2007;85:(4)279–288.
46. Cameron A, Ewen M, Ross-Degnan D, Ball D, Laing R. Medicine prices, availability, and affordability in 36 developing and middle-income countries: a secondary analysis. Lancet. 2009;373:(9659)240–249.
47. Global action plan for the prevention and control of noncommunicable diseases 2013-2020. Geneva: World Health Organization; 2013.
48. Beran D, Yudkin J, de Courten M. Assessing health systems for type 1 diabetes in sub-Saharan Africa: developing a ‘Rapid Assessment Protocol for Insulin Access.’ BMC Health Services Research. 2006;6:17.
49. Nolte E, Bain C, McKee M. Diabetes as a tracer condition in international benchmarking of health systems. Diabetes Care. 2006;29(5):1007–11.
PArT 4NATIONAl CAPACITy fOr PrEvENTION
AND CONTrOl Of DIABETES: A SNAPSHOT

67NAT IONAl CAPACI T y f Or PrE vEN T ION AND CON T rOl Of DIABE T ES: A SNAP SHO T
kEy MESSAGES
The majority of countries have national diabetes policies, national policies to address unhealthy diet and physical inactivity, and national guidelines or standards for diabetes management.
Implementation and funding of national policies and guidelines is uneven.
Basic technologies for early detection, diagnosis and monitoring of diabetes in primary care settings are generally not available in low-income and lower middle-income countries.
Availability of insulin, metformin and sulphonylurea(s) is very limited in primary care facilities in low-income countries.
Less than half of countries have conducted a national, population-based survey with measurement of blood glucose status within the past 5 years.
This chapter provides a global
snapshot of national capacity
based on policies, plans and
strategies for diabetes and its
key risk factors; health system
infrastructure such as guidelines
for diabetes management in
primary health care, availability
of essential technologies for
diagnosis and management,
availability of essential medicines,
and referra l sys tems and
treatment for complications; and
surveillance. Such policies, plans
and strategies contribute to the
10 progress indicators that will
be used to report on progress
towards implementation of
national commitments outlined
in the 2011 United Nations
Political Declaration and the
2014 United Nations General
Assembly Outcome Document on
Noncommunicable Diseases (1).
Data presented in this chapter come
from the 2015 Noncommunicable
Disease Country Capacity Survey
(NCD CCS), to which national
teams from 177 WHO Member
States, representing 97% of the
world’s population, responded.
The NCD CCS has been conducted
regularly since 2000 to assess NCD
governance and infrastructure,
policy response, surveillance and
health systems response at country
level. It is increasingly used to
monitor progress in achieving
voluntary NCD targets and for
reporting on NCD progress
indicators (2). There are limitations
to the survey –for example its
use of key informants rather
than independently verified data
collection – but on the whole it
presents a clear picture of capacity
and identifies areas that need more
attention. Details of the survey
methodology can be found in
Annex B. Specific variables related
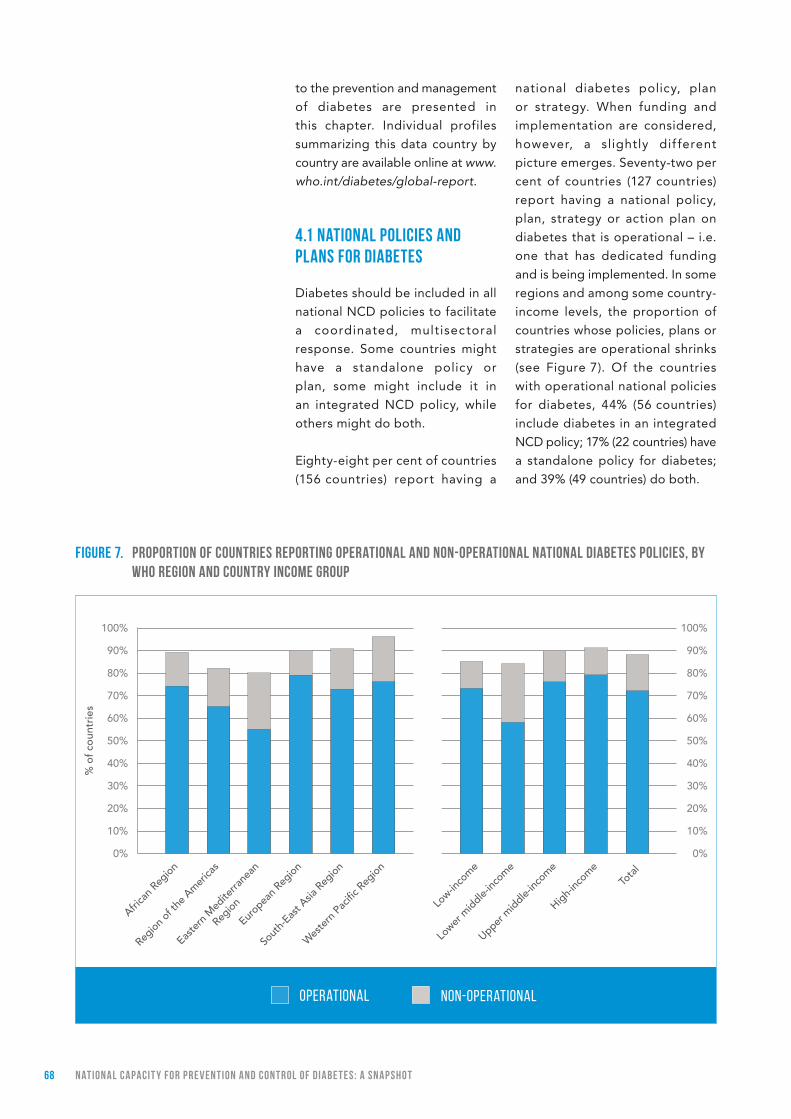
68 NAT IONAl CAPACI T y f Or PrE vEN T ION AND CON T rOl Of DIABE T ES: A SNAP SHO T
to the prevention and management
of diabetes are presented in
this chapter. Individual profiles
summarizing this data country by
country are available online at www.who.int/diabetes/global-report.
4.1 NATIONAl POlICIES AND PlANS fOr DIABETES
Diabetes should be included in all
national NCD policies to facilitate
a coordinated, multisectoral
response. Some countries might
have a standalone policy or
plan, some might include it in
an integrated NCD policy, while
others might do both.
Eighty-eight per cent of countries
(156 countries) report having a
national diabetes policy, plan
or strategy. When funding and
implementation are considered,
however, a slightly dif ferent
picture emerges. Seventy-two per
cent of countries (127 countries)
report having a national policy,
plan, strategy or action plan on
diabetes that is operational – i.e.
one that has dedicated funding
and is being implemented. In some
regions and among some country-
income levels, the proportion of
countries whose policies, plans or
strategies are operational shrinks
(see Figure 7). Of the countries
with operational national policies
for diabetes, 44% (56 countries)
include diabetes in an integrated
NCD policy; 17% (22 countries) have
a standalone policy for diabetes;
and 39% (49 countries) do both.
fIGurE 7. PrOPOrTION Of COuNTrIES rEPOrTING OPErATIONAl AND NON-OPErATIONAl NATIONAl DIABETES POlICIES, By wHO rEGION AND COuNTry INCOME GrOuP
OPERATIONAL NON-OPERATIONAL
% o
f cou
ntri
es 60%
70%
80%
90%
100%
50%
40%
30%
20%
10%
0%
60%
70%
80%
90%
100%
50%
40%
30%
20%
10%
0%
Low-in
come
Africa
n Reg
ion
Europea
n Reg
ion
Lower
middle-
income
Region o
f the
Amer
icas
Sout
h-Eas
t Asia
Reg
ion
Wes
tern
Pac
ific R
egion
Easte
rn M
edite
rrane
an
Region
Upper m
iddle-inc
ome
High-inc
omeTo
tal
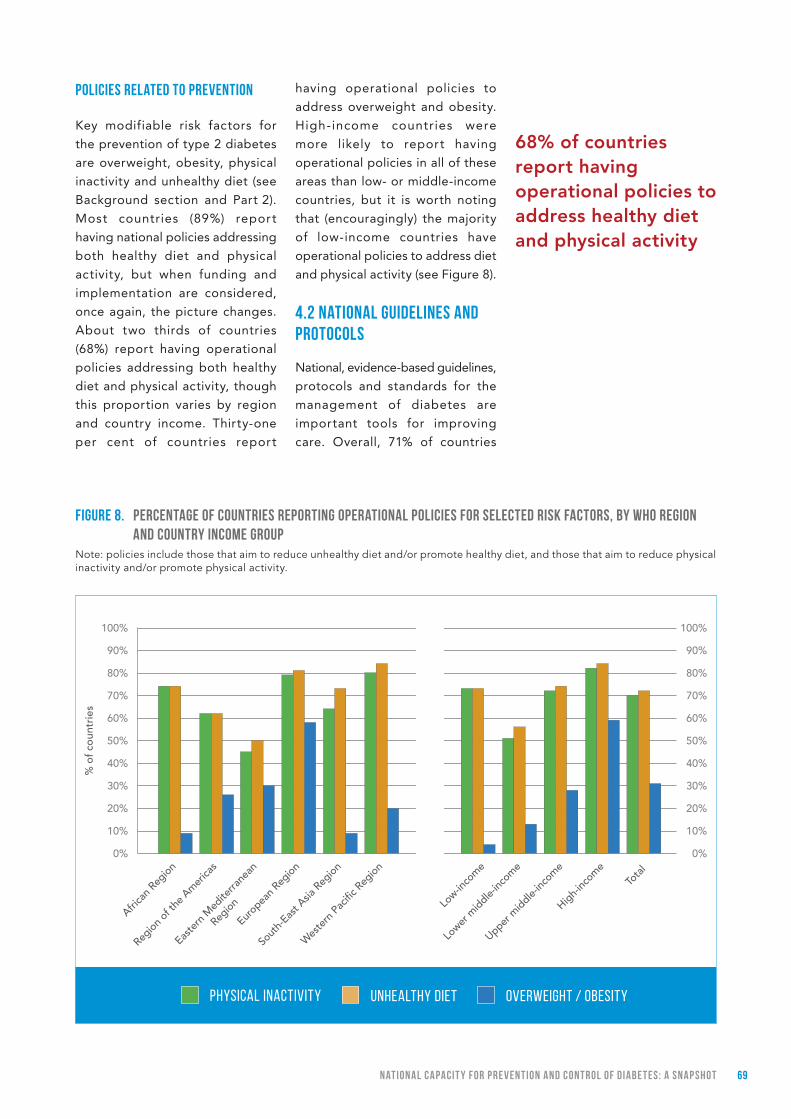
69NAT IONAl CAPACI T y f Or PrE vEN T ION AND CON T rOl Of DIABE T ES: A SNAP SHO T
POlICIES rElATED TO PrEvENTION
Key modifiable risk factors for
the prevention of type 2 diabetes
are overweight, obesity, physical
inactivity and unhealthy diet (see
Background section and Part 2).
Most countries (89%) report
having national policies addressing
both healthy diet and physical
activity, but when funding and
implementation are considered,
once again, the picture changes.
About two thirds of countries
(68%) report having operational
policies addressing both healthy
diet and physical activity, though
this proportion varies by region
and country income. Thirty-one
per cent of countries report
having operational policies to
address overweight and obesity.
High-income countries were
more likely to report having
operational policies in all of these
areas than low- or middle-income
countries, but it is worth noting
that (encouragingly) the majority
of low-income countries have
operational policies to address diet
and physical activity (see Figure 8).
4.2 NATIONAl GuIDElINES AND PrOTOCOlS
National, evidence-based guidelines,
protocols and standards for the
management of diabetes are
important tools for improving
care. Overall, 71% of countries
Note: policies include those that aim to reduce unhealthy diet and/or promote healthy diet, and those that aim to reduce physical inactivity and/or promote physical activity.
fIGurE 8. PErCENTAGE Of COuNTrIES rEPOrTING OPErATIONAl POlICIES fOr SElECTED rISk fACTOrS, By wHO rEGION AND COuNTry INCOME GrOuP
68% of countries report having operational policies to address healthy diet and physical activity
PHYSICAL INACTIVITY OVERWEIGHT / OBESITYUNHEALTHY DIET
% o
f cou
ntri
es 60%
70%
80%
90%
100%
50%
40%
30%
20%
10%
0%
Low-in
come
Africa
n Reg
ion
Europea
n Reg
ion
Lower
middle-
income
Region o
f the
Amer
icas
Sout
h-Eas
t Asia
Reg
ion
Wes
tern
Pac
ific R
egion
Easte
rn M
edite
rrane
an
Region
Upper m
iddle-inc
ome
High-inc
omeTo
tal
60%
70%
80%
90%
100%
50%
40%
30%
20%
10%
0%

70 NAT IONAl CAPACI T y f Or PrE vEN T ION AND CON T rOl Of DIABE T ES: A SNAP SHO T
(126 countries) report having a
national guideline for diabetes
management that is either fully or
partially implemented. Less than
half of countries (47%) report full
implementation. Middle- and high-
income countries were more likely
to report implementing guidelines
for managing diabetes, with more
than 70% reporting full or partial
implementation (see Figure 9).
Less than half (46%) of low-
income countries reported fully or
partially implementing diabetes
management guidelines.
Diabetes management happens
at different levels of the health-
care delivery system. A referral
system based on standard criteria
contributes to continuity of care
and ensures the optimal use of
health-care services at different
levels. Standard criteria for
referral of patients from primary
care to secondary or tertiary care
were reported as available in
71% of countries (126 countries),
but full implementation of such
criteria was reported in only 42%
of countries (74 countries). Full
implementation of referral criteria
is reported as achieved more
often in upper middle-income
and high-income countries, but
even in these categories full
implementation is not common
(54% and 46% respectively).
126 countries report having
a national guideline for diabetes management
that is partially or fully implemented
fIGurE 9. PErCENTAGE Of COuNTrIES rEPOrTING fully Or PArTIAlly IMPlEMENTED DIABETES GuIDElINES, By wHO rEGION AND COuNTry INCOME GrOuP
FULLY IMPLEMENTED PARTIALLY IMPLEMENTED
% o
f cou
ntri
es 60%
70%
80%
90%
100%
50%
40%
30%
20%
10%
0%
Low-in
come
Africa
n Reg
ion
Europea
n Reg
ion
Lower
middle-
income
Region o
f the
Amer
icas
Sout
h-Eas
t Asia
Reg
ion
Wes
tern
Pac
ific R
egion
Easte
rn M
edite
rrane
an
Region
Upper m
iddle-inc
ome
High-inc
omeTo
tal
60%
70%
80%
90%
100%
50%
40%
30%
20%
10%
0%
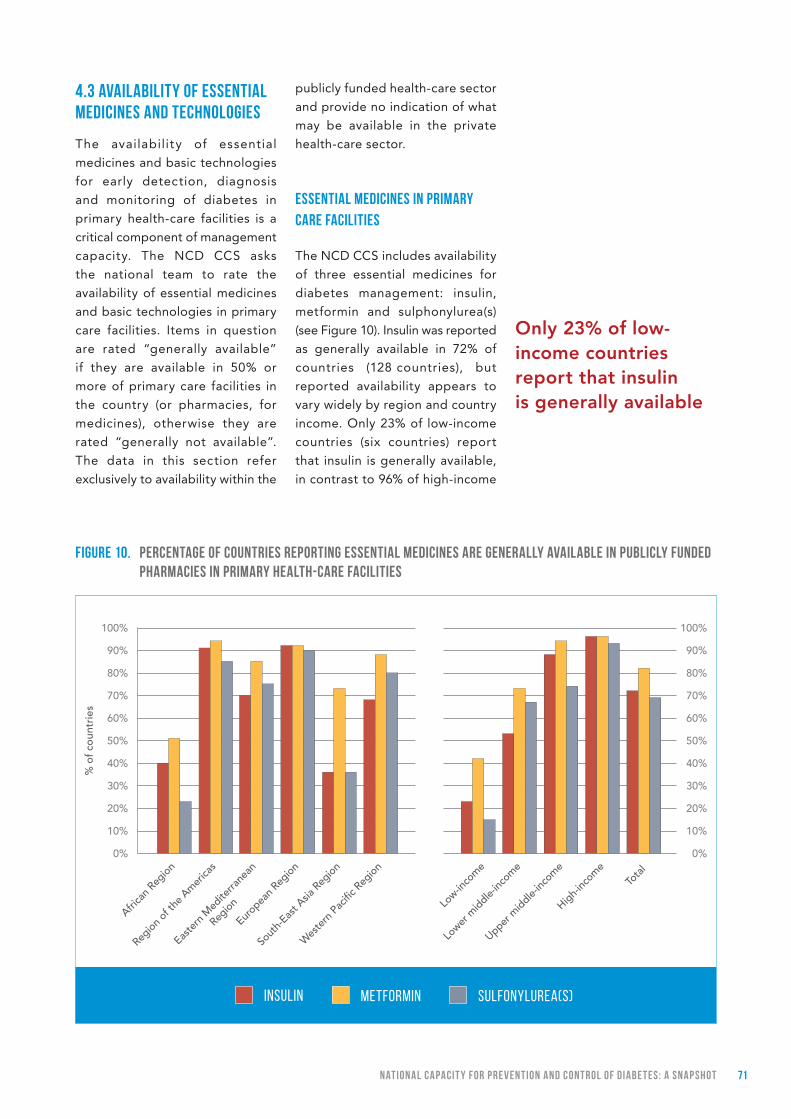
71NAT IONAl CAPACI T y f Or PrE vEN T ION AND CON T rOl Of DIABE T ES: A SNAP SHO T
4.3 AvAIlABIlITy Of ESSENTIAl MEDICINES AND TECHNOlOGIES
The availability of essential
medicines and basic technologies
for early detection, diagnosis
and monitoring of diabetes in
primary health-care facilities is a
critical component of management
capacity. The NCD CCS asks
the national team to rate the
availability of essential medicines
and basic technologies in primary
care facilities. Items in question
are rated “generally available”
if they are available in 50% or
more of primary care facilities in
the country (or pharmacies, for
medicines), otherwise they are
rated “generally not available”.
The data in this section refer
exclusively to availability within the
publicly funded health-care sector
and provide no indication of what
may be available in the private
health-care sector.
ESSENTIAl MEDICINES IN PrIMAry CArE fACIlITIES
The NCD CCS includes availability
of three essential medicines for
diabetes management: insulin,
metformin and sulphonylurea(s)
(see Figure 10). Insulin was reported
as generally available in 72% of
countries (128 countries), but
reported availability appears to
vary widely by region and country
income. Only 23% of low-income
countries (six countries) report
that insulin is generally available,
in contrast to 96% of high-income
Only 23% of low-income countries report that insulin is generally available
fIGurE 10. PErCENTAGE Of COuNTrIES rEPOrTING ESSENTIAl MEDICINES ArE GENErAlly AvAIlABlE IN PuBlICly fuNDED PHArMACIES IN PrIMAry HEAlTH-CArE fACIlITIES
INSULIN SULFONYLUREA(S)METFORMIN
% o
f cou
ntri
es 60%
70%
80%
90%
100%
50%
40%
30%
20%
10%
0%
Low-in
come
Africa
n Reg
ion
Europea
n Reg
ion
Lower
middle-
income
Region o
f the
Amer
icas
Sout
h-Eas
t Asia
Reg
ion
Wes
tern
Pac
ific R
egion
Easte
rn M
edite
rrane
an
Region
Upper m
iddle-inc
ome
High-inc
omeTo
tal
60%
70%
80%
90%
100%
50%
40%
30%
20%
10%
0%
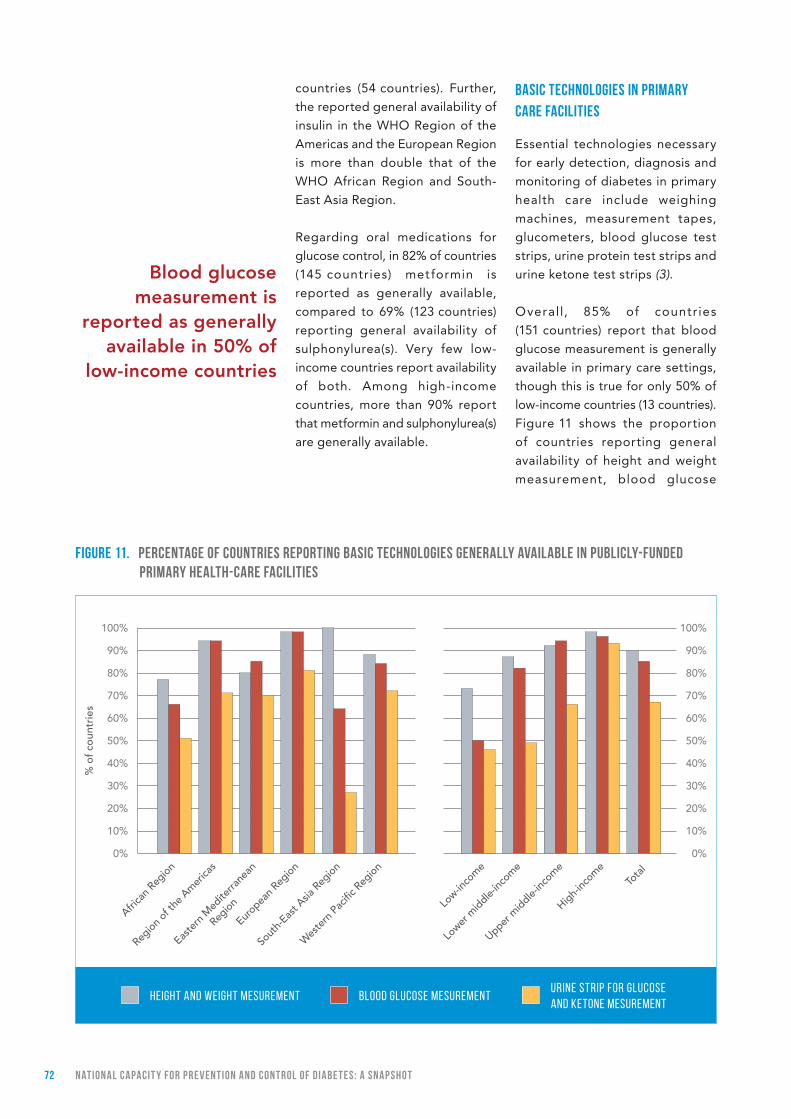
72 NAT IONAl CAPACI T y f Or PrE vEN T ION AND CON T rOl Of DIABE T ES: A SNAP SHO T
countries (54 countries). Further,
the reported general availability of
insulin in the WHO Region of the
Americas and the European Region
is more than double that of the
WHO African Region and South-
East Asia Region.
Regarding oral medications for
glucose control, in 82% of countries
(145 countries) metformin is
reported as generally available,
compared to 69% (123 countries)
reporting general availability of
sulphonylurea(s). Very few low-
income countries report availability
of both. Among high-income
countries, more than 90% report
that metformin and sulphonylurea(s)
are generally available.
BASIC TECHNOlOGIES IN PrIMAry CArE fACIlITIES
Essential technologies necessary
for early detection, diagnosis and
monitoring of diabetes in primary
health care include weighing
machines, measurement tapes,
glucometers, blood glucose test
strips, urine protein test strips and
urine ketone test strips (3).
Overall, 85% of countries
(151 countries) report that blood
glucose measurement is generally
available in primary care settings,
though this is true for only 50% of
low-income countries (13 countries).
Figure 11 shows the proportion
of countries reporting general
availability of height and weight
measurement, blood glucose
fIGurE 11. PErCENTAGE Of COuNTrIES rEPOrTING BASIC TECHNOlOGIES GENErAlly AvAIlABlE IN PuBlICly-fuNDED PrIMAry HEAlTH-CArE fACIlITIES
Blood glucose measurement is
reported as generally available in 50% of
low-income countries
HEIGHT AND WEIGHT MESUREMENTURINE STRIP FOR GLUCOSE AND KETONE MESUREMENT
BLOOD GLUCOSE MESUREMENT
% o
f cou
ntri
es 60%
70%
80%
90%
100%
50%
40%
30%
20%
10%
0%
Low-in
come
Africa
n Reg
ion
Europea
n Reg
ion
Lower
middle-
income
Region o
f the
Amer
icas
Sout
h-Eas
t Asia
Reg
ion
Wes
tern
Pac
ific R
egion
Easte
rn M
edite
rrane
an
Region
Upper m
iddle-inc
ome
High-inc
omeTo
tal
60%
70%
80%
90%
100%
50%
40%
30%
20%
10%
0%

73NAT IONAl CAPACI T y f Or PrE vEN T ION AND CON T rOl Of DIABE T ES: A SNAP SHO T
measurement, and urine strips for
glucose and ketone measurement.
There is a strong income gradient
in reported availability of these
essential technologies. Only one
in three low-income and lower
middle-income countries report
having all three of these basic,
essential technologies generally
available, in contrast with nearly
two in three of upper-middle and
nearly all of high-income countries
(not shown).
Figure 12 shows the reported
avai labi l i t y of other, more
expensive or sophis t icated
technologies and procedures
useful for ear ly detec t ion,
diagnosis and management of
diabetes and its complications:
oral glucose tolerance test,
glycated haemoglobin (HbA1c)
test, foot vibration by tuning fork,
Doppler ultrasound testing of foot
vascular status, and examination
of the eye with dilated pupil
(dilated fundus examination).
It is clear that these additional
technologies are much more
readily available in high-income
countries than in low- or middle-
income countries.
MANAGEMENT Of kIDNEy fAIlurE
Diabetes is a prominent cause of
kidney disease. Kidney failure, also
called end-stage renal disease,
requires renal replacement
therapy. Overall, 60% of countries
(106 countries) reported general
availability of renal replacement
fIGurE 12. PErCENTAGE COuNTrIES rEPOrTING OTHEr TECHNOlOGIES AS GENErAlly AvAIlABlE IN PuBlICly-fuNDED PrIMAry HEAlTH-CArE fACIlITIES
ORAL GLUCOSE TOLERANCE TEST HBA1C TEST
FOOT VASCULAR STATUS BY DOPPLER
DILATED-PUPIL FUNDUS EXAMINATION
FOOT VIBRATION PERCEPTION BY TUNING FORK
% o
f cou
ntri
es 60%
70%
80%
90%
100%
50%
40%
30%
20%
10%
0%
60%
70%
80%
90%
100%
50%
40%
30%
20%
10%
0%
Africa
n Reg
ion
Region o
f the
Amer
icas
Easte
rn M
edite
rrane
an
Region
Europea
n Reg
ion
Sout
h-Eas
t Asia
Reg
ion
Wes
tern
Pac
ific R
egion
Low-in
come
Lower
middle-
income
Upper m
iddle-inc
ome
High-inc
omeTo
tal

74 NAT IONAl CAPACI T y f Or PrE vEN T ION AND CON T rOl Of DIABE T ES: A SNAP SHO T
by dialysis, and 40% (71 countries)
reported general availability of
renal replacement by transplant.
Among high-income countries,
93% (52 countries) report that
renal replacement by dialysis
is generally available, while in
middle- and low-income countries
it is 46% (47 countries) and 27%
(seven countries) respectively.
4.4 SurvEIllANCE AND MONITOrING
Regu la r po pu la t ion - ba s ed
measurement of risk factors for
type 2 diabetes is a key aspect
of capacity to assess trends and
impact of interventions. Less
than 50% of countries reported
conducting a national population-
based survey with blood glucose
measurement within the past
5 years. This low proportion
partially reflects the cost and
complexity associated with
such measurement in surveys.
WHO’s Western Pacific Region
had the highest achievement of
surveys involving blood glucose
measurement, with 80% of
countries reporting one in the
past 5 years. Countries in the WHO
Eastern Mediterranean Region
and the WHO European Region
were least likely to have done a
survey involving blood glucose
measurement, with 25% and 27%
of countries respectively reporting
such a survey in the past 5 years.
Coverage of other risk factors was
slightly better. Roughly two in
three countries had conducted a
national, population-based survey
of overweight and obesity (72%)
and physical inactivity (69%) in the
past 5 years. Only 58% of countries
conducted a national, population-
based survey of overweight and
obesity that involved measurement
of height and weight.
Diabetes registries are specialized
monitoring systems that can be
a valuable resource to improve
treatment compliance, prevent
complications and assess the
clinical outcomes of management.
Globally, less than half of
countries (44%) have a diabetes
registry. Only 14% of countries
reported having a registry which
is population-based, whereas 19%
reported a hospital-based registry,
and 1% reported another kind of
registry for diabetes. Low-income
countries were least likely to have
any kind of diabetes registry (19%)
compared with middle- and high-
income countries where it was 54%
and 50% respectively.
4.5 SuMMAry
The results of the 2015 NCD
CCS give an encouraging global
impression that countries are
taking action to address diabetes.
Nearly three-quarters (72%) of
countries have a national diabetes
policy that is implemented with
dedicated funding, and countries
are also taking action at the policy
level to address unhealthy diets
and physical inactivity. Further
efforts are needed to ensure
funding and implementation of
these policies and plans.
When it comes to setting standards
to improve diabetes management,
71% of countries have national
guidelines or standards, though
less than half of countries
are fully implementing them.
Implementation of these standards
can help to contain cost, optimize
resources and ensure equitable
service delivery, so mechanisms
Less than 50% of countries reported
conducting a national population-based survey with blood
glucose measurement
75NAT IONAl CAPACI T y f Or PrE vEN T ION AND CON T rOl Of DIABE T ES: A SNAP SHO T
that kick-start locally appropriate
implementation of national
guidelines need to be explored.
These might include periodic
audits and the involvement of
professional associations and
patients’ groups.
The availability of essential
medicines and basic technologies
in primary health care deserves
further exploration, particularly in
countries where basic technologies
and essential medicines are not
reported to be generally available.
Greater investment in data for
surveillance and monitoring
is called for, both through
population-based surveys and
incremental monitor ing of
diabetes (4).
Finally, the NCD CCS findings
presented in this chapter speak
loudly that progress towards
d iabetes p revent ion and
management is grossly uneven.
HbA1c tests, considered the
optimal tool for monitoring blood
glucose levels (see Part 3), are
mostly unavailable in low- and
middle-income countries, but in
many settings even more basic
technologies for diagnosis and
monitoring are also lacking. Among
low- and lower middle-income
countries, only one in three (35%
and 36% of countries respectively)
can report that the most basic
technologies to measure height
and weight, blood glucose, and
urine strips for glucose and
ketone measurement are generally
available in primary care facilities.
Insulin, along with metformin
and sulphonylurea(s), is generally
available in only a minority of
low-income countries. This lack
of access to basic technologies
and essential medicines stands
in sharp contrast to the reported
widespread availability of these
items in high-income countries.
rEfErENCES
1. How WHO will report in 2017 to the United Nations General Assembly on the progress achieved in the implementation of commitments included in the 2011 UN Political Declaration and 2014 UN Outcome Document on NCDs (Technical note). Geneva: World Health Organization; 2015.
2. Noncommunicable diseases progress monitor 2015. Geneva: World Health Organization; 2015.
3. Implementation tools: Package of Essential Noncommunicable (PEN) Disease Interventions for Primary Health Care in Low-Resource Settings. Geneva: World Health Organization; 2013.
4. Global action plan for the prevention and control of noncommunicable diseases 2013–2020. Geneva: World Health Organization; 2013.
Only 1 in 3 countries in lower income groups report general availability of the most basic technologies for diagnosis and management

76 CONCl uSIONS AND rECOMMENDAT IONS
CONCluSIONS AND rECOMMENDATIONS

77CONCl uSIONS AND rECOMMENDAT IONS
SCAlING-uP PrEvENTION AND CONTrOl Of DIABETES wITHIN AN INTEGrATED NCD rESPONSE
As the prevalence and numbers of people with diabetes continue to rise – a result of changes in the way
people eat, move and live, and an ageing global population – the already-large health and economic impacts
of diabetes will grow.
These impacts can be reduced through effective actions. With sufficient lifelong management and regular
follow-up, people with all types of diabetes can live longer and healthier lives. The occurrence of type 2 diabetes
can be reduced through population-based and individual prevention measures that target key risk factors.
Tackling diabetes is integral to the success of the overall response to NCDs. In most countries, commitments
made through the Sustainable Development Goals – to reduce premature NCD mortality by a third by 2030, and
to achieve universal health coverage – will require focused attention on diabetes prevention and management.
The data presented in this report indicate that many countries have begun to take action, evidenced by the
high proportion of countries reporting national policies and plans related to diabetes prevention and control.
Implementation, however, lags behind. Access to essential medicines and technologies appears to be a key
obstacle to diabetes management, particularly in low- and middle-income countries. In many countries, lack
of access to affordable insulin remains a key impediment to successful treatment and results in needless
complications and premature deaths.
Guidance for effective diabetes prevention and control is set out in the WHO Global action plan for the prevention and control of NCDs 2013–2020 (WHO NCD Global Action Plan), and a roadmap of national
commitments to address diabetes is visible in the 2011 UN Political Declaration on NCDs and the 2014 UN
Outcome Document on NCDs. The WHO NCD Global Action Plan global monitoring framework includes
targets for 2025 to reduce mortality from diabetes and other NCDs, and a specific target to halt the rise in
diabetes and obesity. In the context of an overall integrated approach to NCDs, Countries can take a series
of actions, in line with the objectives of the WHO NCD Global Action Plan, to reduce the impact of diabetes:
1. ACCOrD GrEATEr PrIOrITy TO NCD PrEvENTION AND CONTrOl, INCluDING DIABETES
Addressing NCDs, including diabetes, is an acknowledged priority for social development and investment in
people. Scaling-up action for diabetes prevention and management with a wider NCD response requires high-
level political commitment, resources, and effective leadership and advocacy – both national and international.
Recommended actions for Member States to raise the priority of diabetes and NCDs include the following steps.
y Continue commitment to addressing diabetes as a priority in national NCD responses.
y Raise awareness about the national public health burden caused by diabetes and the relationship between
diabetes, poverty and socioeconomic development.
y Consider establishing a national, multisectoral and high-level commission, agency or task force for engagement,
policy coherence and mutual accountability among different spheres of policy-making that have a bearing on
NCDs, in order to implement whole-of-government and whole-of-society approaches.
y Increase and prioritize national budgetary allocations for addressing diabetes and key risk factors.

78 CONCl uSIONS AND rECOMMENDAT IONS
2. STrENGTHEN NATIONAl CAPACITy TO ACCElErATE COuNTry rESPONSE
The lead responsibility for ensuring appropriate legislative, regulatory, financial and service arrangements for
diabetes prevention and management lies with government. Integrated, multisectoral action and accountability
are necessary for success. In the context of existing commitments to address NCD prevention and management,
recommended actions to strengthen national capacity to address diabetes include the following steps.
y Strengthen the capacity of ministries of health to exercise a strategic leadership and coordination role in
policy development that engages all stakeholders across government, nongovernmental organizations, civil
society and the private sector, ensuring that issues relating to diabetes receive a coordinated, comprehensive
and integrated response.
y Ensure that national policies and plans addressing diabetes are fully costed and then funded and implemented.
Make use of all available data on exposure to the known risk factors for type 2 diabetes, diabetes prevalence
and the complications of diabetes to inform provisions in the national plan for diabetes prevention and
management.
y Foster accountability by setting national targets and indicators for diabetes, obesity, physical inactivity,
availability of essential medicines and basic technologies, and reductions in premature mortality resulting from
NCDs, taking into account the global NCD targets for 2025 and the NCD-related Sustainable Development
Goal targets for 2030.
y Include interventions for the prevention and control of diabetes within existing national programmes for
nutrition, physical activity and sport, maternal and child health, cardiovascular disease, and communicable
diseases such as HIV/AIDS and tuberculosis, especially in primary care.
3. CrEATE, SuSTAIN AND ExPAND HEAlTH-PrOMOTING ENvIrONMENTS TO rEDuCE MODIfIABlE rISk fACTOrS
The key modifiable risk factors for type 2 diabetes are overweight and obesity, insufficient physical activity
and unhealthy dietary practices. Smoking also increases the risk of type 2 diabetes, as well as the risk of
diabetes-related complications. Reducing these factors will decrease the occurrence of type 2 diabetes and
reduce complications related to all types of diabetes. It will also lead to reductions in other NCDs such as
cardiovascular disease.
Preventing people becoming overweight or obese is a priority for reducing type 2 diabetes. Many of the risks
start in the womb, and nutrition and health during the antenatal period are critical. Promotion of breastfeeding,
and healthier diet and physical activity in childhood and adolescence along with other supportive environments,
can contribute to healthier people and reduction in diabetes and NCDs.
Culturally and environmentally appropriate strategies are needed to create environments that support
people to maintain healthy body weight, healthy diet, and physical activity. Recommended actions include
the following steps.
y Promote the intake of healthy foods and reduce the intake of unhealthy food and sugar-sweetened
beverages. Policy tools include fiscal measures to raise the price of sugar-sweetened beverages and
unhealthy foods and/or lower the price of healthier foods; regulation of marketing of food and non-
alcoholic beverages to children; nutrition labelling; and a package of interventions to improve early
childhood nutrition, including promotion of breastfeeding.
79CONCl uSIONS AND rECOMMENDAT IONS
y Create supportive built and social environments for physical activity – transport and urban planning policy
measures can facilitate access to safe, affordable opportunities for physical activity. Point-of-decision prompts
can encourage more active transport – to use stairs versus a lift, for example.
y Maximize impact with multicomponent programmes involving policy changes, settings-based interventions,
mass media campaigns and education. Prioritize highly vulnerable and/or disadvantaged groups.
In addition to measures to promote healthy diet and physical activity, reducing exposure to tobacco will
reduce the complications of diabetes and may lead to reductions in type 2 diabetes. Tobacco use can be
reduced through implementation of comprehensive tobacco control measures in line with WHO’s Framework
Convention on Tobacco Control.
4. STrENGTHEN AND OrIENT HEAlTH SySTEMS TO ADDrESS DIABETES
Improvements in diabetes management will reduce rates of complications, ease pressure on health systems
and improve quality of life for people living with diabetes.
The core components of diabetes management include diagnosis; health education and counselling to promote
healthy choices and self-care; medications in some cases; screening and treatment of complications; and
consistent follow-up. Provision of these building blocks of care in a primary health-care setting requires adequate
health infrastructure and planning.
Diabetes management should be part of national NCD management and be incorporated into the package
of essential services included in universal health coverage. Recommended actions to strengthen diabetes
management include the following steps.
y Adapt and implement a primary health-care package for the diagnosis and effective management of all
types of diabetes, including management protocols and referral criteria, in the context of integrated NCD
management.
y Implement policies and programmes to ensure equitable access to affordable essential medicines (including
life-saving insulin) and technologies (including diagnostic equipment and supplies).
y Enhance the skills and capacity of health-care providers to provide comprehensive care for diabetes.
y Promote education and awareness around self-care practices and regular check-ups to facilitate early detection
and treatment of complications.
5. PrOMOTE HIGH-QuAlITy rESEArCH AND DEvElOPMENT
There is evidence for effective interventions to improve management of diabetes and to reduce its modifiable
risk factors, but there are significant gaps in the knowledge base. WHO’s prioritized research agenda for
prevention and control of NCDs outlines key areas of diabetes-related research. Recommended research to
advance diabetes prevention and control includes the following areas.
y Ongoing research into risk factors and prevention of all types of diabetes.
y Innovative intervention research to expand the evidence base for promotion of physical activity.
80 CONCl uSIONS AND rECOMMENDAT IONS
y Innovative outcome evaluation to capture the impact of environmental change on overweight and obesity,
and on type 2 diabetes.
y Implementation research to better understand the scope and scale of health-system strengthening.
y Options to improve access to insulin.
6. MONITOr TrENDS AND DETErMINANTS, AND EvAluATE PrOGrESS
Monitoring progress in diabetes prevention and control requires establishing and strengthening appropriate
surveillance mechanisms, as well as the capacity to make use of the resulting data. Recommended actions for
strengthening diabetes surveillance and monitoring include the following steps.
y Introduce or strengthen existing vital registration and cause of death registration systems to better reflect
the role of diabetes as the primary or underlying cause of death.
y Strengthen national capacity to collect, analyse and use representative data on the diabetes burden
and trends.
y Conduct periodic population-level surveys that include measurement of risk factors and blood glucose. Use
information from risk factor surveys and country capacity surveys, and modify plans and programmes as necessary.
y Develop, maintain and strengthen a diabetes registry if feasible and sustainable, and include information on
complications. This can be more easily achieved when electronic medical files are used.
This first WHO Global report on diabetes underscores the enormous size of the problem, and also the potential
to reverse current trends. The political basis for concerted action to address diabetes is there, woven into the
Sustainable Development Goals, the United Nations Political Declaration on NCDs, and the WHO NCD Global
Action Plan 2013–2020. Where built upon, these foundations will catalyse action by all.
There are no simple solutions for addressing diabetes but coordinated, multicomponent intervention can make
a significant difference. Everyone has a role to play – governments, health-care providers, people with diabetes
and those who care for them, civil society, food producers, and manufacturers and suppliers of medicines
and technology are all stakeholders. Collectively, they can all make a significant contribution to halt the rise
in diabetes and improve the lives of those living with the disease.

81CONCl uSIONS AND rECOMMENDAT IONS

82 ANNE xES
ANNExES
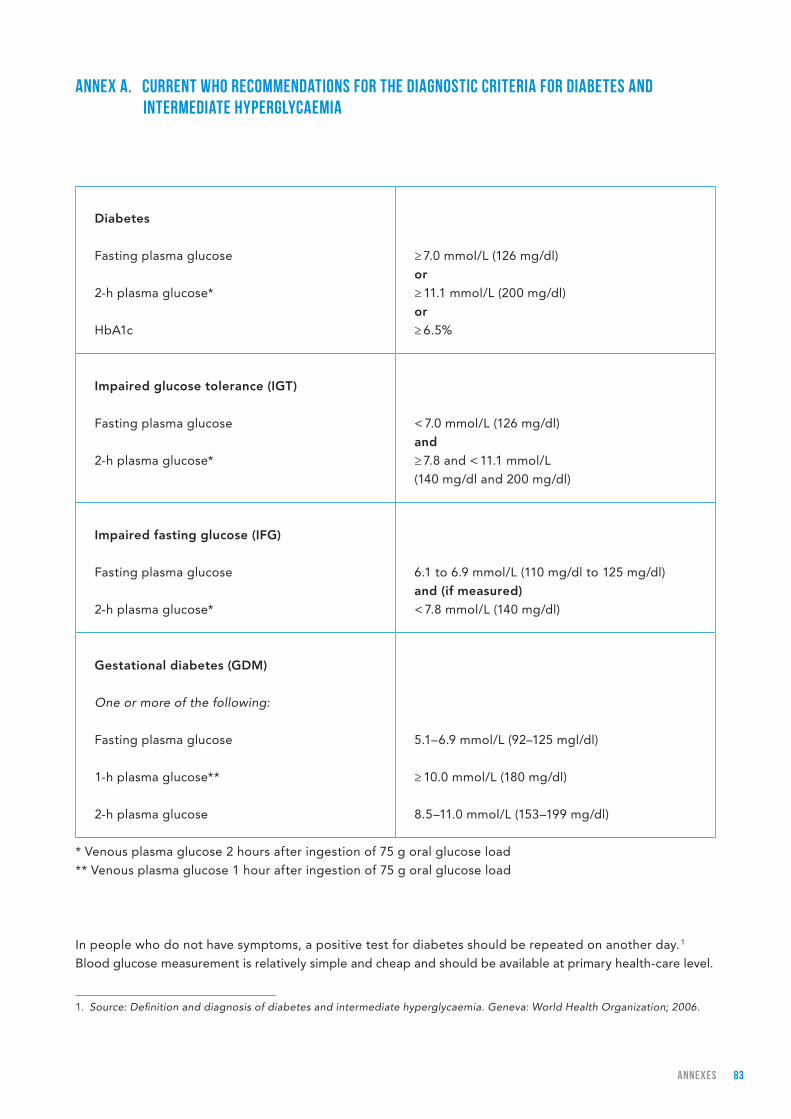
83ANNE xES
ANNEx A. CurrENT wHO rECOMMENDATIONS fOr THE DIAGNOSTIC CrITErIA fOr DIABETES AND INTErMEDIATE HyPErGlyCAEMIA
In people who do not have symptoms, a positive test for diabetes should be repeated on another day. 1
Blood glucose measurement is relatively simple and cheap and should be available at primary health-care level.
1. Source: Definition and diagnosis of diabetes and intermediate hyperglycaemia. Geneva: World Health Organization; 2006.
Diabetes
Fasting plasma glucose
2-h plasma glucose*
HbA1c
≥ 7.0 mmol/L (126 mg/dl)
or≥ 11.1 mmol/L (200 mg/dl)
or≥ 6.5%
Impaired glucose tolerance (IGT)
Fasting plasma glucose
2-h plasma glucose*
< 7.0 mmol/L (126 mg/dl)
and≥ 7.8 and < 11.1 mmol/L
(140 mg/dl and 200 mg/dl)
Impaired fasting glucose (IFG)
Fasting plasma glucose
2-h plasma glucose*
6.1 to 6.9 mmol/L (110 mg/dl to 125 mg/dl)
and (if measured)< 7.8 mmol/L (140 mg/dl)
Gestational diabetes (GDM)
One or more of the following:
Fasting plasma glucose
1-h plasma glucose**
2-h plasma glucose
5.1–6.9 mmol/L (92–125 mgl/dl)
≥ 10.0 mmol/L (180 mg/dl)
8.5–11.0 mmol/L (153–199 mg/dl)
* Venous plasma glucose 2 hours after ingestion of 75 g oral glucose load
** Venous plasma glucose 1 hour after ingestion of 75 g oral glucose load

84 ANNE xES
ANNEx B. METHODS fOr ESTIMATING DIABETES PrEvAlENCE, OvErwEIGHT AND OBESITy PrEvAlENCE, MOrTAlITy ATTrIBuTABlE TO HIGH BlOOD GluCOSE, AND PrICE Of INSulIN
Data in this report were derived from a number of sources, each of which is explained below. They are not
necessarily the official statistics of Member States.
PrEvAlENCE Of DIABETES AND TrENDS IN MEAN fASTING PlASMA GluCOSE lEvElS
The diabetes prevalence data presented in this report were estimated by the NCD Risk Factor Collaboration
(NCD-RisC) – a worldwide network/consortium of public health and medical researchers and practitioners
who together work with the World Health Organization to document NCD risk factors and their health effects
around the world. Diabetes prevalence and mean fasting plasma glucose (FPG) were estimated in the adult
population (18 years and older) for the years 1980 and 2014. Diabetes was defined as fasting plasma glucose
levels >=7.0 mmol/L (126 mg/dl); or using insulin or oral hypoglycaemic drugs; or having a history of diagnosis
of diabetes (1).
To estimate diabetes prevalence and mean fasting plasma glucose by country for the years 1980 and 2014,
NCD-RisC used data provided to WHO or to the NCD-RisC group (1). Inclusion criteria for analysis were that
the data had come from a random sample of a national, subnational, or community population, with clearly
described survey methods and a clearly specified definition of diabetes, and which had measured one of
the following biomarkers: FPG, 2-hour oral glucose tolerance test (2hOGTT), and/or HbA1c. Regressions
were used to convert any prevalence data that had been defined using alternative definitions of diabetes,
such as definitions using 2hOGTT and FPG, or based on an alternative FPG cut-off. Statistical models were
used to estimate prevalence and mean fasting plasma glucose by country and year (for description, see (2) in
references). Uncertainty in estimates was analysed by taking into account sampling error and uncertainty due
to statistical modelling. For comparison by regional groupings and time trends, prevalence estimates were
age-adjusted using the Standard WHO Population (3).
The estimates are an update of estimates for the same year published in the Global status report on NCDs
2014 (4), as they include additional survey data.
PrEvAlENCE Of OvErwEIGHT AND OBESITy
The prevalence of overweight and obesity data presented in this report were estimated by NCD-RisC, in the
adult population (18 years and older) for 2014 (5). Overweight was defined as the percentage of the population
aged 18 or older having a body mass index (BMI) ≥25 kg/m2. Obesity was defined as the percentage of the
population aged 18 or older having a body mass index (BMI) ≥30 kg/m2. NCD-RisC used data provided to
WHO or to the NCD-RisC group. Inclusion criteria for analysis were that the data had come from a random
sample of a national, subnational, or community population, with clearly described survey methods and with
height and weight measured in the study population. Statistical models were used to estimate prevalence by
country and year (for description, see (5) in references). Uncertainty in estimates was analysed by taking into
account sampling error and uncertainty due to statistical modelling. For comparison by regional groupings
and time trends, prevalence estimates were age-adjusted using the Standard WHO Population (3).

85ANNE xES
MOrTAlITy ATTrIBuTABlE TO DIABETES AND HIGH BlOOD GluCOSE
Age and sex-specific, all-cause mortality rates were estimated for 2000–2012 from revised life tables published
in World Health Statistics 2014 (6). Detailed information on the methodology is available in WHO methods
and data sources for country-level causes of death 2000–2012 (7). The total number of deaths by age and sex
was estimated for each country by applying these death rates to the estimated population prepared by the
United Nations Population Division in its 2012 revision (8). Causes of death were estimated for 2000–2012
using data sources and methods described by WHO in 2014 (9). Vital registration systems that record deaths
with sufficient completeness were used as the preferred data source. The mortality estimates are based on a
combination of country life tables, cause of death models and regional cause of death patterns.
There is convincing evidence for a causal relationship between higher-than-optimal fasting blood glucose
levels and cardiovascular disease (CVD), chronic kidney disease, and tuberculosis (TB) mortality. The optimal
distribution of fasting blood glucose is estimated to be population distribution with a mean of 4.9–5.3 mmol/L,
SD 0.4–0.6, which are levels corresponding to lowest all-cause mortality as derived from meta-analyses of
prospective studies (10). Relative risks of higher-than-optimal fasting plasma glucose were derived from
meta-analyses of prospective studies (10, 11). Population-attributable fractions for each age-sex group and
each country were calculated using the estimated distribution of FPG and relative risks for each cause of
death (CVD, chronic kidney disease, and TB). The number of deaths attributable to high blood glucose was
calculated by multiplying the population-attributable fraction for CVD deaths, chronic kidney disease deaths
and TB deaths by the number of deaths from each cause for each age-sex-country unit. All deaths with
diabetes assigned as the underlying cause of death are assumed to be caused by higher-than-optimal blood
glucose. More details on the methodology are available elsewhere (12).
ASSESSING NATIONAl rESPONSE TO DIABETES PrEvENTION AND CONTrOl
Assessment of national capacity indicators related to diabetes prevention management was based on Member
State responses to the 2015 Noncommunicable Disease Country Capacity Survey (NCD CCS) (13).
The NCD CCS is conducted periodically by WHO to assess individual country capacity for NCD prevention.
A first survey was conducted in 2000, followed by surveys in 2005, 2010, 2013 and 2015. The questionnaire
covers health system infrastructure; funding; policies, plans and strategies; surveillance; primary health
care; and partnerships and multilateral collaboration. The 2015 NCD CCS was completed by national NCD
focal points or designated colleagues within the ministry of health or a national institute/agency. The
questions were designed to obtain objective information about the adequacy of capacity, and countries
were requested to provide supporting documentation to enable review by WHO in order to validate the
responses. Where discrepancies were noted between the country response and the provided supporting
documents or other available sources of information at WHO, clarification was requested from the
countries. The 2015 NCD CCS was completed through a web-based platform between May and August
2015. Of 194 Member States, 177 responded to the survey, representing 97% of the world’s population.
More information on the NCD CCS, including the questionnaire and past survey reports, is available on the
survey website (http://www.who.int/chp/ncd_capacity/en/ ).
PrICE Of INSulIN
Management Sciences for Health (MSH) is a non-profit organisation established in 1971 (14). Since its
establishment it has worked in over 150 countries to develop health systems, focusing on improving quality,
availability and affordability of health services. One of the tools developed by MSH is the International Drug
Price Indicator Guide (IDPIG) (15). The guide provides a variety of prices from different sources including
86 ANNE xES
rEfErENCES
1. NCD Risk Factor Collaboration (NCD-RisC). Worldwide trends in diabetes since 1980: a pooled analysis of 751 population-based studies with 4*4 million participants. Lancet 2016; published online April 7. http://dx.doi.org/10.1016/S0140-6736(16)00618-8.
2. Finucane MM, Danaei G, Ezzati M. Bayesian estimation of population-level trends in measures of health status. Statistical Sciences. 2014;29;18–25.
3. Ahmad O. Age standardization of rates: a new WHO standard (Technical report). GPE discussion paper series: No 31. Geneva: World Health Organization; 2001.
4. Global status report on noncommunicable diseases 2014. Geneva: World Health Organization; 2014.
5. NCD Risk Factor Collaboration (NCD-RisC). Trends in adult body-mass index in 200 countries from 1975 to 2014: a pooled analysis of 1698 population-based measurement studies with 19*2 million participants. Lancet (in press).
6. World Health Statistics 2014. Geneva: World Health Organization; 2014.
7. WHO methods for life expectancy and healthy life expectancy. Global health estimates technical paper WHO/HIS/HSI/GHE/2014.5. Geneva: World Health Organization; 2014.
8. United Nations Population Division. World population prospects – 2012 revision. New York: United Nations; 2013.
9. WHO methods and data sources for country-level causes of death 2000–2012. Global health estimates technical paper WHO/HIS/HSI/GHE/2014.7. Geneva: World Health Organization; 2014.
10. Singh GM, Danaei G, Farzadfar F, Stevens GA, Woodward M, Wormser DK, et al. The age-specific quantitative effects of metabolic risk factors on cardiovascular diseases and diabetes: a pooled analysis. PLoS. One. 2013;8,:(7)e65174.
11. Jeon CY, Murray MB. Diabetes mellitus increases the risk of active tuberculosis: a systematic review of 13 observational studies. PLoS.Med. 2008;5:(7)e152.
12. Global Burden of Metabolic Risk Factors for Chronic Diseases Collaboration. Cardiovascular disease, chronic kidney disease and diabetes mortality burden of cardiometabolic risk factors from 1980 to 2010: a comparative risk assessment. Lancet Diabetes Endocrinology. 2014;2:(8)634–647.
13. Noncommunicable diseases progress monitor, 2015. Geneva: World Health Organization; 2015.
14. Mission and Vision. Medford, Massachusettes: Management Sciences for Health; 2015.
15. International Drug Price Indicator Guide, 2015. Washington DC: Management Sciences for Health; 2015.
16. Measuring medicine prices, availability, affordability and price components Geneva and Amsterdam: World Health Organization and Health Action International; 2008.
pharmaceutical suppliers, international development agencies and governments. This guide allows for
comparison of prices of medicines of assured quality and is used as a reference in many approaches looking at
access to medicines, for example the methodology developed by WHO and Health Action International (16).
Using the online version of IDPIG, data from 1996 to 2014 were extracted from purchasers of insulin. All insulin
formulations were standardized to an equivalent of a 10 ml 100 IU vial. The minimum, maximum and median
prices are calculated over the time period for all countries combined, as well as median prices over the time
period, disaggregated by country income group as defined by the World Bank in 2015.

PHOTO CrEDITS
Page 10 WHO / Quinn Mattingly
Page 17 WHO / Atul Loke
Page 20 WHO / Eduardo Martino
Page 31 WHO / Patrick Brown
Page 34 WHO / Atul Loke
Page 46 WHO / Fredrik Naumann
Page 62 WHO / Patrick Brown
Page 66 WHO / Eduardo Martino
Page 76 WHO / Patrick Brown
Page 82 WHO / Fredrik Naumann

ISBN 978 92 4 156525 7


