6 December 2002 ADBI Institute Tokyo D. Roland-Holst
Global Production Networks and Multilateral Trade Linkages: A Structural Analysis of East Asia
David Roland-HolstUniversity of California, Berkeley and Mills College
Visiting Scholar, ADBI
6 December 2002Asian Development Bank Institute
Tokyo

18 December 2002 ADBI Institute Tokyo D. Roland-Holst
Contents
I. IntroductionII. OverviewIII. DatabaseIV. Block DecompositionV. Path DecompositionVI. Conclusions
18 December 2002 ADBI Institute Tokyo D. Roland-Holst
I. Introduction
The global economy has changed patterns of trade and production in unprecedented ways.Two of the most salient features of this process are the animating role of private agency and global supply chain decomposition.With international capital allocation (FDI) and contracts, private agents have created extremely complex global supply networks The corresponding intermediate trade linkages are increasingly responsible for the majority of value creation
18 December 2002 ADBI Institute Tokyo D. Roland-Holst
Introduction
They also create the preconditions for independent producer and market development in recipient countriesTo assess these complex, trade mediated interactions, we have developed an international multiplier model based on the GTAP database.Decomposition analysis with this model reveals regional trade interactions at unprecedented levels of detail.
18 December 2002 ADBI Institute Tokyo D. Roland-Holst
Part II
Overview of Global Supply Networks

18 December 2002 ADBI Institute Tokyo D. Roland-Holst
Public Multilateralism: WTO
Great AccomplishmentsSignificant Limitations (some only temporary)
Imperfect bargaining vehiclequite slowdiverse phase-in commitments and exceptions
High tariff bindingsEvasive protection
contingent protectionadministrative measures

18 December 2002 ADBI Institute Tokyo D. Roland-Holst
Public Multilateralism: Bilateral Contagion
In part because of its imperfections, the WTO has further promoted liberalism via smaller scale agreements, especially BTAs.
Motives:Lock in early WTO gains with neighbors and “like minded” partnersFirst-mover advantage for market entry and export accessBlueprint for WTO accession (China, Vietnam)
18 December 2002 ADBI Institute Tokyo D. Roland-Holst
Public Multilateralism: East Asia
In this region, China will probably set the pace with its WTO initiative. Other economies in the region will have to come to terms with this, but its emergent internal market represents a great prize for regional exporters.This China Bandwagon effect will propagate liberalism across the region, regardless of other country’s own WTO strategies.

18 December 2002 ADBI Institute Tokyo D. Roland-Holst
Private Multilateralism: The Invisible Handshake
Private agency is redefining trade patterns and economic structure in ways unforeseen by RicardoUnlike official trade negotiation, this process is largely spontaneous and collaborativeGlobalization has been accompanied by an unprecedented proliferation of ownership and contractual networksThe main catalyst for this process is international capital mobility and FDI

18 December 2002 ADBI Institute Tokyo D. Roland-Holst
Private Multilateralism: FDI
Global capital allocation, particularly in East Asia, is animated by complex motives:Resource costs (the traditional explanation)Market access: double targetingProximate marketsRent seeking and other institutional imperfectionsPortfolio decisions
risk managementasset allocationsupply chain decomposition
18 December 2002 ADBI Institute Tokyo D. Roland-Holst
Supply Chain Decomposition
As global networks expand, supply chains are decomposed into ever smaller and more specialized segmentsIntermediate linkages and intra-industry trade are accelerating much faster than final goods tradeThe entry point for a recipient country in this network depends upon their FDI “readiness”To a significant extent this has led an international hierarchy and competition for
value added in intermediate productiontechnology acquisitiongrowth externalities
18 December 2002 ADBI Institute Tokyo D. Roland-Holst
Bamboo Capitalism
Because of network externalities in local production and finance, complete markets sprout from nodes in a global root system of intermediate supply. This culminating aspect of global supply chain decomposition has created a diverse and vibrant population of independent local industries around the East Asian region. Many emergent enterprises are still bound to their roots by ownership or contractsBut increasingly they arise independently, promoting the dynamics of global competitiveness and innovation.

18 December 2002 ADBI Institute Tokyo D. Roland-Holst
III. International Database: The Global Trade Analysis Project
The GTAP dataset contains, for 66 countries/regions and 57 sectors,
1. National income and product accounts2. Input-output tables3. Bilateral trade flow tables4. Protection and support estimates
for more information, see www.gtap.org

18 December 2002 ADBI Institute Tokyo D. Roland-Holst
Aggregation
Reg Label Name1 chn China 2 jpn Japan 3 kor Korea 4 twn Taipei,China5 asn ASEAN6 usa United States 7 eur Western Europe 8 row Rest of the World
18 December 2002 ADBI Institute Tokyo D. Roland-Holst
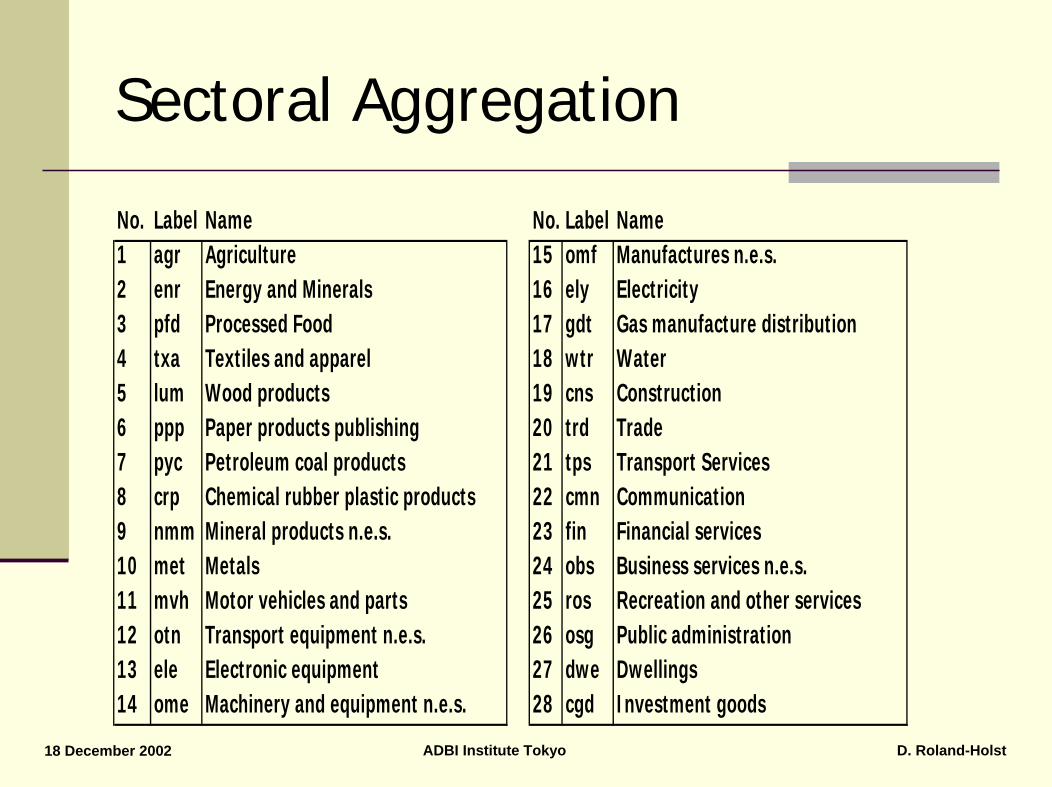
Sectoral Aggregation
No. Label Name No. Label Name1 agr Agriculture 15 omf Manufactures n.e.s. 2 enr Energy and Minerals 16 ely Electricity 3 pfd Processed Food 17 gdt Gas manufacture distribution 4 txa Textiles and apparel 18 wtr Water 5 lum Wood products 19 cns Construction 6 ppp Paper products publishing 20 trd Trade 7 pyc Petroleum coal products 21 tps Transport Services 8 crp Chemical rubber plastic products 22 cmn Communication 9 nmm Mineral products n.e.s. 23 fin Financial services 10 met Metals 24 obs Business services n.e.s. 11 mvh Motor vehicles and parts 25 ros Recreation and other services 12 otn Transport equipment n.e.s. 26 osg Public administration13 ele Electronic equipment 27 dwe Dwellings 14 ome Machinery and equipment n.e.s. 28 cgd Investment goods

18 December 2002 ADBI Institute Tokyo D. Roland-Holst
IV. Block Multiplier Decomposition
While trade flow data are revealing, they only capture direct bilateral effects.In the real economy, a myriad of interactions delineate the path from initial expenditure to ultimate incomes.This is particularly the case with trade in an era of globalization, where international supply chains are ever more elaborate and indirect linkages can represent the majority of value creation.To assess these effects empirically, we use the international SAM for multiplier analysis.

18 December 2002 ADBI Institute Tokyo D. Roland-Holst
Social Accounting Matrix
Consider an example of three countries, each represented by a social accounting matrix of the form
where the component matrices denote commodity flows (T), final demand (FD), value added (VA), and other domestic accounts (X).
⎥⎦
⎤⎢⎣
⎡=
kk
kkkk XV
FTT
18 December 2002 ADBI Institute Tokyo D. Roland-Holst
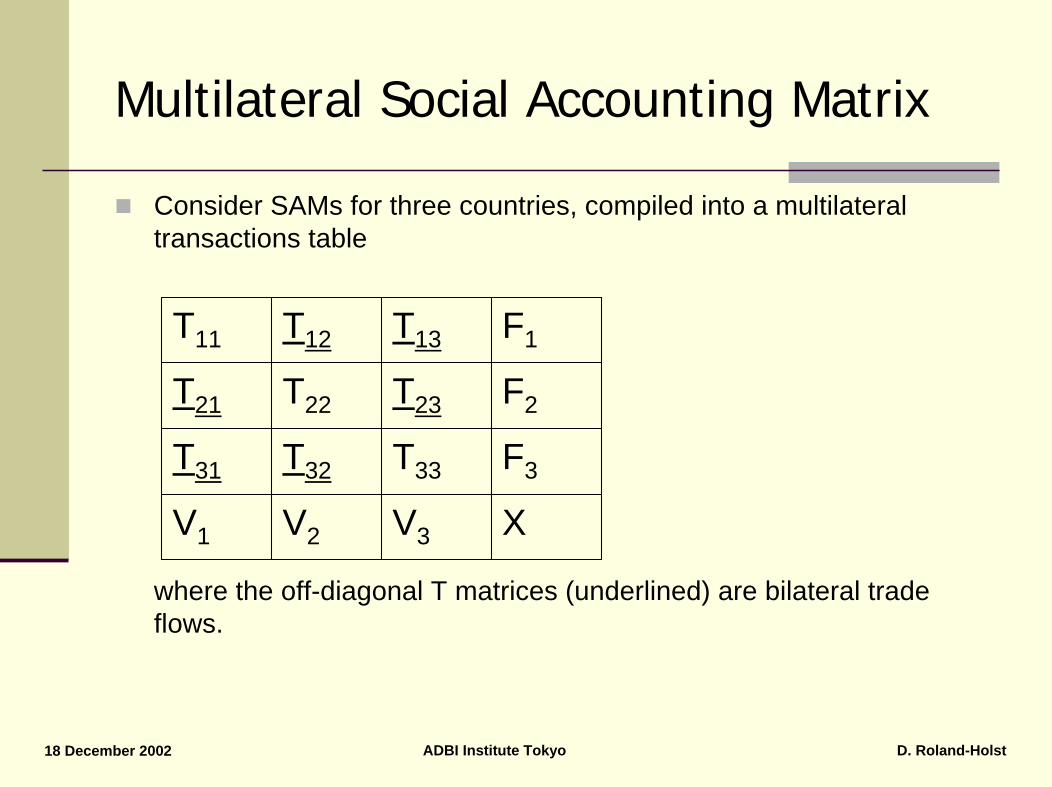
Multilateral Social Accounting Matrix
Consider SAMs for three countries, compiled into a multilateral transactions table
where the off-diagonal T matrices (underlined) are bilateral trade flows.
T11 T12 T13 F1
T21 T22 T23 F2
T31 T32 T33 F3
V1 V2 V3 X
18 December 2002 ADBI Institute Tokyo D. Roland-Holst
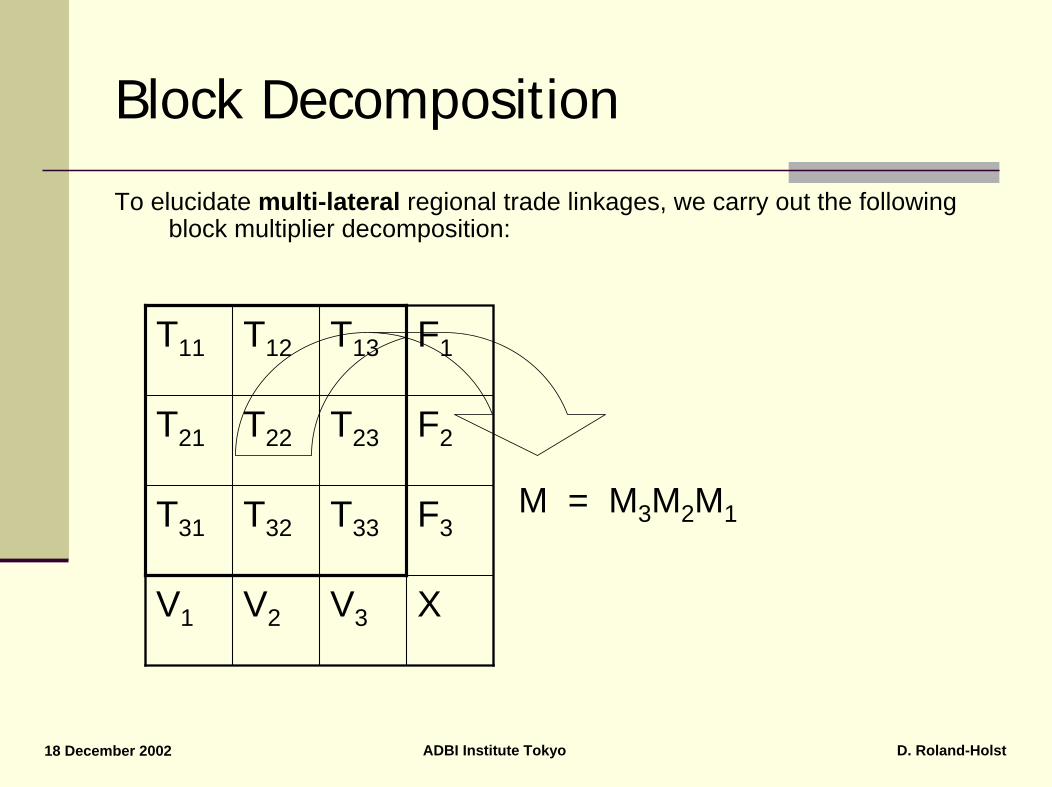
Block Decomposition
To elucidate multi-lateral regional trade linkages, we carry out the following block multiplier decomposition:
M = M3M2M1
T11 T12 T13 F1
T21 T22 T23 F2
T31 T32 T33 F3
V1 V2 V3 X

18 December 2002 ADBI Institute Tokyo D. Roland-Holst
Block Decomposition (cont.)
M1 =
M2 =
M3 =
(I-A11)-1 0 0
0 (I-A22)-1 0
0 0 (I-A33)-1
LinkagesIntra-country
Inter-country (bilateral)
Equilibrium IndirectI (I-A11)-1A12 (I-A11)-1A13
(I-A22)-1A21 I (I-A22)-1A32
(I-A33)-1A31 (I-A33)-1A32 I
I-D12D21-D13D31 D21D12 D31D13
D12D21 I-D21D12-D23D32 D23D32
D13D31 D23D32 I-D31D13-D23D32
Note: Dij = (I-Aii)-1Aij

18 December 2002 ADBI Institute Tokyo D. Roland-Holst
Household Income Multipliersenr txa mvh ele ome
China 3.82 3.69 3.13 2.18 3.05Japan .24 .84 .39 .42 .44Korea .24 .54 .32 .31 .31Taipei,China .23 .47 .30 .33 .34ASEAN .27 .54 .33 .34 .35China 2.25 2.43 2.93 3.06 2.70Japan 2.36 8.19 9.72 9.52 9.31Korea .57 1.77 1.85 2.35 2.30Taipei,China 1.04 2.53 3.17 3.09 3.26ASEAN 1.64 2.19 3.64 2.82 3.02China .27 .39 .27 .33 .29Japan .06 .23 .15 .18 .16Korea .74 3.00 3.18 2.36 2.59Taipei,China .08 .23 .19 .22 .18ASEAN .15 .32 .24 .26 .20China .25 .35 .25 .30 .27Japan .04 .16 .11 .14 .12Korea .03 .11 .07 .11 .07Taipei,China .97 2.81 2.21 2.10 1.98ASEAN .10 .26 .13 .17 .14China .33 .33 .29 .39 .30Japan .34 .32 .28 .33 .28Korea .30 .25 .22 .27 .21Taipei,China .53 .33 .26 .41 .24ASEAN 2.30 2.30 1.85 1.47 1.21
Taipei
ASEAN
China
Japan
Korea
18 December 2002 ADBI Institute Tokyo D. Roland-Holst
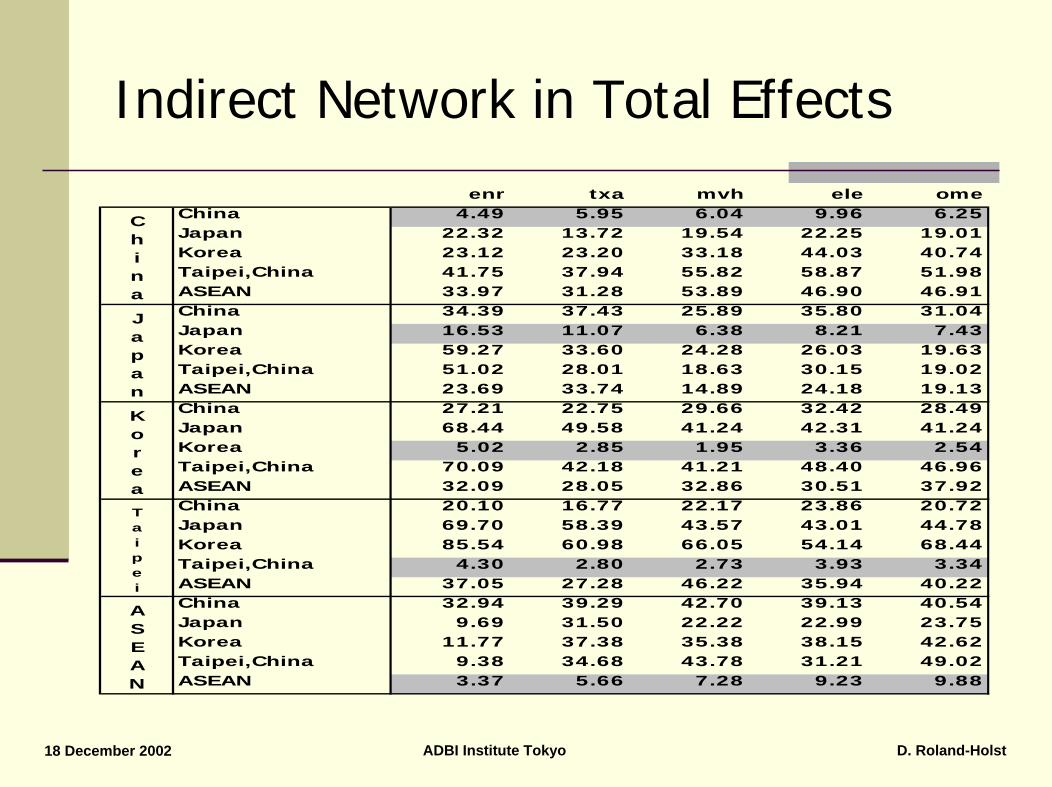
Indirect Network in Total Effectsenr txa mvh ele ome
China 4.49 5.95 6.04 9.96 6.25Japan 22.32 13.72 19.54 22.25 19.01Korea 23.12 23.20 33.18 44.03 40.74Taipei,China 41.75 37.94 55.82 58.87 51.98ASEAN 33.97 31.28 53.89 46.90 46.91China 34.39 37.43 25.89 35.80 31.04Japan 16.53 11.07 6.38 8.21 7.43Korea 59.27 33.60 24.28 26.03 19.63Taipei,China 51.02 28.01 18.63 30.15 19.02ASEAN 23.69 33.74 14.89 24.18 19.13China 27.21 22.75 29.66 32.42 28.49Japan 68.44 49.58 41.24 42.31 41.24Korea 5.02 2.85 1.95 3.36 2.54Taipei,China 70.09 42.18 41.21 48.40 46.96ASEAN 32.09 28.05 32.86 30.51 37.92China 20.10 16.77 22.17 23.86 20.72Japan 69.70 58.39 43.57 43.01 44.78Korea 85.54 60.98 66.05 54.14 68.44Taipei,China 4.30 2.80 2.73 3.93 3.34ASEAN 37.05 27.28 46.22 35.94 40.22China 32.94 39.29 42.70 39.13 40.54Japan 9.69 31.50 22.22 22.99 23.75Korea 11.77 37.38 35.38 38.15 42.62Taipei,China 9.38 34.68 43.78 31.21 49.02ASEAN 3.37 5.66 7.28 9.23 9.88
Taipei
ASEAN
China
Japan
Korea

18 December 2002 ADBI Institute Tokyo D. Roland-Holst
V. Path Decomposition
Block decomposition reveals the generic sources, but not the actual bilateral chains of income determination.To summarize the methodology:
An arc is a pair <i,j> of indices in the SAM accountsA path is a sequence s of indices s=<i,k,l,...,m,j>decomposable into consecutive arcs <i,k>, <k,l>,...,<m,j>. The influence of i on j through path s is denoted (i->j)sTo estimate the income effect along <i,j>, before economywide linkages are taken into account, we have:
jii
j ayy
=∂
∂

18 December 2002 ADBI Institute Tokyo D. Roland-Holst
Path DecompositionFor any given path s=<i,k,...,m,j> the Direct income influence the composite
In any given path s there may exist feedback effects among its indices, each of which can be represented by a multiplier μs (actually the ji entry in the multiplier matrix M.All of these feedback effects taking place along the path amplify the direct influence to produce Total influence:
( ) ...i j s ki jmD a a→ =
( ) ( )i j s i j s sT D μ→ →=
18 December 2002 ADBI Institute Tokyo D. Roland-Holst
Path Decomposition
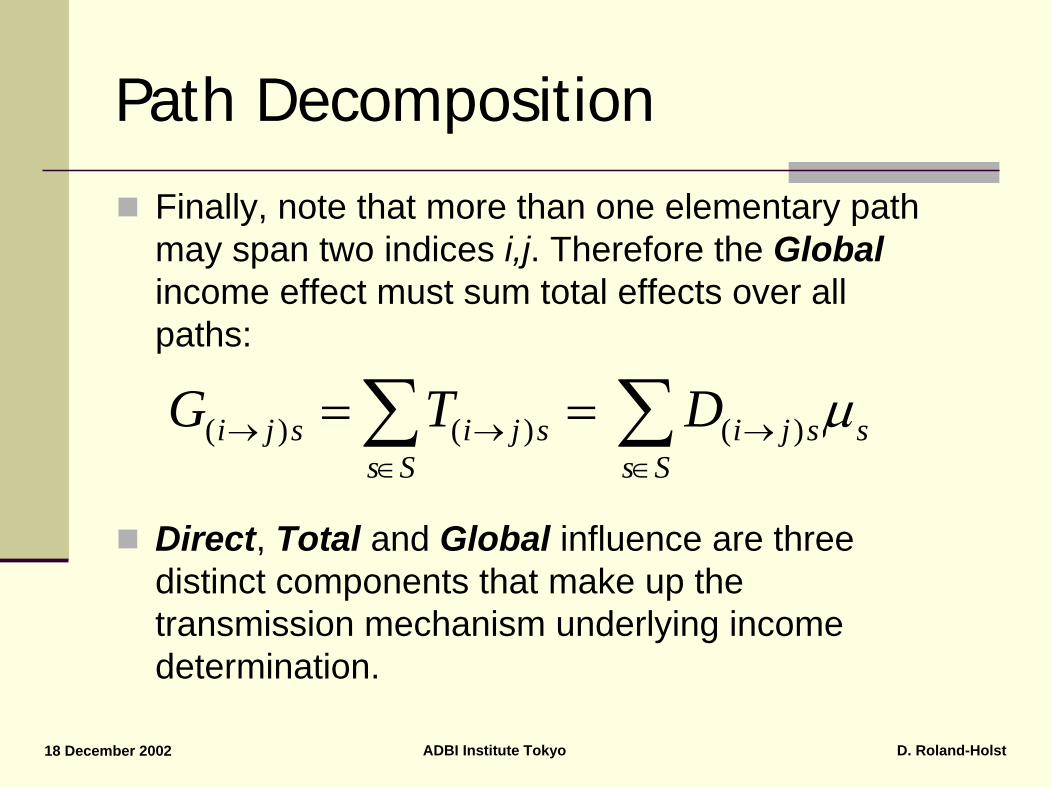
Finally, note that more than one elementary path may span two indices i,j. Therefore the Globalincome effect must sum total effects over all paths:
Direct, Total and Global influence are three distinct components that make up the transmission mechanism underlying income determination.
( ) ( ) ( )i j s i j s i j s ss S s S
G T D μ→ → →∈ ∈
= =∑ ∑

18 December 2002 ADBI Institute Tokyo D. Roland-Holst
Example 1: Linkages from Japanese Electronics to Japanese Households
Please see the handout.

18 December 2002 ADBI Institute Tokyo D. Roland-Holst
Example 2: Chinese Electronics to Japanese Households
Global Direct Path Total % ofPath Effect Effect Mult Effect Global1. chn-ele -> jpn-ele -> jpn-Usk -> jpn-hhs 3.059 0.018 13.242 0.234 7.62. chn-ele -> jpn-ele -> jpn-Skl -> jpn-hhs 0.011 13.242 0.144 4.73. chn-ele -> jpn-ele -> jpn-Cap -> jpn-hhs 0.019 13.242 0.258 8.44. chn-ele -> jpn-ele -> jpn-gov -> jpn-hhs 0.002 18.748 0.030 1.05. chn-ele -> jpn-ele -> jpn-crp -> jpn-Cap -> jpn-hhs 0.001 13.538 0.015 0.56. chn-ele -> jpn-ele -> jpn-met -> jpn-Usk -> jpn-hhs 0.001 15.195 0.021 0.77. chn-ele -> jpn-ele -> jpn-met -> jpn-Cap -> jpn-hhs 0.001 15.195 0.020 0.78. chn-ele -> jpn-ele -> jpn-trd -> jpn-Usk -> jpn-hhs 0.002 13.488 0.033 1.19. chn-ele -> jpn-ele -> jpn-trd -> jpn-Skl -> jpn-hhs 0.002 13.488 0.021 0.710. chn-ele -> jpn-ele -> jpn-trd -> jpn-Cap -> jpn-hhs 0.001 13.488 0.017 0.611. chn-ele -> jpn-ele -> jpn-obs -> jpn-Usk -> jpn-hhs 0.002 13.799 0.021 0.712. chn-ele -> jpn-ele -> jpn-obs -> jpn-Skl -> jpn-hhs 0.001 13.799 0.014 0.513. chn-ele -> jpn-ele -> jpn-obs -> jpn-Cap -> jpn-hhs 0.002 13.799 0.032 1.114. chn-ele -> jpn-ele -> jpn-osg -> jpn-Usk -> jpn-hhs 0.004 13.886 0.053 1.715. chn-ele -> jpn-ele -> jpn-osg -> jpn-Skl -> jpn-hhs 0.002 13.886 0.031 1.016. chn-ele -> asn-ele -> jpn-ele -> jpn-Usk -> jpn-hhs 0.001 17.867 0.023 0.817. chn-ele -> asn-ele -> jpn-ele -> jpn-Cap -> jpn-hhs 0.001 17.867 0.025 0.8

18 December 2002 ADBI Institute Tokyo D. Roland-Holst
Example 3: Chinese Electronics to Japanese Electronics
Global Direct Path Total % of Cum Path Effect Effect Mult Effect Global % chn-ele>jpn-ele 0.379 0.125 1.884 0.236 62.3 62.3 chn-ele>kor-ele>jpn-ele 0.003 2.143 0.007 2.0 64.3 chn-ele>twn-ele>jpn-ele 0.006 2.120 0.013 3.4 67.7 chn-ele>asn-ele>jpn-ele 0.009 2.546 0.023 6.2 73.9 chn-ele>chn-ome>jpn-ome>jpn-ele 0.000 3.641 0.001 0.2 74.1 chn-ele>kor-ele>asn-ele>jpn-ele 0.000 2.885 0.001 0.2 74.2 chn-ele>twn-ele>kor-ele>jpn-ele 0.000 2.420 0.000 0.1 74.3 chn-ele>twn-ele>asn-ele>jpn-ele 0.001 2.860 0.002 0.5 74.9 chn-ele>asn-ele>kor-ele>jpn-ele 0.000 2.885 0.001 0.2 75.1 chn-ele>asn-ele>twn-ele>jpn-ele 0.000 2.860 0.001 0.2 75.3 chn-ele>asn-ele>asn-ome>jpn-ome>jpn-ele 0.000 3.878 0.000 0.1 75.4
18 December 2002 ADBI Institute Tokyo D. Roland-Holst
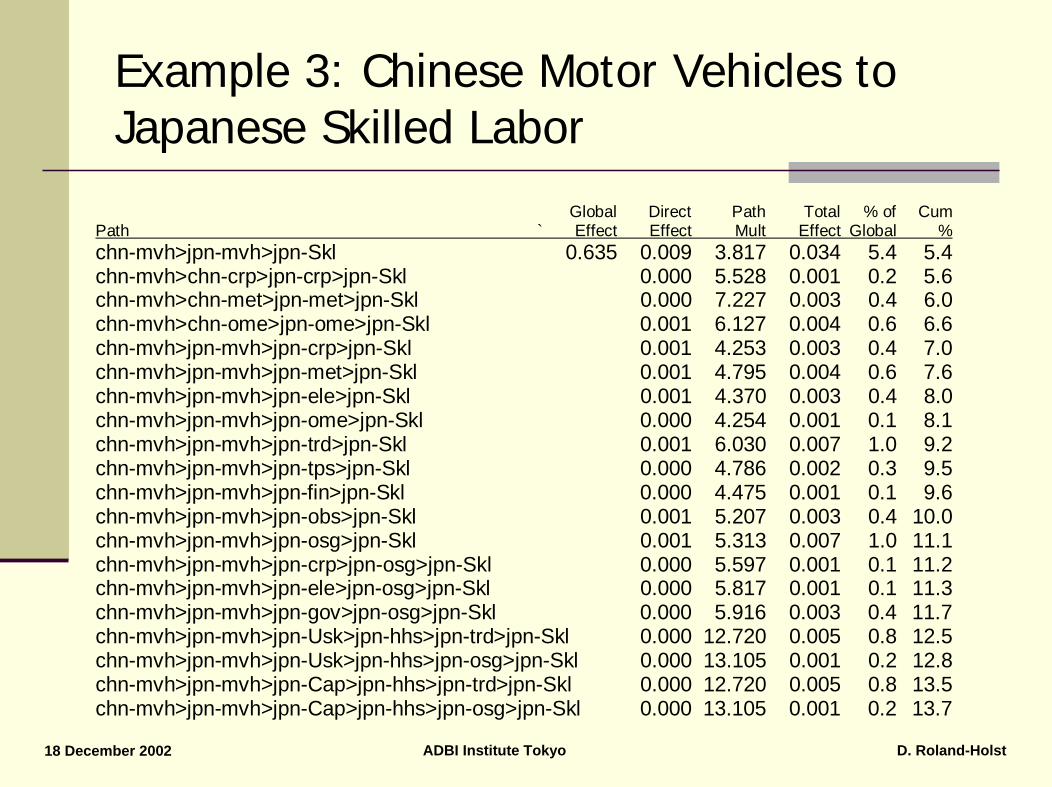
Example 3: Chinese Motor Vehicles to Japanese Skilled Labor
Global Direct Path Total % of Cum Path ` Effect Effect Mult Effect Global % chn-mvh>jpn-mvh>jpn-Skl 0.635 0.009 3.817 0.034 5.4 5.4 chn-mvh>chn-crp>jpn-crp>jpn-Skl 0.000 5.528 0.001 0.2 5.6 chn-mvh>chn-met>jpn-met>jpn-Skl 0.000 7.227 0.003 0.4 6.0 chn-mvh>chn-ome>jpn-ome>jpn-Skl 0.001 6.127 0.004 0.6 6.6 chn-mvh>jpn-mvh>jpn-crp>jpn-Skl 0.001 4.253 0.003 0.4 7.0 chn-mvh>jpn-mvh>jpn-met>jpn-Skl 0.001 4.795 0.004 0.6 7.6 chn-mvh>jpn-mvh>jpn-ele>jpn-Skl 0.001 4.370 0.003 0.4 8.0 chn-mvh>jpn-mvh>jpn-ome>jpn-Skl 0.000 4.254 0.001 0.1 8.1 chn-mvh>jpn-mvh>jpn-trd>jpn-Skl 0.001 6.030 0.007 1.0 9.2 chn-mvh>jpn-mvh>jpn-tps>jpn-Skl 0.000 4.786 0.002 0.3 9.5 chn-mvh>jpn-mvh>jpn-fin>jpn-Skl 0.000 4.475 0.001 0.1 9.6 chn-mvh>jpn-mvh>jpn-obs>jpn-Skl 0.001 5.207 0.003 0.4 10.0 chn-mvh>jpn-mvh>jpn-osg>jpn-Skl 0.001 5.313 0.007 1.0 11.1 chn-mvh>jpn-mvh>jpn-crp>jpn-osg>jpn-Skl 0.000 5.597 0.001 0.1 11.2 chn-mvh>jpn-mvh>jpn-ele>jpn-osg>jpn-Skl 0.000 5.817 0.001 0.1 11.3 chn-mvh>jpn-mvh>jpn-gov>jpn-osg>jpn-Skl 0.000 5.916 0.003 0.4 11.7 chn-mvh>jpn-mvh>jpn-Usk>jpn-hhs>jpn-trd>jpn-Skl 0.000 12.720 0.005 0.8 12.5 chn-mvh>jpn-mvh>jpn-Usk>jpn-hhs>jpn-osg>jpn-Skl 0.000 13.105 0.001 0.2 12.8 chn-mvh>jpn-mvh>jpn-Cap>jpn-hhs>jpn-trd>jpn-Skl 0.000 12.720 0.005 0.8 13.5 chn-mvh>jpn-mvh>jpn-Cap>jpn-hhs>jpn-osg>jpn-Skl 0.000 13.105 0.001 0.2 13.7

18 December 2002 ADBI Institute Tokyo D. Roland-Holst
Example 4: Chinese Electronics to ASEAN Electronics
Global Direct Path Total % of Cum Path Effect Effect Mult Effect Global % chn-ele>asn-ele 0.216 0.097 1.617 0.157 72.8 72.8 chn-ele>jpn-ele>asn-ele 0.005 2.546 0.013 5.9 78.7 chn-ele>kor-ele>asn-ele 0.002 1.839 0.004 1.8 80.6 chn-ele>twn-ele>asn-ele 0.008 1.824 0.014 6.4 87.0 chn-ele>jpn-ele>twn-ele>asn-ele 0.000 2.860 0.000 0.2 87.2 chn-ele>kor-ele>jpn-ele>asn-ele 0.000 2.885 0.000 0.2 87.4 chn-ele>twn-ele>jpn-ele>asn-ele 0.000 2.860 0.001 0.3 87.7

18 December 2002 ADBI Institute Tokyo D. Roland-Holst
Example 5: Chinese Motor Vehicles to Japanese Skilled Labor
Global Direct Path Total % of Cum Path ` Effect Effect Mult Effect Global % chn-mvh>jpn-mvh>jpn-Skl 0.635 0.009 3.817 0.034 5.4 5.4 chn-mvh>chn-crp>jpn-crp>jpn-Skl 0.000 5.528 0.001 0.2 5.6 chn-mvh>chn-met>jpn-met>jpn-Skl 0.000 7.227 0.003 0.4 6.0 chn-mvh>chn-ome>jpn-ome>jpn-Skl 0.001 6.127 0.004 0.6 6.6 chn-mvh>jpn-mvh>jpn-crp>jpn-Skl 0.001 4.253 0.003 0.4 7.0 chn-mvh>jpn-mvh>jpn-met>jpn-Skl 0.001 4.795 0.004 0.6 7.6 chn-mvh>jpn-mvh>jpn-ele>jpn-Skl 0.001 4.370 0.003 0.4 8.0 chn-mvh>jpn-mvh>jpn-ome>jpn-Skl 0.000 4.254 0.001 0.1 8.1 chn-mvh>jpn-mvh>jpn-trd>jpn-Skl 0.001 6.030 0.007 1.0 9.2 chn-mvh>jpn-mvh>jpn-tps>jpn-Skl 0.000 4.786 0.002 0.3 9.5 chn-mvh>jpn-mvh>jpn-fin>jpn-Skl 0.000 4.475 0.001 0.1 9.6 chn-mvh>jpn-mvh>jpn-obs>jpn-Skl 0.001 5.207 0.003 0.4 10.0 chn-mvh>jpn-mvh>jpn-osg>jpn-Skl 0.001 5.313 0.007 1.0 11.1 chn-mvh>jpn-mvh>jpn-crp>jpn-osg>jpn-Skl 0.000 5.597 0.001 0.1 11.2 chn-mvh>jpn-mvh>jpn-ele>jpn-osg>jpn-Skl 0.000 5.817 0.001 0.1 11.3 chn-mvh>jpn-mvh>jpn-gov>jpn-osg>jpn-Skl 0.000 5.916 0.003 0.4 11.7 chn-mvh>jpn-mvh>jpn-Usk>jpn-hhs>jpn-trd>jpn-Skl 0.000 12.720 0.005 0.8 12.5 chn-mvh>jpn-mvh>jpn-Usk>jpn-hhs>jpn-osg>jpn-Skl 0.000 13.105 0.001 0.2 12.8 chn-mvh>jpn-mvh>jpn-Cap>jpn-hhs>jpn-trd>jpn-Skl 0.000 12.720 0.005 0.8 13.5 chn-mvh>jpn-mvh>jpn-Cap>jpn-hhs>jpn-osg>jpn-Skl 0.000 13.105 0.001 0.2 13.7
18 December 2002 ADBI Institute Tokyo D. Roland-Holst
VII. Conclusions
Supply chain decomposition is changing the landscape of East Asian regional:
1. Capital allocation2. Production patterns3. Trade4. The development process
18 December 2002 ADBI Institute Tokyo D. Roland-Holst
Capital Allocation
FDI over the supply chain is driven by:Resource costs (the traditional explanation)Market access: double targetingProximate marketsRent seeking and other institutional imperfectionsPortfolio decisions
risk managementasset allocationsupply chain decomposition

18 December 2002 ADBI Institute Tokyo D. Roland-Holst
Production Patterns: Regional Hierarchy and FDI Competition
Regional hierarchies are being expanded according to the detailed characteristics of FDI.Countries are increasingly FDI-quality consciousThey are competing for FDI with complementary policies toward human capital and infrastructure

18 December 2002 ADBI Institute Tokyo D. Roland-Holst
Trade: Multilateralism in Bilateralism
Our results indicate that over one third of total value creation in bilateral ties actually arises from multilateral network linkages.This is due mainly to trade in intermediates.Intermediate trade is growing faster than final goods trade, and will ultimately dominate as it does in the EU.

18 December 2002 ADBI Institute Tokyo D. Roland-Holst
Development Process: Bamboo Capitalism
From the nodes in an ever expanding root system of intermediate supply, independent producers and even complete local markets emerge to join the dynamic of regional competition and innovation.Microeconomic replication of this kind is accelerating more balanced growth and overcoming exactly the specialization tendencies dictated by traditional comparative advantage.


