Download - Global M&A Financial Advisory Review
MERGERS & ACQUISITIONS REVIEWREUTERS / Carlo Allegri
MERGERS & ACQUISITIONS REVIEWFINANCIAL ADVISORS
First Quarter 2015

Any New Zealand Involvement Announced (AD39)
Any New Zealand Involvement Completed (AF46)
Japan M&A
Americas Deals Intelligence
M&A Financial Advisory ReviewFirst Quarter 2015 | Mergers & Acquisitions | Financial Advisors
1
Japan Deals Intelligence
Any European Involvement Announced (AD21) 17
17
18
18
Global M&A
Global Deals Intelligence
Scorecard: Worldwide Announced M&A
Scorecard: Worldwide Completed M&A
Top Fifteen Worldwide Announced Deals
Any German Involvement Announced (AD35)
Americas M&A Any Spanish Involvement Completed (AF41)
Any UK Involvement Announced (AD32)
Any UK Involvement Completed (AF39)
Any European Involvement Completed (AF3) 10
12
12
Any French Involvement Announced (AD33)
Worldwide Completed (AF1)
Top Ten Japanese Involvement Announced Deals
19
Any French Involvement Completed (AF40)
Any Japanese Involvement Completed (AF23)
19
Any Spanish Involvement Announced (AD34)3
3
6
6
11
12
11
Worldwide Announced (AD1)
20
10
18
Any Japanese Involvement Announced (AD19)
2
2
Table of Contents
1
20
2
11
Fairness Opinion Rankings
Worldwide Announced Fairness Opinion
11
Any Americas Involvement Announced (AD49) 7
US Target Completed (AF2)
6
US Target Announced (AD2) 7
Any Americas Involvement Completed (AF55)
13
12
Any Italian Involvement Announced (AD36)
Any Nordic Involvement Announced (AD37)
Any Italian Involvement Completed (AF43)
20
20
Top Ten US Announced Deals20
15
Mergers & Acquisitions Criteria Summary
Any EMEA Involvement Announced (AD47)
European Deals Intelligence
Any Benelux Involvement Announced (AD40)
8
8
7
Any German Involvement Completed (AF42)
16
Any Canadian Involvement Completed (AF49)
Any Australian Involvement Completed (AF31)
10
9
Any Canadian Involvement Announced (AD42)
16
Any Asia (ex-Japan) Involvement Completed (AF32)
Any EMEA Involvement Completed (AF53)
Any Benelux Involvement Completed (AF47)
10
Any US Involvement Completed (AF48)
Top Ten Any Asia (ex-Japan) Involvement Announced Deals 15
7
8
9EMEA M&A
Any US Involvement Announced (AD41)
Any Japanese Announced Fairness Opinion13
Asia Pacific (ex-Japan) M&A
Asia Pacific (ex-Japan) Deals Intelligence
20
21
21
22
21
20
13
13
Regional Contacts
Criteria Summary
Any EMEA Announced Fairness Opinion
14
Any Asia Pacific Announced Fairness Opinion
8
16
16Any Australian Involvement Announced (AD24)
9
Top Ten European Involvement Announced Deals
Thomson Reuters Soultions for the Deal the Deal Making Community
Any Asia (ex-Japan) Involvement Announced (AD25)
20
15
Worldwide Announced Fairness Opinion
Any Americas Announced Fairness Opinion
Any USAnnounced Fairness Opinion
14
Any Nordic Involvement Completed (AF44)
https://www.thomsonone.com
First Quarter 2015 FINANCIAL ADVISORS
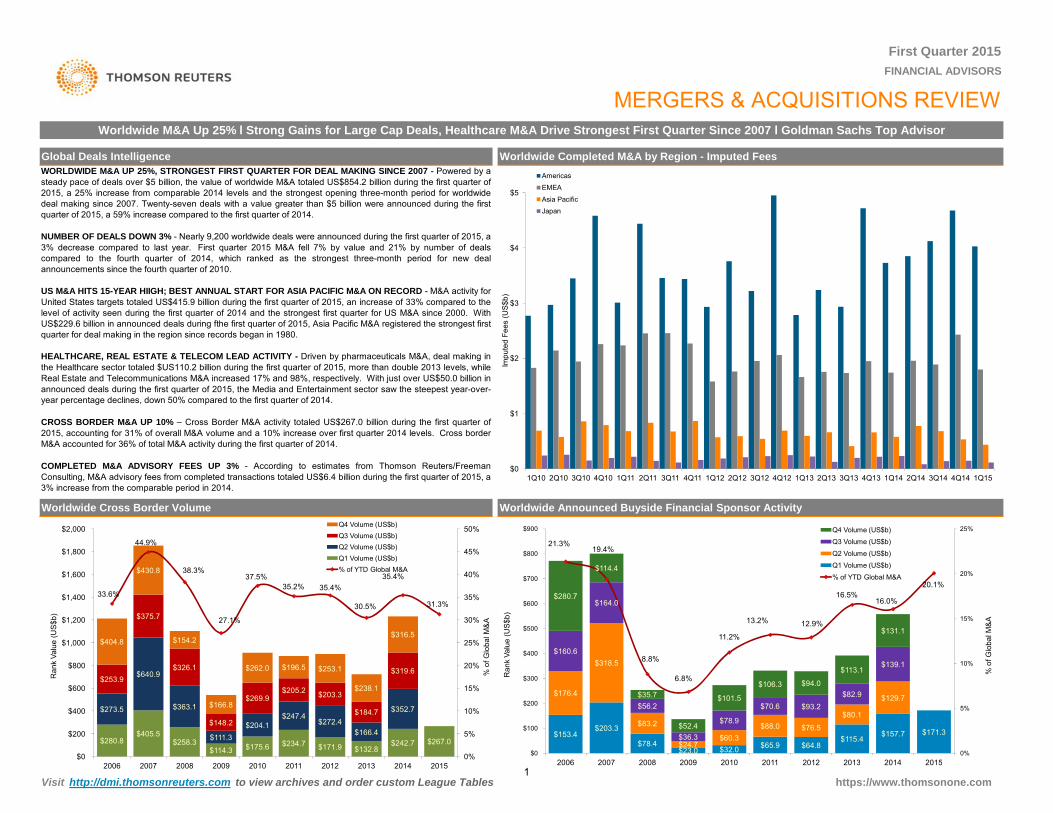
MERGERS & ACQUISITIONS REVIEWWorldwide M&A Up 25% l Strong Gains for Large Cap Deals, Healthcare M&A Drive Strongest First Quarter Since 2007 l Goldman Sachs Top Advisor
Global Deals Intelligence Worldwide Completed M&A by Region - Imputed Fees WORLDWIDE M&A UP 25%, STRONGEST FIRST QUARTER FOR DEAL MAKING SINCE 2007 - Powered by asteady pace of deals over $5 billion, the value of worldwide M&A totaled US$854.2 billion during the first quarter of2015, a 25% increase from comparable 2014 levels and the strongest opening three-month period for worldwidedeal making since 2007. Twenty-seven deals with a value greater than $5 billion were announced during the firstquarter of 2015, a 59% increase compared to the first quarter of 2014.
NUMBER OF DEALS DOWN 3% - Nearly 9,200 worldwide deals were announced during the first quarter of 2015, a 3% decrease compared to last year. First quarter 2015 M&A fell 7% by value and 21% by number of dealscompared to the fourth quarter of 2014, which ranked as the strongest three-month period for new dealannouncements since the fourth quarter of 2010.
US M&A HITS 15-YEAR HIIGH; BEST ANNUAL START FOR ASIA PACIFIC M&A ON RECORD - M&A activity forUnited States targets totaled US$415.9 billion during the first quarter of 2015, an increase of 33% compared to thelevel of activity seen during the first quarter of 2014 and the strongest first quarter for US M&A since 2000. WithUS$229.6 billion in announced deals during fthe first quarter of 2015, Asia Pacific M&A registered the strongest firstquarter for deal making in the region since records began in 1980.
HEALTHCARE, REAL ESTATE & TELECOM LEAD ACTIVITY - Driven by pharmaceuticals M&A, deal making inthe Healthcare sector totaled $US110.2 billion during the first quarter of 2015, more than double 2013 levels, whileReal Estate and Telecommunications M&A increased 17% and 98%, respectively. With just over US$50.0 billion in
$2
$3
$4
$5
Impu
ted
Fees
(US
$b)
Americas
EMEA
Asia PacificJapan
Worldwide Cross Border Volume Worldwide Announced Buyside Financial Sponsor Activity
Real Estate and Telecommunications M&A increased 17% and 98%, respectively. With just over US$50.0 billion inannounced deals during the first quarter of 2015, the Media and Entertainment sector saw the steepest year-over-year percentage declines, down 50% compared to the first quarter of 2014.
CROSS BORDER M&A UP 10% – Cross Border M&A activity totaled US$267.0 billion during the first quarter of2015, accounting for 31% of overall M&A volume and a 10% increase over first quarter 2014 levels. Cross borderM&A accounted for 36% of total M&A activity during the first quarter of 2014.
COMPLETED M&A ADVISORY FEES UP 3% - According to estimates from Thomson Reuters/FreemanConsulting, M&A advisory fees from completed transactions totaled US$6.4 billion during the first quarter of 2015, a3% increase from the comparable period in 2014.
$153.4$203.3
$78.4$23.0 $32.0 $65.9 $64.8
$115.4$157.7 $171.3
$176.4
$318.5
$83.2
$24.7$60.3
$88.0 $76.5
$80.1
$129.7
$160.6
$164.0
$56.2
$36.3
$78.9
$70.6 $93.2$82.9
$139.1
$280.7
$114.4
$35.7
$52.4
$101.5
$106.3 $94.0
$113.1
$131.1
21.3%19.4%
8.8%
6.8%
11.2%
13.2% 12.9%
16.5%16.0%
20.1%
0%
5%
10%
15%
20%
25%
$0
$100
$200
$300
$400
$500
$600
$700
$800
$900
2006 2007 2008 2009 2010 2011 2012 2013 2014 2015
% o
f Glo
bal M
&A
Ran
k Va
lue
(US
$b)
Q4 Volume (US$b)
Q3 Volume (US$b)
Q2 Volume (US$b)
Q1 Volume (US$b)
% of YTD Global M&A
$0
$1
1Q10 2Q10 3Q10 4Q10 1Q11 2Q11 3Q11 4Q11 1Q12 2Q12 3Q12 4Q12 1Q13 2Q13 3Q13 4Q13 1Q14 2Q14 3Q14 4Q14 1Q15
$280.8$405.5
$258.3$114.3 $175.6 $234.7 $171.9 $132.8
$242.7 $267.0
$273.5
$640.9
$363.1
$111.3$204.1
$247.4$272.4
$166.4
$352.7
$253.9
$375.7
$326.1
$148.2
$269.9$205.2 $203.3
$184.7
$319.6
$404.8
$430.8
$154.2
$166.8
$262.0 $196.5 $253.1
$238.1
$316.5
33.6%
44.9%
38.3%
27.1%
37.5%35.2% 35.4%
30.5%
35.4%
31.3%
0%
5%
10%
15%
20%
25%
30%
35%
40%
45%
50%
$0
$200
$400
$600
$800
$1,000
$1,200
$1,400
$1,600
$1,800
$2,000
% o
f Glo
bal M
&A
Ran
k Va
lue
(US
$b)
Q4 Volume (US$b)Q3 Volume (US$b)Q2 Volume (US$b)Q1 Volume (US$b)% of YTD Global M&A
Visit http://dmi.thomsonreuters.com to view archives and order custom League Tables https://www.thomsonone.com
2006 2007 2008 2009 2010 2011 2012 2013 2014 20152006 2007 2008 2009 2010 2011 2012 2013 2014 2015 1

Western Europe
128.03,385.9
132.5 ▲
▲▲
459▲
Worldwide Announced M&A Target Industry by ValueScorecard: Worldwide Announced M&A
317
1/1/2014 - 3/31/2014
358,751.0 ▼▼
▼▲
% Change in Rank Value
▲▲
▼
32.2-8.3
-54.2
1,455.1
-72.9
▲
-4.9
▼
▼▲
7,501.417818,039.4
-47.6
23.3-75.9
95
United States 333,937.0
2,414.6
▼2,085
▼
982.2▲▲
23
24,814.0
No. Deals
5,292.55,551.6
5,292.5 4,002.0
317,556.6
85
259
666,771.4
Rank Val US$m
% Change in Rank Value
South America
2,061
165
154.824
Target Region/Nation
North America165.6 Mexico
328,916.936
29.0 2,320▲
2,402
344,642.1▲
29Central America▲
2,528▲
Americas
4,059.0357.02,675.1
684,197.8
Rank Val US$m
273,1479,402
No. Deals
14-9.6
30.44218
11.82,640
-61.6
7,2026,724
Caribbean190.9
▲
33.1
24.624.9
381,206.4
▲
28
2,8552,449
▼-30.0-81.7
▼
▲
210406
581.8107
-53.5 Canada 11,360.3▼4,881.0
Brazil 3,932.4▼
3,276.8
9,054.7272
Chile80.0 ▲ 15,565.2
145.5Africa/Middle East
3,284.9▼
Sub-Saharan AfricaNorth Africa
175.6
80 8,901.7
68▲ 71178
210,210.5 105.37,437.3
24
298.8
12,619.4
20
184
3,233.7 1892
1,614.5
584
-63.2
73 581 5
▲-51.0
▲
2,060
102,385.7
22.0
2,525▼
35
321
2,735
21,063.019,384.4
46587,210.0 2,151
1 245
40
18 4
15,175.6
1 211Asia Pacific 87 125 7307
Eastern Europe
56,280.1483
18.3
23,651.048,019.3United Kingdom▼
202,773.2
▲Germany
515
▲-51.1
▲
▲Republic of Irelan155.8
▲580
96.8Europe
▲
▲
94
0.5
-54.2
713
30
139
Eastern Europe
497
3,173
24,395.843,955.4
20,652.7
2,4602,39810,783.9
Middle East
1.62,978134
1,767.2241.1
2,920.1
63 8
6,133.4103
Europe
24
Africa/Middle East
526.5132
270
175,523.9
262.3125 436 4 2 215
5,700.4
22
423,210.9
9,737.5
2,385
Americas7,782.6
2 341
36
2,718
Central America
South America
415,855.3
214114
21,473.8
North Africa
Canada
Western Europe12,760.7
178,356.9
11,042.7
8,190.6
North America
165,596.2
France
Chile 705.2
Asia Pacific
United Kingdom
Middle East
5,746.5Sub-Saharan Africa
142567
Italy
No. Deals
Rank Val US$m
596,237.3
Caribbean
6,136.4
Brazil
7,355.6
Worldwide 9,165854,238.3446,904.3
2,423.0
358,639.0
Rank Val US$m
15,821.0United States
559
Target Region/Nation
Mexico
164,740.062,400.9
33
4,337.8
3,857.6
312,346.0
25,373.9
Worldwide2,990
No. Deals
1/1/2015 - 3/31/2015 1/1/2014 - 3/31/2014
446,173.4
2,310.52455
328,166.9
11,697.7
205 454 5
1/1/2015 - 3/31/2015
333
Jan 1 - Mar 31 Scorecard: Worldwide Completed M&A Jan 1 - Mar 31
First Quarter 2015 | Mergers & Acquisitions | Financial Advisors
Mergers & Acquisitions
12.9%
11.1%
10.6%
9.3%
9.1%9.0%
8.6%
7.7%
7.6%
5.9%
4.5%3.5%
South East Asia
Healthcare / Pharmaceuticals
Healthcare / Pharmaceuticals
Real Estate / REITs
Materials / Paper & Forest ProductsMedia and Entertainment / Cable
Telecommunications / Telecommunications Services
Consumer Staples / Food and BeverageTelecommunications / Telecommunications Services
Real Estate / REITs
Telecommunications / Wireless
8,613.08,209.5
2/5/20152/3/2015
PendingPending
Rexam PLC (100%) United Kingdom / United KingdomAustralia / Australia
412.3New Zealand
Novion Property Group (100%)
Target Macro / Mid Industry
▲▼▼
▲▲
-40.2
▲▼
Healthcare / Healthcare Providers & Services (HMOs)
Materials / Containers & Packaging
Healthcare / Pharmaceuticals
High Technology / Semiconductors
Energy and Power / Oil & Gas
Jan 1 - Mar 31 2015
Energy Transfer Partners LP
Pending
1/26/2015
2/5/2015United States / United States
HJ Heinz CoAcquiror / Target Nation
Hospira Inc (100%)United States / United States
▲
▲
-62.2208238
73,581.521,470.0
22.6
311,696.9 224
3,354.0
52
-57.8
31.2
1,245 18.4
17,888.1
1,211
▼108.321,743.3
6,760.9
192
651,567.6
355
116.350.5
61
7,516.8ChinaSouth Korea
636
8,286.2
55,768.5 635
Singapore3,390.1
26,444.46
37,057.0
-14.4107.3
282
Acquiror
Australia
147
▲
-32.4
▲57.485.5 ▲
-65.1
Asia-Pacific 87,125.7186▲16,333.6
45,410.8
Central Asia9,227.9
7
Rank Value (US$m)
▲9,049.7
23132,004.5
1626,753.0
▲Australasia
South East Asia
30.663.8
725.6
125,436.4 2,215
260
87.3
-16.1
304
45,300.6
0.012,480.0Japan
14
▲
North AsiaChina 90,857.4
165,847.7
61,974.4
Top Fifteen Worldwide Announced Deals
134.0Japan
177
-100.0
1,359.1
595
3,153.6
89,407.3
717.3
1,310
10,805.5
431,485
11
14,280.6
16,541.9
45.4
90364
10,709.1
-62.726
3,357.6
▲
8,783.0374
75
38
43 Malaysia
▼ Papua New Guin▼▼
South Asia 6,958.8
-17.0
▲
North Asia
37085
15,348.7
▼
Australasia
844117
57,714.3
232
1,105.9
1,024
222
142
▼
Regency Energy Partners LP (100%)Pending
4,391.4South AsiaCentral Asia -22.0
▼
Salix Pharmaceuticals Ltd (100%)
Ball UK Acquisition Ltd
54,716.5Cheung Kong(Holdings)Ltd
398
United States / United States
Freescale Semiconductor Ltd (100%)
United States / United States
United States / United States
▼159
Catamaran Corp (100%)
18,465.1
1/23/2015
Hutchison Whampoa Ltd (50%)21,328.319,917.0
United States / United States
AbbVie IncPharmacyclics Inc (100%)
13,242.2
NXP Semiconductors NV
18,222.9
Valeant Pharmaceuticals Intl
Hong Kong / Hong KongKraft Foods Group Inc (100%)
United States / United StatesO2 PLC (100%)
Rock-Tenn Co (100%)
16,098.3United States / United States
Macerich Co (100%)
15,858.3
16,770.8Pfizer Inc
Hutchison Whampoa Ltd
Charter Communications IncUnited States / United States
10,790.3
Federation Centres Ltd
Frontier Communications CorpPending
MeadWestvaco Corp
Verizon Commun Inc-Wireline (100%)Pending3/31/2015
15,381.2
Bright House Networks LLC (100%)11,086.61/26/2015
United States / United StatesUnitedHealth Group Inc3/30/2015Pending Hong Kong / United Kingdom
3/2/2015Pending
Pending
2/22/2015
Pending
1/9/2015
3/4/2015Pending
3/9/2015
2/5/2015
Pending
39.3237
Target (% Sought/Acquired)
473.5
Thailand
2,34121,339.5
8,887.9
Asia-Pacific
Pending
Australia
Hong Kong
586
20,762.3
13,875.8
3/25/2015Rank Date Date Effective
Singapore
254
919.6
Simon Property Group Inc
205,454.5
Pending
10,500.0United States / United States
Pending
Healthcare Real Estate
Telecommunications Financials
Industrials High Technology
Consumer Staples Energy and Power
Materials Media and Entertainment
Consumer Products and Services Retail
Government and Agencies
https://www.thomsonone.com Visit http://dmi.thomsonreuters.com to view archives and order custom League Tables2

Credit Suisse
2345
8.5
2.9
4.1
0.36.6 0.4
2.2
# of
Worldwide Completed (AF1)
MarketImputed Fees (US$m)
3.5
Market
812.5 ▲Share Ch.Sh (%)
12.8
-110.747 327.5
Change in
1.2# of Deals
Market Advisor
▼
+3-6
+40
▼
+4
0.5
37
0.5
-9
59,905.2289+11 Lazard
▲
Rothschild
8
11-4
0.1
15
0.3
0.40.4
4937
0.212
41,033.310
▼0.4 13
Credit Suisse
-19 Evercore Partners
▼12
5 0.1▼0.7
+3
10
▲
63
16 0.2+4
-13.9
42
3.5
-0.5
Morgan Stanley
Market
Jan 1 - Mar 31
Worldwide Rankings
2014 RankFinancial Advisor Deals
4 ▲Sh ($)
200,794.8 -6.1 0.7
2015 Rank
Rank Value per Advisor (US$m)
Goldman Sachs & Co# of Deals
-3
Jan 1 - Mar 31
1.0Financial Advisor
58-12.1
1
Change in
11.0
19.2
7 8
12
-2.1
6 141,953.9
Rank Value
▼60
# of
21.4
67▼
▼
▼
Deutsche BankCenterview Partners LLC
Bank of America Merrill Lynch
6
3
Lazard45 139,277.6
72,212.48.5
11.5
140Guggenheim Securities LLC 31,812.9
6.3
▼
19
▲10
-6.0
▼
5.339,427.5
30
Greenhill & Co, LLC
Macquarie Group
21
18
US$m
1.8
+172
40
6.8
0.8
0.60.7
53,682.4
1.8
54
95
-2.0
24.2 1
-716.3 14.845
▲▼ Morgan Stanley 4
1116.6
US$m DealsShare Ch.Sh (%)
# of Deals per Advisor
▲271,453.1Sh (%)
▼
MarketMarket Rank Value MarketShare Ch.
2 340.7 -33
-5.8202,740.1▼ ▲
0.130.4
Fees78
1.5 ▲13.6
5.1 ▼
Sh (%)
# of Deals per Advisor
First Quarter 2015 | Mergers & Acquisitions | Financial Advisors
2015 Rank
Rank Value per Advisor (US$m)
258.3419.7
56 +14
▼
▲
▼
0.80.9
-11
417.6 ▲1.0
2 161,706.2 ▼
-19.6▲
24.33
64,658.4▲-
7Deutsche Bank
142,803.3
0.6-20.2
9.7Barclays 11.756
9187.40.6
0.5▼
3842
3.00.1 -6
▼▼
1.3
-4 0.878,033.86.6▼ -398,947.4 70
▼1.6▼
8.7 45▲ Perella Weinberg Partners LP ▼▲ 5
57,683.3▲ 0.7
▲0.99.0
▲
▲7.9
-3
▼▼ 1.2▲
189.780.0 0.6
162.41.3
1.8▼
-17 2.6142.340 -14
▼102.6-6+8 143.9
8.14.4
-0.4▲
0.655
▼ ▼
34,076.424 6.2
1.6▼
2.31.60.45.1
▼
0.829
▲▲
260.4
0.3 ▼
0.80.5
-60.2
▲
53.40.9
-90 ▲
0.3 ▼
0.8 ▼13▲
-22.9
15-
1.20.2
21
4.630,802.755.6
102.40.4 ▼4.0
24,142.3 3.640
-Zaoui & Co
626,353.0 3.314
13
▲ 15
UBS
RBC Capital MarketsWells Fargo & Co
+7 ▲1.317
23,101.6-0.1
Centerview Partners LLC
▼
▲ 2.5 41418- BNP Paribas SA
16
2.516,659.5
3.5
▼
+3▼
▼▼
▲ 0.2
40.8
3▲ 0.1
12.5-3 0.8
▲0.21.3
0.0
▼1.1
79.6 ▲0.6 0.4
70.9-80.2
▼0.533
27 16,692.8
2.419
Houlihan Lokey
21
19 15,638.5▼▼
18▼20
-14▲1.7
2 217 ▼0.637.215,337.6 -1.02.3 ▼0.3 Nomura
▲ Ernst & Young LLP ▼1 0+3 14 829 4 10 7 0 2 0 061 ▼210 9
0.1-100.322 0.4
2.40.13.6
279
▲▲
1 2-225
29,581.5 00.1 -60.3
39 0 4
▲
▲▲3.1
Market
3.5
1.4
▲
2.6
-1.5
-2
6-0.4
2014 Rank
JP Morgan12
45
98,508.6
207,104.2
15 53,382.713
CitiJP Morgan+4
102,257.9 12.09
Bank of America Merrill LynchGoldman Sachs & Co
▼164,125.3
▼-13.1
▲▲
▲23.5
-14.5
7.5
Worldwide Announced (AD1)
▲6.2
▼
9.59.2
2
93,719.2
Citi
Somerley64,398.5
78,699.713
3109
72,662.0
HSBC Holdings PLC 8
25
12
15
7
Nomura
59
1
UBS37
511
19
17
Anglo Chinese Corp FinanceRothschild
Barclays
16399*
▼
6.60.4
7014
56,660.6
5.3 ▲45,486.4
3 126 145 2
3.74.6
3.126,439.126,357.9
Blackstone Group LPMoelis & Co 20
†Note: Industry Totals include multiple competing bids for the same target.
* tie
11
▼
2.024
46.367.0
21
33.3
-20.8%-2.5%
0.1
12
LazardRothschild
8
12
Industry % Change from Last Quarter -17.7%
5
15.4
1,029
10 24.319.1
12
3
165
3658
3 31.12
12,023.9 3Citi
19,395.7
1
42100.0
23 23109
854,238.3
61,567.1
29,537.7
Industry % Change from Same Period Last Year
36,673.9
Telecommunications
Morgan Stanley
Industry % Change from Last Quarter
45,410.8
25,078.3
94,975.7Real Estate
FinancialsSomerley
73,789.0
Industrials
13,192.4
36.2
112
9 17,319.3
Rank Val US$m
215,274.6
1,251 22.216.92
8
31.4
77,965.0
1Bank of America Merrill LynchJP Morgan
3
JP Morgan
21
24
-7.1%
RBC Capital Markets
21 18 2.2▲1.7
▲ Ernst & Young LLP ▼-1.0+32.255
7522 14,317.4
14,829.4 -10.7 0.231.3
0.00.5
+4 ▲
61
0.2+2
▼-21▲
0.9
36.5140.18 0.3
100.0
0.60.6
0.4▼▼
0.30.9
▲▲
27
-6.6%
6,724
2.8%
6,366.2▼
-4780.40.4
▲
-7 1.5+4
95.4
▼
▲ 36.91.6 -1.9 ▼
1.21.7 ▲
1.9 ▲▼
Jefferies LLC12,591.913,190.3
4410,918.716
-237
+7 Stifel/KBW
▼
Top Worldwide Announced M&A Advisors by Transaction Size (AD1)
-20.0%▼
0.4 +7
No. Deals
▲▼-13.5%
Greenhill & Co, LLC
▲▲
Industry % Change from Same Period Last Year
HSBC Holdings PLC
Industry Total
HealthcareRank
232425
110,153.8
▼
▲100.0666,771.4
50,998.1
▼
9,165
ShareMkt.
▲
Jan 1 - Mar 31
0.3
11.8%
▲
▲0.61.8
1.2
5
609
12
Top WW Announced M&A Advisors by Target Industry
24.9%
35
-0.1 ▼0.5
39 0.4▲▼
-2-1.4
2.4+8
2847
252022
Nomura 3.126,145.2
1.8
20,052.822,830.2Mizuho Financial Group 2.7
16,087.6Jefferies LLC 15,177.1
1.9
34,334.2
53,113.9
Goldman Sachs & Co
Industry Total†25
CITIC
79,824.2
Bank of America Merrill Lynch
58.8Goldman Sachs & Co68.2
Centerview Partners LLC
390,314.1
4 1
1 50.33*2
UBS
HSBC Holdings PLC
Morgan Stanley32,714.0 34.4
Jan 1 - Mar 31 2015
109.88 84.96 76.77 79.47
46.20
11.77
52.71
17.07 44.32 37.45
53.99
30.5 56.4
46.1 41.2
38.4
15.9
24.5
31.2
34.4 35.2
45.4
45.4
21.3
21.3
21.3 21.3
21.3
19.9
19.9
18.2
18.2
54.7
54.7
$0
$50
$100
$150
$200
$250
Goldman Sachs & Co
JP Morgan Morgan Stanley
Bank of America
Merrill Lynch
Lazard Centerview Partners LLC
Deutsche Bank
HSBC Holdings PLC
UBS Credit Suisse Citi
Ran
k Va
lue
(US
$bil)
Kraft Foods Group/HJ Heinz Co
Regency Energy Partners/Energy Transfer
Pharmacyclics Inc/AbbVie Inc
Macerich Co/Simon Property Group
Hutchison Whampoa/Cheung Kong
Other Top 15 Deals
All Other Transactions
Visit http://dmi.thomsonreuters.com to view archives and order custom League Tables https://www.thomsonone.com 3
12.5x
Consumer Staples
Consumer Products and Services
10.1x
10.9x
Energy and Power
13.3x
11.9x
Healthcare
11.2x
High Technology
11.0x
Materials
12.0x
11.8x
13.6x 10.0x16.5x
11.3x -
12.6x19.8x11.3x11.3x
9.1x 15.2x 11.8x
28.7x18.9x
15.2x
13.1x
6.1x
9.3x
-
13.4x 10.9x
10.3x
14.8x
11.3x
8.4x
13.0x
10.6x9.5x
16.0x10.8x
19.6x
10.9x
19.0x
9.5x
14.0x
13.6x
12.7x 6.6x
10.6x8.3x
8.4x
14.4x
12.0x
11.8x 6.3x
9.0x18.6x 9.0x
19.8x
8.8x15.8x
13.7x 8.8x
14.7x
11.8x
6.9x 12.1x
13.6x14.4x
12.1x9.0x
11.5x10.3x
22.4x-
6.9x14.4x
6.9x
13.5x 14.3x7.7x
12.4x16.6x 23.8x
--11.7x3.1x 10.3x
8.2x21.1x
11.0x
9.5x
5.7x 14.0x19.0x
14.0x
13.5x 9.9x
12.7x
8.9x
14.0x
13.1x
8.8x
11.6x
12.0x8.9x
14.6x10.4x 12.0x
8.9x
7.9x11.9x
9.5x6.9x 6.9x
9.8x
13.4x13.4x 12.9x
15.2x 11.4x
13.8x13.8x11.9x
9.2x
17.3x
4.6x
17.3x
14.3x19.4x6.7x
11.8x11.4x7.1x
-12.0x10.8x
24.6x 27.1x 9.3x19.4x 14.3x
-12.6x
20.0x
6.0x 14.2x-5.5x
-
10.2x
16.8x
13.8x
10.3x
15.6x
UK
15.6x
6.3x
6.6x24.3x
7.7x 12.6x
12.0x 8.2x
17.7x
Industrials
12.8x
World
10.7x13.0x
11.1x
17.6x -
-
8.9x
6.7x
14.6x
--
-
8.3x4.1x
8.4x
11.8x
Telecommunications
Real Estate
Media and Entertainment
Retail
11.4x
12.8x12.5x26.6x
14.3x
USA
10.1x11.9x
17.1x
11.5x
22.4x
Japan
15.9x
Asia ex. JapanEurope
10.8x
13.8x
10.2x
-
10.9x
9.5x
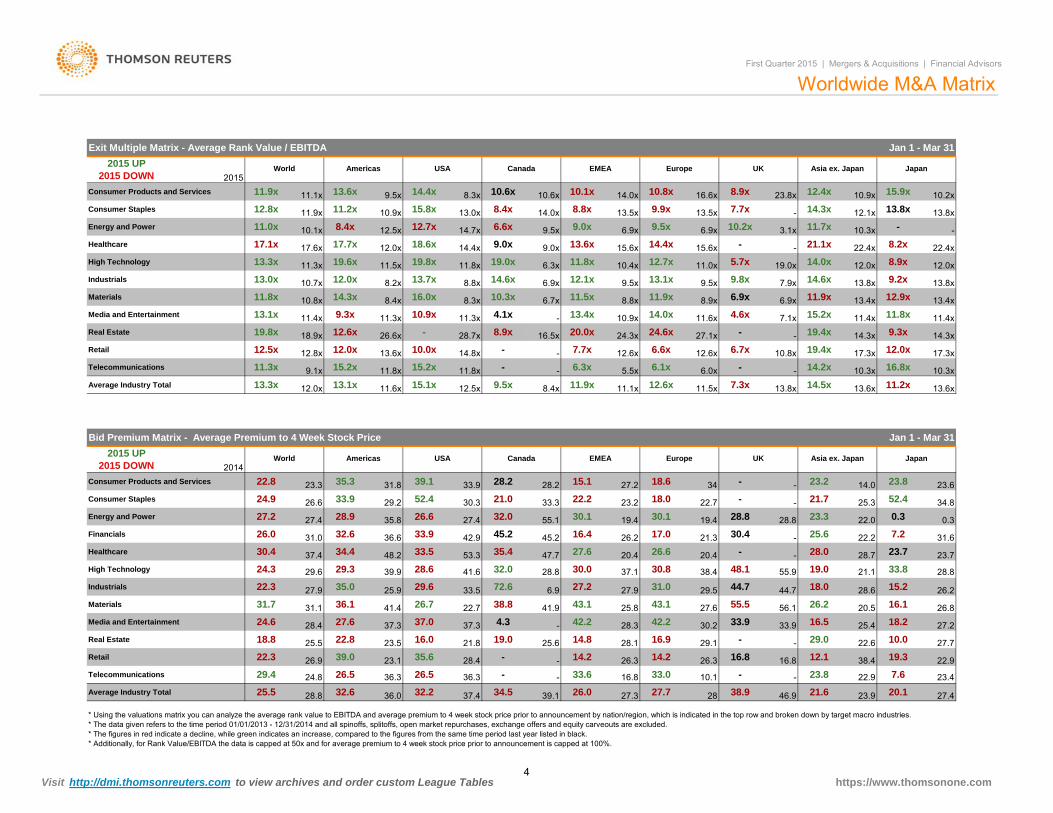
Exit Multiple Matrix - Average Rank Value / EBITDA
Canada EMEAAmericas
Worldwide M&A MatrixFirst Quarter 2015 | Mergers & Acquisitions | Financial Advisors
2015 UP 2015 DOWN 2015
Jan 1 - Mar 31
Real Estate
15.1x
2014
52.4 -
UK
28.2
12.0x 13.6x14.5x 13.6x
23.6
13.8x
33.855.9
18.027.2 23.2
27.7
21.1
27.2
28.8
26.216.1 26.8
25.4
15.2
20.5
26.5 33.6
28.6
41.9
28.4
42.2
14.8
28.6
6.9
32.0
72.6
4.3
41.6 28.8
32.236.3
-
-
33.5
36.0
25.6
37.4
- -
-
36.3
19.0
34.5
35.6
18.0
26.039.1
14.2
44.729.5
17.0
19.0
56.1
30.122.7
Europe
11.5x
43.1
27.6
30.216.9
27.2
29.1
31.0
42.227.6
38.430.0
-
-
19.4
-20.4
30.421.3
28.8
48.1
28.8
44.7
-22.2
45.2
47.7
30.123.2
26.6
18.6
11.1x
21.7
Asia ex. Japan
7.3x
23.3
34
12.6x
14.0-
34.8
-
0.3
52.4
Japan
25.3
28.0 23.7
22.0
23.7
7.2
0.3
28.7
31.622.225.6
11.2x
23.8
13.3x
26.6
Average Industry Total
53.3
16.455.127.4
35.445.2
32.0
11.9x
33.3
33.9
26.6
21.0
USA
8.4x12.5x 9.5x13.1x
35.8
Americas
28.239.1
EMEA
34.4
28.9
35.3
33.5
32.6
33.9
42.9
30.324.9
Healthcare
Consumer Products and Services
48.2
23.3
29.227.2
Financials
Energy and Power
31.0
Average Industry Total
30.4
25.5
High Technology
Industrials
24.8
22.3
37.4
28.8
24.3
32.6
Media and Entertainment
31.1
Telecommunications 29.4
Materials
24.6
39.0
25.5
36.127.922.329.6
26.5
18.8
26.9
22.8
35.0
22.9
21.8
37.0
Retail
31.7
29.3
18.241.4 25.8
27.6
25.9
39.9
29.0
2015 UP 2015 DOWN
22.8
11.6x
37.3-
26.7
29.6
38.8
23.5
28.4
38.4
38.927.3 21.6
-19.312.1
7.6
27.4
16.5
16.8 33.0 - -
16.826.3
28.3
26.2
23.1
26.2
19.4
43.127.9
37.3 33.9
28.1
27.710.1 23.8 22.9
10.022.6
28
23.4
23.946.9 20.1
22.7 55.5
26.3 14.2 16.8
33.9
30.820.4
37.1
33.9
16.0
15.1
Canada
26.027.4
36.6
World
31.8Consumer Staples
* Using the valuations matrix you can analyze the average rank value to EBITDA and average premium to 4 week stock price prior to announcement by nation/region, which is indicated in the top row and broken down by target macro industries. * The data given refers to the time period 01/01/2013 - 12/31/2014 and all spinoffs, splitoffs, open market repurchases, exchange offers and equity carveouts are excluded. * The figures in red indicate a decline, while green indicates an increase, compared to the figures from the same time period last year listed in black. * Additionally, for Rank Value/EBITDA the data is capped at 50x and for average premium to 4 week stock price prior to announcement is capped at 100%.
Bid Premium Matrix - Average Premium to 4 Week Stock Price Jan 1 - Mar 31
https://www.thomsonone.com Visit http://dmi.thomsonreuters.com to view archives and order custom League Tables4

First Quarter 2015 | Mergers & Acquisitions | Financial Advisors
Worldwide Announced Rankings* - A Decade in Review
1
2
3
4
1
2
3
4
Goldman Sachs & Co
JP Morgan
Morgan Stanley
Bank of America Merrill Lynch
* League Table positions reflect consolidation within the banking sector. Rankings shown are as of the current quarter end in each calendar year
5
6
7
8
9
102006 2007 2008 2009 2010 2011 2012 2013 2014 2015
5
6
7
8
9
10
Ran
k
Lazard
Centerview Partners LLC
Deutsche Bank
HSBC Holdings PLC
UBS
Credit Suisse
https://www.thomsonone.com Visit http://dmi.thomsonreuters.com to view archives and order custom League Tables5

Energy and PowerCiti 22,889.2 1
JP Morgan 18,836.9 3
US Announced Advisors by Target Industry Jan 1 - Mar 31 2015Americas Deals Intelligence
Healthcare
Consumer Staples
Real Estate
High Technology
JP Morgan
Credit SuisseQatalyst Partners
Rank Val (US$m)
90,651.9 73,574.050,980.0Morgan Stanley
Centerview Partners LLC
Morgan StanleyDeutsche Bank
Centerview Partners LLCLazardBank of America Merrill Lynch
Goldman Sachs & Co
36,673.961,006.9 54,716.554,716.51,801.3
43,608.4 29,532.629,020.6
35,091.8 21,328.3
12
1*
Rank
123
Mkt.
224
No. Deals
56.23 4
1
194 3.03
1*
5
144
47.52
1
43.4
447 4
Share
81.2
48.93*66.6
40.5
39,932.3 18,969.717,348.37,862.3
23
1Morgan Stanley
11
98 89.7
2
5
Americas M&AFirst Quarter 2015 | Mergers & Acquisitions | Financial Advisors
Americas M&A Increase 28% From First Quarter 2014 | Healthcare Volume Drives US Activity | Canadian Activity Rises 19%
1 89.7
Americas M&A volume increased 27.9% over totals reached during the first quarter of 2014, accruing US$516.6 billion inactivity from 3,650 announced deals. Estimated fees generated from completed deals in the Americas totaled US$4.8billion, a 6.6% increase from fees earned in the first quarter of 2014.
US Targeted M&A also posted significant gains, rising 33.1% over announced M&A in the first quarter of 2014. US-targeted volume accrued a total of US$415.9 billion during the first quarter of 2015, driven by 2,385 deals.
The Healthcare sector led the US market, with deal volume totaling US$90.7 billion, accounting for a 21.8% market share.Consumer Staples followed, accruing US$61 billion for a 14.7% share of the market. Real Estate rounded out the top 3sectors, with US$43.6 billion and a 10.5% share of the market.
Accumulating US$40.6 billion in transaction value, announced Canadian Involvement activity rose by 18.7% over the totals reached during the first quarter of 2014. Completed Canadian Involvement activity was down 16.6% compared to thesame period last year, accruing US$29.7 billion from 388 deals.
US targets enjoyed the highest average exit multiples in the first quarter of 2015 (15.1x), followed by the Asia ex. Japan(14.5x). All industries, except Healthcare and Retail, saw modest increases in average multiples compared to the firstquarter of 2014, with the biggest increases coming in Industrials, which rose to 13.0x from 10.7x in the first quarter of lastyear.
67.7
5 19.7
3 5 53.7
65.2 2 Barclays 19,542.9 2 55.7
US Target Announced M&A Target Industry by Value (US$ bil) Jan 1 – Mar 31 2015
Acquiror / Target NationTop Ten US-Target Announced Deals
Target Macro / Mid IndustryJan 1 – Mar 31 2015
Pending19,917.0United States / United States
Target (% Sought/Acquired) Acquiror Rank Value (US$m)
Pending54,716.5
1/26/2015
PendingRegency Energy Partners LP (100%)
2/22/2015
Hospira Inc (100%)
UnitedHealth Group Inc
Simon Property Group Inc
Date Effective
3/4/2015 Pharmacyclics Inc (100%)
Pending Kraft Foods Group Inc (100%)3/25/2015Rank Date
3/9/2015 Macerich Co (100%)
2/5/2015
Salix Pharmaceuticals Ltd (100%)
Pending Rock-Tenn Co (100%)
1/26/2015Pending
Pending
Pfizer Inc
AbbVie IncUnited States / United States
United States / United StatesEnergy Transfer Partners LPUnited States / United States
16,098.316,770.8
United States / United States
21,328.3
13,242.2United States / United States11,086.6
United States / United StatesValeant Pharmaceuticals Intl 15,858.3
MeadWestvaco Corp
Pending
Catamaran Corp (100%)
US Buyside Financial Sponsor Activity
Charter Communications Inc
3/30/2015
10,790.3
Pending
United States / United States
3/31/2015 Pending Bright House Networks LLC (100%) United States / United States
3/2/2015
HJ Heinz Co
NXP Semiconductors NVFreescale Semiconductor Ltd (100%)
Consumer Staples / Food and BeverageReal Estate / REITs
High Technology / SemiconductorsUnited States / United States
18,222.9Healthcare / PharmaceuticalsEnergy and Power / Oil & GasHealthcare / Pharmaceuticals
Media and Entertainment / Cable
Healthcare / PharmaceuticalsHealthcare / Healthcare Providers & Services (HMOs)
Materials / Paper & Forest Products
21.8%
14.7%
10.5%9.6%
8.4%
6.8%
5.9%
5.3%
5.2%
Healthcare Consumer Staples Real Estate High Technology
Energy and Power Materials Media and Entertainment Financials
Consumer Products and Services Telecommunications Industrials Retail
Government and Agencies
60.6 112.7
17.5 28.4 76.0 87.1
124.4
110.1
192.4
28.9 34.2 33.9 34.4
33.1 57.3
86.1
91.3
18.5
13.6
28.2 26.7
53.5
43.9
54.0
170.8
27.4
5.0 39.4
64.3 56.0
60.6
48.3
55.5%53.0%
27.6%
39.5% 41.4%45.9%
52.5% 54.6% 44.2%
72.6%
0.0%
10.0%
20.0%
30.0%
40.0%
50.0%
60.0%
70.0%
80.0%
-
50.0
100.0
150.0
200.0
250.0
300.0
350.0
400.0
450.0
2006 2007 2008 2009 2010 2011 2012 2013 2014 2015
Rnk
Val
US$
bil
Q4 Volume (US$b)Q3 Volume (US$b)Q2 Volume (US$b)Q1 Volume (US$b)% of WW FS Volume YTD
https://www.thomsonone.com Visit http://dmi.thomsonreuters.com to view archives and order custom League Tables 6

Credit Suisse Lazard
# of Deals per Advisor
First Quarter 2015 | Mergers & Acquisitions | Financial Advisors
MarketMarket Change in Deals
Any Americas Involvement Completed (AF55)
Market# of Deals per Advisor Rank Value per Advisor (US$m)
MarketImputed Fees (US$m)
Americas Rankings
Rank Value per Advisor (US$m)2014 Rank
# ofShare Ch.
▲4.8Sh (%)
AdvisorRank ValueFinancial Advisor Sh (%) Share Ch. DealsUS$m
140,068.7 ▼31.9
Rank Value Market2015 Rank
Market
Jan 1 – Mar 31Any Americas Involvement Announced (AD49) Jan 1 – Mar 31
58
# ofFinancial Advisor
Market
+12Sh (%)Sh (%) # of Deals Fees
721.7 15.0Share Ch.
1.9 ▼
MarketSh (%)US$m
-141 ▲48.9 0.5# of Deals
2015 Rank
2014 Rank
Change in
27.1 -12.1Goldman Sachs & Co▲49 1.3JP Morgan 1 164,742.0 -1.3
1▼2
Morgan Stanley1 225,036.0
3 7 129,118.321.22 -2 ▼ ▼279.3 0.8▼ 35
379.95.8▼
1.6▼ 4938.9 -6.7
JP Morgan 140,813.3Bank of America Merrill Lynch
24-921.1
1.23.9
0.8▲
Citi30.6
-1243-3 ▼
368 1.9 -15.13
178,653.9
Lazard 4 13 108,998.4Goldman Sachs & Co
▲1.4-3
22.6 14.2▲▼ 7.9
▲5 5 102,257.9
0.5
19.8 -3.1
25.0
▼▲ 29 ▼ 914.8
- Morgan Stanley 54.41.3 +13 ▲ 212.5103,731.2 40
2.24 83,865.3 18.2 -22.3 1.9 +9 ▲57▼Bank of America Merrill Lynch 6 9 97,519.6 18.9
103.3 ▲ 41
Centerview Partners LLC1.1
371.9 ▲0.3 0 7.8+1 ▲ ▼-25.1Barclays 6 5 0.5▲ 168.7
29 59,905.2 ▼ 77.3▲69,689.9
7Deutsche Bank 7 12 76,344.5▼35 1.2 +2 3.5
▼8.0 ▲14.8
15.2+6 ▲26 0.7 Perella Weinberg Partners LP ▲
Barclays 8 4 59,590.2 11.5 1.8 1.9▼-15.1 87.013.0 12.0 1.6 0.80.2 -35
12 31,912.1 6.9 0.1 0.8 -12▲0.8
▲ 2532 0.9 -11 ▼ Credit Suisse 8
10 10 55,174.3 10.7
▼Citi 9 3 55,951.5 10.8
-3.9 ▼ 2531
10-9 ▼Deutsche Bank-16.7 ▼ 9
0.7+4 ▲ ▲ 139.0
10 28,061.011 30,249.4 0.8 +1
6.1 -1.6▼ 236.6 -0.5 2.9 0.7▼ 25 ▼
Greenhill & Co, LLC 11 11 35,314.5 6.8 Evercore Partners 112.2 1.90.8 -14 ▼ 107.1
▲ 22 1.7 0.813 27,009.7 5.9 0.1 0.7 -8 ▼ 80.9 ▼Guggenheim Securities LLC 12 78 31,812.9 6.2
8 0.2 0 -6.1 ▲ 6 0.2
-1.6 ▼Wells Fargo & Co 12+4 ▲ 31 26,353.0 1.2 0.2▲ 55.6▲ 13 0.4 +1 ▲
Blackstone Group LP 13 48 26,439.1 5.15.7 4.7
-3 ▼9 0.2 14 23,455.5RBC Capital Markets 13 ▼UBS 14 28 24,780.5 4.8 3.2 ▲
4.5 ▲ 5.1 0.2 1.1 1.60.7 -6 ▼ 51.4▲ 200.4 -5 1.0 0.8▼ 49.4
Rothschild 15UBS 14
▲ 213.8 2.36 19,927.012 0.3 +2 ▲ ▼ 124.3 -30.5 ▼
Rothschild 15 21 23,582.1 4.6 2.4 ▲ ▲54.827 0.717 0.5
RBC Capital Markets 16 16 18,538.20.7 +2
3.6 2.53.6▲
-0.4 ▼-14 ▼-2 ▼ Centerview Partners LLC 16
1.1 0.428 16,692.820 17,561.5
▲HSBC Holdings PLC 17 66 18,521.3 3.6 3.4 ▲
▲ 4Houlihan Lokey 17
1.7 1.00.1 -2 ▼ 79.6▲ 30 1.4 0.234 14,436.7 3.1 2.2 1.0 -7 ▼ 65.4 ▼
Jefferies LLC 18 23 15,103.3 2.94 0.1 +2 ▲
0.9 ▲ 26 0.7 Greenhill & Co, LLC 18+1 ▲ 41 14,196.1 0.6 0.4▲ 30.3▲ 6 0.2 +3 ▲Macquarie Group 19 34 14,426.5 2.8
3.1 2.5+1 ▲14 0.4 26 13,146.2Nomura 19 ▲
LionTree Advisors LLC 20 63 10,790.3 2.1 1.8 ▲1.5 ▲ 2.9 1.8 0.4 0.10.2 +2 ▲ 16.7▲ 6
0.8 +4 0.8 0.4▲ 36.9Jefferies LLC 21Stifel/KBW 20
▼ 232.3 -2.433 12,591.91 0.0 -2 ▼ ▲ 242.7 1.7 ▼
PJT Partners LP 21 - 10,500.0 2.0 2.0 ▲ ▼91.220 0.51 0.0
Moelis & Co 22 20 10,164.60.8 -6
2.1 1.42.0▼
-0.5 ▼+1 ▲+3 ▲ Robert W Baird & Co Inc 22
1.9 1.238 9,575.315 10,761.4
▼Qatalyst Partners 23 107 7,862.3 1.5 1.4 ▲
▲ 10HSBC Holdings PLC 23
0.5 0.30.3 -1 ▼ 24.2▲ 3 0.1 0.167 9,517.2 2.1 1.9 0.1 0 - 6.5 ▼
Sandler O'Neill Partners 24 61 7,346.3 1.45 0.1 +4 ▲
1.1 ▲ 19 0.5 Ernst & Young LLP 24+6 ▲ 18 9,422.9 0.1 0.0▼ 5.4▼ 13 0.4 -16 -Nomura 25 25 7,285.6 1.4
2.1 -0.1+3 ▲ ▲-0.5 ▼ 10 0.3 46 7,613.2BNP Paribas SA 25 71.7 1.2 0.4 0.20.2 +1 ▲ 18.7▲
†Note: Industry Totals include multiple competing bids for the same Target.
Credit Suisse Deutsche Bank
†Note: Industry Totals include multiple competing bids for the same Target.
23
14
4.0 ▲
1
▼
-9
17-1 16
2,385
Industry % Change from Same Period Last Year
Perella Weinberg Partners LP
Ernst & Young LLP
-5
▼+20
Peter J. Solomon Co Ltd
24
+1
▼
6,780.1 0.0+11.5-65
▼
-20.3-20.4
2
0.3
▲
▲2.3
▼ 0.71.0
2109,112.4
0.9
Stifel/KBW
▼
27,190.8
▼
Centerview Partners LLC0.0
12,591.9
LionTree Advisors LLC
4 12
▲16
5.4
16 -0.3
-0.8
1.318
Industry % Change from Last Quarter
37 10,790.3
1.9 1.9
1
5
▼18
15
30
11,170.4-2
Robert W Baird & Co Inc
317,556.6
-210
1.5
▲0.2
JP Morgan 1
Market # ofFinancial Advisor US$m Sh (%) Share Ch.
Jefferies LLC
Lazard 3
RBC Capital Markets 16
3323
202.6
Morgan Stanley 2 1 131,654.9
Goldman Sachs & Co 4
4.0 2.8
, ,Industry Total100.0 -1543,650 100.0Industry Total† -142459,799.2 3,036516,608.9
▼ -15.6%Industry % Change from Same Period Last Year 27.9% ▲ -4.0% ▼
Rank Value per Advisor (US$m) # of Deals per Advisor
▼ -12.4%
Rank Value per Advisor (US$m) # of Deals per Advisor
Industry % Change from Last Quarter -7.7%▲
100.0
-14.0% ▼▼
Imputed Fees (US$m)
▼
4,799.2
Industry % Change from Same Period Last Year 5.7%
US Target Completed (AF2) Jan 1 – Mar 31
-4.5% ▼ 6.6% ▲Industry % Change from Last Quarter -11.3%
Sh (%)2014 Rank
Market
US Target Announced (AD2) Jan 1 – Mar 31
MarketRank Value Market2015 Rank Fees
# of Change in 2015 Rank
2014 Rank
Rank Value Market Change in Market# of Deals
Market
36.8 -2.9 ▼US$mDeals Sh (%) Share Ch.Sh (%)
Advisor
554.81.6 +12 ▲ Goldman Sachs & Co
MarketShare Ch. Deals Sh (%) # of DealsFinancial Advisor
2 153,193.4 5.215.639 1.91 137 ▲31.7 -14.6
0 -154,801.3 48.8 -6.2 ▼▲
3Bank of America Merrill Lynch+8▼
-313 105,853.6 25.5 19.91.4
8.3▼ 32-18.42▲237.3 6.7▲
0.70.1294.9
1.336.7 263 -14.8 ▼116,459.0 -
7 99,507.0
034.4
-▲ 1.0
▲1.6 -3 ▼JP Morgan
-0.2 ▼ 1.8 044 1.4 +13 ▲23.9 Citi 87,051.7 27.4 20.8 29-33.417.1Centerview Partners LLC 5 5 98,398.9 54,193.35 4 34 1.6 +5
▲4.6 1.47.3 1.0 ▲
162.4
-0.123.7 -5.5 258.7▼ 0.3 Morgan Stanley-18 ▲
29 Barclays 6▼
1.2Bank of America Merrill Lynch 6 9 76,752.2 18.5 1.15 49,351.3 15.5 -34.8 ▲ 122.5▼ 1.2 ▼Deutsche Bank 7 15 46,437.7 11.2 7.2 ▲
▼ 3.40.6 +4 Lazard 2.8
+3+3 ▲ 249▲ 2.11.0 -78.6 -1.0 ▼ 99.120 ▼
Barclays 8 3 46,319.6 11.1▼7
8.2 1.6 ▼1.8▲ 17 ▼ 69.40.8 -3 2.0Citi 9 4 42,768.3
1022
▼
26,149.08.0
▼0.510.3 Wells Fargo & Co+7
10 10219
Credit Suisse 8 13▼▼
22 0.9▲
▼25,327.6 0 -0.612
0.87.7 ▲6.7 ▲ -51.2 1.4
▼0.93.2112.5 ▲0.0
0.0 - 1.519 0.9 -7 66.2 1.9▼24,485.310 +30.1 ▲ 1637,372.1 9.0 -6.5 13
11 - 31,812.9 +6 ▲ Evercore Partners▲ 7.40.712 17
7.7 7.7 6 23,498.00.2
1125,980.5 0 ▼19,523.1 6.2 4.3 ▲ 0.49-4.411 6.3
8
Guggenheim Securities LLC1.1- RBC Capital MarketsGreenhill & Co, LLC 12
11
Blackstone Group LP 13 29 24,764.2 4 ▼0.2 -5▲▼ 4
0.2-56.0 4.9UBS-6
6▲
▼▼
-39.2 ▼-514,058.7
25.538.5
▼5 0.2- 14 2913 15,604.2
HSBC Holdings PLC 15 - 16,658.3
1.11.6
0.4▼4.4Houlihan Lokey
▲
▼UBS 14 24 18,530.3 4.5 3.6 ▲
1.1
0.53 ▲4.03.7
3.3 ▲Greenhill & Co, LLC 150.123
3.111,983.1
55.8260.1 +2 16.81.3
▲23.2 17
▲0.328 12,872.5 4.1▼▲13,288.1▲0.52.1 ▲ ▼
▼ 1.00.13.814,413.6 3.5
1.53.535.0
19 3 54.6-3▲+7
1.1 +4 ▲▲
0.632.1 0.90.433
Macquarie Group 20 22 10,381.1
0.1 -319 15 10,150.2 3.2 --1.2▲19 - 86.5▲10,500.0 2.5 Jefferies LLCPJT Partners LP ▼ 20 1.02.5 0.0▲ 0.0 +1 2.420▲ ▲0.52.5 1.3 +411 43 9,575.3 3.0 2.7 0.5 +4 -
▼ 0.0 -1.022.0▲
0.00.6 0.0
▲8,838.4 2.8▼ 015 0.6 21-Moelis & Co 21 19 10,094.5 2.46.0
42.0- 7,862.3 0.2
1.8 1.52.2 ▲
2622
William Blair & Co 23▼
Sandler O'Neill Partners 23 36 7,346.3-1Qatalyst Partners 22 Nomura0.2 +5 0.2
0.5-1.65,823.10.85,147.9 1.6
191.6
▼13 0.6 0 - 0.7 ▲1.5
0.052.30.9 ▲
▲ 18,788.4 2.8▲
371.8
76Qatalyst Partners
24Leerink Partners LLC1▲ +1 ▲▲ 0.6
0.4 ▲1.6 ▲ 19.32 0.1 0▲▲ 1.9 1.869.1
3,564.0 100.0+3▲1.6-24
-4.9% ▼
25 0.2
Industry % Change from Same Period Last Year▼
5,033.2 4
-1.2%
59100.0
▼▲13.0%▼
-9.7%-7.9%
2,061
-13.1%
Industry Total
Industry % Change from Last Quarter9.6% -10.0%-2.7%
100.0415,855.3
24 -
▲
6,161.1
33.1%
25 35 ▲
+6
1.1
▲
▲
Industry TotalWilliam Blair & Co
https://www.thomsonone.com
* tie
Visit http://dmi.thomsonreuters.com to view archives and order custom League Tables7

Credit Suisse Wells Fargo & Co
Industry TotalRothschild
100 0 73418 449 8 2 597▼ 12 0.8 0.8 ▲
4 351 3 100 025 19 5,332.7 1.3 -0.2
1.30.5 +1 ▲ 34.7
16 0.6 +2 ▲ 56.9 1.30.4 ▲
William Blair & Co 24 34 6,013.4 1.4 0.6 ▲ ▲17.71.5 1.4 ▲ 6 0.423 65 6,252.1 0.2 +3 ▲
13 0.5 -13 ▼ 5.4 0.1▲
Ernst & Young LLP 22 17 9,422.9 2.3 -0.1 ▼ 0.1 ▲24.21.7 ▲ 10 0.6 0.6
20Robert W Baird & Co Inc 21
2.110,671.4 2.62.3
-2.2 ▼-38 9,575.3
▲ 36.924 0.9 +514
0.4 0
0.92.1 ▲22 0.8 -4 ▼ 89.80.9 ▲
0.3 0.3 ▲Stifel/KBW 19 28 12,591.9 3.0 1.9 ▲
2.3 ▲0.2 +1 ▲ 14.71.9 ▲ 5
1.4 ▲28 1.1 -9 ▼ 59.6 1.40.7 ▲6 0.2 +3 ▲
▲Greenhill & Co, LLC 16 37 14,196.1 3.4 2.7 ▲ 30.3 0.7
0.618 19,523.1 4.7 3.0 0.625.5▲1.8 1.80.2 -2 ▼ 79.6
1.1 ▲6 19,914.9 0.4 -4 ▼ 47.24.8 -33.4 ▼ 101.6
▲9 0.3 -7 ▼1.1
▲20 0.8 -9 ▼ 1.669.23.0 3.0 ▲
Evercore Partners 12 12 23,684.9 5.7 -0.7 ▼- 130.36.2 -1.0 ▼ 2111 25,913.6
55.6 1.326,353.0 6.3 5.2 ▲0.8 0
1.3 ▲13 0.5 +1 ▲105.1 2.4 2.4 ▲23 0.9 -14 ▼
2.0 2.0 ▲Lazard 9 10 28,061.0 6.7 -1.7 ▼
3.4 3.4 ▲1.1 ▲ 21 0.8 -8 ▼ 84.7
▼ 146.613.2 -31.9 ▼ 2914.3 13.5
55,137.1 1.14 -3▲32 59,905.2 ▲5 0.2 -2 ▼ 77.3 1.8 1.8
▲199.8 ▲
46+13
Morgan Stanley 5 5 66,491.5 15.913.4 ▲
-22.0
7.54.6
-28.9 1.8 +3▼ 7.5
41 1.6 ▼ 7.8-84 9 91,647.2 37 1.4
Sh (%)Market
Share Ch.Market# of
15.754 682.12.1
Change in
96+4
MarketDeals Sh (%) # of Deals Fees
Goldman Sachs & Co 1 1 218,318.1
25Sandler O'Neill Partners 0.61.31.6
7,862.3
Advisor
-5.7 ▼ 33 1.3-0.4 ▼
Share Ch.
-8 ▼
Industry Total 470 533 10.31.07,273.3 1.6Nomura
3 021
21.9
BarclaysPerella Weinberg Partners LP 6
▲19 +6
▼▼
5
9100 0
1.7 ▲1.6▼
PJT Partners LP 2.2-0.610,164.6
LionTree Advisors LLC 20-
Qatalyst Partners 23 92Moelis & Co 22
20
2110,790.310,500.0
2.2
512.2
19
2.712,748.9
4.5
▲Jefferies LLC1.6 ▲19 27
14,035.8 3.0
2.7UBS 21 21,347.8
18
HSBC Holdings PLC 15
17
18,521.3
13,348.131
▲
▲
12 31,812.9105
16
5.0
3.159
14
20.721.7
9
▲6.8
97,519.614
-15.9
Blackstone Group LP 13 37 26,269.1 5.6 ▲
27 0.9 -10
Guggenheim Securities LLC11 11
6.835,207.2
6-1.8
108,963.45
2
67.9 ▲
▼
14.0
12 23.2
3.9
0.62.2
2.8
-0.416Rothschild
12Macquarie Group2.3
RBC Capital Markets 14,413.6 0.53
▼
▲
0.2
▲
2.0 ▲0.0
3.7
338.8
▲
▲7.8
275.9
▲ 4.6▲
324.8
6.3-11 15.7▼
-3.6▲3.9
▼▲4.7 65
+540 1.310
+5
▲
+2
7
# of Deals per Advisor
24▲
0
1
18
0.2
0.8 +2
+1
Change in
+3
+1
25
-8
47Deals # of Deals
▲▼
-1 3
# of
1.3
16
+5
Market
1.6Sh (%)
0.3Citi
▲0.8
-2▲
Jan 1 – Mar 31Any US Involvement Announced (AD41)
Rank Value
16.24
-14.0 ▼
MarketFinancial AdvisorJP Morgan 1
29.0
2014 Rank
26.3Morgan StanleyGoldman Sachs & Co 3 7 123,679.8
US$m2015 Rank
2 163,021.31 136,423.0
Rank Value per Advisor (US$m)
34.7
Lazard
38 41.6▲
6.3Bank of America Merrill Lynch
Rank Value MarketImputed Fees (US$m)
0.4 +40.0 Jefferies LLC
BNP Paribas SA▲ ▲
3824
24 16,692.8 4.0
17
▲
Houlihan Lokey0.3
▼
-10
4
Greenhill & Co, LLC10
18
710.2
Citi 910
30 1.0347,810.548,997.4 10.4
-3.4
Centerview Partners LLC
Deutsche Bank 7
102,257.9
48
5
65,957.8Bank of America Merrill Lynch
Barclays 29
7.518
▼-18.4
Deutsche Bank
Credit Suisse▲+6
1.0
14,178.7 3.43.1
2923 12,982.6▲
▼▼
Nomura
▲2.8
9
▲
▲
▲
▲
0.6+4
1
-9
Americas Rankings
10-6 UBS
14+1
0.6
2014 Rank
▲
▼
Jan 1 – Mar 31
12.558,894.6
Any US Involvement Completed (AF48)
-
US$m▼
Share Ch.-1.9
MarketFinancial Advisor
Market
8
26
31,392.6
11
118,863.92
Sh (%)
# of Deals per Advisor
+1
-3
7.5
10
2
▲▲ RBC Capital Markets
15
▼
▼
▲
Centerview Partners LLC
173,856.83
52.2
28.4
Rank Value per Advisor (US$m)
2.2 JP Morgan
2015 Rank
+16
First Quarter 2015 | Mergers & Acquisitions | Financial Advisors
Sh (%)
13▼
13▼
0.1
6 0.2
0.2
0.3
50 7,346.3
Morgan Stanley Desjardins Group
▼
Houlihan LokeyDTZ Debenham Thorpe Ltd
-16.6%
Raymond James Financial Inc5.56
2.2▲
▲-4
1
0.5
12
Industry Total
4 +3▲
0.7Bourne Partners LLC
2
1,395.3 3.4 -3.1
▲0.93
2.52.8
556
▼
1.0+333
-22.8
388Industry Total40,558.8
2.0
0 -
▼ 51.5 ▲
0.0 +30.00.4
0.5▲
▲ 1.030.40.5
4.4▲ 2.3 0.5
1.0
-29.9%▼▼
-15.7%▼
-72 455.9
▼ -21.0%-24.7%-50.3%
Industry % Change from Same Period Last Year
0.4 0.42
-13.4%
▲
100.0
1 +1▲113.825▲ ▲
Clarus Securities Inc.-
100.0
0.40.4
▲1.2▲
0.10.8▼▼ 0.30.0 -1
4
▲1
0.62142.4▲
-0.1
0.90.5
14*
4 0.7 131.2
National Bank of Canada Fin'l
24
22 41 222.2▼
0.921
258.1-
+10.9
-2.9256.0
20 ▼▲
9.80.1 ▲0.80.8+10.0
▼
3.81.2▲
18* ▼ 3.91 3.00.90.0▼Credit Suisse
21 21 1,000.3 2.5 ▲-2▲
▲0.0 +11 0.5▲ 2.4 0.512
Credit Suisse 18 11 1,309.41.2
3.223 344.4-
19 - 1,200.0 3.0 ▲0.23.0 +1 -4.4▼ 18*▼
Mitsubishi UFJ Financial Group0.9
17▼ GMP Capital Corp
265.0
0.0 1.0 ▲0.0 0.8
▼-4+2
1.7 2.2 ▼0.8
▼
0.24.7▲▲ 3.7
2
US$mAdvisor# of
▲Fees33.5-0.1
0.0
▼
7,210.2
▲
# of Deals per Advisor
-11.1%
Share Ch.
21.0
▼
▲
100.0
▼8.4% ▲
-11.3% -12.5%
-73418,449.8
▼
2,597
Industry % Change from Same Period Last Year 7.9% -2.7%
4,351.3 100.0
Industry % Change from Same Period Last Year 30.8% ▲
-96Industry Total 470,533.1 3,021
-14.2% ▼
100.0
-3.1% ▼
23.9
2
7.1
15
1
Raymond James Financial Inc
41
0.2
▲3
117.2
10.9
0.217.2
# of
0.5
Industry % Change from Last Quarter
* tie
20 39 1,127.3
▼
-13.7%
▲-2.2
FirstEnergy Capital CorpNational Bank of Canada Fin'l
547.1 1.4617.255*
Industry % Change from Same Period Last Year 18.7% ▼
William Blair & Co
-26.6%
23+2 -
0.9
100.0
▼▲
7.68 530.0Maxit Capital LP
▼
16▼ - 1.8 2
RBC Capital Markets
Sh (%)MarketMarket
Financial Advisor
24.3
▲
▼
0.9
29,662.3
1.8
0.1
Industry % Change from Last Quarter
0.9▼-0.5
Lazard
▲
-2
-38.8-6
-1
265.0
Rank Value
526.5
0.2
▲
▼
BMO Capital Markets
+1
+1
▲17.0 4
3▲
- 6,954.1
6,973.91
▲
Sandler O'Neill Partners
5*Lenner & PartnersBank of America Merrill Lynch
2
4JP MorganDeutsche Bank
323.9
7,114.7
Danske Bank 5*5*Citi
42*
-6
Sh (%)16.6
-2
- 6,954.1 17.217.2
9,703.917.5 0.5
1 29.5RBC Capital Markets 11,957.6Sh (%)
2015 Rank
49.9
Rank Value
5Financial Advisor Deals
Market
+3
Market# of Deals
▲16.5▲
Morgan Stanley0
+329.82.7
▲ Industry % Change from Last Quarter
2014 Rank
Rank Value per Advisor (US$m)
Any Canadian Involvement Announced (AD42)
Rank Value per Advisor (US$m)Market
Any Canadian Involvement Completed (AF49)
1.3%
2014 Rank
Jan 1 – Mar 31
Share Ch.
Industry % Change from Last Quarter
US$m Sh (%) Share Ch.
▲
Market# of Deals
Change in MarketImputed Fees (US$m)
5 3.77.310.9
4.5▲▲
7.98.1
36.2
3 8,825.726.2
+1▲▼
DealsMarket
8
2015 Rank
0.1▲18 620.90.1
Sh (%)
Jan 1 – Mar 31
+3 21.9
JP Morgan
34
▲1
Bank of America Merrill Lynch
2+3Barclays
3.05.123.418.1 ▲
▼-16.8▲
34
0.0 -35
2-25,938.2 20.0 32.2 7.1▼0.1
2.9-2 ▼
▼+1
6Macquarie Group 0.00.0
7 2,072.9 7.013.3
▲
91
1017.2
Goldman Sachs & Co
6,954.1 17.25,394.0 1,713.9▲ 10CIBC World Markets Inc
11
7.013.3 1
-1+1
BNP Paribas SA0.2
291.41.4
9*
4▲
Jefferies LLC
▼
0.26.3▲101
8 7.29*
33.01,462.1
BMO Capital Markets 16 4
8
2 3,050.5
9Macquarie Group 1910
# of Deals per Advisor
3,939.86Scotiabank▲ Goldman Sachs & Co▲
20
▼
8.0
▼▲0.1
0.130.8
▲
▲1.4
▲
▲
3.4
▲
▲▲
13.42.9
▼
3.75.8
-2.2
0.0
▼
▼
3
2.8-4
13.2▼
11
7,762.8
6,506.7
4.94.9
▼ -
+1▲4.91,462.1▲
- 1
▲
20.20.0
7.1-1 ▼ 19.1957.62.30.18 4.43.617
4.2
13
6.3-2
1,080.5 -0.2 ▲1
+3
0-0.6
▼
▲3.5-2 ▼2.5TD Securities Inc
12
-11.8 -0.919
▼ 10
547.1-5.6 ▼
4
1.8
3.2
0.10.1 1.0
▼ 2 0.0 ▼ 8.3 1.8-6 ▼13 741.49 ▼-4.4 4.50.7
1,720.7
▼
1,678.13
+10.7-5
▲
▲
1.5
-12.8 ▼
-12.7
0.54.1 1.6
1▲ 15
11
22-2
Industry Total
3
14
828.4 0.42.0
+1
-3.7
▼
4.20.2
25Lazard-88
26
Canaccord Genuity 2427
797.3
Rothschild
23 17
-4,427.5
122,250.0
8
2,411.7
3,311.6 ▼
▼7.58.2 0.9
0.7
-19.713.3
0.5-2
Change in
0.7▲
-5
4
0.2
0.2▲
▼
5.6
4.2 4.2
-11.3
▲
▼
GMP Capital Corp 17
▼
0.4
-
-15.1
-0.4
14*
6.0
Willis Capital Markets14*
313ScotiabankBarclaysNumis 4.2
1
5
▼
1,720.7-
Visit http://dmi.thomsonreuters.com to view archives and order custom League Tables https://www.thomsonone.com 8

EMEA Involvement Announced Advisors by Target Industry Jan 1 - Mar 31 2015
68.9
3
4 2,980.2
1
6
305
6 321,516.7
73.0
No. Deals
2
37,079.3
29.110,798.0
583 1
Mkt.ShareRank Val US$m
13,192.4
Rank
Rothschild 35.6
12.23,343.5
14.2
3
1
221,013.3
16,664.2
2
2
24,402.0
13.73
3
First Quarter 2015 | Mergers & Acquisitions | Financial Advisors
EMEA M&AEMEA Announced M&A Essentially Flat | Industrials Highest Valued Sector | Financial Sponsor Activity drops
Rothschild
Industrials
Deutsche Bank
10,497.0
Real Estate
3
EMEA Deals Intelligence
Citi24,844.2
11 7 9 3
216
41.0
237 28.3
3 11,620.4
75.72
5
3,463.5 230
15,038.6 14,277.8
46.8
BNP Paribas SA2
10,196.3
UBS
1Morgan Stanley
78.722,027.1
Primary Listing of Most Acquisitive EMEA Companies - Top 10 (US$b) Jan 1 -Mar 31 2015
16,079.1
3
Materials
Healthcare
Bank of America Merrill Lynch
Announced M&A activity with EMEA involvement totaled US$233.5 billion in the first quarter 2015, down 1% compared to theUS$235.8 billion reached the same period last year.
EMEA fees accumulated on deals completed in the first quarter of 2015 was slightly down from the same period last year,totaling US$2.6 billion, according to estimates from Thomson Reuters/Freeman Consulting.
The Industrials sector led the EMEA marketplace, with 583 deals totaling a combined US$37.1 billion, including the Bidco Spa(Italian Investment Company)/Pirelli deal valued at US$7.9 billion. Energy & Power accrued US$24.8 billion, and Real Estatetotaled US$24.4 billion of activity.
Financial sponsors were less active this year compared to the same period in 2014. EMEA-targeted buyside financial sponsoractivity reached US$27.8 billion in the first quarter 2015, down 55.9% from the US$49.7 billion reported for the same periodlast year.
Acquirors listed on the London Stock Exchange were EMEA's most acquisitive companies this year, with a combined total ofUS$20.8 billion in offers.
Goldman Sachs & CoJP Morgan
Lazard
17,330.6
Goldman Sachs & Co
Citi
46.849.3
Energy and Power12
Goldman Sachs & Co
EMEA Targeted Financial Sponsor Investments (Buyside Sponsor Activity)
Telecommunications / Wireless
Shire PLCEnergy and Power / Power
Ireland-Rep / United States
Auspex Pharmaceuticals Inc (100%)
5,074.7
Industrials / Transportation & Infrastructure
3/30/2015 Teva Pharmaceutical Industries
3/13/2015
Pending AWAS Aviation-Aircraft Portfol (100%)
Pending
Pending
Ireland-Rep / France
United States / United States
British American Tobacco Ameri
15,381.2
Healthcare / Biotechnology6,954.1
3,432.6 Consumer Staples / Tobacco
7,369.6Energy and Power / Power
7,913.8Materials / Construction Materials
Healthcare / Pharmaceuticals3,265.0
Canada / Sweden
4,000.0
Israel / United States* Undisclosed
4,666.3
Intended
Fortum Distribution AB (100%)
Rexam PLC (100%)Pending
CRH PLCBidco SpAPirelli & C SpA (73.8%)3/22/2015
2/2/2015
Target Macro / Mid IndustryTarget (% Sought/Acquired) Rank Value (US$m)
Lafarge-Holcim-Certain Assets (100%)
Top Ten EMEA Involvement Announced Deals
y g q p p ( $ )
2/5/2015Industrials / Automobiles & Components
Ball UK Acquisition LtdO2 PLC (100%)
Rank Date Acquiror / Target NationAcquirorPending1/23/2015 Hutchison Whampoa Ltd
Date Effective
Souza Cruz SA (24.7%)Macquarie Bank LtdIberdrola USA Inc
United Kingdom / United KingdomHong Kong / United Kingdom
Brazil / Brazil
Completed NPS Pharmaceuticals Inc (100%)
Intended
UIL Holdings Corp (100%)
Pending Investor Group
3/3/20152/25/2015
8,613.0Italy / Italy
Materials / Containers & Packaging
Australia / Ireland-Rep
Jan 1 – Mar 31 2015
2/23/2015
Pending1/11/2015
g p ( y p y)
$75.9 $74.4
$27.1$4.1
$21.9 $18.4 $25.7$49.7
$27.8
$45.5$85.4
$44.0
$9.0$16.2
$38.1$19.7
$33.3
$43.8
$60.3
$54.7
$28.2
$14.6
$37.4
$23.9
$18.7
$24.7
$30.0
$90.8$62.7
$24.9
$19.0
$26.3$22.3
$24.7
$34.0
$52.5
19.7%
16.7%
10.2%
7.6%
13.4% 14.2%
9.5%
18.3%
18.9%
14.7%
0%
5%
10%
15%
20%
25%
$0
$50
$100
$150
$200
$250
$300
2006 2007 2008 2009 2010 2011 2012 2013 2014 2015
% o
f EM
EA
Ran
k Va
lue
(US
$b)
Q4 Volume (US$b)
Q3 Volume (US$b)
Q2 Volume (US$b)
Q1 Volume (US$b)
% of YTD EMEA M&A$20.8
$7.9$5.3
$4.7
$4.7
$4.3
$3.7
$2.9$2.5 $2.3
London
Euronext Paris
Nasdaq
Swiss Stock Exchange
New York
Zurich
Nasdaq
Madrid
OMX Stockholm
BMFBOVESPA
https://www.thomsonone.com Visit http://dmi.thomsonreuters.com to view archives and order custom League Tables9

HSBC Holdings PLC
RBC Capital Markets 25 33 5,328.3 2.3 ▲0.7
6,954.12.55,798.4
233 543 0 100 0
7,369.6--
977,369.6
6,954.17,106.5
▼
25
9,605.2 4.1
5.312,605.712,319.690
4.410,269.622
▼
▲
240
+3
0.0
0.0
▲
-2
0.1 -6
3 710-2
0.0▲
9
0.1
+1
-7
0.10.1 +1
0.0
0.1
0.0
▼424
Moelis & Co22
▼-
20Evercore Partners
RBC Capital Markets
Centerview Partners LLC
0.11.8
23
25 34
▲
290.7
1.0
▼
0.20.9
0.9
1.4
38.5
▲
7.8
5.9
9.4 0.0
1.2
12.6
22.3
0.1
2.1
0.9
0.3
30.5
0.2
1.5
-2
▼
80.5
0.2
25.0
1.3
▲
▲
▼
12 ▲ 13
7.3
7.78.1
35,987.0 ▲▼
10
31,327.712.6
0.4- 8.1
22,015.1
11.023,101.6
513
13.219842,472.637,706.4
-1.9 0.3
0.4
+12 Perella Weinberg Partners LP
Rothschild
11
7
▲Lazard 9
10▼
▼ Zaoui & Co
19.8
40,178.617.719.5
17.2
46,207.7
41,232.00.6 21.6
16.815.6
▲0.3 ▲
52▲
37,034.4 15.9Morgan Stanley 44,510.4
▼
14.9-1+3
▼ Deutsche Bank 5.76 -37.9
▲
9
1.5
3.5
7.5
5.7
▼0.5
2.1
1.1▲
0.3 ▲▲
-
3.2
36.154.4
18.0
-▼
-16-12
0
-5
-0.3 ▼
-10.0
0.0
0.1
+10.4 ▲
0.0▼
0.2
255
0.6
0.3
0.1-▲
0.2
▲
▼0
0.40.1
▲▼
0.00.1 0.4
0.2
0.5100 0
0.6-2▼▼
-22 555 4
0.4 ▲8,449.6
5,377.5 1.9
285 692 51.4
5,149.3
5,522.4 1.9 1
0.4 ▲1.8
13
▼
1▲
0.3
+11.649
10
1
▼
-17
-2
4
1
▼-
385
-38
Industry Total4,015.35,074.7 ▲
▲1.7101
10
0.8
100 0 3 078
0.9
4.8
▲24
3
15.5
▲
▲
70,727.5
0.8 ▼
4.4
+3
1.7
7
190.6
0.412
-11
▲▼
45.0
2.5-▼
63.3
1.3-
12.0▲
▲
2.0
▼
▲▲
▲
1.3
0.2
0.1
Change in
-11
Fees
1.8
▲
0.70.6
Sh (%) # of Deals
Any EMEA Involvement Completed (AF53)
Share Ch.Market2015
Rank
EMEA Rankings
Advisor
First Quarter 2015 | Mergers & Acquisitions | Financial Advisors
# of Deals per AdvisorMarket
Imputed Fees (US$m)# of2014
RankMarketMarket
Rank Value per Advisor (US$m)
0.8▼▼ 1.1
2015 Rank
Market
Bank of America Merrill Lynch40.2
Jan 1 – Mar 31
306.9 ▲Sh (%)US$m
▼
JP Morgan31
4.4113.118.3
▲
38.8
+124.8
-18.6
61,705.9
28.4Financial Advisor# of Deals
45 Goldman Sachs & Co2 4
114
0.3+17▲ 0.5
113.027
-22.22534 -18
▼▲▼
92,590.7 32.4▲
0.3
128 +2
+5Citi
47,922.1
123.0
-5
+7-33.7 ▼
1.5▲89.9
▲-1
+4
▼
145.523 ▼
0.8▼▲
0.730
0.01.0
▲
13,555.0
3
1
0.6
▼
1323
3 ▼
▲
+12
Barclays
4.8Credit Suisse
+3172646
0.4
-37.5
10.7-9
14,830.5
7.85
1318,110.312-615,939.5
-615.6
▼6.5
-7.8
6.46.8
▲ 10
▼▼
-13.5▲
▼-20.4
80.10.1
-18
▼▲
0.211.4
220.2
23
5.4 2.8
Societe Generale
Industry Total
12
Goodbody Stockbrokers27
Lenner & Partners 22*21
Danske Bank 22* 217*
Nomura19*
104
24
3.2
5.10.3
3.23.23.9
183.0
3.03.0
-13.33.0
▲
8+11
2
1
0Leerink Partners LLC
▲
▲0.0
+1▲
UBS▼
Puhl GmbH & Co KG+12+1
14
2.90.6 ▲
▲3.2
0.2
▲▲
▲
27
▲ -0.61
Ernst & Young LLP 19
4.6
0.5
8
0.21.2
Kempen and Co NV
0.1▼
13,190.3
148-
28
3.7
3.610,431.4
1417
3.7
Nomura
21
▲ 1615
▼-0.9
PricewaterhouseCoopers
4.7HSBC Holdings PLC 52
17*17*
14
▲
4.211,963.310,431.4
6
3.010,249.8
▼3.7
▲
-41.4
▲▲
2.9▲4.0
11
2
11
6
13.0
4
10
45,524.95
10
2
8
Citi 6Lazard
Bank of America Merrill LynchDeutsche Bank
UBSRothschild
22,281.629,988.6
▼▼
12.8 15
-11139.5
+1
114,956.2
Market
13,635.3
▼
-2
28
-19.2
-8.6BNP Paribas SA
0.37
15
3
BNP Paribas SA
12
14
Morgan Stanley 934
Credit Suisse 11
Davy
Moelis & Co 13
15
9
7JP Morgan
19*
17
76
18Zaoui & Co
Barclays
30,442.7
53
Macquarie Group
Mediobanca16Greenhill & Co, LLC
-5.3
255.6
-4.334
5627
-6.5▲
50,956.0 -13.3 ▼
# of Deals per Advisor
36,404.1
Rank Value Market
66,350.4 2.0
▼
21.84Goldman Sachs & Co
2014 Rank US$m Sh (%)DealsShare Ch.
MarketSh (%)Sh (%) Deals
Change in Share Ch.
Rank Value# ofFinancial Advisor
Jan 1 – Mar 31
1
-1.0
3.7
Any EMEA Involvement Announced (AD47)
Rank Value per Advisor (US$m)
▼
HSBC Holdings PLC Barclays
4.22▲
13.4
22
19*
Morgan Stanley
5
Financial Advisor
7
Moelis & Co
28.7Sh (%)
▲
233,543.0
17
15
9,605.2
5.625
100.0
30,442.733,139.1
Industry % Change from Same Period Last Year
62,885.4
8
18,110.322,281.6
1.8
0.1
Market
▲
-20.3
▼
Market
3.2 1
3.4
716
13.4
▲
3.1
3.4%
9
21
15,939.5
11710,269.6 4.7
18
7613
95
14
12.3
6.8
7,369.6
5,798.4
-3.4
1.9%
▼
▲
29,988.6
12,319.612,605.7
5.5
14,830.57.0
13.710.2
8.3 -8.5
▲
▲
▲
-13.5 ▼
▼
0.5
5.8 3.1
7.3
-240
▲
4.4
Industry % Change from Last Quarter
100.0 -247
Danske Bank
219,019.9
▲
38.3%
0.7
▲
27 7,106.5100
11,963.3
23
1.6
7.5
20
+12
▼
1.3
0.4
-5
2,457.7 100.0
▲
▼
▲0.2
▲
0.9 ▲
0.2
0.80.512.6
25.0
▲0.60.15.3
.2
▲0.6
▼
0.4%
0.2
0.2 ▲
▲
19.2
▼
▲
0.0+1
0.1
▲
▼-6
+1
-240
1.2
Change in
▼
Sh (%)
3,710
Deals
-6.1%
# of
▼
Jan 1 – Mar 31
# of Deals per Advisor
-24.1%
+1
-5+1
8
+14
▲
▲
1.6
8+1
0.3
+1
0.6
+4
56
-8
-10.2
Credit Suisse
10
▲
▲
▲
BNP Paribas SA
UBS▲
22
1
4
13
Centerview Partners LLC
17*
Ernst & Young LLP
15Nomura
Perella Weinberg Partners LP
▲
Kempen and Co NV
HSBC Holdings PLC
Bank of America Merrill LynchCiti
▲
# of Deals Financial Advisor
2+17
Rank Value per Advisor (US$m)2015 Rank
Goldman Sachs & Co
2014 Rank
1+1+5
0.8
0.8
-16
43
1.0
13 0.4
Industry % Change from Same Period Last Year
12
34
6
▲
▼
+3
+3
-
▲
Change in
302.4-201.1
183.1
1.3
-255
Sh (%)
1.0 ▲
▲
-2
▼
▼
0-36
-
▼
▼▼
+10 -
▲
-1-18 ▼+1
▼+4
-0.2 ▼▲
3.9
▲26
13
▲
1
0.6
0.9▲
1▲
▲
0.3
▲
0.8
8.2 ▲
30
0.9
0.0
10
18.522.4
16.42
1.5
0.4
47,922.1
8.2
0.4
100.2
0.3
▼19
1.6▲
0.4
10
▲
Share Ch.
89,348.5
# of Market
0.60.721
0.4
24
13.3
Rank Value
▼
-35.065,305.2
-17.8
Market
▼
Market
1711.6
Deals
▲
▼
13.4
17.8
14.016.5
25
12
1.6
0.8-22.3
33.232
3
46
24.3▼
8.6▼
1.5
-38.3
-38.8▲▲
11.4
▼
1
46
0.00.0
-2
37
0.10.0
7
-9
-12
0.3
0.1
-16
-2
-11.4%▼
0.01
146
▼▼
2,910
-7.8%▼ -22.5%
▼-22.3%▼
-
0.3-1
Jan 1 – Mar 31
▼
Share Ch.
0.6
▼
▲1.6
0.94.2
▲
▲
2.1
▼
0.9
▲
▼
▼
-
3.2 0.02.6
1.9
0.93.35.0
0.1
0.4
0.10.0
1.8 1.4
2.1
9.3
0.3
1.0
▲▲
0.6
0.11.3
38.5
0.8
-
▲
▲0.4
2.0
-
▲
1.0
1.1 ▲
MarketImputed Fees (US$m)
100.0
-0.4%
2,555.4
-8.5% ▼
285,692.5
Any European Involvement Completed (AF3)
-22.5%▼-5.8% -7.7%
Industry Total
-21.6%
# of Deals per Advisor
▼
52.4
-20.3
12
▼-2
-6
0.4
▼ 22
0.210
5
7,369.6-
3
11
15
2
4
13.9
Lenner & Partners
19*
Industry Total 3,46025
3.2PricewaterhouseCoopers
-0.1%
Macquarie Group
▲0.2▲
12
19
100.0269,115.5
3.1
98
10,431.4
100.0
US$m
44,510.4
60,235.9
▼
42.6
3,078
Sh (%)114,756.2
Industry % Change from Last Quarter
1.9
25 1.43,857.1
-7.7%
10,236.3
5,223.3
8,449.628
Industry % Change from Same Period Last Year
Industry Total
Evercore Partners21
17
24
-0.8
4,015.31.8
3.8
5,074.7
14
-0.51.92.15,522.4
22* 6,954.1 3.2
6
113410
27
9
Goodbody Stockbrokers
Macquarie GroupZaoui & Co
Nomura
Davy
BNP Paribas SAMediobancaGreenhill & Co, LLC
BarclaysCredit Suisse
UBS6
12
10
JP Morgan 8LazardCiti
5 9
Goldman Sachs & Co
Industry Total
Bank of America Merrill Lynch
Rank Value per Advisor (US$m)
▲Share Ch.
Rank Value
▼
1
-1.0%
2014 Rank
145,524.9
Industry % Change from Last Quarter
15
US$m
47,713.9
2015 Rank
4
-31.3%
-7.46.6
▼
-14.120.8
Market
26-3.6
42,693.832
RothschildDeutsche Bank
4▲▼
40,178.637,034.4 16.9
41,057.0▼▼-1.0
-4.6 ▼35,987.08
+7
JP Morgan▼0.75 31▲
▲
21▼
RothschildMorgan Stanley
0.6
27
-2230.8
34 183
35,771.213▼
Deutsche Bank
7Lazard
37,706.4
▼
12
0.3▼
0.3
▼▼
0.2
+110.0
0.1▲ Puhl GmbH & Co KG
21.8
18.8
Any European Involvement Announced (AD21)
19.5
99
▼▲
23,101.6-5
Zaoui & Co 1131,327.7
10 22,015.113,635.3
8.6
▼
▲
-41.76
▼5.1115.0
-0.9
143
4.13.2
4.8
3.9
5113,555.0
3.917*3.9
4.5
3.9
14
10,431.4
12,915.823
-
16
0.1-12
+1
28
-7.5
-1015.1
18.3
22.3
44.6
7.8
80.5
▼
63.3
Market
▼ 12.3
▼
4.3
▼-
1.2
105.9
38.8
102.2
Advisor
▲
5.9
Sh (%)# of Deals
+5
-10
-2
▲
123.0
* tie
Industry % Change from Last Quarter ▲
0.824Societe Generale22*
145.5
33.0
78.5
30.5
▲
▼ RBC Capital Markets
▼
▼
▲
Industry % Change from Same Period Last Year
RBC Capital Markets 2.432
6,954.1
25 5,328.3
0.0204*12 -13.5 ▼ 352.7
Leerink Partners LLC0 230.3
3.2 -
Fees
+7
-1
https://www.thomsonone.com Visit http://dmi.thomsonreuters.com to view archives and order custom League Tables
t e
10

Greenhill & Co, LLC Deutsche Bank
Macquarie Group
0.2
10.5▲
13.49.1
13.2▲10.8
10.8▲
1 0.01.6
114
751
+3
0.1
0.053
▲ +14
-10.1▲
-4
▲ 0.1
+22+1
0.00.0▲ 3
3.8 ▲
4.4
5
36▼
▼4.56
▲-32.5 ▼
11 4,437.60
0.91.2
UBS
131114 6,135.7
8,788.4
1114
+12-2
▲
1.4
6.3▼
▲+1 9.2 ▲26
+2
▲
Credit Suisse38Ernst & Young LLP
11▲
5512 8.89.0
1.1
4▲11,545.910
9.79,517.26.611.8
14.73
63 89,888.4
16,240.0▲ 87*+3
0.5
0.3
7
+3
17.213,422.8
0.65▲
17.310
419,685.6
Nomura 9-3
1.09Zaoui & Co
▼7
11+2
16 17.4 ▲
▼21.5 20.2
-6.4
11.9
22,221.8 24.3
31.1
▲-3
▼
-0▼
▲
▲
+5+4
5
0.8▲ 0.8
1.4
▲1.2
▲ 1.1
-14.325.12.9
Morgan Stanley
1026 ▲
-123,725.7
326.0
18
HSBC Holdings PLC
RothschildBank of America Merrill Lynch 4
Barclays 78 749
6
28
3
Credit Suisse 11
Deutsche Bank
15,781.2
10
3215,922.9
Citi
UBS
Moelis & Co
24,161.167
52 26.4
Sh (%)Market
9.7
0.9
▲10.3
3.0 ▲
2,308.81-11.5
1,720.72.5
21
3.6
24
Oakley Capital Ltd
Mizuho Financial Group3.1
3,321.83.3
2.92,613.5
20
3.2
7.7
41 2.2-
2,823.5
3,432.64,128.3
3,002.4
▼
3.84.5
-37.2
18
6,699.41
17▲
7.3
113*
22432310*
-
Perella Weinberg Partners LP
9,404.512
Lazard 7,008.4
Macquarie Group 9,605.2
232
16
Numis
10.5Morgan Stanley
15
1314
-
JP Morgan
108
Santander19
19
12*Nomura
RBC Capital Markets
51
Willis Capital Markets
Industry Total 91 372 11,505.0
100 01.71.9
2▲▲
1.7
10.8
3
▲
▼▲
▲ 33.3
1.8
-9.5
3.0
21
4.6
28,389.2
Rank Value per Advisor (US$m)
US$m
22,953.4
12,210.6
2014 Rank Share Ch.Sh (%)Fees
N+1
34
56
18
9
231,515.7
13
7BarclaysRothschild
20
24
HSBC Holdings PLC
Evercore Partners
8
1.3
22
10
3.822*17
1,674.6 1.7
3,674.8
1.8
1,567.2
3,233.9 3.3
32
82
2,364.4
271,239.9
1.6
97 840 6
▲1.11.3 ▲
100 0
03.3
+412.1
942 5
1.1▲+1
10.621.7
1.2
22.2
1.8
23.2
61.4
92.410.3
2.2
15.6
▲-
20.3
▼
-
▼
-
30.4
Change in
12.5
74.0+7▲
-
+3
Advisor
31.3
9.896.9 2.2
Jan 1 – Mar 31
Share Ch.
Any UK Involvement Announced (AD32)
3.3
Imputed Fees (US$m)Market
▲1.9
7.9▲▲2.2▲
3.4
1.36.5
▲1.33.2
0.0 ▼3.7
0.8
0.1 ▼▲
2.40.5
0.1
▼
3.9
▲
0.10.0
▲0.41.5 ▲
0.2
▼0.3
▲
▼ 1.5▼▼
2.7
1.7
0.2
▲1.2▲
▲-
▲
14.4
4.8
▲ 17.60.4
9.8 1.010.9
▲
0.3
▲
▲
3
Sh (%) # of Deals
▼
9
▼
1.2
▼
8
1.0
+3-1
+11
Change in
▲2.4
+1
1
Deals
12
BNP Paribas SAScotiabank
▲
0.1
0.0
5
25+17 100 0
-5 ▼
0.1
▲
▲
+3
0.6
+5
+11
▼
+4
▲+4
▲▲
0
0
# of Deals per Advisor
▲
0.10.0
0.1
0+5
-10-1
-10.1
-3
7.2
0.1
26.6▲
0.113.5
-63.1
0.10.1
3
8
-40.4 ▼-50.1
0.0
2.3
1.5
1.8▲
▼
▼
23.6
4.8
3.2
+9884
6
10
▲
EMEA Rankings
Rank Value
Any UK Involvement Completed (AF39)
2015 Rank
45.1
# ofMarket Market
45,533.5Sh (%)
▲ 0.1
2014 Rank
1039.0
DealsShare Ch.Market
First Quarter 2015 | Mergers & Acquisitions | Financial Advisors
2015 RankFinancial Advisor
Rank Value
0.1
# of Deals per Advisor
Sh (%)
0.2 ▲11
# of Deals
▼16
23.6
0.2
0.3
▲
2120.4 ▲
0.2-48.5 15
-
30.930,381.6 31.1
20.9
13.5
7,065.8
16.6
27.827,174.0
3.8
1,756.01.4
▲
▲
0.6
0.5
2.06.2
2.2
▼
▲
0.20.7
1.91.3
0.2
-
▲
▲
0.3
2.32.5
▼1.1
1.2
▲
▼
0.6
▲
Jan 1 – Mar 31
Market
-00.1
220,416.5
54
2.4
0.1
+1
6
1
24
0.2
RBC Capital MarketsBank of America Merrill Lynch
+14 ▲0.22
▲
▼1
-1
0.5
0.30 -0.1
# ofMarket Market
Cenkos Securities PLC0.3
Blackstone Group LP1.9
25
2,713.2Standard Chartered PLCDeloittePricewaterhouseCoopers▲
▲+20 -
Industry Total
Rank Value per Advisor (US$m)
15 -71.5
2146*
3
19
-
6.1
46.5
▲
JP Morgan
Citi
-
3,743.8-
-75.2
Smith Square Partners LLP
4,340.9
US$m
23,101.6
13,170.0
Goldman Sachs & Co 1Financial Advisor
30,265.44
1Goldman Sachs & Co 2 5 38,160.5
12
Lazard
16
* tie
Zaoui & Co Credit Agricole CIB
Credit Agricole CIB
1.3 +4
Market
▼3
-42.2
▲9
1
5.13
2
5.8-2.4
-17.3%
Market
▼
Jan 1 – Mar 31
Market
-20.8%
Rank Value per Advisor (US$m)
Any French Involvement Completed (AF40)
Industry % Change from Last QuarterIndustry % Change from Same Period Last Year
751
-43.7%
1.5
-0.5
-34.52.3
Bank of America Merrill Lynch
Rothschild 52*
5.8-
16
22Morgan Stanley
21
5*
5*
23*
Barclays 20
6
▲
-67
-5
7
1
30.1
1
1.0%21.6% ▲
BNP Paribas SA
2014 Rank
Goldman Sachs & Co
Industry % Change from Last Quarter
Rothschild 3
Industry Total
2
Industry % Change from Same Period Last Year
Rank Value per Advisor (US$m)
91,372.1 100.0
3
Share Ch. Deals
4 9 2
▼
-19.0%
18
-18.8
Market
52.0
0.1 +1
0.41
▼
2,085.0
3
52*1,649.5
1,251.0
25
13
9,292.7
13*
▲- 19
18
13.5%
▲
Deutsche Bank
▼
Evercore Partners
Natixis
15
11Industrial & Comm Bank China
13*
Blackstone Group LP4
00.43
▼
12
Barber Hauler Capital Advisers▼
Bucephale Finance
▼▼▲ 4 Lazard
Market
▲ 21
2014 RankFinancial Advisor
▼
97,840.6
32.7US$m
▼▲2.8%
8,005.5Sh (%)
100.0
MarketShare Ch.
-14.21
8.9
3
7
2▲
▼
6.7
9.1
8.0
9.110.2
12.6
8.5
6.78.0
▼
▼ 91
4.4
0.9JP MorganDC Advisory
360.0
1.0
8.8 2.7
▼
▲1.31.3
7.7
▲2.1
▲0.2
0.1
▼1.71.5
3.20.1
▲▼
▲
▲
3.0
0.4
▲1.4
▲
1.5
1.31.7 ▼0.4
▼
▲3.0
1.0
0.61.4
▼
▲▲0.1
4.8 ▲
▼
▲
▲1.6
Sh (%)
942.5
Change in
32.2 9.8 ▲
15.1%
AdvisorImputed Fees (US$m)
Market
▲▼
Deals FeesSh (%)▼
5.911.0
0.71.8
-9Share Ch.
-14.4
+2▼-3
40.43
51221.8
+3
12.9-7.3
21.021.8
16.2
▲-1.7 ▼
13.1
+10.4
-4
▼ 0.7
▼
-1-2
5
00.10.1▲
-19.0
0.7
112.0 ▲
5
24,483.8
566.2
2
24.2%
1.51.5
343.9
Industry % Change from Last Quarter
1.4
14.2%
Industry Total
360.0
1,072.8-3.3
+1 22
-45.3%
▲
BNP Paribas SA
1.1-2
▲
▼-4
0.5Credit Suisse
-0
-1
+30.1
0.5 +1
+1
-6
# of
0.4
▼
0.32.9
Market
-2
1
3
0.4
16
1
1
6
8▼1
-37.611-50.3
0.1
▲
-46.1
▲
▲
7
▲
▼1
▲▼
1▲
5
▼15
5.2▲
▲
0.1
8
9*Davy
Societe Generale
7,493.8
7
-
7,369.6-
Morgan Stanley
UBS
9*
18
Goodbody Stockbrokers
16*
9*
7,822.627.0
5 28.26 7,497.5
3713*
▼
PricewaterhouseCoopers 298
-30.6%Industry % Change from Last Quarter* tie
▼
Industry Total25
Mediobanca
UniCredit
27,741.8
24
22*
Industry % Change from Same Period Last Year
Cushman & Wakefield Inc
21
Lazard
28
1719Leonardo & Co
-
RBC Capital Markets -
-5.2
16*5
20
22*-
4,450.4
2.1
1.61.6
893.0
5,425.75,187.6
JP Morgan
Banca IMI (Intesa Sanpaolo) 22*
Guotai Junan Securities
Deutsche Bank
-
12
▲26.6
26.6▼
Industrial & Comm Bank China
13
5.2 5.2
14 2
-8*
0.1 -3
-18.6
19.6▼
-26.4-23.0
▲
Goldman Sachs & Co
3,660.7 15.0
8* 52*
-
13.1Citi14.9
5*20
43
▲
8
2,501.0
5,138.1
15.3
13.1
-8.5
▼5
# of
▲
▼
2015 Rank
+17
# of Deals per Advisor
100.0
▼
Jan 1 – Mar 31
+9
# of Deals per Advisor
Sh (%)Change in
1.0# of Deals
884
-35.0
24.4HSBC Holdings PLC
33.58,667.7
28.4 -19.1
27.0
31.2
Credit Suisse
▼7,864.5
14,432.1
9*
▲▼
-27.847,496.1
27.0
7.526.6
26.6
26.6
26.6
7,369.6
7,369.6
1,428.216.0
1.0
-3.4
1,428.23.22.72.4
3.2746.9
18.7
660.7
396.3
7,369.6
592.4-1
1.4
453.0
1.4 ▲
1.6453.00.3453.0
1
0.1
1.6+1 ▲
1 -0.1 00.1
-5.5%
+83
23*
1
732▲
15▼
+87
-53.0% ▼
100.0100.0
-8.0% ▼
1,428.2
11.2
Societe Generale
▲
+1
Guotai Junan Securities
▲
-
Industry % Change from Same Period Last Year
+5
1
8.5
▲
2,735.1
Rank Value
5,348.5
▲33
211.0
▲
0.30.1
0.70.6
▲
1
1,965.0
10.2
2
▼Messier & Associes
▲9.1
0.1 ▲+1 -▲ Mediobanca 170.1+1
-8-8
0.100.8
0.71.0
▼
▲
100.0
-28.6%
2.9-0.0 0.0
▼HSBC Holdings PLCCallisto
▼0.1
0.4
1,093.14.44.5
-
▼
6.6+1
+1 ▲
1.4
0.1
-
▼
▼
▲
-
1.4
.0▲
6.9
11.54.4
▲
▼
1.44.5▲
▲0.2
3.5
.2
.5
4.40.3
328.3
2.0
0.0
▼
1.59.9
5.7
▲3.0
7.711.8
2.43.6
5.0
-
▼1.0
▲
▼
11.3
15.314.4
▲-4 11.7▼
+4▼
3.436.1
0.9
6.1
4.7
13.6▲▼
3.6
4.21 1
2015 Rank # of Deals
Rank Value
▲▼
Bank of America Merrill Lynch1510
▼
Any French Involvement Announced (AD33)
-25.6%
US$m
-13.86.1
Sh (%)Financial Advisor
Industry Total
669
-1-3
0.2%▲▼▲
+20
▲
▲+1
0.1▲
0.1
-1
-1
1
0.4
0.1
11.3
1▲
+2
0.1
0.3+1
+1
2
▼
▲
0.3
-0.83,215.03,087.6
3,732.9
2.3%
-2,232.5
5
9.1
9
2,232.5
3,975.2
43,215.0253,647.7
1
10
▼
+2
Visit http://dmi.thomsonreuters.com to view archives and order custom League Tables https://www.thomsonone.com 11

PricewaterhouseCoopers Rothschild
+111
--
.0
.0 0.00.5
-▲▲
-
2.950 -
0.6
1
0.6
0.0-
Kotak Mahindra Bank LtdErnst & Young LLP
0.0+1
1.53 ▼▲
-11
0.5+1
0.0
-5.80.00.121
-3.9
1722*
▼40.3- ▲
200.1
52.3
.9
69.6
1817
0.0-3.9
▲
-
14
1.4
19-5.9
▼+1
1 ▲
1.2
11
1.83.2
▼-
1.13.1
1.6
8.2 4.5
21
0.60.6
-4
-1.0
-4
1.5
0.3
5.84.1
1.52.9
-9
+3+1
2.9
2.9
0.6
3.5
0.6 ▲
0.6▼
▲▲
-9
-1
0.6
▲-11.8
1
2.7
0.0
-19*
16
Globalscope
CitiFineurop SpA
10*
▼5
-10.5
5.2
9.5▼
6.8 5.2
0.0
-10.5
Barclays ▲
US$m
▲
1+1
1
0.6
3.2
0.61
▼
▲ .5
▲
▼
▼-
0.0-
0.00.0
0.40.7
265.3
7
.0
.0
-
33.116
+1
Mediobanca▼
HSBC Holdings PLC
▼▲
5
23*
▲
-
▲
2015 Rank
1
19*
+12
4.00.5
Market
57.84+1
▼-41.9
Any Spanish Involvement Completed (AF41)
1.2
MarketShare Ch.
10.0
Any Spanish Involvement Announced (AD34)
162.1
-
21
4
-
271.518
17.4881.6
# of Deals per Advisor# of
+1
15.315.3
4Goldman Sachs & Co
▲▲
10.9
1
550.2
8
9
Lazard
▲+1
PricewaterhouseCoopers1 -
Banca IMI (Intesa Sanpaolo)▲
5*
-45.7
2.32.32.3
Rank Value per Advisor (US$m)
15,381.2
9*-63.0
7.5
1
▼
▼▲
▼
-39.5-19.1
-30.2▲▼
▼
-3.11,348.0
6.6
1.23-
2.3
16
1,348.0
-
1.8
0.0
20396.3
Globalscope
190.2
1.818
KPMG 22* .0
SantanderCushman & Wakefield Inc
.0
Industry Total
0.0
Aguirre Newman SA22*22*
Leonardo & Co
.0Industry Total
1
19*-10.3
10
19*
746.5
136.1
8
17.5
5*
100 033 918 0
Jan 1 – Mar 31
▲
Share Ch.Market
▲45.4 ▲45.4
▲16.216.3-29.0
48.1 48.10.5
+2
+6
313
4
+3
92.0
2.5
201
1
1
0.5
41.2
2
--3
1.5
0.5
KPMG
1
7
▲
0.513
-2
2.00.5
-2
Leonardo & Co
▲
+1-6
23
▼
0.5
0.5
▼18
▼
▲
+11▼▼
▲
Rothschild
5,542.3
2,225.5
21Goldman Sachs & Co
9.914.0
8
7 16.35
2,529.84,565.9
13* 7,196.1
6
4
-
Rank Value2014 Rank
7
CitiMoelis & Co
LazardMorgan Stanley
8
16,318.3
Financial Advisor
2-3
HSBC Holdings PLC19,605.4
2015 Rank
10.9DealsFinancial Advisor
Market
▲1.51US$m
First Quarter 2015 | Mergers & Acquisitions | Financial Advisors
# of Deals per Advisor
UBS
Change in Rank Value per Advisor (US$m)
MarketSh (%)
1.5
# of
3Sh (%) Deals
-1.9
5,532.0
13.50
+2
3 1.5
-36.04.5
21.2
14*Deutsche Bank
Bank of America Merrill Lynch 91011*11*13
Mediobanca
NomuraSociete Generale
BBVA
0
Santander
-
606.2
2.3
1.5+2
Banca IMI (Intesa Sanpaolo)16
775.1 +1
BBVA 17 5Evercore Partners
114* -
619.0 ▼
▲
1.8 -44.8▲768.3
310.5
UBSEvercore Partners
15-0.5775.1
1,228.5 3.6
Ernst & Young LLP▲1.0
12*0.5
-9
Bank of America Merrill Lynch
11RBC Capital Markets▼
4.0 ▼-1
BDO 12*▼-11
# of Deals
4.0
9*
36
-
▲
▲
▼
4,759.4
13* 0
1.7Morgan Stanley
18.5
2014 Rank
20.81,050.4
Rank Value
▲Sh (%)
937.2 18.520.8
775.1
12.0
20.8
775.1 15.3
▼▼
481.2
31
1,052.8
▲
▲
2
▲
.0
3
8.4
14.8
265.317
5.4 5.4
-15
0.0
2.7
▼
▼-1
-1.3 -
6
0.6
▲
5.2
0.0
341.7
2.0.5
-6
172
+1
.5
.5
.2
+1+1
0.20.2
100.0-38 70.4
0.7
▼▲
▲0.70.7
▼
▲
0.7
1.61.40.7
2.5 ▲
0.7
▲1.80.7
2.8
1.2
▲4.1
0.2
2.5
▲▲
2.2
▲
0.0
8.9
6.2
6.7
3.6 5.16.3
3.25.1
FeesMarket
Jan 1 – Mar 31
Share Ch.
EMEA Rankings
0
▼
4.0
▲1.6
1.00.2
▲4.4
▲
4.7▼
0.0.0
6.1
▼
▲
▲
21 +11
1.20.6
5 ▼▼
-6
▲0
2-1
1.2 ▲+2
4.6
MarketSh (%)
▲▲
4.40.0
▲6.7
4.05.3
Advisor
▼ 7.5 16.5
Imputed Fees (US$m)Change in
--
# of Deals▲
MarketSh (%)
2.8
1
0.6
100.05,062.6
Rothschild Citi
Mediobanca
Industry % Change from Same Period Last Year
▲0.5 +1 ▲ 1.9 0.5 0.4
-1
▼
CBRE Holding SAS 25* 46* 226.5
0.50.2
0.2
0.2
# of Deals per Advisor
-47.6%
4
1.67
▼
Sh (%)Market
-9
0.2
0.914
0.7
1.1
41 +1
0.2
3
0.25
1.6
1.8
30.9
-12.8-6.5
0.5 0.5
-1.1
100.0
▼
-19
▼-11.2%
1
1
4.0▲
-6.1▼
-
14
1
-4.9
-21.71
-3.2
▼▼
1
▲5.95.9
▼490.1 1.1
2.7 2.3
▲1.1
1.122
0.91.1
6.7
▲
▲
2.9▼
7.0
15.9
▲ 192,661.6
37*2.9
-4.42
▲
2
▼▼
1.3
0.4▼
21
1,300.0-3.1
11▲
▼▼
78
▼
34
14,088.1
▲12.0 ▲
▲-42.3
▲
23.021.923.0
8-8.024.6
13,033.1
▼
▼13,988.1
22.9-
28.7
Bank of America Merrill LynchRothschild
22313
3
51.821 7 23,530.7
US$mDeutsche Bank
Sh (%)
0.5
23
▲
▼
Houlihan Lokey28
Ernst & Young LLP
-
566.4
0.60.5
2015 Rank
Industry % Change from Same Period Last Year
▲+61.8
0.7
▲
0.9
# of DealsChange in Advisor
-66.7%
0
-6
▲
▼+3
25.4
7.8▲
-2 11.7▼
+2-2
+2 ▲
19.8
-1
+1
▼+2
+1
12.3
▲
28.6
+2 ▲
▼
26.6
▼
▲
1.0▲
0.2.71.7
0.5
13.13.5 0.8
0.9
Fees
6.4
1.3
2.9
0.3
1.1
0.4
52.6▼
0.21.7
▲ 4.76.8
0.3
3.2
0.4
+1-1
-1-2
+1
▲
4.7
1.2
▼
▼0.9
▼
▲
Market
20.5
2014 Rank US$m
47.2%
1
Industry Total
Rank Value
▼
Any German Involvement Announced (AD35)
▲Industry % Change from Last Quarter -14.6%
2015 Rank
1Financial AdvisorDeutsche Bank
Sh (%)
UBSGoldman Sachs & Co
2
Rank Value per Advisor (US$m)
Industry % Change from Same Period Last Year
Morgan Stanley
12JP Morgan
5
3,817.217.5
2,977.343 16.0
114
15.5
3,261.8
5.3 5.3
2,645.2
8.79.2
989.8
+2▼
Puhl GmbH & Co KG-1
▲2 -72
▲
41
9,954.8▲
-44.5 ▼
0.2
Kempen and Co NV0.4
6
5.9
8,914.46,988.4
19.6
1,389.5
7.7
15.411.6
3,164.2
0.2
-14
▲
8.9
3.2
0.20.9
0.2
▲0.1
435
0.2
-4.2%
▲11.5
Ernst & Young LLP
10,431.4
31.4
2014 Rank
-
4
Change in
+2
Deloitte
Financial Advisor
18
▼
Industry % Change from Last Quarter
100.033,918.0
0.8
Market
0.6▲▼-4
# of DealsDeals▼-39.5
▲
Credit Suisse
▼11
414.2
9.2
BNP Paribas SA
Morgan Stanley
JP Morgan-1
Barclays
13.8
+1▼0.8
Gaw Capital Partners
0.4
971.0
-41.8 ▼0.7
▼-6.8
1.2-44.5
-41.8
1.3
10
12-
727.05.23.993.1
13
3Barclays 11
Nomura
2.6
8.7- 1,713.07
Lazard 41*98
10.1 ▲
Sumitomo Mitsui Finl Grp Inc
52,873.7
▼Citi
▲26 10.9
1,611.041*
2,028.2
▼
3.45.0 ▲
1.9
3.9
2.8
▲ 0.7▲
▲4.220.90.9
2
16.3Guggenheim Securities LLCGaw Capital Partners
1441*
▼7.06.6
1.3
Evercore PartnersGlobal M&A
+2
Bank of America Merrill Lynch 17*-
13* 220.1226.5
1.5
Qatalyst Partners 17* 220.1
Mediobanca
CBRE Holding SAS 1615Deloitte
41*
10
1920
0.6
▲
-6.8- 2
9.28.7
126.4
▲
109.0
1.2
▲
-36
10.6William Blair & Co
102.041*
-
0.6
-GP Bullhound LtdWilliam Blair & Co
77.024
Development Bank of Japan Inc 22*102.022*
8
102.0
18,595.3
2.6
▼-48.3%-67.6% ▼
Greenhill & Co, LLC 21
50.0Industry Total
-4.1490.1
-
280.0
-
156.841*
-4.1
5.3
▼
-45.2%
0.8
-
1.2243.6
566.4
-28.9
Jan 1 – Mar 31
+2
▼
201
Market
▼-10.3%
-23
# of Deals per Advisor
1.0Goldman Sachs & Co
-4-3
▲1.2
▼
3
0.2
▲
25*
▼
0.2
2
5
24 0.8
10.4
1.52.6
# of
-16.0 4
Sh (%)
▼
MarketShare Ch.
4
+1
30.2
▼
504
10.2
1
▼-6.7%
1.6 ▼
48.6%Industry % Change from Last Quarter
+1101.0
418.0
0.6
▲▼
2.10.5
.3
100.0
9.1%-34.0%
0.1
▲
▼2.0
▲0.0
0.2
▼▲
▼1.90.73.2
▼▲0.4▲
▼
1.70.4
-24.0%
45,389.1
-7270.2
-35.7%
▲
-36
▲
Lazard1.30.3
281.2▲0.4▲ 8 226.5
385.0
+2
0
▲+1
Industry Total
+1 24
▲+1
Jefferies LLCAon Corp
-
+1▼
-
Greenhill & Co, LLC▼
-1
-1▲
480.9
1
0.4
+1
▲2019
0.4
17
▲▲
10.2
+12,661.6
2▲
PricewaterhouseCoopers
15*
▲
0.2
15*
53
910
Bain & Co▲
+4
▼-18.1% ▼▼
6.52.7
12.6▲
27.03.9
▲-
25.3+1
3.5 ▲
▼▲1.7
11.2▲▲
▲
1.9
6.1
▲
1.70.97.1
0.3
▲
▲1.9
Imputed Fees (US$m)
6.1Sh (%)
MarketMarket
-78.2%
Share Ch.
Industry % Change from Same Period Last Year
25
Jan 1 – Mar 31
-85.1%
Market
Industry % Change from Last Quarter▼-76.1%
Share Ch.# of
Deals
Any German Involvement Completed (AF42)
818,187.3
Rank ValueRank Value per Advisor (US$m)
-0.031.040.1
12
23.0
1
6*10,431.4
3,495.9
30.8
6*
▲-10.2
+1
▼
6▼
1
11
▲
0.4
43
1,201.8
14 3,037.2
0.6
0.2- Nomura
5
2122
13
8
46*
5,253.6
UBS
▲ 2
* tie
https://www.thomsonone.com Visit http://dmi.thomsonreuters.com to view archives and order custom League Tables12

Nomura Citi
M&A International
.1-
.5 0.6
1113
▼-▲
+1+10
0.70.70.72.0
-3
▲-
▲-1.20.00.00.0
▼
-24*
1.4.0.0
23 --
0.00.00.0
▲
▼
Altium Capital Limited
19-
30*
▲▼
8
6
0.1
▲
▲
+2
-1
Change in
Banca IMI (Intesa Sanpaolo)Mediobanca
N+1
▲
▼
3▲
▲
Lazard
1,127.1
▲
30*
PricewaterhouseCoopers
▼
459.0623.6
9
Bank of America Merrill Lynch
Mizuho Financial Group
7
164.2
HSBC Holdings PLC
7.1
7.0
Deutsche Bank1,341.5
13
▲
136.1150.9
4
0.9-17.5
100 0
CFI
18*9
30*
-Commerzbank AGBarclays 16
223.3
--1
2
-29.1
3
56.3
6 567 4
68.5 0.7 ▼
0-2
-
1.3
0.7
▲
Ernst & Young LLP 80.9+2 ▲
+2-1
▲
1.2▲
1.3
0.7
+180.9
12
▼
0.7 ▲
1.2
19.015.6
7.5 -14.4
2.8
▼▼
1.72.3
2.8+2
-
10*Leonardo & CoUBS
10*
6
▲+1
Market
21.4
18.745.6
50.448.0 -6
5
Market
2
17
13*-
▼-0.517150.9
25
# of Deals per Advisor
US$m Sh (%)Market Market
EMEA Rankings
Deals Fees Share Ch.
0.2 ▼
.61.4
▲
▲
2.1
Sh (%)
Imputed Fees (US$m)
# of Deals
2.10.4
8.8
.3
0.5
-1.3
-
▲1.8
-
▼
3.0
-0.6
Advisor
2.6
.2-0.0
▲
0.1-
10.5
3.6
1.8
-
-0.2
▼
0.10.1
-
▲
▲1.6
▲
1.8
3.0
1.81.2
0
+1
.1
-▲
-
▲1.4
1.3
1.5
2.4100 0
▼
▼
84 2
.4
3.8
5.6
▼
0.3
▲
▼
8.1
0
1.6
5.2
▲+1
0.1Deals
0.7
5
152
5.3
1.3
Jan 1 – Mar 31
1
▼
Sh (%)
-14.6
9.5
▲1.3▼▼
Rank Value per Advisor (US$m)
-18.42
1,195.6
1
17.2
Financial Advisor
1.3
-3
▼
2.0▲
▲
+1
-1.8
Jan 1 – Mar 31
1.10.1 1
0.6
0.611
2
4,763.8
5
▼▼▲
8.0▲
6,319.0
2
45.611,417.2
12,605.7
5*3 11,417.3JP Morgan
1112,002.72
Mediobanca
2015 Rank
Bank of America Merrill Lynch
30*Goldman Sachs & Co
5,346.6
Share Ch.Sh (%)
Rank Value per Advisor (US$m)
Lazard
Financial Advisor
4
1
US$m
Any Italian Involvement Announced (AD36)
UBS
Rothschild
Rank Value
6 37*
Leonardo & Co
4,763.8
28*7
7* 35*
1,999.4
Deutsche Bank
3,897.4Credit Suisse
8
14Piper Jaffray Cos
UniCredit
9 30*1011
1,472.3
10 922.7161,228.115 18
9
1213
453.0
Equita SIM SpA 884.417*Citi 884.417*
12
Banca IMI (Intesa Sanpaolo)4.95.2
3.5
58.3 0.2
35* 3.5
Industry Total
Deloitte
Societe GeneraleAltium Capital Limited
35*M&A International
-19*26
22*
25
56.3
25.3
-
-11.7
1.8
- 5.9
3.73.5
0.2 0.6
0.1
KPMG
22*
-Klecha & Co-24Growin Partners Inc
19*
21
Credit Agricole CIB
35*
5.9
19.0
453.0
56.3 0.2
-15.12.3
9.9 9.52,472.2
4
# of
▲ Goldman Sachs & Co
Market2014 Rank
First Quarter 2015 | Mergers & Acquisitions | Financial Advisors
6.29▲
-18.2
▲▼
▲
2.8
215.4 ▲
▼
19.0 5-20.9
1.1
2.34
1.1
12
3.4
3.41.1
▼
▼
▲
0.6
1
3
6
1.1
▼ 3
+1+10.6
▲
0
12
▲
1.7
0.6
+1
0
▲
--
+2 ▲
-
▲
Industry Total
44.20.9
▼
-30*
Rothschild
Marsh Pty LtdIMAP
0.7
24*
21
56.30.9 1KPMG 56.318* 240.918*Deloitte
0
1
177
▲
0.9
0.8
▲0.5
780.9 1.2
1.2
0.9
0.7
2.3
-22.3
▲1
1
2.5
2.1
0.9
▲
22 2.0
2.3
32
12.1
16
58.3
13* ▲
2
11
1.21.0
▲-
8.4
-2
1.2▼
-1
-3
5.7▼▲
5.6
7.1
6.88.4
7
2.0
9.6
-5▼
▼-3
4.5
0.11.4 5.05.1▼
▲
▼▼ 0.3
0.34.4
▲7.0
6.5
0.7
▲
▼-9.9
0.2
▲
▲▲
▲0.10.1
1625 014 0 100 0
1.81.8
-0.21.8
28.311.8
0.2
13*
+4
2
+2
-4-3
3.46
-9 ▼
1.73
-7
1.7
6
6
+1
10.5
-25.7
21
+4
18.2
5▲
17.2
20.4
3.4
1,614.7▼
24.6 -22.7
+3
▼
-1
▲
MarketMarket
4.6
4.4-4
▼▲3.9
+10.7
-1▼▼1.3
-60.7▲
0.2 ▲26.9
-214.32
▼
36.4Share Ch.
3
0.7
2
Any Italian Involvement Completed (AF43)
1.3
# of
▲20.4
22,389.836.21,765.6
-7.7
5.1 +3
▲5
+25
45.4
43 ▲
Sh (%)Market Rank Value2015
RankChange in
# of Deals per Advisor
1,302.1
1,883.6
HSBC Holdings PLC
30*
2014 Rank
4# of Deals
JP Morgan1
PricewaterhouseCoopers M&A International▲
+43
▲
▲
▲
34
▼
▼18.6
100.0
899.120.4
37
Rank Value
22
47*
▼
8.3
▼
0.7
1.2
0.5
▲
-23.0
▲▼
1.4-2.31.9
-32.1
0
Sh (%)
Carnegie
▲
+1
0.6
-0.1
▲
-70.1%
1
3
4.6
6.4
-3 ▼
-
0.9
23
Danske BankCiti
2,845.42,797.034
SEB
1*50*
Lazard
50*
24
1933
Morgan Stanley
Catella AB
Mooreland Partners LLC
16*
7*
12
Rothschild
1423.0-
22
Lenner & Partners
Industry % Change from Same Period Last Year
202.3
9
NordeaProvidence Capital Inc
Carnegie
65.9
13
11
Deutsche Bank
7Deloitte
0.7 -22.9
1*
1* 1
65 5
281*
2014 Rank
3
4
1.2175.0
262
-
6,954.16,954.1
103.4
330.7 2.2
0.7125.1 0.9
184.01.4
103.4
171.6
16*16*
-
--
7*
14
ABG Sundal Collier
DNB ASA
Goldman Sachs & CoClairfield International
15Kepler Equities
21
23
LarrainVial SA
Moelis & Co
Industry Total
Industry % Change from Last Quarter
Ernst & Young LLP20 39
390
Mid-Capital24 19*
1.614,785.7
25
48.4
15.50
1.0+2
▼
0.3
1.0
1Advium Corporate Finance-100
1,287.0
11
11.6
▲
5.9
▲1▲
1,494.3 2
6,567.4
0.8
5.19.2
Advisor Market
-
0.9
▲
Share Ch.▲
0.5
▲
▲2.54.0
1.31.93.3
0.02.9
▲
1.75.2
2.5
8.3
4.95.1
▼
1.0
1.2 ▲
▼1.01.0
▲
0.5
0.10.3
0.8▼11.7
▲
0.2
0.4
3.8
▲
1.4▲
▲
▲3.3
Jan 1 – Mar 31
1.4
-54.4%
# of Deals
1.6
5.1
▼
100.0
Imputed Fees (US$m)Market
Sh (%)
▼
# of Deals per Advisor
84.20
-22.1%
# of
152
▲
+2
1*
13.5
7.6
1
▲
11.4
-US$m
▼
1,512.3
-72.2%
47*
8*
+1
-
5
▲
9.6901.6
844.5890.1890.1890.1
8.08.0
0
3
▲
-4
+1
1.1
18*0.4
-31
2202.9 3
2.11.1
2.5
▲
6.0
-▲▼
5.2
1.5
0.9
1.3 ▲
1.0
2.2
1.04.5 ▲
0.9
9.12.7
▲
▲9.3
8.0
5
1
4.5
37.6
▲
▲
0.2▲
1.0-3 1.7100.0179.4
▼0.8
1.8
▼
1.5 ▲
▼
-2.5
2
▲0.2
-4.1
0.0 -0.6
▼
▼
0.4
0.2
-1.2
0.7
0.4
9
▲
Clairfield International▲
0.4
0.8
Industry % Change from Same Period Last Year
▲
Deutsche Bank
+1-4
4
1*0.3
JP Morgan0.3
Pangea Property Partners AB 3-
13.7
-47.5%Industry % Change from Same Period Last Year
UBS
Industry % Change from Last Quarter
Financial Advisor1,512.3
Sh (%)
0+13
51.0
0.5
-▲
▼
0.3
2-
0.6
20.4
▼ 0.8
4 1.01 0.3
2
▲
0.8
2
1.8
▲1.21.2
▼
-10.6▲8
3,386.6
19.2
10 276.315
18.9
3,018.022.9
▲47.046.3
6,954.147.0
▼
1Deals
47.0
47.0
Sh (%)7.2 ▲
▲
Sh (%)# of
Share Ch.
Industry Total
Financial Advisor
Industry % Change from Last Quarter
2015 Rank
Any Nordic Involvement Announced (AD37)
Industry % Change from Same Period Last Year
6,954.1 47.0
Market
▲
103.4
US$m
20.6-2.7
0.9
▼
0.8
▼0.5
29
-43.2%
100.0
-30
26
-61.4%Industry % Change from Last Quarter
▼
0.1
-31.3%-20.4% ▼
1.3
+2
1
14
0.80.5
4
+3-16
0
-22.0%▼
53.7Nordea
▲
1.5▼
0.5
31
85.0
0.5
-1
-397
13.5
8.1
-
1,059.46
5.7
18 6*17
-
23*
14*3
▲2.4
626.0
0.5
20
8*
13
-3
8*
+1
ABG Sundal Collier▼
0
▲
-20.3
LazardChina International Capital Co
3.6▲
# of Deals
+2
▲
-
SEB
Nomura
▼+1 ▲
+1
13.7▼
▼▼
Rank Value per Advisor (US$m)Rank Value
▲
FeesDealsChange in 2015
RankMarket
Any Nordic Involvement Completed (AF44)
0.0%
# of Deals per Advisor
-20.6%
Rank Value per Advisor (US$m)
-
Market
Industry Total
MarketMarket2014 Rank Share Ch.
177
181.7%
Jan 1 – Mar 31
Change in
-16
84.2% -8.3%
Market
25,014.0 100.0
▲▲
23*23*
175.0
3.5
153.9
2
390.0
121.4
90.0--
0.7
11.4
▲
13.7
6
▲0.40.4
▲
▼-85.1 ▲
▼ 1.434
+2-30.4
-
Bank of America Merrill Lynch 524.9
4.0-11.0 3
441.5-3.8
Ernst & Young LLP
16
▲
.8
▼▲
--3
0.41.1
+1
▼4.0
1.7
▲0.98.3 1.5
2.2
2.24.6
1.10.4
-6.0 0.7▼
2.7
Rothschild 1.1524.910*
19 47* 301.7 .51▼
0.4 -2▲2.7 ▼+1
▲ 0.7 2.6▼ 2 6.8
+2▲▲
111.7 1.01.4
10.4
90.0 0.40.80.8
1.6
▲▲
0.7
▼
0.8
0.40.8
-6.7
0.3▲
-4
+1+1
▼4.9
0.8▲
-99
-25.8%
▲1
100.0
-54.1%▼-57.1%▼
-38.6% ▼
Industry Total 11,073.2
-1
▲
-
+2
-2-6
▼
+1
25 -36.185.0
Mooreland Partners LLC 21PricewaterhouseCoopers
Arctic Securities ASA
Jefferies LLCGoldman Sachs & Co
DNB ASA
CIBC World Markets Inc
Deloitte
22
648.212 28
0.3
▲▼
FTI Consulting Inc
114
284
1▼
▼
8.1
-31.0
+2
1.71.7
+1 ▲▼
1.88.1
0.47.9
▼
4.7 ▲
8.00.4
1.1
0+1
0
2
0
1.1
8.0 ▲
3
▲
4.7 14.74.4482.8
-22.1%
14*13
Visit http://dmi.thomsonreuters.com to view archives and order custom League Tables https://www.thomsonone.com * tie 13

Greenhill & Co, LLC Centerview Partners LLC
+11
▲
3▼
# of
▲ 3▲ 1
25.0
1,505.0
2,900.0
5.36.1
0.4
0.7 -2-2-1-3
1.40.4
+1
9.0
10.0
6.2
5.1
4.2
Guotai Junan Securities
6.1-54.2
9.0
5.2
4.9
9.0
8.0
1,428.2
-
1,787.0
5.3
Bourne Partners LLC
5.9
RBC Capital Markets
EFG Hermes Brokerage UAE LLC
4.2
0.1
6.9
5.21,505.0
8
-20*
4.91,341.5
5.2
5.21,508.2
1,929.9
1,759.2
4.6
6.7
--
23
1,994.5
24*
-
1,543.3-
4
56*
24*
HSBC Holdings PLC-
Rabobank NVJP Morgan
Citi43*
Nomura
22
18
Blackstone Group LP
Industry Total
18
20*
Mediobanca
19
Perella Weinberg Partners LP
30
17
Industrial & Comm Bank China
1516KPMG
2010*10*
Zaoui & Co
Lazard
6.5
2,613.5Oakley Capital Ltd
14
2,613.5-
7*
9
5
13 2,318.42,613.5
-
Societe GeneraleBNP Paribas SA
9.0
▲
3,997.4
Financial Advisor2014 Rank
10*
6 4
10.0 12
5
13*7* 11 3,997.4
4
4,314.1
5,669.5
5,190.89
Morgan Stanley
Goldman Sachs & Co
5,578.93Deutsche Bank
6,830.8
Barclays7
0.9
0.6
▼-2
▲
▲
+1
0.3
Bank of America Merrill Lynch
Goldman Sachs & Co
-1
# of Deals1.8 +4
▼
1.5 -1
First Quarter 2015 | Mergers & Acquisitions | Financial Advisors
▲
Market
5
Market
▲1.5
10,431.4
JP Morgan6
▲
-46.2 ▼
0.9
▼ +1
7*
5
10,431.4Puhl GmbH & Co KG
10,431.4▲
51
2
▼
0.3+2-1 Barclays
▲
Credit Suisse
▼10
7*Kempen and Co NV
4
▼
10.4
Market
6.4
1.2
▲0.3 ▲
5.1
1.6▼
6
1
▲
▲
▼▼
▼
23.6
.2
0.4
0.0
▲
+18.9 1.8
0.4
0.34.4
0.1
+2
▼0.9▼
1.8
2.5
12.0
1.9
15.7▼
1.54.8
7.3
1.99.5
▲
+10
▲
0.5▲
▲-
2.4
4.2
Market
51.1
4.9
▲
48.7
31.720.8
1.4
▲
▼
0.0
▲
▼3.6
.6
▲
9.9
Sh (%)8.2 4.8
AdvisorFees Share Ch.
1-29.7 6
14.5
▼10,485.4
4 -▲
21.4
▲
▼2.1
40.75.5
35
2.3
7.8
1.34.7
1.0
0.4
0.31.5
3.2
1.01.3
▲
▲
▼
-▲
0.3
▲
▲▼
1.9
▼7
2.1 ▼
-11.2
-6
▲
▼
3.9 -2
-50.9▲
▼
▲
▲
1,200.0
-40.9▲
1▲
1
1
▲▲
1
33528 906 5
1,200.0 ▲▲ 1
4.24.2
2▲
00.3▲
+1
▲+1
0.3
47
+20.3
02.1
2
3 0
1,341.5-
00.3+1 2.92.921
Industrial & Comm Bank China-
Industry Total
Mediobanca1,400.0
Banca IMI (Intesa Sanpaolo)
1,428.2
1,543.3 3.21,543.3KPMG
1,543.3
▲2.9
3.1▲
EFG Hermes Brokerage UAE LLC
-
15
14*16*
-
16*-
16*3
2322
-
20
1,127.1
-19
-25*24
-23.8 0.9-
2,713.224
5.55.52,670.3
4,798.5
7*
1,508.2
LazardHSBC Holdings PLC
9.822
1.2
26
+1Rabobank NV
3.2
9.0
+1
▼▼
-23.8
1.8
0.3▲3
1.23
27.6
13.8
Deals
19.6-19.6
14.918.0
▼
19.3-44.1
-61.413.8
Sh (%)
▼
Share Ch.Market
▼5
61
32
Rank Value per Advisor (US$m)
23.67Deutsche Bank6-21.5 ▼
Rank ValueUS$m
EMEA Rankings
Sh (%)
2
# of Deals per Advisor
Jan 1 – Mar 31Any Benelux Involvement Announced (AD40)
Bank of America Merrill Lynch
2015 Rank
7,971.5-40.2
Financial Advisor
155
5.2
5.5▲
Market# of Deals per Advisor
-
40.627.1
▲
4.9▲4.0
Jan 1 – Mar 31
2014 Rank US$m
MarketImputed Fees (US$m)
Any Benelux Involvement Completed (AF47)
Change in Sh (%)
Rank Value MarketShare Ch.
21,248.7 43.4# of DealsSh (%)
▲▲ 2.1
11.3
21.3
35.9
21.3
31.2
18,141.2
15,282.0
14* 37.017,569.9
0.4
1121.2
528.7
+10.40.7
1 +12
▲ 6.9 ▲
0.4
+10.9
+2 5.7
▲
▲
1.42 0.72.7
0.70.4
2.3 2.3
10.9
▲0.8 0.8
1.6 ▲1.2
1.61.2
4.5▲2.5
49 015 11.7
▲ +2 ▲
+1
1
28412
1.7
▲2.5
Jones Lang LaSalle Inc▲100 099100 0 493 2
1
▲
1,225.0
3.7▲▲▲
7.8
817.1
0.6
-0.6
UBS
▲▲
+1
Guotai Junan Securities
Moelis & Co-
100 0
3.2
7.2Citi
14-13
5.2 2.9
30.55 14,969.4
-
3,508.0
21.3
12 33
5,522.411
0.3
-
0.3
-
Morgan Stanley▼
-3
+2
-0
Change in
2
2015 Rank
1
Rank Value per Advisor (US$m)
Rothschild
1 0.4▲
8.8▼
27.7
▲
+2
▲
112.2
+2
▲
▲
11.30.7
▲
-23.8
1
0
+2
21.4
+4
1
5
▲
▲
7
▲
6Deals
▲
-18.0
6.4
# of
21.3
2
0
2
1,893.3
▲
1.1-21.8
0.4
4
2.518.0
-5.1
3.1
Houlihan Lokey
1.9
2.7
1.81.8
4.6
3.2▼
▲
▲1.13
+1
0.416
EMEA Inv. Announced M&A Target Sector by Value ($bil)
Industry Total 33528,906.5
▼
Industry Total
Industry % Change from Last Quarter-53.1%-44.7% -28.3% -3.8%
-155
▼
* tie
Industry % Change from Same Period Last Year ▼
49,015.1
87.9%
284
▼-6.9% Industry % Change from Same Period Last Year
Jan 1 – Mar 31 2015
▼ Industry % Change from Last Quarter▲
▼ -21.8%
100.0
49.1%▼
▲
-99100.0
-4.1%
493.2100.0
Quarterly EMEA Cross Border Volume
-25.5% ▼
$37.1
$24.8
$24.4
$22.0$21.5
$20.3
$20.3
$19.8
$15.9$10.0
$9.0 $8.2
Industrials Energy and Power Real Estate
Materials Healthcare Telecommunications
Financials Media and Entertainment High Technology
Retail Consumer Products and Services Consumer Staples
`
0
500
1,000
1,500
2,000
2,500
$0
$100
$200
$300
$400
$500
$600
$700
$800
$900
1 2 3 4 1 2 3 4 1 2 3 4 1 2 3 4 1 2 3 4 1 2 3 4 1 2 3 4 1 2 3 4 1
2007 2008 2009 2010 2011 2012 2013 2014 15
# of
Dea
ls
Ran
k Va
lue
(US
$b)
Inbound (US$b) Outbound (US$b) Number of deals
Visit http://dmi.thomsonreuters.com to view archives and order custom League Tables https://www.thomsonone.com 14

Lazard 9,944.8 2* 27.0 2
Bank of America Merrill Lynch 223.82,767.5 3
3Credit Suisse
2
Mizuho Financial Group
Deutsche Bank3,242.2
Energy and Power
3,379.3 21.8
28.5
Morgan Stanley2,430.6
25.3
Jan 1 - Mar 31 2015
2
14.8
4
33.3
2*
4
1
2
22
27.0
20.3
3
3
315.7
27.0
2
807 1
2
1,622
1,590
802
Announced M&A activity with Asian involvement witnessed a record high as deal value grossed US$229.6 billion, a 78% increase overthe US$128.4 billion recorded in the same period last year. China remained the most targeted nation in the region - reaching US$90.9billion from 1,024 deals. Companies in the Telecommunications sector were the most targeted, with US$61.9 billion accumulated from 46deals.
The announced acquisition by Cheung Kong (Holdings) Ltd of the remaining 50% interest in Hutchison Whampoa Ltd, valued at US$45.4billion, surpassed the prior record-holding Asia Pacific deal - CITIC Pacific’s acquisition of its state-owned parent, CITIC Group, valued atUS$42.2 billion in 2014. Asian buy-side financial sponsor M&A activity reached US$14.5 billion, a 12% increase over US$13.0 billion in the first quarter of 2014.Companies in the High Technology sector were the most targeted by sponsors, followed by Real Estate and Financials. Imputed Fees earned for the region were estimated at US$501.3 million, a 14.2% decrease from US$584.2 million recorded in the sameperiod last year, according to Thomson Reuters/Freeman Consulting. The top earner was Citi, with US$39.6 million, followed by CreditSuisse with US$32.0 million and Deutsche Bank and Bank of America Merrill Lynch, each with US$22.3 million.
China cross-border activity accrued US$28.8 billion, a 25% increase from the US$23.1 billion accumulated in the first quarter of 2014.Outbound investment volume reached US$23.5 billion, where companies in the Industrials sector were the most targeted.
Australian announced M&A activity increased by 88%, reaching US$37.1 billion; Australia’s cross border activity recorded US$24 billion,with outbound activity contributing US$15 billion of this total.
33.5
9,944.8
Asia Pacific (ex-Japan) Deals Intelligence Asia (ex-Japan) Involvement Announced Advisors by Target Industry
3.0
Huatai Securities Co Ltd
2*
DBS Group Holdings
89,655.2 Industrials32,288.0 Credit Suisse
CITICHigh Technology
4101,541.1
10,674.5 10,746.7 JP Morgan
UBSFinancials 1,201
No. Deals
12,579.9 1
Rank Val US$m142,367.4
ShareMkt.
Rank
39.22
Real Estate3Somerley
9,944.8
88,269.6 3,450.3
1,300.0
JP Morgan 1
Rothschild
1
600.0 1
Mediobanca
1 71,364.6 75,666.2
1
A Record Start For Asian M&A I Imputed Fees Down 14% I Australian M&A Up 88%
10,494.8
First Quarter 2015 | Mergers & Acquisitions | Financial Advisors
Asia Pacific (ex-Japan) M&A
6.76.4
China / China
Financials / Other Financials
Energy and Power / PowerReal Estate / Other Real Estate
Acquiror / Target Nation
Pending CITIC Ltd (10%)Israel / Singapore
China / Netherlands
Jan 1 - Mar 31 2015
Hong Kong / Hong Kong
Industrials / Automobiles & Components
3,242.2
Telecommunications / Wireless
Top Ten Any Asia (ex-Japan) Involvement Announced Deals
Hutchison Whampoa Ltd (50%)Acquiror
Pending
Asian Completed M&A by Region - Imputed Fees
5,924.0Hong Kong / Hong KongChia Tai Bright Investment
Italy / Italy 7,913.8
4,433.3Energy and Power / Power
Financials / Other Financials
Philips-LED Components Bus (80.1%) Investor Group Industrials / Other Industrials
1/7/2015 Kenon Holdings Ltd (100%)1/20/2015
3/31/2015
1/6/2015
Pending
Pending3/22/2015 Intended
Pending
Cheung Kong(Holdings)Ltd
2/17/2015 Pending
1/23/2015Bidco SpAPirelli & C SpA (73.8%)
45,410.81/9/2015
China Cross Border Announced M&A
1/20/2015 CITIC Ltd (11.8%)
O2 PLC (100%) Hong Kong / United Kingdom
Rank Date Date Effective Target (% Sought/Acquired) Target Macro / Mid IndustryRank Value (US$m)
China Erzhong Group(Deyang) (100%)
Telecommunications / Telecommunications Services
2,900.0Sinomach
Chia Tai Bright Investment Hong Kong / Hong Kong
Hutchison Whampoa Ltd
2,971.7
15,381.2
ShareholdersIndustrials / Machinery
2/6/2015 Intended Kaisa Group Holdings Ltd (50.8%) Sunac China Holdings Ltd China / China 2,792.0Pending Longtan Hydropower Dvlp Co Ltd (100%) Guangxi Guiguan Elec Power Co China / China 2,767.51/30/2015
0%
20%
40%
60%
80%
100%
$0
$10
$20
$30
$40
4Q08
1Q09
2Q09
3Q09
4Q09
1Q10
2Q10
3Q10
4Q10
1Q11
2Q11
3Q11
4Q11
1Q12
2Q12
3Q12
4Q12
1Q13
2Q13
3Q13
4Q13
1Q14
2Q14
3Q14
4Q14
1Q15
% O
utbo
und
Ran
k Va
lue
(US
$b)
Outbound (US$b)
Inbound (US$b)
% of Cross Border is Outbound
$0.0
$0.1
$0.1
$0.2
$0.2
$0.3
$0.3
$0.4
$0.4
$0.5
4Q10 1Q11 2Q11 3Q11 4Q11 1Q12 2Q12 3Q12 4Q12 1Q13 2Q13 3Q13 4Q13 1Q14 2Q14 3Q14 4Q14 1Q15
Impu
ted
Fees
(US
$b)
North Asia South Asia Southeast Asia Australasia
https://www.thomsonone.com Visit http://dmi.thomsonreuters.com to view archives and order custom League Tables 15

Rothschild Northeast Securities Co Ltd
Financial Advisor
First Quarter 2015 | Mergers & Acquisitions | Financial Advisors
# of Deals per Advisor
Deals Sh (%)Market
0.60.8
Ernst & Young LLP1.6
0.12.8
4.1 ▲ 0.60.1
Industry TotalGrant SamuelMalayan Banking Bhd 5.9 1.2
RHB
0.5
GCA Savvian Group Corp
Asia (ex-Japan) Rankings
DBS Group Holdings 2 2,430.6
Jan 1 - Mar 31Any Asia (ex-Japan) Involvement Announced (AD25)
25 1.1 -10.1 - ▲1,841.9 ▲0.2 0.22▲
0.21 183100 0
▲ 2 +1 ▲+225
0.22.01.8 .9▲1.8
1.210.0
1.924-152.0
PricewaterhouseCoopers 22 15 3,004.2
0.2-
▼-7.31.1Haitong Securities Co Ltd 24 6 2,455.9Tudor Pickering & Co LLC
851▲1.3 0.7 ▲2.0+1Zaoui & Co 23 44 2.0▲ 10.02,900.0
▲+1 ▲ 14.4 2.92,360.9 2.4 5 2.69.0
23 ▲2.00 2,000.0 0.1▲
2.60.4
▲2.3-3.4 ▲▼ 3 0.3 +2
▲0.81.81.1 ▲
▲ Gram Capital▲DBS Group Holdings
-▲2,606.2
0.55▼ 2▲ 0.4
0.2 ▼+5China Securities Co Ltd 20 48 4,104.7 1.8
0.2Citi 4,370.2 ▼1.90.33.6
1.7-419 34,854.6 Industrial & Comm Bank China2.1 2.1 3.43,426.2 -2.2
UBS 7-10 3.1 ▼8.6 1.3▲2.10.3 12
-5.1▼+8
Credit Suisse 1717.9-918Guotai Junan Securities
5,795.7 2.5 -2.5-
0.3-1▼▼ 25
17 +23,919.0▲ 18
▲▲4.13.9 3.9
0.6▲ 6.7 1.21.34
2.8-20.1 116
120*0.3 4.1-
0.1Deutsche Bank 16 7 7,148.7 3.1 114* ▲▼
2.1 ▲ 2.5-10.1 0.5 ▼12.80
0.5 ▲1
▼▲
▼Mediobanca 15 - 9,944.8 4.3 ▲4.3Morgan Stanley 14
0.0 -12 41 6,063.2 6.1 5.4
0.4Lazard
▲ 3 0.1 15 1.30.1 -5 ▼ CITIC
9,956.2
▼30 10,957.2
4.3 -7.6
4.9
▲
12 4 11,133.4-1.6 ▼813
+1113 ▼ 1.8
▲4.9
0.83-3.94,929.4
▲+5 ▲ 9.5▼
-2 ▼1.99
1.9 ▲22.3▲0.1▲ .5
4.54Nomura 11 3.31921 6.410 27 13,915.9 6.1 5.1
0.33 +3
32.0-
Deutsche Bank5.3 ▼ ▲ 0.3 -66.9
7.67,611.7 6.40.8 0 -▲ 0.3▼
0
39 15,381.214,281.0
0.3-4.7
6,852.2- 10 6.9Credit Suisse 90.3 +1
Moelis & Co 8Bank of America Merrill Lynch 9 8 9
RBC Capital Markets1▼-2.0
8.18,100.0▲7 4
▲8.1 ▲ 1 1.4 1.4▲
0.1 +1 ▲ 6.8▲+1 ▲ 1.0 0.20.28,100.0Wells Fargo & Co 7*
-0.5
7*0.0 -5 ▼8.1 ▲
5 0.40.118.1
▼▼-4.8 22.317.65 ▼▼-5.4
+7
▼0.4 -84.5 1.13.5 3.9
▼-4CITIC 40 16,087.6 7.0
8,210.5-
6-711 0.57
6 0.38.2
5 8,226.9 8.2Bank of America Merrill Lynch 3
2UBS 5 36 27,966.7 12.2-32 0.214 8,666.2
11.4 +3BarclaysGoldman Sachs & Co▲
▲ ▼▲8122.1 ▲
513.519.8 4
3▲4.2 0.8▲ 8.7▲▲
2.311.7+6 2.4
▲0.61.2 +10 ▲ 3.1 0.68.7
10,586.20.6 2.578,711.9 8.6
▲12.5▲
0.8▲522.722.2 0.49
2010.1
▲ 2Huatai Securities Co Ltd 10.6 7.8 14
US$m2015 Rank
2014 Rank Sh (%) Deals
HSBC Holdings PLC 1 10 62,960.5 1019.419,379.61 ▲
MarketChange in Advisor
▲7.9 5.239.6+2Share Ch.Sh (%)
MarketUS$m
MarketMarket Market# of Deals FeesSh (%)
Market
24.7
Financial Advisor Sh (%)27.4 ▲
▲
# ofRank ValueRank Value per Advisor (US$m)
MarketShare Ch.
Change in # of Deals
# ofShare Ch.
Somerley
4.1
15
10.46.3 12
3.4 ▲12,259.7
▼
4.12
5
0.5 14*ICICI Bank LtdEvercore Partners
4,068.7
8
11
Goldman Sachs & Co 3 5 50,772.0
▲ +20.6
Citi
Imputed Fees (US$m)
▲
19.8
JP Morgan 6
45,486.4
Rank Value per Advisor (US$m)2015 Rank
2014 Rank
Rank Value
Huatai Securities Co Ltd
Mizuho Financial Group -34.8▼
2 20 56,660.6 +3
3.9
Any Asia (ex-Japan) Involvement Completed (AF32) Jan 1 - Mar 31
# of Deals per Advisor
12
Anglo Chinese Corp Finance 4 148*
23,918.5
2,827.6
-19
0.50.7
6-5.10.38
-7.6
0.7
2.8
17
2.8+6
▼ 2.217
61
4,068.7
▼-
Anglo Chinese Corp Finance▼
19
▼
120*
▼ China International Capital Co9
3,125.7
11-47 6,410.5
0.40.2
11
0.2▼
1.4
-2.2
-2+3
▲5.6 ▲
100 0
-2
▲
3,032.7
+157
▲
11
21 64
7
-5 ▼4
1.3
▼
6.7
▼
▲5.9
▲6.2
1.3
+2
+14
14*
22
▲
▲2021 10*
4,068.724
100 014 1
1,985.2
2 325 1 183 501 3 100 0Industry Total 229 603 9
Deutsche Bank Lazard
Industry % Change from Same Period Last Year
Industry Total
0.80.0
12.62.5Fifth Third Bancorp
▼
2.7
▼
0.40.2
▲78.4%
-119,320.2 ▼
0
Rank Value
Industry % Change from Last Quarter
Financial Advisor
12
Mizuho Financial Group
31
Macquarie Group 1 7US$m
Rank Value
1
11.4
Rank Value per Advisor (US$m)
▲
Rank Value per Advisor (US$m)
US$m
3.7% ▲
6*
Goldman Sachs & Co5
Bank of America Merrill Lynch4
Gresham Partners
9
-49.0
-12.1
UBS 2
26*
5
-
2
19
94.4
557.0
-5.0
2.1 10.3
▲▲
0.3
8
-1
653.8▲ 9
▲
Citi-16.2
4.9
5.9▲
▲
▼6.2
-2.511.0
8.0
34
5.25.204
1.0 -6.010
719.0
# of
8
1
23
0.5
3.6
1.4
2
4
Change in
▼Fees# of Deals Sh (%)27.9
Advisor
-5
▼
# of Deals per Advisor
-28.0%
Share Ch.
Imputed Fees (US$m)
DealsMarketSh (%)
2015 Rank
MarketMarket2014 Rank
36.6% ▲
Sh (%)
Jan 1 - Mar 31
-27.6%▼
Any Australian Involvement Completed (AF31)
▼-
Industry % Change from Last Quarter
▼11.41.4
-9 12.41.8▼-4
▼4.0▲3.017.3
Market
7.7
Share Ch.Market
▼-14.2%0.0%
-1,183100.0
606.2 1.6
0.9
▲
0.91.0 ▼
1.6
25
88.1%Industry % Change from Last Quarter
Industry Total
▲
1,833.5
40.3
Greenhill & Co, LLC 12
Jones Lang LaSalle Inc
14Cenkos Securities PLCAzure Capital
BBVA
Mitsubishi UFJ Financial Group
JB North & Co Pty LtdBank of China Ltd
Industry % Change from Same Period Last Year
37,140.6
24 378.0-
339.9
1.621*
606.2
100.0
Santander
-28.5%
100.0
927.9 ▲
2.91.9
7.2%
Change in
▼
38.552.0 ▼
# of
+157
Jan 1 - Mar 31
MarketDealsSh (%)
6
# of Deals
# of Deals per Advisor
Share Ch.43.9
2015 Rank
2014 Rank
MarketSh (%)
Any Australian Involvement Announced (AD24)
3-1 ▼
Market
1.0
Rothschild 11
Moelis & Co
213
2.63.5-
-
10Citi
6,021.2 6.3
18.3
6,021.26*
8Lazard 66*
4,960.5
6,021.2
▲
8,374.4
6,083.96,803.7
13.4
▲▲
14,305.6
16.2
-16.7▲ 1.6
3
16.42.5
0.3
0.3
16.21
4,073.6
▼▲
16.213.616.4
3.722.68
Goldman Sachs & Co
-0▼
Bank of America Merrill Lynch
Financial Advisor
Credit Suisse-1
1.2
▲
1
11
0.9
-2.8%
100,014.1
▲7.1
-4
0.5▲
▲
1.0
3.8
▲
▼0.5
5.8
▼
▲▲ 1.8▲
3
+10.9
0.1+1 ▲
9.1-1 ▼ 5.6
▲
0.4
▲
1.1
1.7 ▲
▼
7.1
2.5
2.5
▲
3.6
-3
4.0▼ 2.0
1.4 ▼
▲
4.4
-37.7%
8.0
2.3
-1-10
▲
161.2
1.4
2.30.8
3.4
0.9+2
+1
+1
1.6
▼
3.6
▲▲
▼
65.7
▲
▼
5 6.1
▼
▼ 2▲▼
+1
1
▲0.9
▼
0.52.3
1
4.9.2
3
0.9
+2
▼
0.5
0.9-30.9
▲
0.9
+1
1.4
0.5
▼9.0% -33.2%-27.5% -29.2%
▲
69.2
▼0.3
10.3
Miro Advisors Pty Ltd
-0.2
0.60.3
RothschildJP Morgan
67 1,210.8
854.5Mitsubishi UFJ Financial Group 8
1,256.46
4
8.15
11
4
1,905.2 17.914
17.711.8
UBS 2 2,415.9 22.631,931.63
Grant Samuel
-14.415.6
1 3,277.2 30.72
1,907.818.117.9 -1 ▼ 5.5
2,325
-17.4 ▼-10.7
▲5 +5
-3
▼▲
-20.3 +1
1
0+2
1
131.2
1.81.5157.3
190.3
▼
1
-6.78.0
▲
+1
12
11
27 1.4KPMG 13
7
1.651.3
-
▲ 16
▲
0.60.7
17* -
21
1.1131.2
58.2
115.6
0.50.4
0.6
▲
22
21
Maxit Capital LP
▼
52.9
-0.0
▲1.2
1.1
▲0.6
1.2
-
▲
2.1762.0 2.1
1
+1
1
26
1.2-
1.3Greenhill & Co, LLC 22*
17*
134.0▲
- 2.6▲ 15+1
14▲2.3 0.3
▲
China International Capital Co 2.12.3-15
16* -854.5762.0
16*
Barclays14 -2
19*16*
1.4 226*
-
-
762.0720.0720.0
2.12.11.9 1
606.2 1.6
▲
1Evercore PartnersMorgan Stanley
▲1.1-
21*
-- 190.3
-21*19*
1.6
1.9
▲▲▼
1.6
3523-6 24Greenstone Partners
0.6
0.3
+20.6▼
+1
+1
+1
▲▲
Clarus Securities Inc.
20▲
Deutsche Bank
PricewaterhouseCoopersStrutt & Parker LLP
BDO
1,521.4 3.3
Moelis & Co▲3.5
+21,305.4 0.3
4.1
960.5 1.0
Macquarie Group7 12 472.0
144.9 1.4▲
+6+1
▲+1
▼▲
▲
2.3▲-10.5
0.5.9
0.2▲
0.2
▲
1.2
0.1
0.5 0.6
▲
▲
▲
0.5
0.10.2
▲
+1
▲
0.60.6
0.90.2
▲0.2
▼▲
▼
-
.6
1.5
100.0
0.31
5
2
1
-11.6
2.2
0.6
2
11
0.8
3
-18.5%▼
-55.4%▼
100.0
-11.8% ▼
▲20-
+1 .9.2
.4
.1▼
1.5
▼
0.1.4
▲
1,183 501.3
2-
▲
0.2
0.5
-00.6▲
0.5
-500.4
.825 45.6 ▲
-33.4%
1.4▲
+1-▲
▼
2
Deloitte
134.0 0.3 ▲ ▲10,671.6 221
1.3
Industry % Change from Same Period Last Year
Akira Partners LLPIndustry Total-42
25
▼
-
Industry % Change from Last Quarter
1.2
100.0
1.5+1
Industry Total
Industry % Change from Same Period Last Year
229,603.9
PricewaterhouseCoopers 1.5
314
+1
Visit http://dmi.thomsonreuters.com to view archives and order custom League Tables https://www.thomsonone.com * tie 16

▼
Greenhill & Co, LLC
Financial Advisor
14.81
14.818.2
UBS5
Any New Zealand Involvement Completed (AF46)
▼-93.6%
Goldman Sachs & Co
Industry % Change from Last Quarter
PricewaterhouseCoopersStirling Coleman Capital Ltd
BarclaysBank of America Merrill Lynch
▲
563.884.3
▲
Share Ch.2015 Rank
756.4%
▲10.2
Rank Value per Advisor (US$m)
▲4,665.9
2014 Rank
Asia (ex-Japan) Buyside Financial Sponsor Activity
Industry % Change from Same Period Last Year
MarketShare Ch.Sh (%)
1▲▲18.2
Deals
Change in
# of Deals
5
▲0
+1
3.0
Market
Jan 1 - Mar 31
▲1
3.0
-63.3%-26.7%
1
1
# of Deals per Advisor
133 -12
2.5 6.4 ▲84.3
4,665.9
90 4%
Haitong Securities Co Ltd- 6.4
100.0
1 6.484.3
6.4▲
▲
11.0Industry Total
JP Morgan4,665.9
-
US$mGoldman Sachs & CoFinancial Advisor
▲▼
65.3
1.4
14.8
Industry Total
▲11.8
▼
-2.0- 6.2
-2.3.0 0.0
# of
2*
Industry % Change from Last Quarter
2*▲▲
22.2
Rank Value
+1
# of Deals
▲
▲Deals
3.7
2
Market # of
84.3 3.7
Sh (%)Sh (%)85.5
84.3
-
Jan 1 - Mar 31
Rank Value per Advisor (US$m)
First Quarter 2015 | Mergers & Acquisitions | Financial Advisors
+1Macquarie GroupSh (%)
Asia (ex-Japan) Rankings
Rank Value
1 -
MarketUS$m
2* 14.82.71.4
100.0
3
Share Ch.▲7.4
MarketAdvisor
17.9
MarketFees
+1110.2 11.0 ▲
1 +1 19.27.6+1
39.5
▼
1 1*-- 19.2
45.2
Imputed Fees (US$m)
3.0
▲
+1▼
Change in Market
-43.0
14.8
▲84.3
Sh (%)29.7
13.7
-59 7%-15.6%
27
▼
▲4.3
0 0%
▲
# of Deals per Advisor
+1
3.0
-5
186.2%
Industry % Change from Same Period Last Year -60.4%
▲
▲+1
3.7
▼
2.5
2*
Market
2*
▲
100.0
80.4
-
5,535.5
4,731.2
441.4
▼
6 4
Any New Zealand Inv Announced (AD39)
-
2015 Rank
65.3
4
2014 Rank
$6.0 $3.1$9.6
$0.9 $3.5 $6.0 $8.9 $5.9$13.0 $14.5$7.4
$4.0
$3.9$3.9
$6.6
$13.3
$8.2
$17.9
$4.4$3.9
$5.1 $3.3
$8.1
$11.0
$6.6
$31.7
$7.4$2.3
$2.8
$17.3$5.9
$3.1
$9.6
$18.3
2.3%
3.1%
7.8% 9.3%
10.3%
8.0%
11.1%
7.7%
14.5%
8.5%
0%
2%
4%
6%
8%
10%
12%
14%
16%
$0
$10
$20
$30
$40
$50
$60
$70
$80
$90
2006 2007 2008 2009 2010 2011 2012 2013 2014 2015
% o
f Asi
a (e
x-Ja
pan)
Vol
ume
Ran
k Va
lue
(US
$b)
Q4 Volume (US$b)
Q3 Volume (US$b)
Q2 Volume (US$b)
Q1 Volume (US$b)
% of WW FS Volume YTD
▲* tie
90.4% -Industry % Change from Last Quarter
Any Asian (ex-Japan) Involvement Announced M&A by Target Industry ($bil)
▼
Australian Cross Border Announced M&A
-59.7% 0.0%
27%
16%
14%9%
7%
6%
6%
5%4%
3%2%
Telecommunications Industrials Financials
High Technology Real Estate Materials
Energy and Power Healthcare Media and Entertainment
Consumer Products and Services Consumer Staples Retail
Government and Agencies
0%
20%
40%
60%
80%
100%
$0
$10
$20
$30
$40
4Q08
1Q09
2Q09
3Q09
4Q09
1Q10
2Q10
3Q10
4Q10
1Q11
2Q11
3Q11
4Q11
1Q12
2Q12
3Q12
4Q12
1Q13
2Q13
3Q13
4Q13
1Q14
2Q14
3Q14
4Q14
1Q15
Out
boun
d
Ran
k Va
lue
(US
$b)
Outbound (US$b)
Inbound (US$b)
% of Cross Border is Outbound
2006 2007 2008 2009 2010 2011 2012 2013 2014 2015
Visit http://dmi.thomsonreuters.com to view archives and order custom League Tables https://www.thomsonone.com 17

DeloitteSEB
Morgan StanleyBank of America Merrill LynchSumitomo Mitsui Finl Grp Inc
* tie
1
2,773.6
13,005.1
Lazard
Materials
First Quarter 2015 | Mergers & Acquisitions | Financial Advisors
Japan M&AJapanese Outbound At Record High | Financial Sector Drives JP Activity | Domestic Deals Lowest since 1998
6,021.2
6,122.6 1
88.9
Rank Val US$m
Gresham Partners 2*47.1
35.7
6,021.2 2*
Mitsubishi UFJ Morgan Stanley46.5
Industrials
Lazard
Mizuho Financial Group
60.771.9
No. DealsRank
15,166.9 23*
Share
Japan Deals Intelligence
10,357.2 12,263.9
17,062.8 1
UBS
FinancialsMizuho Financial Group
The value of announced M&A activity with Japanese involvement increased 21.2% over first quarter 2015, recordingUS$51.1 billion in value, marking the highest first quarter volume since 2005 (US$71.1 billion).
Despite the weak yen, Japanese outbound activity reached a record high, grossing US$36.9 billion from 155 deals, a65.6% increase over the US$22.3 billion recorded during the same period last year. Eight out of the Top 10 deals forthe Japanese market’s overall activity during the first quarter were outbound transactions. More than half of theoutbound deals were targeted to Asia-Pacific, with 52.3% market share worth US$19.2 billion from 67 deals; followed byEU with 24.5% market share, recording US$9 billion from 37 deals; and the US at 23.2% market share, recordingUS$8.6 billion from 49 deals.
The Financial sector led Japanese M&A activity, with 52 deals totaling US$17.1 billion. The concurrent acquisitions byChia Tai Bright Investment (jointly owned by Itochu and Charoen Pokphand Group) of a combined 21.8% stake inCITIC Ltd. for an aggregate US$10.4 billion drove the sector and represented the largest investment made by aJapanese-controlled entity into China on record
Japanese domestic deals declined 29.4% from the comparable period in 2014, recording a total of US$11.5 billion invalue from 553 deals, which was the lowest first quarter volume since 1998 (US$3.2 billion)
According to Thomson Reuters/Freeman consulting, total estimated fees generated from completed Japaneseinvolvement deals totaled US$327.1 million, a 36.1% decrease compared to the same period last year.
Japanese Involvement Announced M&A - Top Advisors by Target Industry Jan 1 - Mar 31 2015Mkt.
Nomura
1 46.3
2
52 9 4
4
4
2 2 2
46.3
114
1
1
1
3,625.6 2
2,321.7
162
2
7,761.9 High Technology
3,608.6
62 3* 35.7 1
3,056.8
3*
32
2,773.6
2,213.3 1 2 76.0
8.8 6
46.7
72.4
Bank of America Merrill LynchCITICSomerleyJP Morgan
60.73* 60.7
269.5
3* 60.7 2
10,357.2 10,357.2 10,357.2 10,357.2
3* 60.73*
CITIC Ltd (11.8%) Chia Tai Bright Investment Hong Kong / Hong Kong 5,924.0
Target Macro / Mid Industry
Financials / Other Financials
China Food Investment Corp (%)
1/20/2015
Pending1/20/2015
2/10/2015
Pending
PendingPending
2/26/2015
2/18/2015
Intended
AcquirorTarget (% Sought/Acquired)Rank Date Date EffectiveTop Ten Japanese Involvement Announced Deals
3,000.0
Any Japanese Involvement Announced M&A
Higo Bank Ltd (100%) Kagoshima Bank Ltd1/22/2015
Acquiror / Target NationJapan Post Co Ltd
Chia Tai Bright InvestmentMizuho Bank Ltd
Japan / Australia
Completed
Pending
3/11/2015
3/27/20152/23/2015 Pending
PendingPending
3/3/2015Domino Printing Sciences PLC (100%)
Toll Holdings Ltd (100%) 6,021.2
Industrials / Machinery
High Technology / Software
1,478.2Brother Industries Ltd
Materials / ChemicalsFinancials / Banks
Japan / United States
DMG MORI GmbH Germany / GermanyIndustrials / Machinery
Consumer Products and Services / Professional Services
2,773.6
1,793.7
Industrials / Transportation & Infrastructure
Any Japanese Involvement by Market
China Food Investment Corp
DMG Mori Seiki AG (75.7%) 1,611.0
Japan / United States
1,353.0Japan / United Kingdom
Japan / Japan
2,213.3Japan / Sweden
Japan / JapanPolypore International Inc (100%)
Canon IncAsahi Kasei Corp
4,433.3Hong Kong / Hong Kong
Rank Value (US$m)
CITIC Ltd (10%)Royal Bk of Scotland-Portfolio (100%)Axis AB (100%)
Financials / Other FinancialsFinancials / Credit Institutions
Jan 1 - Mar 31 2015
$26.9$50.3
$34.0 $23.5$35.2 $38.8 $37.0
$25.6$42.1 $51.1
$51.8$31.1
$37.1
$21.6$19.2
$45.9 $40.1
$32.9
$32.4
$22.5$28.7 $47.6
$42.4$50.3
$50.2$42.4
$39.8$24.4
$48.5$51.9 $28.7
$38.8$30.2
$50.5$59.4
$35.2 $30.4
0
500
1,000
1,500
2,000
2,500
3,000
3,500
$0
$25
$50
$75
$100
$125
$150
$175
$200
2006 2007 2008 2009 2010 2011 2012 2013 2014 2015
# of
Dea
ls
Ran
k Va
lue
(US
$b)
Q4 Volume (US$b) Q3 Volume (US$b) Q2 Volume (US$b) Q1 Volume (US$b) # of Deals YTD
100
200
300
400
500
600
700
.0
5.0
10.0
15.0
20.0
25.0
30.0
35.0
40.0
1Q12 2Q12 3Q12 4Q12 1Q13 2Q13 3Q13 4Q13 1Q14 2Q14 3Q14 4Q14 1Q15
# of
Dea
ls
Ran
k Va
lue
(US
$b)
Domestic Inbound Outbound Outbound Inbound Domestic
https://www.thomsonone.com Visit http://dmi.thomsonreuters.com to view archives and order custom League Tables
18

Imputed Fees (US$m)
Financial Advisor
Gresham Partners
▲ +4 714.8660.2
44.9
First Quarter 2015 | Mergers & Acquisitions | Financial Advisors
Development Bank of Japan Inc
-2
-4 12
Jan 1 - Mar 31
Centerview Partners LLCSumitomo Mitsui Finl Grp Inc
0.4+21.5
1.12120
4.30.31.3▲
7.32.3
0 -
0.8
3
718 721.7Equita SIM SpA2
- Mitsubishi UFJ Financial Group
▲0.9
16
-
586.0
2.8
265.0
▼▼
6
▼Mizuho Financial Group 1,492.7
▲
2.1▼
-4.316
Moelis & Co2.5
866.5 ▲1.7
▼▲
+4+2
-34 0.5
Credit Suisse
2,974.4
3
5.3
Nomura
Rothschild
17414.5
2.1
17
23*265.02 0.3
▲ +2 265.00.3▲ ▲
65*
-1.3 ▼ 14
-2.9
Any Japanese Involvement Completed (AF23)
▲
0.9
7
10 1,072.2 2.1 ▼Scotiabank▲
Carlyle Group LP0 3 0 90 9+2 25 ▲53
239 7▲Qatalyst Partners 25 1 4 ▲1 4
Mediobanca 23* - 866.5 1.7▲2.1
1.722 - 1,062.2
Goldman Sachs & CoGreenhill & Co, LLC
212.1
▼PricewaterhouseCoopersUBS 1.5
2.44
9
22*3▼
▲ 0.4 +30.5 ▲
3.1 2.12.4
16-5.7
+1▲ JP Morgan▲ 1.6
- 2,477.5
HSBC Holdings PLC 20 -PricewaterhouseCoopers 19 14 1,564.0
1,200.0
4.918 63* 1,585.5 3.1
-12 0.3 +1 2.33.1
2.4
▼-1.2
▲Daiwa Securities Group Inc▲ -11.2
791.9
-13.0
5.47.4-0.9 2.2 +59.87.515 8
3
2.60
5.538
1,544.8▼
6.0+8
KPMG1.00.3
▼29-8.010
6.3
0.1 +1
-6+5 12
13 6.11,740.1▲
Deutsche Bank1,785.321 11
4.7
0.8
10.911.1 +111.13,154.5
▲▼
35* 14.4
▼0.3
-16.7
3.018
▲
2 0.5
1
0.314.4 +114.4 0.3▲
16*4,068.7
42
0.3
0.51
-17.5- ▲
9
0.8
▲▲
20.3 +22
0.66
+2 ▲
Ernst & Young LLP▲GCA Savvian Group Corp▼Evercore Partners
-6
1
-14.3
54,068.7
▲15.5
4.410▲ 1.3
+1Nomura
4,546.42
5
-6.8
+316.1
+3
Goldman Sachs & Co8
Mizuho Financial Group
Bank of America Merrill Lynch
8
▲6*
4
1
5.714.4
SEB
9
-
13*
4
JP Morgan
1
▲
-
45
4,399.18
Mitsubishi UFJ Morgan StanleyCiti
4.2163
4,075.3
Lazard
497.8
8.54,337.7 -9.711
▲
▲
4
2,773.6
85.5 ▲ 6
22.1
5.4
▲20.3
11.8
2,981.42,875.1
5.8
19.29,779.8
7
6,021.26,520.7
22
-▼
102,201.52,290.9
36.3
20.320.319.2
8.110.54
▲
+3ICICI Bank Ltd
1.4
0.6
-111
-125+1
7.8 -22.9 ▼▼
0.7
0.7
▼
▼
2.2
0 3
1.0
2.3
1.2
2.2
▲▲
▲▼
1.20.7
▼
3.0
▼
1.6
2.7
0.7
0.8
▼
31.5
1.6
▲
0.90.1
0.1
6.6
▼
9.6
▲2.3
▼▲
▲5.4
56.1 17.2
▲▲12.0
6.4
4.6 1.4
▲
17
1
110.1
▲
19 15
0 3
▼0.5▲▲
0 3
0.3 +1
0.90.3 ▼
-10.9-12.1
1.04▲
3.9▲
-4
+1 9
2.4
3.022*
▲0.9
22*9 ▼ 1
18
453.1
0.319▼
1
0.8
0.9
-7.5 0.8
▼
3
▼13
▼▼
0.83.4
2.8▼
-
▼1.0
3.9
3.9
0
12.8
2.5
7.8
3.9
-8
-15▲
▼
▼
2.2
▼
3.2
▼
0.9
6.1
6.1
1.1
3.7
2.4
▲
▼
▲
▼
.8
▲
▲
-
19.9
2.8
0.2
20.1
0.8
▼
0.9
8.6
9.6
3.6
7.9
4
7.1
-4
-12
▲
▼
-2
-6
5.3
3.3
-9
3▼▲ 0.8
5▼-9▲
-91.3+9 ▲
+3 ▲▲
0.8
12
5.92 6,918.9 24.4
13,331.239.2
▲2.1
12.4 ▼47.1Sh (%) Share Ch.
# of Deals per Advisor
US$mRank Value
DealsMarket Change in
Sh (%)MarketMarketMarket
Fees# of Deals# of
Financial Advisor Share Ch.
# of Deals per Advisor
Japan Rankings
Share Ch.Market MarketAdvisor
Sh (%)
11.8-25.2
Bank of America Merrill Lynch1112.8 ▼ +4
1
0.5Rothschild ▲Deutsche Bank
Mitsubishi UFJ Morgan Stanley
14KPMGDeloitteCiti
Daiwa Securities Group Inc
4,207.0
10,357.2
5
11,294.810,357.2
12
2,711.216
3
5.3
63*
101
5.6
8.2
17
15
8
9
13
Somerley
UBS
CITIC 6* -
Sumitomo Mitsui Finl Grp Inc
6*
24
▲▲
▲
27.7
6
15.322.2
20.3
33.3
1325
Market2013 Rank
▲
22,230.217,583.6
US$m
11,423.7
Rank ValueSh (%)
22.414,114.8
3320.446
▲▲34.4
5
Sh (%)Change in
Rank Value per Advisor (US$m)Market
26.8 6
43.5+2
Deals2013 Rank
Jan 1 - Mar 31
# of Deals# of 2014
Rank
Any Japanese Involvement Announced (AD19)
Rank Value per Advisor (US$m)2014 Rank
Industry % Change from Same Period Last Year Industry % Change from Same Period Last YearIndustry % Change from Last Quarter Industry % Change from Last Quarter
28,317.0
Japanese Involvement Announced M&A Target Industry by Value
718.7 2 Carlyle Group LP0.3 0.90.9+2 25100.0
▲
▲▼▲ 0.9%
2.2%▲
▲40.7%
* tie
67.7%21.2%
▲
239.7▲ -
-29.9%
Industry Total +7Qatalyst Partners 25 - 1.4 ▲
100.0 77951,053.31.4 0.3
htt // th
327.1
▼
100.0
▼
▲1386
0.30.3
0.2%-36.1%
Industry Total
Japanese Target Completed M&A Fees
Vi it htt //d i th t t i hi d d t L T bl
-26.9%
-142▲+1 .9
-20.1% ▼ ▲
33.4%
25.5%
15.2%
6.0%
5.6%
5.4%
Financials Industrials High Technology
Materials Consumer Products and Services Real Estate
Consumer Staples Healthcare Retail
Media and Entertainment Energy and Power Telecommunications
$278.4$192.8 $230.8
$103.7
$238.8 $216.1 $183.0 $222.3 $229.0$110.5
$275.8
$272.2 $185.7
$153.2
$252.9
$141.6 $208.7 $124.1 $80.8
$201.1
$237.5
$173.9
$146.1
$148.4
$111.1
$226.9$196.0
$139.2
209.7 265.4
179.5
246.3
191.9
157.1
242.9
214.6
143.8
0
500
1000
1500
2000
2500
3000
$0
$200
$400
$600
$800
$1,000
$1,200
2006 2007 2008 2009 2010 2011 2012 2013 2014 2015
Num
ber o
f Dea
ls
Impu
teed
Fee
s (U
S$m
il)
4Q 3Q 2Q 1Q # of Deals YTD
https://www.thomsonone.com Visit http://dmi.thomsonreuters.com to view archives and order custom League Tables19

Industry Total
.04,271.1
11,524.38,773.5
0.04.5
12.39.3
+2+2+1-1
▲▲▲▼
2222
2.62.62.62.6
10*10*10*10*
--
23*9*
+3 ▲ 37.6 0.0
Prairie Capital Advisors IncQatalyst PartnersLazardBank of America Merrill Lynch
- 13,791.7
Wallbanck Brothers Sec (HK) 17* - 3 1.4
298.9.0
1,118.44.4
123.0
▲-▲
0.30.01.20.00.1
+30
+1+2+1
2222
2.62.6
▲▲23*
Cormark Securities IncSheshunoff & Co IncRaymond James Financial IncRoss Glanville and Associates
5*10*10*10*10*
-20.8%-37.2%
▼-45.8%
Industry % Change from Same Period Last Year-36.7%
76
Morgan StanleyHoulihan LokeyBank of America Merrill Lynch
-
Huatai Securities Co Ltd
Fairness Opinion Provider US$m Sh (%)
Based on Number of TransactionsBased on Number of Transactions
14
DealsMarket
Jan 1 – Mar 31 Jan 1 – Mar 31Any Americas Involvement Announced Fairness Opinion
Jan 1 – Mar 31Any US Involvement Announced Fairness Opinion
Rank Value (US$m)# of Deals per AdvisorBased on Number of Transactions
Change in # of Market# of Deals per Advisor
Market2015 Rank
Rank Value (US$m)
Worldwide Announced Fairness Opinion
Rank Value (US$m)MarketRank ValueChange in
# of Deals per Advisor
Southwest Securities Co Ltd
Industry % Change from Last Quarter
▼
-
3.2
-46.8%
▼ -46.2%
Cormark Securities IncBank of America Merrill Lynch 8*
2*
8*
8*
8*Lazard
Industry % Change from Last Quarter
4* 19*
41*
4*4*
4
3
3
-
4.8-6
▲Sh (%) # of Deals
12
4*
2015 Rank
2014 Rank
JP MorganFairness Opinion Provider
1 4*Sandler O'Neill Partners
19.46.5
+8
+1
4*
+3-+2
0
14*
2*
8*8*
-
▲+114*
▼6.5
-2
3.22
8* 0
4.84.8
▲
3.2
▼
3 4.8
3 ▲
3.2
▲10.2
191.6
5.0+2
▲19*8*- +2
11,524.3 13.53.2
0 -.0 0.0.0 0.0
▲-
▲-1
4,271.1
222 +2
8,773.53.2
▼
Industry Total 85,617.9
▼
-20
Industry % Change from Same Period Last Year
▼-49.1%
2
BMO Capital Markets +25* 9*
3
5.32* 17*0
# of Deals
21 1 16
Fairness Opinion Provider2014 Rank
# ofDeals Sh (%)
2014 Rank
31.4
Rank Value
JP MorganSh (%)
Sandler O'Neill Partners
Deals07.2
2015 Rank
JP Morgan
Rank Value
52,499.713US$mSh (%)
Duff & Phelps
# of Market Change in
1 5# of Deals
-1.3
MarketSh (%)
1.117.1 +8 ▲
2* 1* 4 5.3 -6
55.92* 6* 4 5.3
4
1,064.20 -
▲3
▲
4.0
3 +34.0
93.2112.44.0
204.91,502.7
▼
-▲
CITICChinalion Securities Co Ltd
+2
China Securities Co LtdGuotai Junan Securities
23*Industrial Securities Co Ltd
3Simmons & Co InternationalDA Davidson & Co Inc
0.1+1
-
Shenwan Hongyuan Group Co Ltd
28* ▲
5*
Moelis & Co
4.0
5.50.1
Sinolink Securities Co Ltd
Duff & Phelps
13*
13*
4Sandler O'Neill Partners
9*
13*
5*1.4
3
CMS Ltd.
17*
+2
17*
0
13*
17*
730.4 0.4
93.2
1.8-▲
01,064.2
01.4
11*
3
GF SecuritiesBMO Capital Markets
11*4
1.8
44
+1
17*
-
0.3
▲+5
5
4.0Sterne Agee & Leach Inc5*
2.62.6
0.4
0.617*23*
-
Qatalyst Partners
100.093,921.7
3
1,502.7735.5
204.9 0.1814.4
Duff & Phelps
DA Davidson & Co Inc
Sterne Agee & Leach IncSheshunoff & Co IncPrairie Capital Advisors Inc
0.21.60.1
Houlihan Lokey
Simmons & Co International5*3.0
0.1
0.3 ▲78.0
0.3
17*0.1
135.62.3
6* 28* 3.2
▲ 1,093.4
7 ▲+7-
6* -
47* 59* 28* 58
4 9*3 11*
+7
+66 2.7
57
+114.195.0
3.2 +88 3.6 +4
494.3
0.6▲▲
1.8 +5
-47*
-
▲1.8
-
▼
17*
▲
+3
28*
9,870.8
5 2.3
2,375.2
2.3
▼
6.3
▲
4,854.6
▲
New Times Securities Co Ltd
569.7
0.59*2.39*
0.8
Huaxi Securities Co Ltd
2*+3+4-5
▲
Houlihan Lokey
0.6
5,368.9
US$m55,967.6
2.71,114.2
▲586.3
First Quarter 2015 | Mergers & Acquisitions | Financial Advisors
50,779.0 59.31,064.2 1.2
204.9 0.21,420.4 0.8110.1
112.4 0.193.2
0.2
78.0 0.1135.6 0.2
100.0-17
-21.5% ▼
62
▼
17* - 3 1.4 -4
Fairness Opinion Rankings†
Cormark Securities IncDA Davidson & Co IncSimmons & Co International
17*17*17*17*
3333
1.41.41.41.4
+3+1+3+2
▲▲▲▲
701.2298.9112.4
78.0
0.40.20.10.0
Bruce McKnight Mineral AdvisorEvans & Evans IncGoldman Sachs & Co
7.7 10*10*10*
--
6*
222
2.62.62.6
+2+2-2
▲▲▼
4.47.1
6,131.6
0.00.06.5
Industry Total
Industry % Change from Same Period Last Year ▲ ▼Industry % Change from Last Quarter ▼ ▼
0.31.4+1+1
▲▲
.0232.0
Sealand Securities Co Ltd 1.4 0.0China Investment Sec Co Ltd
15*15*
25*25*
22
Deloitte
-29.7%-29.7% -32.1%
178,230.6 100.0
Guotai Junan Securities
24.0
+1 417.64.2
Headwaters MBCenterview Partners LLC
4*
+3
+1
Jan 1 – Mar 31
▲ 730.4 0.9
# of Deals per AdvisorBased on Number of Transactions
1,420.4
- 3 2.1
1 4.2 0 - 13*
US$mMarket
701.22.1
5*
# of2014 Rank
# of
Based on Number of Transactions
5*
Huaxi Securities Co Ltd
Rank Value (US$m)
3
# of Deals per Advisor
+19222
Liberum Capital
Sberbank CIB
Rothschild
2015 Rank
1
Shenwan Hongyuan Group Co LtdSinolink Securities Co Ltd
CITICBarclays
1
Zheshang Securities Co LtdABG Sundal Collier
14*
-
Fairness Opinion ProviderJP MorganBank of America Merrill Lynch
Evercore Partners
14*+3 ▲ 37.6
4* - 4.2 0.2New Times Securities Co Ltd 12*
* tie
- 2 1.4 +2▲
China Merchants Securities Co2 1.4Morgan Stanley
1
Chinalion Securities Co Ltd
Deals
4 ▲
Change in
5*
3
CMS Ltd.
-
Industrial Securities Co Ltd
China Securities Co LtdSouthwest Securities Co Ltd
12* -
8.3
+29,710.3
4.2
# of Deals
Wallbanck Brothers Sec (HK)
Guotai Junan Securities
11
4.8
Sh (%)
34.9▲
1.53
5*6,673.2
y g
PricewaterhouseCoopers
Based on Number of Transactions
▲
9.4%
417.6 6.9Fairness Opinion Provider # of Deals
Rank Value (US$m) # of Deals per Advisor
Fairness Opinion Provider
Rank Value (US$m)Rank Value
Jan 1 – Mar 31
Sh (%)
2
Market2014 Rank
Change in Deals
4Sh (%)
3*12.5 +316.7
▲
US$mRank Value
5*
1
2015 Rank
-
Jan 1 – Mar 31Any EMEA Inv Announced Fairness Opinion
14.2
4*4* -3
1-
2
4.2
4.21
8,613.0 30.9▲ 990.3 3.6
4.21
▲ 48.4
- +14*
- 4.2▲4*
5*22.0 0.1
14* +1
▲ 21.1 0.1
85.7+1
5.1▲ 0.9
3▲
0.7
3 2.12,773.6 10.0▲ 0.1
+2196.5549.5
61.1
▼-53.9% ▼
-15*
15* 13*
Haitong Securities Co Ltd 15* 2
-
▲ 115.6 0.42.8
▲ .0780.2▲
+1
-
Huatai Securities Co Ltd
-33.3%
100.0-1224
Industry % Change from Last Quarter -45.5% ▼ -44.0%Industry % Change from Same Period Last Year
Industry Total
▼
27,857.7
Rank Value
3.02,375.2▲
+8 6.21.4
+7▲
▲+74,854.6
9
586.38
+57
Market
1,114.2
Sh (%)Sh (%)
+4
0.7
1.8
▲5,368.9
▲
▲4.94.9
▲
5
569.7+4+3
4.26
▲
494.3+6
2.8
3.513* 3.525* 5
- 5 3.5
Industry % Change from Same Period Last Year 59.6%
GF Securities
12*15*
+2
5* 4
Industry % Change from Last Quarter -23.2% ▼ 21.5%
Industry Total 100.0
▲
142
+2
735.5
Change in Market
-
- 1 20.0 +1Deals
2014 Rank
# of Market# of DealsSh (%)
1 20.0▲
US$m
1 20.0 +1+1 ▲
▲
-65.4%
-7
1 1 20.0 -6 ▼
825.72*
▼
0.0
1*JP Morgan
6.90.6
Industry % Change from Last Quarter 400.0% ▲
1.4
179.2%▲
+53
▲
+1
78,257.7
▲
▲
1.4+1
8*
4
7
11
Deloitte
+5
1,093.4
8*
6.3
-0.90.7
5 6,065.1 100.0
▲
Industry Total
Industry % Change from Same Period Last Year -58.3%
7.81*1*
2015 Rank
14 +119.92
Any Japan Inv Announced Fairness Opinion
-
13*
5.6
Market
Any Asia Pacific Inv Announced Fairness Opinion
-1*
7
-
0.3
5*0
Mizuho Financial GroupEvercore Partners
8*1.0814.4
▲
37.0
+1 ▲ 1,348.0
898.6 3.20
▲
-
+1 10,307.4
4.2
-
- 1
▲+1
1,428.2
-29.6
1,793.7 29.6
1 20.0 +11 13.6
2,773.6 45.7254.6 4.2
1,793.720.0
▲Bank of America Merrill Lynch 1*Daiwa Securities Group Inc 1* -
4.2 +14*
Strutt & Parker LLP 4* - 1 4.2 +14*
Goldman Sachs & Co 4* - 1 4.2 +1Duff & Phelps 4* - 1 4.2 +1 0.0
Founder Securities Co Ltd 15* - 2Essence Securities Co Ltd
Guoyuan Securities Co Ltd 15* - 2 1.41.4 ▲ 209.9 0.3
▲ 230.1 0.30 -
-4 ▼
106.0 0.1Donghai Securities Co Ltd 15* 25* 2 1.4
2
†Fairness Opinion rankings include fairness opinions provided as a standalone mandate as well as fairness opinions provided as part of a broader advisory mandate.
2,301.3 2.9
0.3
2 1.4
Sterne Agee & Leach Inc 17* 28* 3 1.4 +3 ▲ 135.6 0.1
0
https://www.thomsonone.com Visit http://dmi.thomsonreuters.com to view archives and order custom League Tables20

-
-
-
-
-
First Quarter 2015 | Mergers & Acquisitions | Financial Advisors
Ranking Criteria Summary
If you would like to participate in the submissionprocess, receive quarterly press releases, or havequestions about league table criteria pleasecontact:
League tables include rank eligible mergers, acquisitions, repurchases, spin-offs, self-tenders, minority stake purchases and debt restructurings.
A tender/merger transaction is considered to be effective at the time of consummation of the merger or the date on which it is declared wholly unconditional.
AmericasRobert LevineTel: +1 646 223 5682
Announced league tables include all deals that were announced between January 1, 2014 and March 31, 2015 and of which Thomson Reuters was made aware. All current data andprevious year's data is as of 5:00pm EDT on March 31, 2015.
Deals with undisclosed dollar values are rank eligible but with no corresponding Rank Value. Non-US dollar denominated transactions are converted to the US dollar equivalent at thetime of announcement of terms.
Tel: +852 3761 1852
E-mail: [email protected]
E-mail: [email protected]
Asia-PacificKelvin Bian
Kaori Motohashi
EMEA
Tel: +44 (0) 20 7542 3558
E-mail: [email protected]
Japan
Redina Doda
Financial and legal advisors receive full credit for each deal on which they provide financial or legal advisory services, unless they represent minority sellers or advise on only a portionof the transaction or Thomson Reuters has not been made aware of their participation in that transaction. For pending transactions, advisors to targets of multiple bids receive credit forthe transaction agreed to or, in the absence of an agreement, the value of the highest offer.
-
-
-
-
Imputed fees are calculated using Freeman & Co. proprietary algorithm where spreads or fees are not disclosed. Deal fees are on a gross basis before all expenses. Each underwriteror advisor is allocated its share of deal fees using Freeman & Co. allocation methodology, based on the number of underwriters or advisors on the deal and their role. No fees areallocated to syndicated members.
E-mail: [email protected]: +813 6441 1338Kaori Motohashi
League tables, commentary, and charts citing announced activity are based on Rank Date and include intended, pending, partially complete, completed, pending regulatory, andunconditional transactions. Rank Date is defined as the earliest public announcement of when a value can be applied to a transaction.
League table volumes for Mitsubishi UFJ Financial Group and Morgan Stanley, included herein reflect the changes after the commencement of their jointly established securities firmsin Japan: (1) Mitsubishi UFJ Morgan Stanley Securities and (2) Morgan Stanley MUFG Securities. Accreditation for transactions involving the newly established joint ventures arereflected in totals for Morgan Stanley. For Japanese related rankings, Morgan Stanley is represented as "Mitsubishi UFJ Morgan Stanley”.
Any Involvement league tables include deals where the target, acquiror, or either ultimate parent are domiciled (nation of headquarters) in the specified region or nation. Anyinvolvement league tables also include the nation of the seller and seller ultimate parent on privately negotiated stake purchases
While Thomson Reuters has used reasonable endeavors to ensure that the information provided in this document is accurate and up to date as at the time of issue, neither Thomson Reuters nor its third party content providers shall be liable forany errors, inaccuracies or delays in the information, nor for any actions taken in reliance thereon, nor does it endorse any views or opinions of any third party content provider. Thomson Reuters disclaims all warranties, express or implied, as tothe accuracy or completeness of any of the content provided, or as to the fitness of the content for any purpose to the extent permitted by law. The content herein is not appropriate for the purposes of making a decision to carry out a transactionor trade and does not provide any form of advice (investment, tax, legal) amounting to investment advice, nor make any recommendations or solicitations regarding particular financial instruments, investments or products, including the buying orselling of securities. Thomson Reuters has not undertaken any liability or obligation relating to the purchase or sale of securities for or by any person in connection with this document.
© 2015 Thomson Reuters. All rights reserved.
Thomson Reuters and the Thomson Reuters logo are registered trademarks and trademarks of Thomson Reuters and its affiliated companies. Any third party name or mark herein belongs to the relevant third party.
https://www.thomsonone.com 21
© 2015 Thomson Reuters..Thomson Reuters and the Kinesis logo are trademarks of Thomson Reuters.
FOR INFORMATION PROFESSIONALSSDC Platinum is the world’s foremost financial transactions database, covering new issues, M&A, syndicated loans, private equity, project finance, poison pills, and more.
Solution for:• Market Analysis & Trends (Geography, Sector,
Asset Class, Deal Type, Deal Size, etc.)• Deal Origination (Debt Maturity Analysis,
Company Lifecycle including Private Equity)• Pitch Creation (Firm Credentials,
Representative Acquirors)• M&A Targeting (Active Strategic/Sponsor
Acquirors, Target Company Screener)• Negotiation (T&C Benchmarking)
FOR INVESTMENT BANKERSThomson Reuters Eikon is the most intuitive and comprehensive way of staying informed. With natural-language search, you can quickly find global information, news, charts and analytics. Company and industry views provide top-level summaries, and then detailed information is just a click away. Identify new opportunities and gain deep understanding of markets, industries, companies and events.
Thomson Reuters Eikon also includes an Add-In for Microsoft® Office to help you increase your efficiency. From screening and targeting to comparables analysis, building league tables, valuing a company and
developing a client pitch book, you can do all this without leaving Microsoft Office. Search and autosuggest features in Excel make model-building easier.
Solution for:• Managing Client Relationships• Deal Origination• New Issues Pre-Marketing/Roadshows• Financial Modeling• Customized League Tables• Simple Deals screening• Valuation analysis and comparable
deal screening• On-brand pitch book creation
FOR STRATEGY AND PLANNING TEAMSThomson Reuters Deals Business Intelligence enables you to slice and dice our renowned Deals and Fees data to create ad hoc reports, analyze market trends, benchmark your performance and identify opportunities – all within a tool built into your workflow in Excel®, saving you valuable time and giving you a competitive edge.
Solution for:• Conducting market analysis and
identifying trends• Benchmarking your performance and
monitoring competitors• Targeting clients by wallet size and
banking relationship• Allocating resources more effectively by
evaluating and analyzing lost deals
Send us a sales enquiry at: financial.thomsonreuters.com/salesRead more about our products at: financial.thomsonreuters.com/products
To purchase individual Thomson Reuters Deals or League Table reports, please contact our Thomson Reuters On Demand group:
Web: http://financial.thomsonreuters.com/ondemandEmail: [email protected]
Access unique analysis for free anytime using Thomson Reuters Deals Intelligence website and receive regular updates, delivered direct to your inbox.
Go to: dmi.thomsonreuters.com/dealsintelligence
Thomson Reuters Solutions for the Deal Making Community
22


