
Global Health ChallengesSocial Analysis 76: Lecture 5

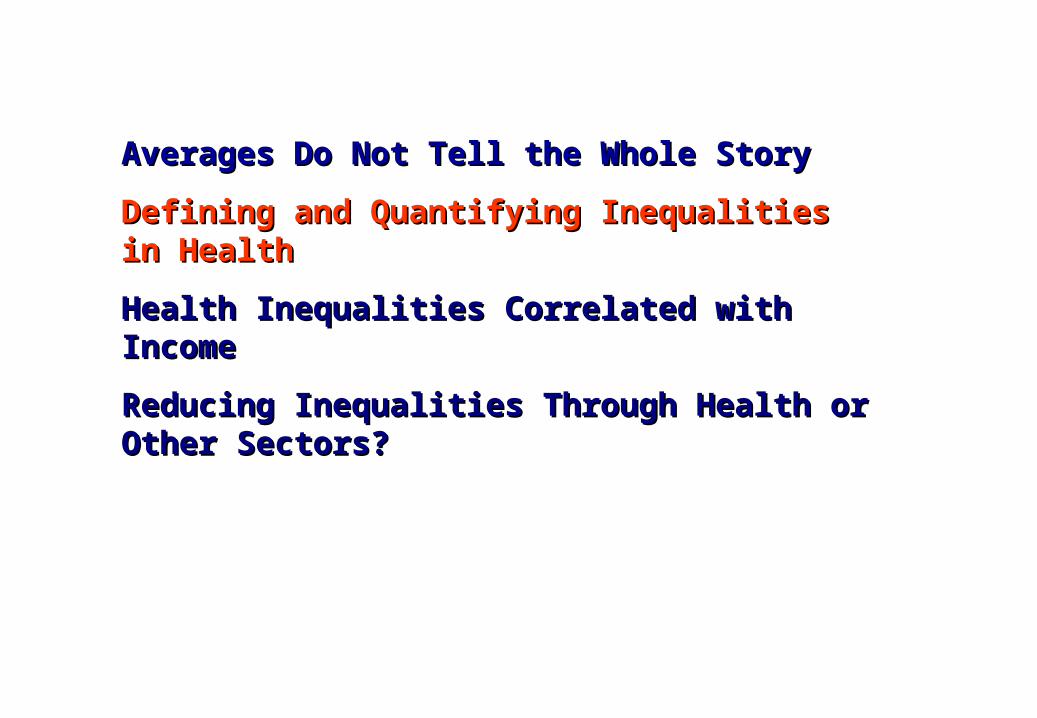
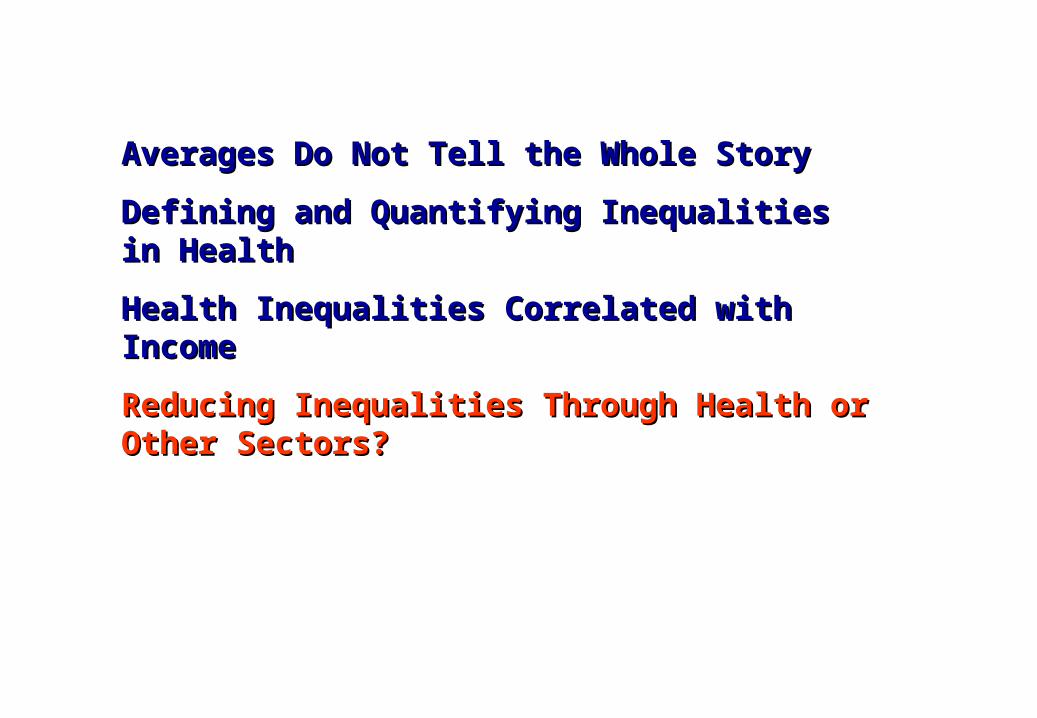
Averages Do Not Tell the Whole StoryAverages Do Not Tell the Whole Story
Defining and Quantifying Inequalities in HealthDefining and Quantifying Inequalities in Health
Health Inequalities Correlated with IncomeHealth Inequalities Correlated with Income
Reducing Inequalities Through Health or Other Reducing Inequalities Through Health or Other Sectors?Sectors?

Three Examples Three Examples
Child mortality for rich and poor in developing Child mortality for rich and poor in developing countriescountries
Life expectancy across counties in the US Life expectancy across counties in the US
Social class differences in the UKSocial class differences in the UK

Child Mortality: gap between rich and poor
Poorest Quintile
Richest Quintile
0
50
100
150
200
250
300
350
un
der-
five m
ort
ali
ty r
ate

55
60
65
70
75
80
85
1961
1963
1965
1967
1969
1971
1973
1975
1977
1979
1981
1983
1985
1987
1989
1991
1993
1995
1997
1999e0
at
bir
th
males females
Trend for US overall life expectancy at birth, 1961-2000Trend for US overall life expectancy at birth, 1961-2000

County life expectancy, males 1999
78.8 to 80.476.9 to 78.8
to 76.973.1 to 7571.2 to 73.169.3 to 71.267.4 to 69.365.5 to 67.463.6 to 65.561.7 to 63.6
75.075.0

Trends in life expectancy at birth for the eight best and eight worst counties, males
55
60
65
70
75
80
85
1980 1985 1990 1995 2000
Year
Lif
e e
xp
ec
tan
cy
at
bir
th

I. Professional etc. occupations I. Professional etc. occupations
II. Managerial and Technical occupations II. Managerial and Technical occupations
III. Skilled occupations III. Skilled occupations
IV. Partly-skilled occupations IV. Partly-skilled occupations
V. Unskilled occupations V. Unskilled occupations
Social Class Designation Based on OccupationSocial Class Designation Based on Occupation in the UK in the UK

Age-standardized death rate, adult males, England and Wales, 1911-1991
0
200
400
600
800
1,000
1,200
1,400
1910 1920 1930 1940 1950 1960 1970 1980 1990
pe
r 1
00
,00
0
I II III
IV V
Based on ONS UK Health Inequalities Decennial SupplementBased on ONS UK Health Inequalities Decennial Supplement

Why Are There Inequalities in Health?
Why Are There Inequalities in Health,even in a country like the United
Kingdom with nearly 100% financial and physical access to healthcare?
Averages Do Not Tell the Whole StoryAverages Do Not Tell the Whole Story
Defining and Quantifying Inequalities in HealthDefining and Quantifying Inequalities in Health
Health Inequalities Correlated with IncomeHealth Inequalities Correlated with Income
Reducing Inequalities Through Health or Other Reducing Inequalities Through Health or Other Sectors?Sectors?

Social Analysis 76 Distribution of Social Analysis 76 Distribution of
Healthy Life ExpectancyHealthy Life Expectancy

Inequalities vs. InequitiesInequalities vs. Inequities
The term The term inequalityinequality simply refers to a quantity that is simply refers to a quantity that is unequal across individuals or groups of individuals. unequal across individuals or groups of individuals.
InequityInequity invokes the concept of unjust inequalities. invokes the concept of unjust inequalities.

1. Inequalities in healthy life expectancy due to living without clean water?
2. Inequalities in healthy life expectancy due to tobacco consumption?
3. Inequalities due to extreme sports?
Inequities?

Total health inequalityTotal health inequality = =
Between Group InequalityBetween Group Inequality + +
Within Group InequalityWithin Group Inequality
What Should We Measure?What Should We Measure?

“Inequality in the US has been increasing.”
Relative and Absolute Inequalities

Distribution of child mortality
0.00
0.05
0.10
0.15
0.20
0.25
0.30
0.35
0.40
0.45
0.00
0.05
0.10
0.15
0.20
0.25
0.30
0.35
0.40
0.45
0.50
0 20 40 60 80 100Child mortality
% p
op
ula
tio
n
AB
C

Averages Do Not Tell the Whole StoryAverages Do Not Tell the Whole Story
Defining and Quantifying Inequalities in HealthDefining and Quantifying Inequalities in Health
Health Inequalities Correlated with IncomeHealth Inequalities Correlated with Income
Reducing Inequalities Through Health or Other Reducing Inequalities Through Health or Other Sectors?Sectors?

Health and income at the national, community, and household level are highly correlated.
Dual causality: poverty causes poor health and poor health causes poverty.
Poverty to poor health has been the focus of social epidemiology for a century.
More recently, recognize that health may be a key determinant of income growth.
Income and Health Relationship

Source: Author’s calculations based on World Development Indicators 2003 (life expectancy and Penn World Table (GDP.) Note: Circles have diameter proportional to population size.
The Millennium Preston Curve

The World Health ChartThe World Health Chart
www.gapminder.orgwww.gapminder.org
Averages Do Not Tell the Whole StoryAverages Do Not Tell the Whole Story
Defining and Quantifying Inequalities in HealthDefining and Quantifying Inequalities in Health
Health Inequalities Correlated with IncomeHealth Inequalities Correlated with Income
Reducing Inequalities Through Health or Other Reducing Inequalities Through Health or Other Sectors?Sectors?
Strategies to Reduce Health InequalitiesStrategies to Reduce Health Inequalities
Major debate on the balance of intervention in Major debate on the balance of intervention in sectors other than health such as improving sectors other than health such as improving educational opportunities or income distribution educational opportunities or income distribution versus the role of public health and medical care.versus the role of public health and medical care.

Often the rich benefit from health system technologies more than the poor – this is true both for prevention and cure.
Important agenda is to understand why interventions that might reduce health inequalities often do not reach the poor.
Reducing Health Inequalities Through Health Systems

Coverage of glasses/contacts, Mexico 2005/6 by state
0%
20%
40%
60%
80%
100%O
ax
Chi
s
Tla
x
Mic
h
Tab
Gro
Gto
Hgo
Pue
Ver Slp
Mor
Nay
Cam
p
Dgo Sin Ja
l
Qro
o
Zac
Ags Col
EU
M
Yuc Qro
Bcs
Son
Chi
h
Mex BC
Coa
h
Tam
p
NL
DF
Crude Coverage
Effective Coverage

0%
20%
40%
60%
80%
100%
1 2 3 4 5
Quintile of Wealth
Co
mp
os
ite
Eff
ec
tiv
e C
ov
era
ge
Maternal andChild Health
OtherInterventions
All Interventions
Intervention coverage by wealth quintile, Mexico 2005/6

What Determines Effective Coverage of What Determines Effective Coverage of Interventions?Interventions?
• Price of health care• Perceived need and knowledge• Geographic proximity of providers - travel time• Cultural and social acceptability of intervention -
responsiveness of health systems• Availability of necessary technology and
resources• Technical quality of providers • Choice of an intervention• Adherence Quality of Quality of
providersproviders
Demand for Demand for health carehealth care


