Analytics for the Rest of Us Ben Pruden, Product Marketing Director Salesforce Wave @ben_pruden Judy Ko, SVP Marketing, Informatica @judyiko Llana Giovara, Sr. Director Marketing Operations @MarketingonWave Justin Lombardelli, Salesforce Marketing Director Analytics & Events @jlombardelli
Safe harbor statement under the Private Securities Litigation Reform Act of 1995:
This presentation may contain forward-looking statements that involve risks, uncertainties, and assumptions. If any such uncertainties materialize or if any of the assumptions proves incorrect, the results of salesforce.com, inc. could differ materially from the results expressed or implied by the forward-looking statements we make. All statements other than statements of historical fact could be deemed forward-looking, including any projections of product or service availability, subscriber growth, earnings, revenues, or other financial items and any statements regarding strategies or plans of management for future operations, statements of belief, any statements concerning new, planned, or upgraded services or technology developments and customer contracts or use of our services.
The risks and uncertainties referred to above include – but are not limited to – risks associated with developing and delivering new functionality for our service, new products and services, our new business model, our past operating losses, possible fluctuations in our operating results and rate of growth, interruptions or delays in our Web hosting, breach of our security measures, the outcome of any litigation, risks associated with completed and any possible mergers and acquisitions, the immature market in which we operate, our relatively limited operating history, our ability to expand, retain, and motivate our employees and manage our growth, new releases of our service and successful customer deployment, our limited history reselling non-salesforce.com products, and utilization and selling to larger enterprise customers. Further information on potential factors that could affect the financial results of salesforce.com, inc. is included in our annual report on Form 10-K for the most recent fiscal year and in our quarterly report on Form 10-Q for the most recent fiscal quarter. These documents and others containing important disclosures are available on the SEC Filings section of the Investor Information section of our Web site.
Any unreleased services or features referenced in this or other presentations, press releases or public statements are not currently available and may not be delivered on time or at all. Customers who purchase our services should make the purchase decisions based upon features that are currently available. Salesforce.com, inc. assumes no obligation and does not intend to update these forward-looking statements.
Safe Harbor
Sales Service
Marketing
Community Apps
Analytics
Analytics for the rest of us Analytics Cloud
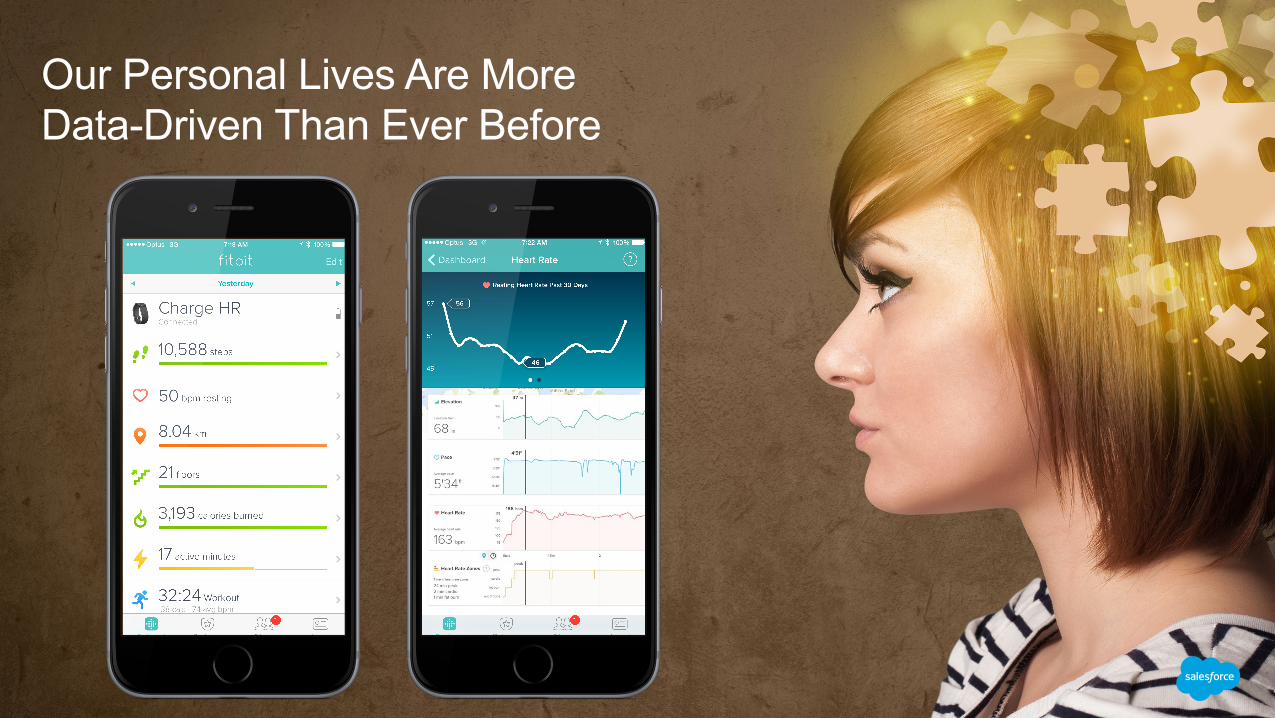
Our Personal Lives Are More Data-Driven Than Ever Before
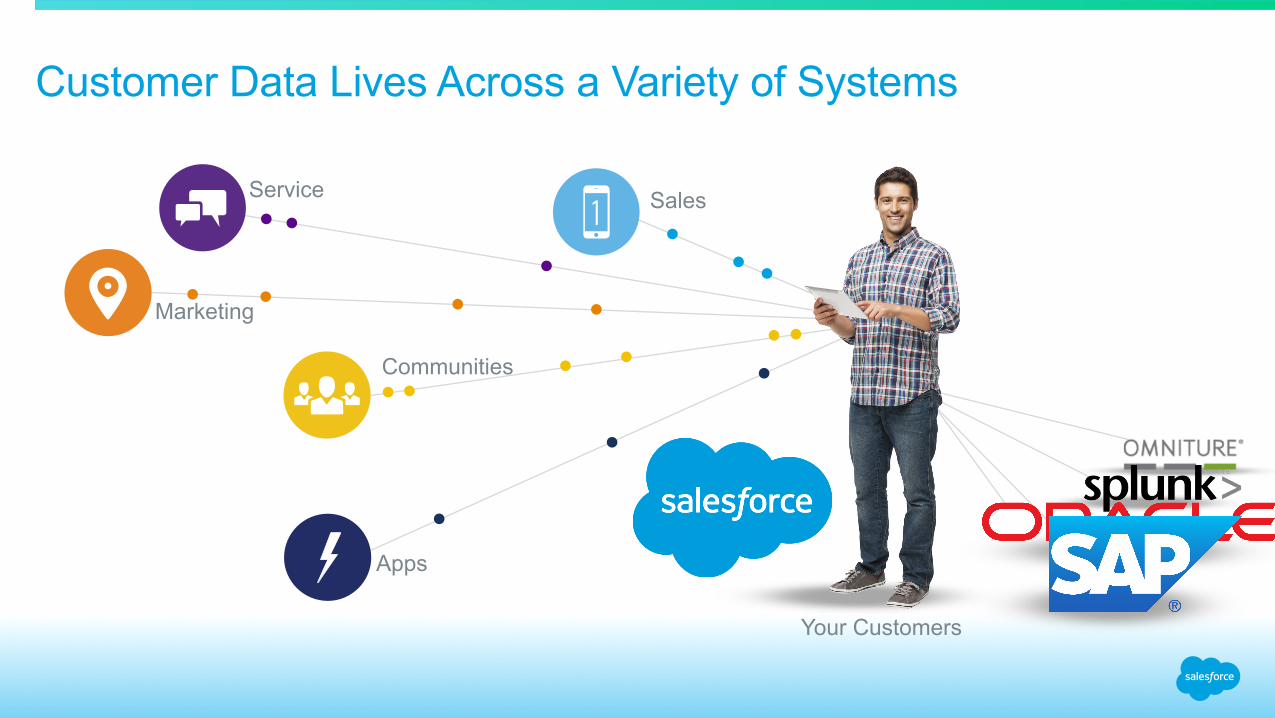
Your Customers
Customer Data Lives Across a Variety of Systems
Apps
Service Sales
Communities
Marketing
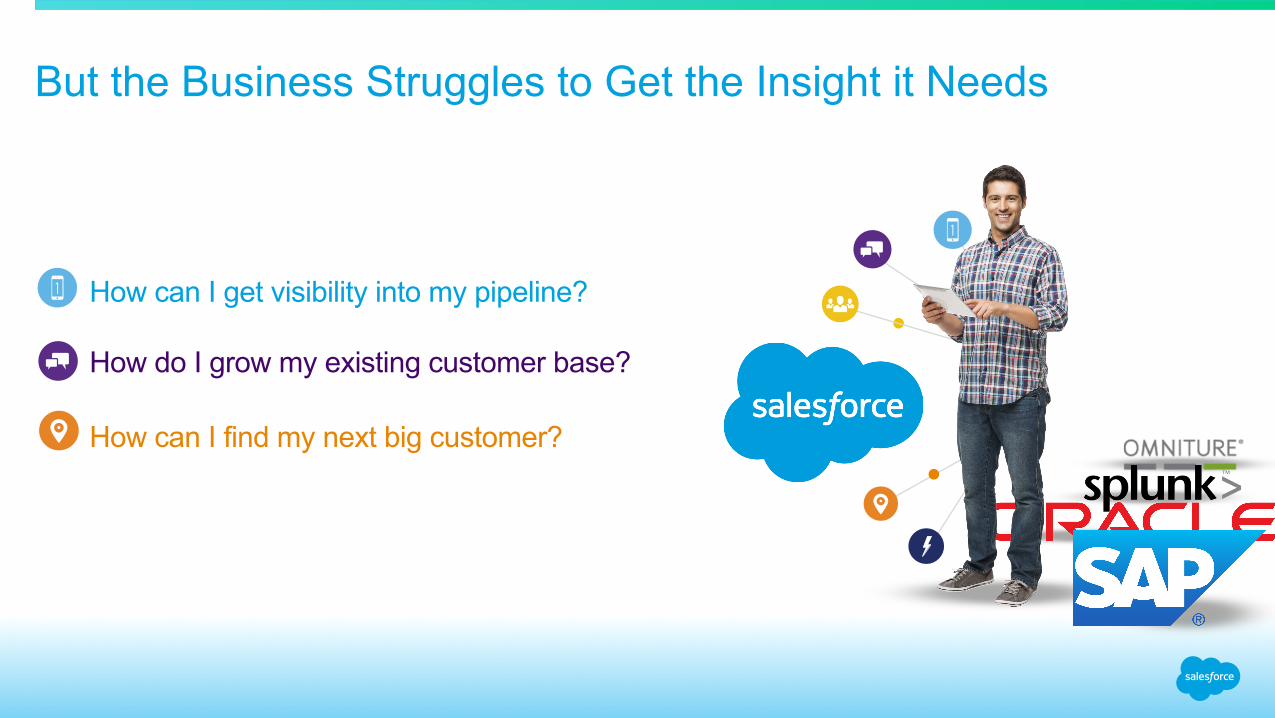
But the Business Struggles to Get the Insight it Needs
How can I get visibility into my pipeline?
How do I grow my existing customer base?
How can I find my next big customer?
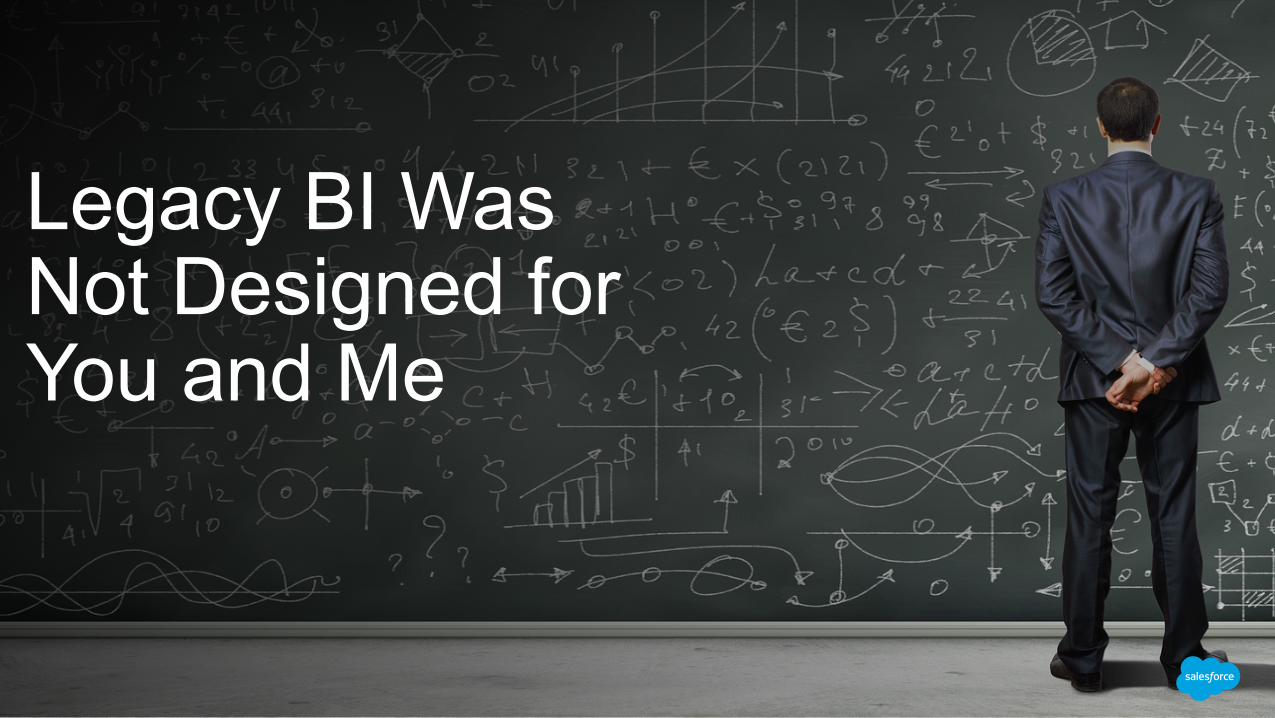
Legacy BI Was Not Designed for You and Me
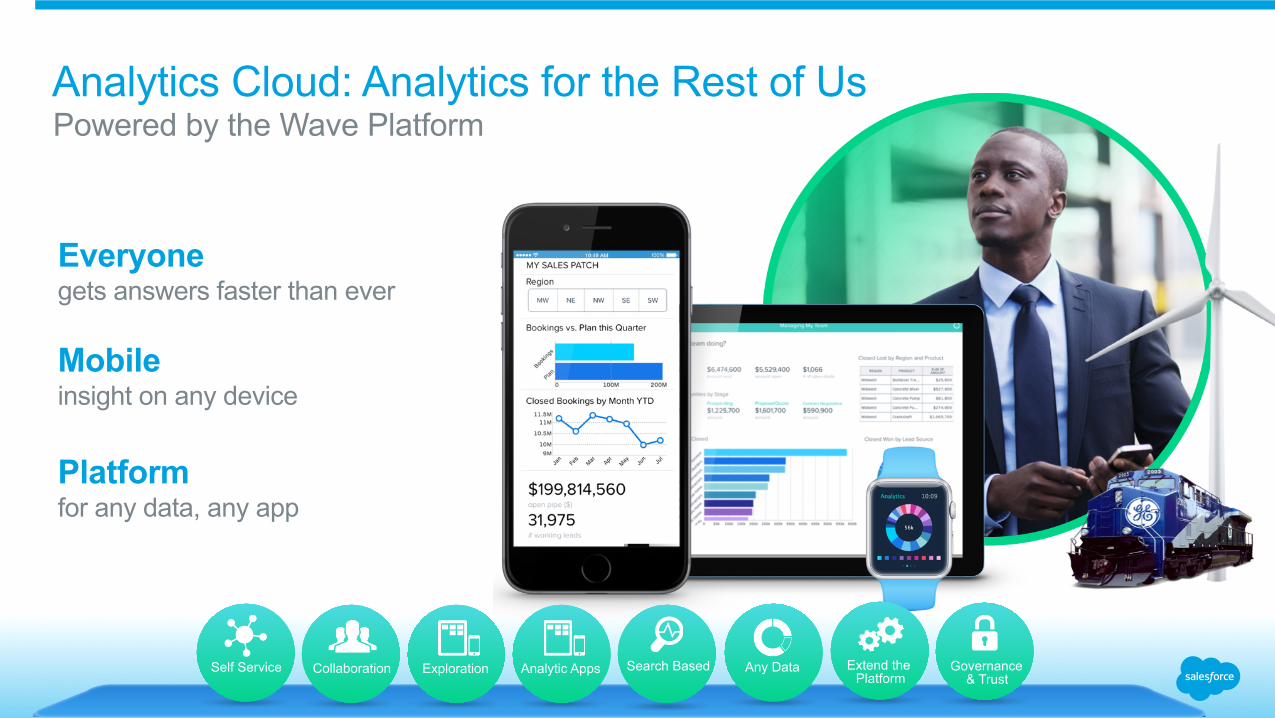
Powered by the Wave Platform Analytics Cloud: Analytics for the Rest of Us
Mobile insight on any device
Everyone gets answers faster than ever
Platform for any data, any app
Extend the Platform
Self Service Collaboration Exploration Analytic Apps Search Based Any Data Governance & Trust
Judy Ko SVP Marketing, Informatica @judyiko
We make great data ready to use.

Your Customers
Customer Data Lives Across a Variety of Systems
Apps
Service Sales
Communities
Marketing
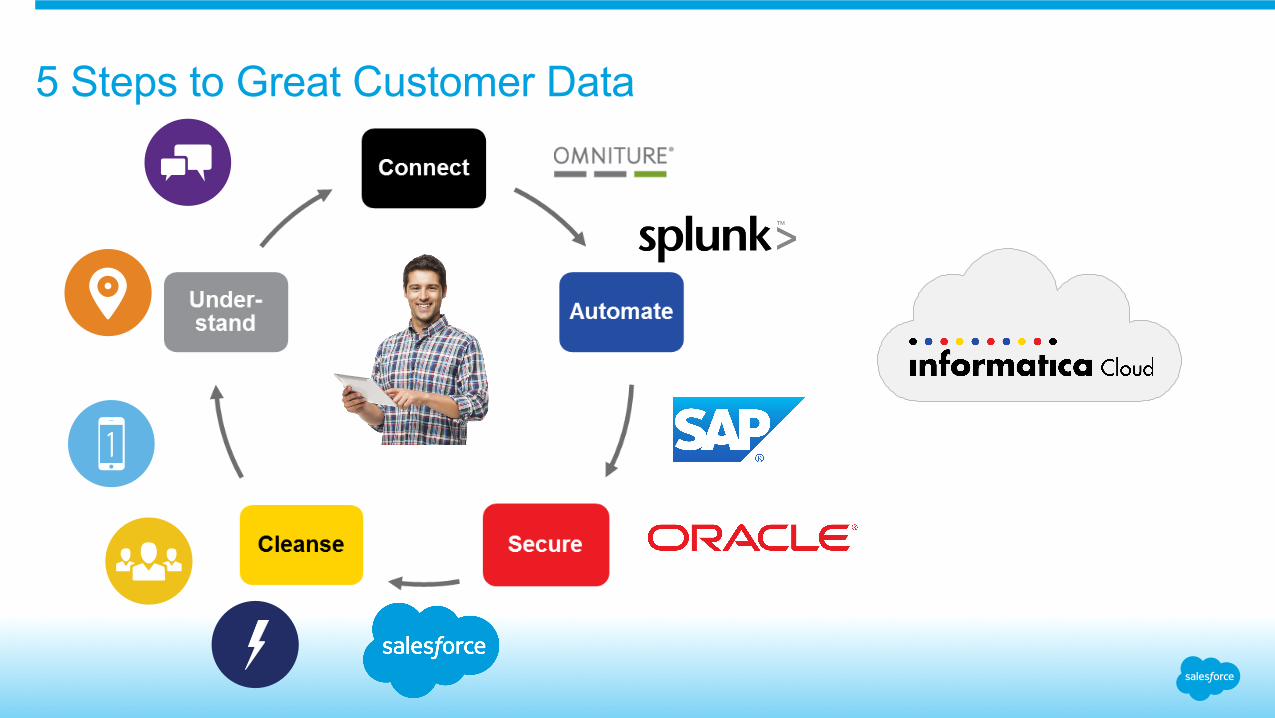
5 Steps to Great Customer Data
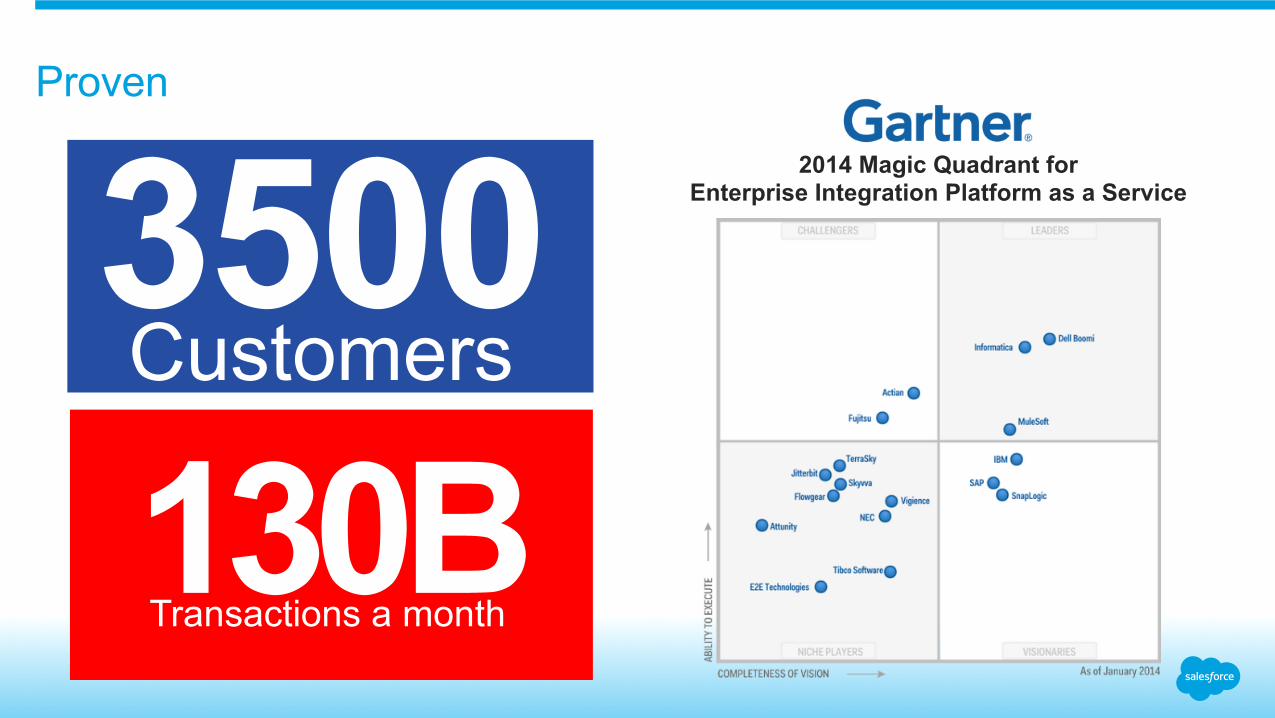
Proven
3500 Customers
130B Transactions a month
2014 Magic Quadrant for Enterprise Integration Platform as a Service
Marketing at Informatica
Loyalty
? Awareness
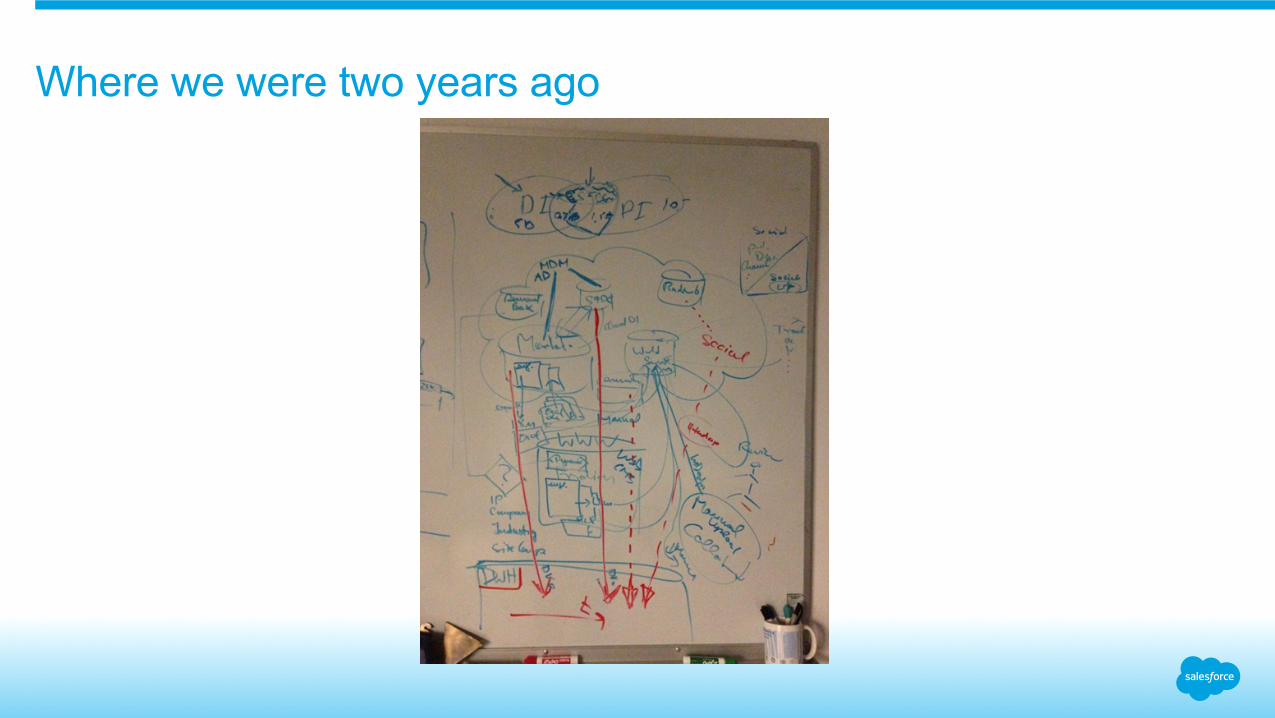
Where we were two years ago
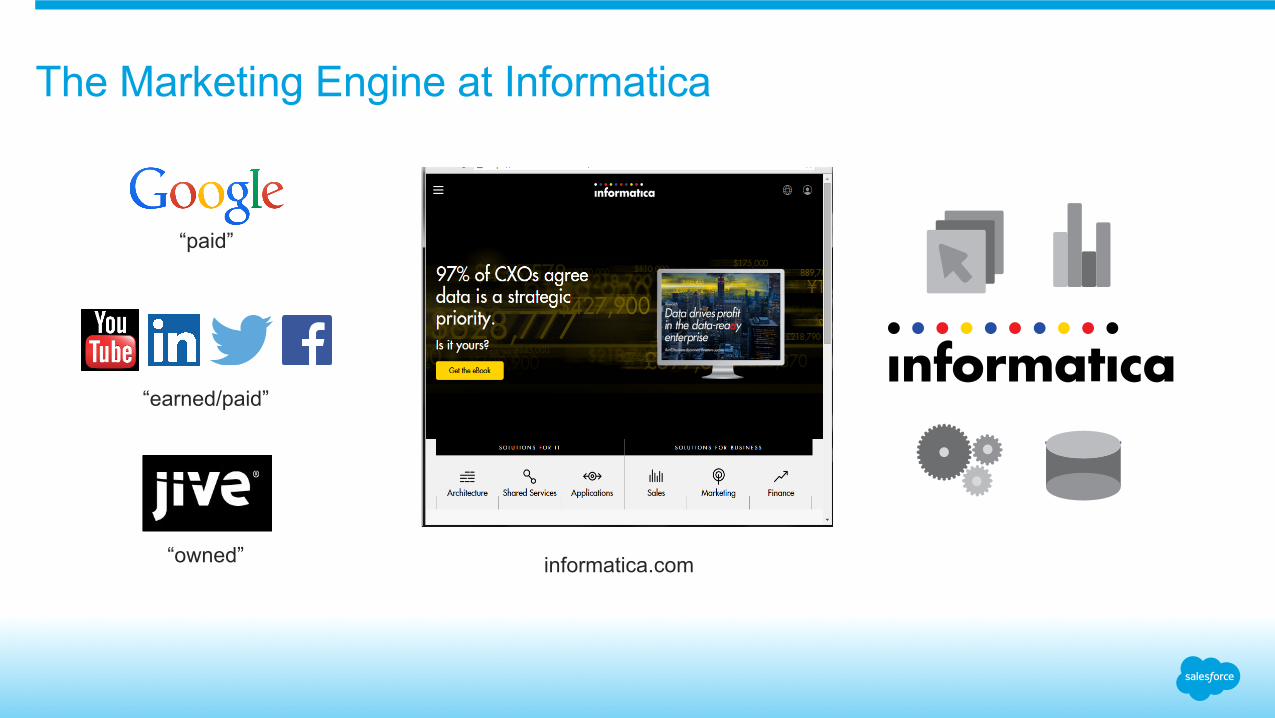
The Marketing Engine at Informatica
informatica.com
“paid”
“earned/paid”
“owned”

A Great Engine Needs Great Data and Great Analytics
great data near-real time, dozens of sources, structured and unstructured, millions of records, hundreds of millions clicks, person-accurate
great analytics ad hoc, reporting, dashboards, scorecards, mobile
great engine applications, warehouse, Hadoop cluster, data lake, predictive scoring engine, user experience, communities
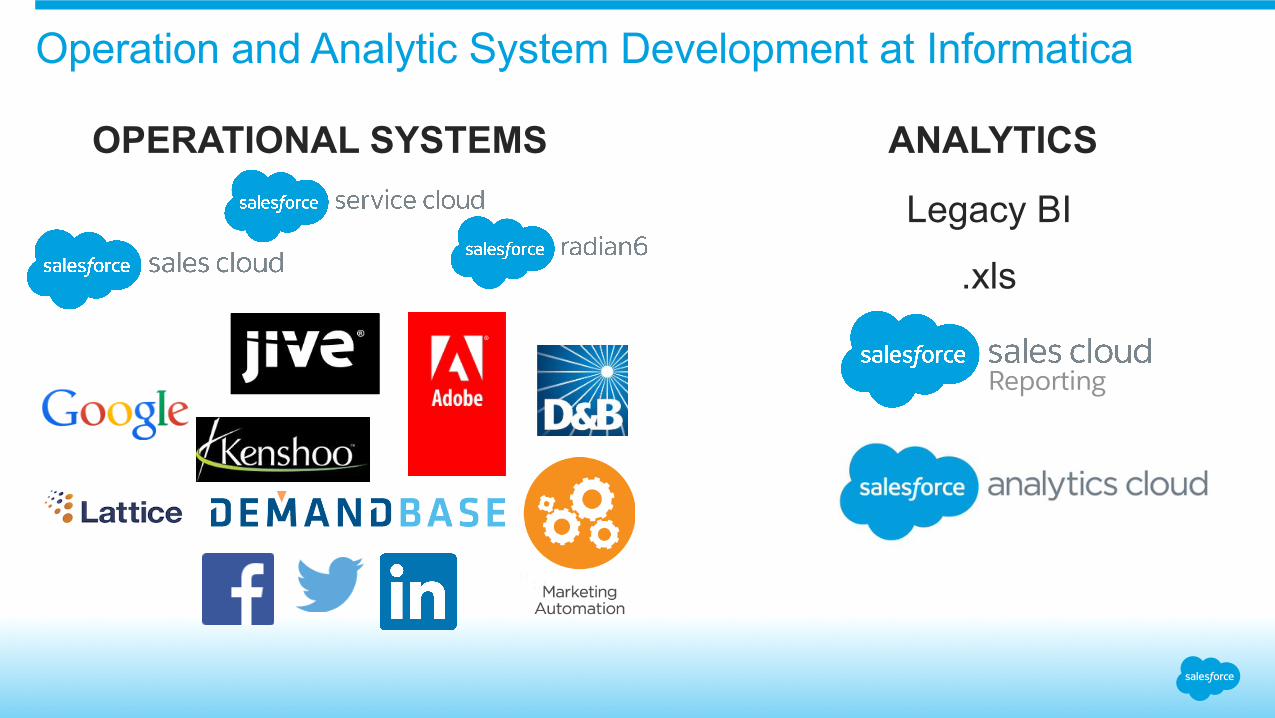
Operation and Analytic System Development at Informatica
ANALYTICS
Legacy BI
.xls
OPERATIONAL SYSTEMS
Reporting

Demo
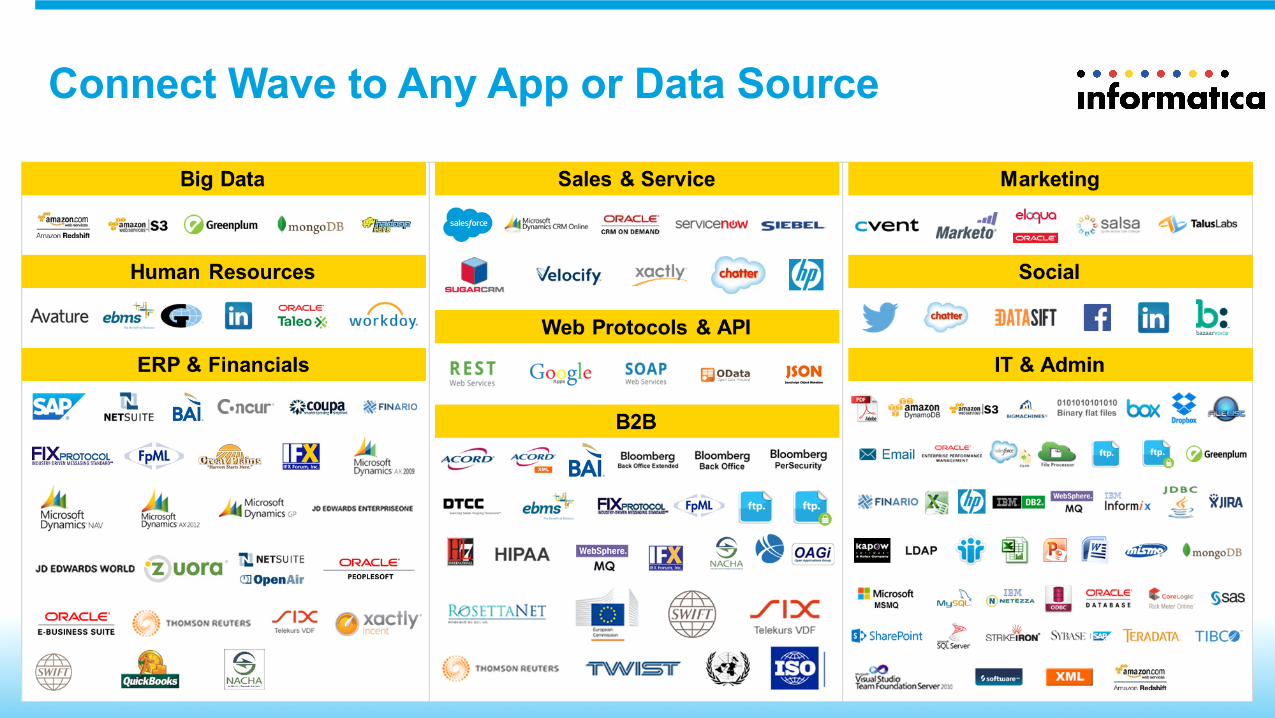
Connect Wave to Any App or Data Source
Learn more at booths 132 and 133
www.informatica.com @infacloud
Llana Giovara Sr. Director, Marketing Operations, Salesforce
Justin Lombardelli Director, Marketing Operations, Salesforce
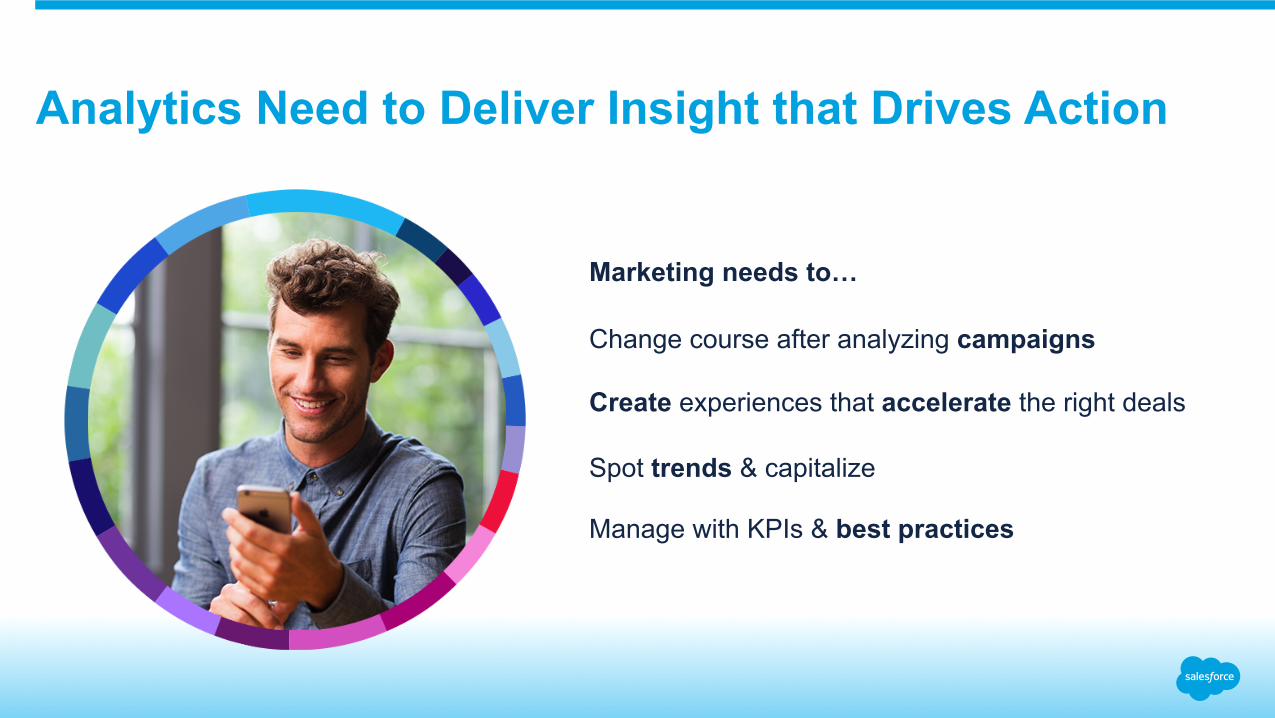
Create experiences that accelerate the right deals
Change course after analyzing campaigns
Spot trends & capitalize
Manage with KPIs & best practices
Analytics Need to Deliver Insight that Drives Action
Marketing needs to…
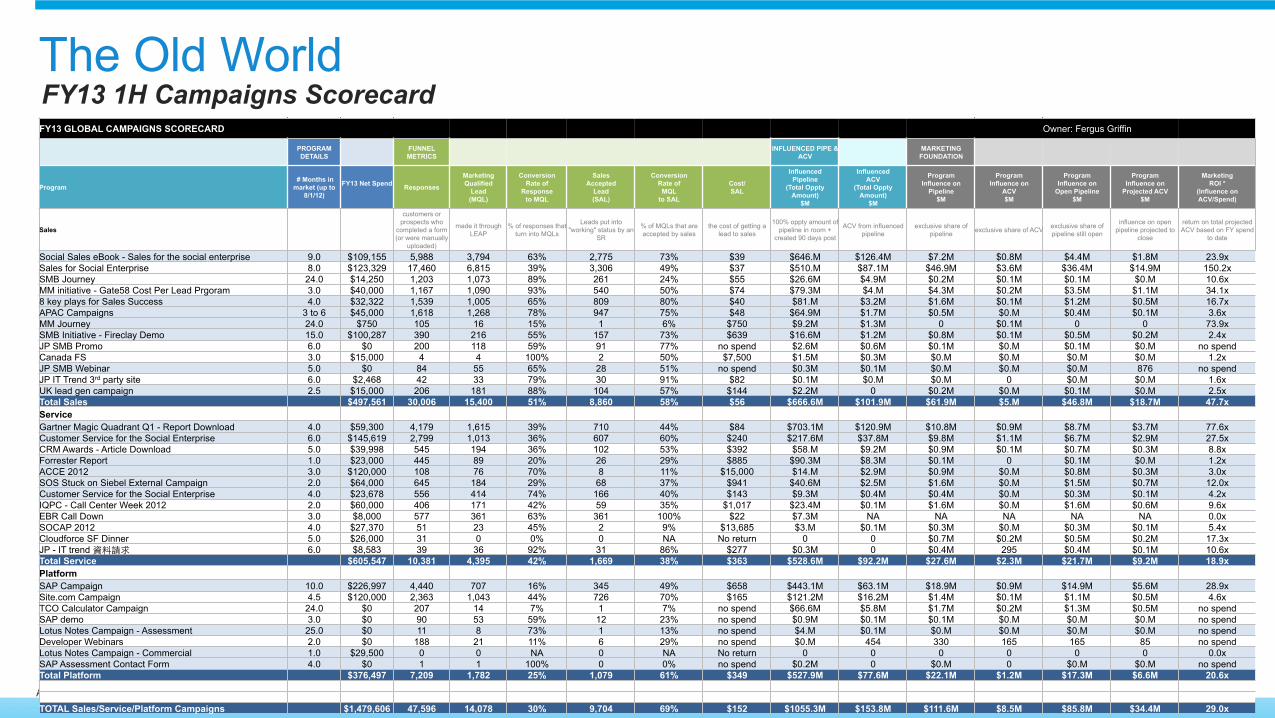
The Old World
All totals exclude duplicate leads/opportunities
FY13 GLOBAL CAMPAIGNS SCORECARD Owner: Fergus Griffin
PROGRAM DETAILS FUNNEL
METRICS INFLUENCED PIPE & ACV MARKETING
FOUNDATION
Program # Months in market (up to
8/1/12)
FY13 Net Spend Responses
Marketing Qualified
Lead (MQL)
Conversion Rate of
Response to MQL
Sales Accepted
Lead (SAL)
Conversion Rate of
MQL to SAL
Cost/ SAL
Influenced Pipeline
(Total Oppty Amount)
$M
Influenced ACV
(Total Oppty Amount)
$M
Program Influence on
Pipeline $M
Program Influence on
ACV $M
Program Influence on
Open Pipeline $M
Program Influence on
Projected ACV $M
Marketing ROI *
(Influence on ACV/Spend)
Sales
customers or prospects who
completed a form (or were manually
uploaded)
made it through LEAP
% of responses that turn into MQLs
Leads put into "working" status by an
SR
% of MQLs that are accepted by sales
the cost of getting a lead to sales
100% oppty amount of pipeline in room +
created 90 days post
ACV from influenced pipeline
exclusive share of pipeline exclusive share of ACV exclusive share of
pipeline still open
influence on open pipeline projected to
close
return on total projected ACV based on FY spend
to date
Social Sales eBook - Sales for the social enterprise 9.0 $109,155 5,988 3,794 63% 2,775 73% $39 $646.M $126.4M $7.2M $0.8M $4.4M $1.8M 23.9x Sales for Social Enterprise 8.0 $123,329 17,460 6,815 39% 3,306 49% $37 $510.M $87.1M $46.9M $3.6M $36.4M $14.9M 150.2x SMB Journey 24.0 $14,250 1,203 1,073 89% 261 24% $55 $26.6M $4.9M $0.2M $0.1M $0.1M $0.M 10.6x MM initiative - Gate58 Cost Per Lead Prgoram 3.0 $40,000 1,167 1,090 93% 540 50% $74 $79.3M $4.M $4.3M $0.2M $3.5M $1.1M 34.1x 8 key plays for Sales Success 4.0 $32,322 1,539 1,005 65% 809 80% $40 $81.M $3.2M $1.6M $0.1M $1.2M $0.5M 16.7x APAC Campaigns 3 to 6 $45,000 1,618 1,268 78% 947 75% $48 $64.9M $1.7M $0.5M $0.M $0.4M $0.1M 3.6x MM Journey 24.0 $750 105 16 15% 1 6% $750 $9.2M $1.3M 0 $0.1M 0 0 73.9x SMB Initiative - Fireclay Demo 15.0 $100,287 390 216 55% 157 73% $639 $16.6M $1.2M $0.8M $0.1M $0.5M $0.2M 2.4x JP SMB Promo 6.0 $0 200 118 59% 91 77% no spend $2.6M $0.6M $0.1M $0.M $0.1M $0.M no spend Canada FS 3.0 $15,000 4 4 100% 2 50% $7,500 $1.5M $0.3M $0.M $0.M $0.M $0.M 1.2x JP SMB Webinar 5.0 $0 84 55 65% 28 51% no spend $0.3M $0.1M $0.M $0.M $0.M 876 no spend JP IT Trend 3rd party site 6.0 $2,468 42 33 79% 30 91% $82 $0.1M $0.M $0.M 0 $0.M $0.M 1.6x UK lead gen campaign 2.5 $15,000 206 181 88% 104 57% $144 $2.2M 0 $0.2M $0.M $0.1M $0.M 2.5x Total Sales $497,561 30,006 15,400 51% 8,860 58% $56 $666.6M $101.9M $61.9M $5.M $46.8M $18.7M 47.7x Service Gartner Magic Quadrant Q1 - Report Download 4.0 $59,300 4,179 1,615 39% 710 44% $84 $703.1M $120.9M $10.8M $0.9M $8.7M $3.7M 77.6x Customer Service for the Social Enterprise 6.0 $145,619 2,799 1,013 36% 607 60% $240 $217.6M $37.8M $9.8M $1.1M $6.7M $2.9M 27.5x CRM Awards - Article Download 5.0 $39,998 545 194 36% 102 53% $392 $58.M $9.2M $0.9M $0.1M $0.7M $0.3M 8.8x Forrester Report 1.0 $23,000 445 89 20% 26 29% $885 $90.3M $8.3M $0.1M 0 $0.1M $0.M 1.2x ACCE 2012 3.0 $120,000 108 76 70% 8 11% $15,000 $14.M $2.9M $0.9M $0.M $0.8M $0.3M 3.0x SOS Stuck on Siebel External Campaign 2.0 $64,000 645 184 29% 68 37% $941 $40.6M $2.5M $1.6M $0.M $1.5M $0.7M 12.0x Customer Service for the Social Enterprise 4.0 $23,678 556 414 74% 166 40% $143 $9.3M $0.4M $0.4M $0.M $0.3M $0.1M 4.2x IQPC - Call Center Week 2012 2.0 $60,000 406 171 42% 59 35% $1,017 $23.4M $0.1M $1.6M $0.M $1.6M $0.6M 9.6x EBR Call Down 3.0 $8,000 577 361 63% 361 100% $22 $7.3M NA NA NA NA NA 0.0x SOCAP 2012 4.0 $27,370 51 23 45% 2 9% $13,685 $3.M $0.1M $0.3M $0.M $0.3M $0.1M 5.4x Cloudforce SF Dinner 5.0 $26,000 31 0 0% 0 NA No return 0 0 $0.7M $0.2M $0.5M $0.2M 17.3x JP - IT trend 資料請求 6.0 $8,583 39 36 92% 31 86% $277 $0.3M 0 $0.4M 295 $0.4M $0.1M 10.6x Total Service $605,547 10,381 4,395 42% 1,669 38% $363 $528.6M $92.2M $27.6M $2.3M $21.7M $9.2M 18.9x Platform SAP Campaign 10.0 $226,997 4,440 707 16% 345 49% $658 $443.1M $63.1M $18.9M $0.9M $14.9M $5.6M 28.9x Site.com Campaign 4.5 $120,000 2,363 1,043 44% 726 70% $165 $121.2M $16.2M $1.4M $0.1M $1.1M $0.5M 4.6x TCO Calculator Campaign 24.0 $0 207 14 7% 1 7% no spend $66.6M $5.8M $1.7M $0.2M $1.3M $0.5M no spend SAP demo 3.0 $0 90 53 59% 12 23% no spend $0.9M $0.1M $0.1M $0.M $0.M $0.M no spend Lotus Notes Campaign - Assessment 25.0 $0 11 8 73% 1 13% no spend $4.M $0.1M $0.M $0.M $0.M $0.M no spend Developer Webinars 2.0 $0 188 21 11% 6 29% no spend $0.M 454 330 165 165 85 no spend Lotus Notes Campaign - Commercial 1.0 $29,500 0 0 NA 0 NA No return 0 0 0 0 0 0 0.0x SAP Assessment Contact Form 4.0 $0 1 1 100% 0 0% no spend $0.2M 0 $0.M 0 $0.M $0.M no spend Total Platform $376,497 7,209 1,782 25% 1,079 61% $349 $527.9M $77.6M $22.1M $1.2M $17.3M $6.6M 20.6x TOTAL Sales/Service/Platform Campaigns $1,479,606 47,596 14,078 30% 9,704 69% $152 $1055.3M $153.8M $111.6M $8.5M $85.8M $34.4M 29.0x
FY13 1H Campaigns Scorecard
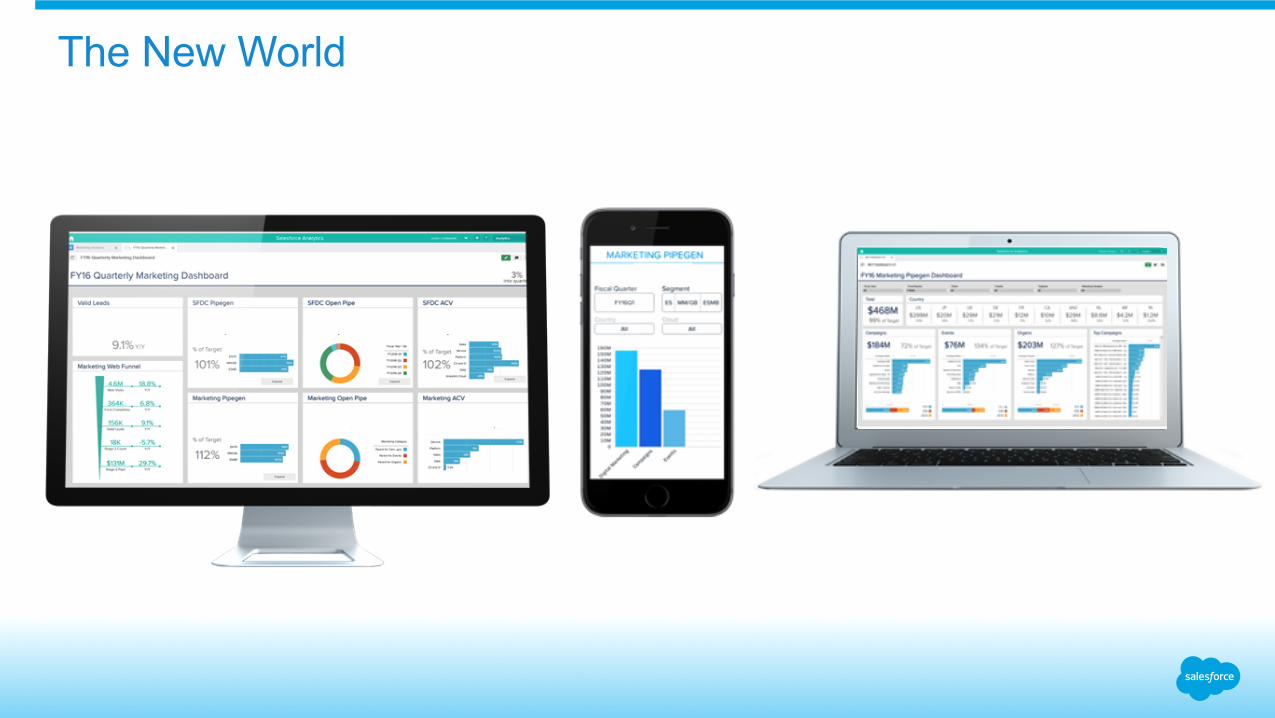
The New World

Demo

Questions?
Thank you


