
International Journal of Engineering Research ISSN:2319-6890)(online),2347-5013(print)
Volume No.3 Issue No: Special 1, pp: 164-173 22nd
March 2014
NCETMESD@2014 Page 164
Generation of Alternative Process Plans for Automated Machine Shop Using
Genetic Algorithm Approach
M.khaja gulam hussain, B. Chinna Ankanna
1,2Asst. Professor in School of Mechanical Engineering, RGMCET, Nandyal.
Corresponding Email: [email protected], [email protected]
Abstract— A methodology has been developed to
generate process plans using a Genetic Algorithm (GA)
approach based on the pre defined precedence relations of
manufacturing features. This introduces significant
improvements to the utilization of the manufacturing
facilities through the reduction in schedule conflicts,
reduction of flow-time and work-in-process, increase use of
production resources. GA is capable of performing multi-
objective optimization based on minimum production cost or
minimum processing time. Based on the objective selected,
optimal solutions were obtained using the GA.
Keywords— Computer Aided Process Planning, Computer
Aided Design ,Computer Aided Manufacturing Computer
Integrated Manufacturing, Group Technology ,Matrix
Laboratory, Excel Spread Sheet
I. Introduction
In manufacturing, the goal is to produce components
that meet the design specifications. The design specification
ensures the functionality aspect. Computer-aided process
planning (CAPP) is a bridge between design and manufacturing
in a Computer-Integrated manufacturing (CIM) environment.
Process planning systems are ordered sequences of task, able to
transform raw material into a final part under economical,
qualitative and competitive conditions. Process planning is a
production organization activity that transforms a product design
into a set of instructions to manufacture a machined part
economically and competitively. The information provided in
design includes dimensional specification (geometric shape and
its feature) and technical specification (tolerance, surface finish
etc.) and sequence of operations.
The major process planning activities are interpretation
of product design data, selection of machining processes,
determination of datum surfaces and fixtures, sequencing the
operations, determination of part tolerances, determination of the
cutting parameters, allocation of required manufacturing
resources such as machine tools, cutting tools, jigs and fixtures,
estimation of production times and generation of NC data.
Hence, CAPP has a strong impact on manufacturability
conditions, product quality and production cost.
New approaches tend to integrate CAD, CAPP and CAM
systems together, by using feature-based technology. Recently, a
new trend toward integration is to utilize adaptive, dynamic and
distribution process planning implies that production instructions
for machining a part are generated dynamically and adaptively in
accordance with changeable shop floor status. In other words,
process plan information is generated in real-time in the shop
floor based on current information of shop stages.
Alting and Zhang (1989); Hoda and elmaraghy (1993)
and Kiritsis overviewed on process planning (2001). Altinget. Al,
(1989) Computer aided process planning (CAPP) recognized as
playing key role in Computer Integrated Manufacturing (CIM).
Delbressine, et.al. (1993) have developed a design methodology,
which considers manufacturing restrictions in the geometric
design phase Machining operations have been sequenced in an
effort to minimize the total machining and tooling cost by Lin
and Wang (1993) and Koulomas. Goldberg (1989), Usher and
Bowden (1996) were mentioned that the genetic algorithm with
different coding schemes to reduce the size of the solution space.
Kusiak and Finke (1984) were developed a model for the
selection of a set of process plans, with minimum cost of
removing the material and minimal number of machine tools.
Bennet and Gupta (1969, 1970) synthesized tolerances by
minimizing the sum of the residual tolerance after stack up in
each design constraint. Similar approaches were used by Ostwald
and Huang (1977), Bjorke (1978), and Wade (1983).
Szadkowski (1971) used a graphical representation of
the feasible machining processes at each stage of the process
plan, and used Bellman’s optimum principle to determine the
economical path.
Process planning translates design information into the
process steps and instructions to efficiently and effectively
manufacture products [Crow, 1992]. Process planning can be
divided into macro and micro level production planning [Ham,
1988; Yao, 2003]. The macro level planning is to determine
the setups and process sequences and the micro level
planning is to determine the process details. Computer-aided
process planning (CAPP) has been studied intensively for years
[Zhang, 1999].
II . Manufacturing Process Planning Database.
Process planning system database
The data base of process planning system related to the
information of machines tools, cutting tools, accessories,
machining parameters data, raw materials data and various
manufacturing cost analysis data etc. That related information
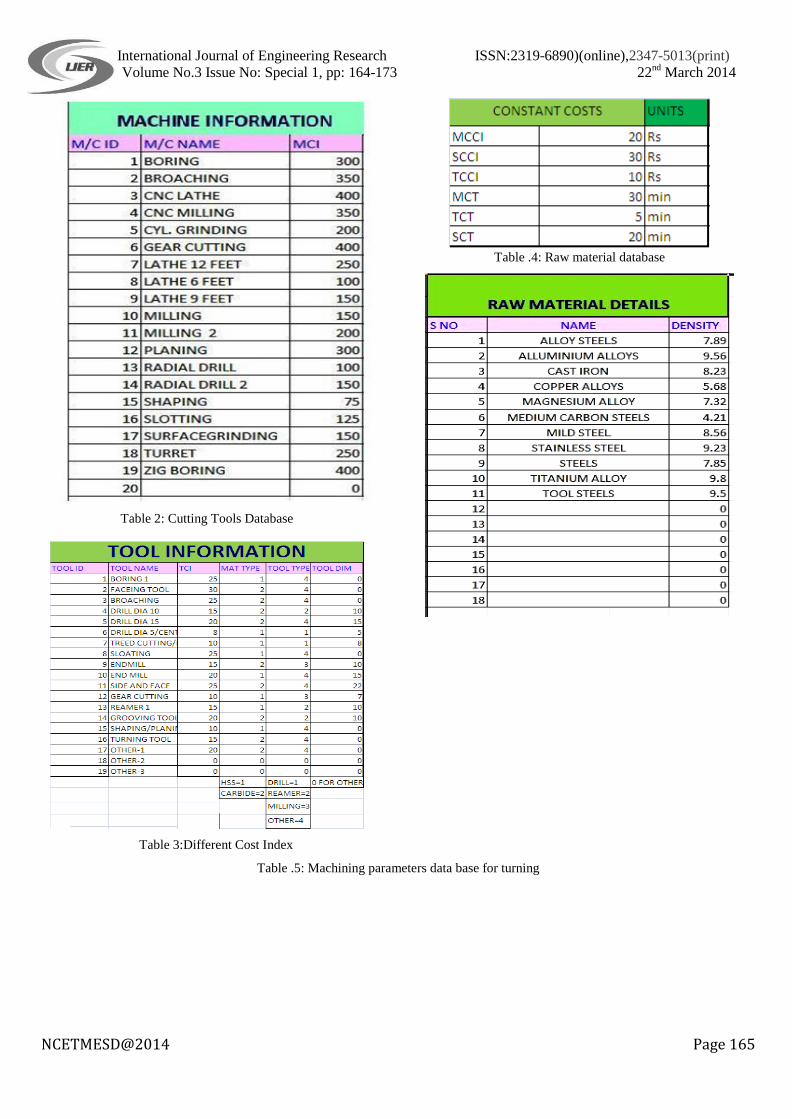
data base shown in the following tables.
Table 1: Machines tools Database
International Journal of Engineering Research ISSN:2319-6890)(online),2347-5013(print)
Volume No.3 Issue No: Special 1, pp: 164-173 22nd
March 2014
NCETMESD@2014 Page 165
Table 2: Cutting Tools Database
Table 3:Different Cost Index
Table .4: Raw material database
Table .5: Machining parameters data base for turning

International Journal of Engineering Research ISSN:2319-6890)(online),2347-5013(print)
Volume No.3 Issue No: Special 1, pp: 164-173 22nd
March 2014
NCETMESD@2014 Page 167
Table 6: Machining parameters for planning/shaping/slotting
Table 7: Machining parameters for drilling/reaming
Table 8: Tolerance table Machining Operations

International Journal of Engineering Research ISSN:2319-6890)(online),2347-5013(print)
Volume No.3 Issue No: Special 1, pp: 164-173 22nd
March 2014
NCETMESD@2014 Page 168
Tolerance Range of Machining Operations(±mm)
Operation Range of Nominal Dimensions (mm)
0-14.9 15-24.9 25-37.9 38-69.9 70-114.9 115-199.9 200-344.9 345-533
Drilling
0.050 ~
0.127
0.064 ~
0.152
0.076 ~
0.203
0.102 ~
0.254
0.127
~ 0.381
0.152 ~
0.381
0.203 ~
0.503
0.254 ~
0.635
Milling
0.030 ~
0.127
0.038 ~
0.152
0.050 ~
0.203
0.064 ~
0.254
0.076
~ 0.305
0.102 ~
0.381
0.127 ~
0.508
0.152 ~
0.635
Turning Boring Planing
0.020 ~
0.127
0.025 ~
0.152
0.030 ~
0.203
0.038 ~
0.254
0.050 ~
0.305
0.054 ~
0.381
0.076 ~
0.508
0.102 ~
0.635
Reaming
0.008 ~
0.050
0.010 ~
0.064
0.013 ~
0.076
0.015 ~
0.102
0.020 ~
0.127
0.025 ~
0.152
0.030 ~
0.203
0.040 ~
0.254
Broaching
0.005 ~
0.020
0.006 ~
0.025
0.008 ~
0.030
0.010 ~
0.038
0.013 ~
0.050
0.015 ~
0.064
0.020 ~
0.076
0.025 ~
0.102
Grinding Diamond Turning
0.004 ~
0.013
0.004 ~
0.015
0.005 ~
0.020
0.006 ~
0.025
0.008 ~
0.030
0.010 ~
0.038
0.013 ~
0.050
0.015 ~
0.064
Lapping and
Honing
0.004 ~
0.008
0.004 ~
0.010
0.005 ~
0.013
0.006 ~
0.015
0.008
~
0.020
0.010 ~
0.025
0.013 ~
0.030
0.015 ~
0.040
III. Optimization techniques for CAPP Geometric programming is a useful method that can be used
for solving nonlinear problems subject to nonlinear
constraints, especially if the objective function to be
optimized is a polynomial with fractional and negative
exponents, while the constraints may be incorporated in the
solution techniques. It is more powerful than other
mathematical optimization techniques when the problem is
restricted by one or two constraints. However if the degree of
difficulty increases the formulated problem might be more
complicated than the original problem. Geometric
programming can only handle continuous variables.
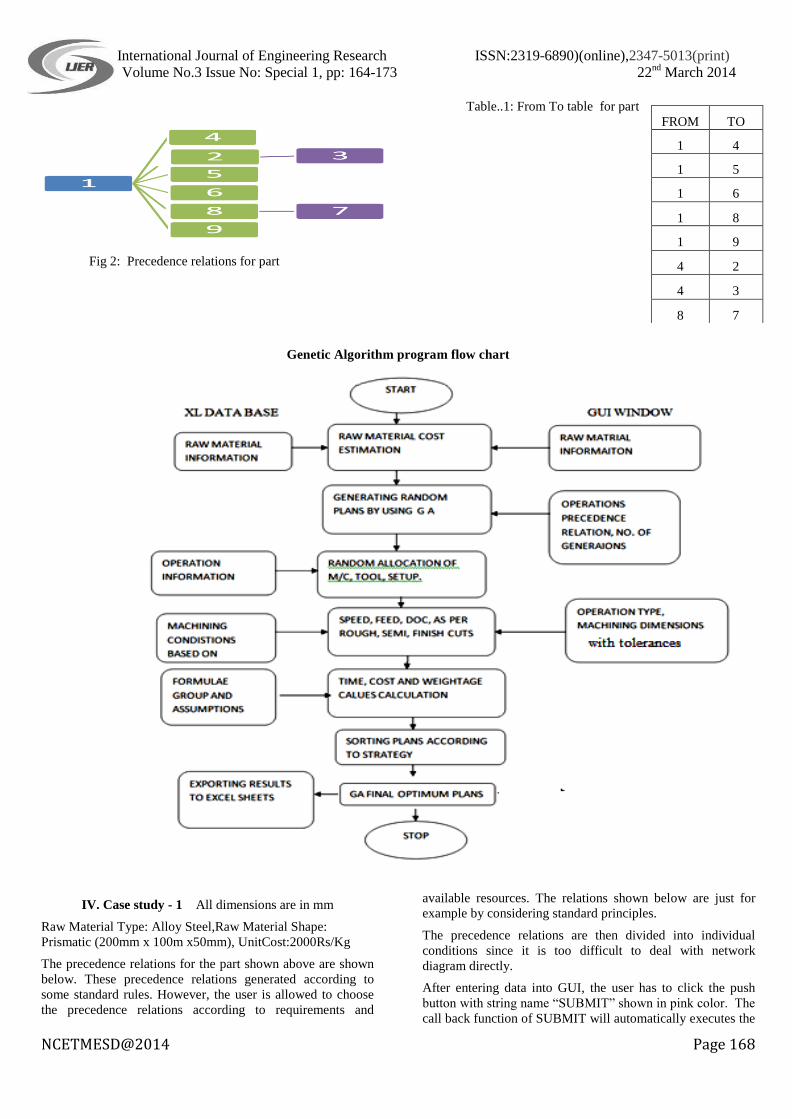
. Flow chart of process plans using GA
The process plan process, in this input are importing
by using GUI and data base read by using EXCEL SHEET,
output best plans, final plane time and cost are exporting in
this data importing and read, output exporting in the different
stages different values are importing and exporting that can
be show in the flow chart below .
Fig 1: Genetic algorithm flow chart
Optimization Process Plans using Genetic Algorithm
The data read from precedence relations is used for
generation of required number of plans which satisfies
precedence relations. The precedence relations should give as
specified. In present work, the precedence relations divided
into individual conditions which the sequence has to satisfy.
For example, the precedence relations for the following
network diagram
Precedence relations: From To table:
International Journal of Engineering Research ISSN:2319-6890)(online),2347-5013(print)
Volume No.3 Issue No: Special 1, pp: 164-173 22nd
March 2014
NCETMESD@2014 Page 168
Table..1: From To table for part
Fig 2: Precedence relations for part
Genetic Algorithm program flow chart
IV. Case study - 1 All dimensions are in mm
Raw Material Type: Alloy Steel,Raw Material Shape:
Prismatic (200mm x 100m x50mm), UnitCost:2000Rs/Kg
The precedence relations for the part shown above are shown
below. These precedence relations generated according to
some standard rules. However, the user is allowed to choose
the precedence relations according to requirements and
available resources. The relations shown below are just for
example by considering standard principles.
The precedence relations are then divided into individual
conditions since it is too difficult to deal with network
diagram directly.
After entering data into GUI, the user has to click the push
button with string name ―SUBMIT‖ shown in pink color. The
call back function of SUBMIT will automatically executes the
FROM TO
1 4
1 5
1 6
1 8
1 9
4 2
4 3
8 7

International Journal of Engineering Research ISSN:2319-6890)(online),2347-5013(print)
Volume No.3 Issue No: Special 1, pp: 164-173 22nd
March 2014
NCETMESD@2014 Page 169
program and prints the computed results in EXCEL SHEETS
as shown below.
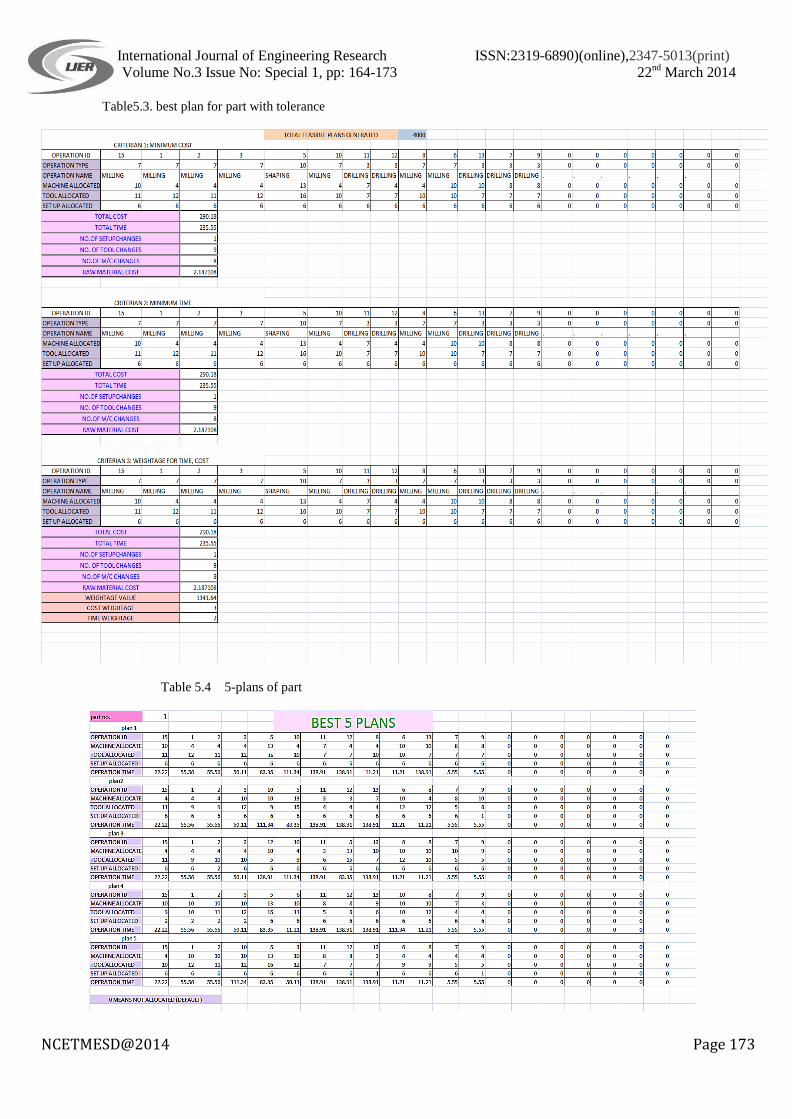
By clicking on SUBMIT, the program starts to execute and
the following results will be exported to excel sheets as shown
below. The first Table5.3 shows the GA best plans generated
according to strategy and the second one Table 5.4 shows the
best alternative plans according to weightage value.
However, the best alternative plans according to time or cost
can be shown since we have already sorted the generated
plans according to cost and time. The user may give zero
weightage to one criterion in order to get the best alternative
plan according to the remaining criteria.
Results And Conclusions
From the present work, it is evident that genetic algorithm is
applicable to solve the problems where, the number of
constraints are more. From the results of the case studies
shown in previous chapter, it is concluded that, Genetic
algorithm can give optimum solution with reasonable time
and acceptable accuracy as compared to other AI techniques.
Conclusion
GA is capable of performing multi-objective optimization
based on minimum production cost or minimum processing
time. Based on the objective selected, optimal solutions can
be obtained using the GA. In this work, the developed
program in MATLAB has the flexibility to choose the
operations sequences based on minimum machining time.
References
i. Ahmad Nafis, AnwarulHaque A.F.M., ―Optimization Of
Process Planning Parameters For Rotational
Components By Genetic Algorithms‖, 4th
International
Conference on Mechanical Engineering, December 26-
28, 200.
ii. Abdou, G. and Cheng, R., 1993, TVCAPP, tolerance
verification in computer-aided process planning.
International Journal of Production Research, 31,
393–411.
iii. Alting, L., Zhang, H., 1989, ―Computer aided process
planning: the stateof the art survey,‖ International
Journal of Production Research, Vol. 27, No. 4,
pp. 553-585.
iv. Bhaskara Reddy S. V., Shunmugam M. S., and
Narendran T. T., ―Operation Sequencing in CAPP Using
Genetic Algorithms‖, International Journal of
Production Research, 1999, Vol. 37, No. 5, 1063-1074.
v. Champati, S., Lu, W. F., and Lin, A. C, 1996,
"Automated Operation Sequencing in Intelligent Process
Planning: A Case-Based Reasoning Approach," The
International journal, advanced manufacturing
technology. Vol. 12, No. 1, pp. 21.
vi. Dong-ho Lee, D. Kiritsis and P. Xirouchakis, ―Search
heuristics for operation sequencing in process
planning‖. INT, J.PROD. RES., 2001, VOL.39, NO.16,
3771-3788.
vii. Diplaris, S. C. and Sfantsikopulos, M. M., 2000, Cost-
Tolerance Function. A new approach for cost optimum
machining accuracy. International Journal of Advanced
Manufacturing Technology.
viii. Evans, D.H., "Statistical Tolerancing: The State of the
Art, Part 1," Journal of Quality Technology, Vol. 7, No.
1, pp. 1-12, January 1975.
ix. G.C. Onwubolu and T.Kumalo, ―Optimization of
multipass turning operations with genetic algorithms
―INT.J.PROD,RES, 2001, VOL, 39, NO. 16, 3727-3745
x. Greenwood, W.H., and K.W. Chase, "A New Tolerance
Analysis Method for Designers and Manufacturers,"
Journal of Engineering for Industry, Transactions of
ASME, Vol. 109, May 1987
xi. Houck, C.R., Joines, J.A., and Kay, M.G., 1995, A
Genetic Algorithm for Function Optimization: A Matlab
Implementation, NCSU-IE TR 95-09, North Carolina
State University
xii. Irani, S. A., Mittal, R. O., and Lehtihet, E. A., 1989,
"Tolerance Chart Optimization, "International Journal of
Production Research, Vol. 27, No. 9, pp. 1531-1552.
xiii. ISO 286-1, ―Bases of tolerances, deviations and fits‖,
International Organization for Standardization, Geneva,
Switzerland, 1988.
xiv. J. Vancza and A. Markus. Features and the principle of
locality in process planning. International Journal of
Computer Integrated Manufacturing, 6(1-2):126-136,
1993.
xv. Kaushal, P., Raman, S., Pulat, P. S., 1992, ―Computer-
aided tolerance assignment procedure (CATAP) for
design dimensioning‖, The International Journal of
Production Research, pp. 599-610.
xvi. Lin, Edward Enhao, Zhang Hong-Chao, 1999,
"Theoretical Tolerance Stackup Analysis Based on
Tolerance Zone Analysis," the International Journal of
Advanced Manufacturing Technology, accepted.
xvii. L. Li, J.Y.H. Fuh, Y.F.Zang, and A.Y.C. Nee .
―Application of genetic algorithm to computer-aided
process planning in distributed manufacturing
environments‖ Robotics and Computer-Integrated
Manufacturing 21 (2005) 568–578
xviii. .Ngoi, B. K. A. and Seow, M. S., 1996, ―Tolerance
control for dimensional and geometric specifications,‖

International Journal of Engineering Research ISSN:2319-6890)(online),2347-5013(print)
Volume No.3 Issue No: Special 1, pp: 164-173 22nd
March 2014
NCETMESD@2014 Page 170
International Journal of Advanced Manufacturing
Technology, vol. 11, pp. 34-42
xix. R. S. Ahluwalia. Tolerance analysis in process planning.
International Journal of Industrial Engineering-Theory
Applications and Practice, 9(4):334-342, 2002.
xx. S.A. Irani, H.Y. Koo, S. Raman, ―Feature Based
Operation Sequence Generation in CAPP‖, International
Journal of Production Research, 1995, Vol. 33, No. 1,
17-39.

International Journal of Engineering Research ISSN:2319-6890)(online),2347-5013(print)
Volume No.3 Issue No: Special 1, pp: 164-173 22nd
March 2014
NCETMESD@2014 Page 171
Operation Information Table:
Table5.1: Operations information table for part-1
L-Length, W-Width, H-Height, d-dia and D-Depth
F ID Feature Operations
Dimensions with Tolerance In mm
Dimensions Tolerance Total
F1 Surface Milling L-200, W-100, H-50 0.076
F2 Surface Milling L-200, W-100 0.076
F3 Pocket Vertical milling L-90, H-10 0.190 L=90.190, H=10.190
F4 Pocket Vertical milling L-10, W-40, H-10 0.190 L=10.190, W=40.190,H=10.190
F5 Step Shaping L-50,W-100,H-30 0.008
F6 Pocket Vertical milling L-20,W-20,H-10 0.190 L=20.190, W=20.190,H=10.19
F7 Hole Drilling d-10,Depth-10 0.127 D=10.127, Depth=10.127
F8 Pocket Vertical milling L-20,W-20,H-10 0.190 L=20.190, W=20.190, H=10.190
F9 Hole Drilling dia-10,Depth-10 0.127 D=10.127, Depth=10.127
F10 Pocket Vertical milling L-100,W-80,H-20 0.190 L=100.190, W=80.190, H=20.19
F11 Through hole Drilling d-10,Depth-50 0.127
F12 Through hole Drilling d-10,Depth-50 0.127
F13 Through hole Drilling d-10,Depth-50 0.127
F14 Through hole Drilling d-10,Depth-50 0.127
F15 Surface Milling L-200,W-100,H-2 0.076

International Journal of Engineering Research ISSN:2319-6890)(online),2347-5013(print)
Volume No.3 Issue No: Special 1, pp: 164-173 22nd
March 2014
NCETMESD@2014 Page 172
Precedence Relations:
Table.5.2: From To table for part-1
Fig 5.2: precedence relations for part-1
Fig .3: Input for part 1
FROM TO
15 1
15 2
1 3
2 5
2 10
2 11
2 12
2 13
5 6
5 8
6 7
8 9
International Journal of Engineering Research ISSN:2319-6890)(online),2347-5013(print)
Volume No.3 Issue No: Special 1, pp: 164-173 22nd
March 2014
NCETMESD@2014 Page 173
Table5.3. best plan for part with tolerance
Table 5.4 5-plans of part


