0
d
www.elsevier.com/locate/agee
Agriculture, Ecosystems and Environment 107 (2005) 101–116
Future scenarios of European agricultural land use
I. Estimating changes in crop productivity
F. Ewerta,*, M.D.A. Rounsevellb, I. Reginsterb,M.J. Metzgera, R. Leemansc
aDepartment of Plant Sciences, Group Plant Production Systems, Wageningen University, P.O. Box 430,
6700 AK Wageningen, The NetherlandsbDepartment of Geography, Universite catholique de Louvain, Place Louis Pasteur,
3, B1348 Louvain-la-Neuve, BelgiumcDepartment of Environmental Sciences, Group Environmental Systems Analysis, Wageningen University,
P.O. Box 47, NL-6700 AA Wageningen, The Netherlands
Received 6 July 2004; received in revised form 24 November 2004; accepted 2 December 2004
Abstract
The future of agricultural land use in Europe is unknown but is likely to be influenced by the productivity of crops. Changes in
crop productivity are difficult to predict but can be explored by scenarios that represent alternative economic and environmental
pathways of future development. We developed a simple static approach to estimate future changes in the productivity of food
crops in Europe (EU15 member countries, Norway and Switzerland) as part of a larger approach of land use change assessment
for four scenarios of the IPCC Special Report on Emission Scenarios (SRES) representing alternative future developments of the
world that may be global or regional, economic or environmental. Estimations were performed for wheat (Triticum aestivum) as
a reference crop for the time period from 2000 until 2080 with particular emphasis on the time slices 2020, 2050 and 2080.
Productivity changes were modelled depending on changes in climatic conditions, atmospheric CO2 concentration and
technology development. Regional yield statistics were related to an environmental stratification (EnS) with 84 environmental
strata for Europe to estimate productivity changes depending on climate change as projected by the global climate model
HadCM3. A simple empirical relationship was used to estimate crop productivity as affected by increasing CO2 concentration
simulated by the global environment model IMAGE 2.2. Technology was modelled to affect potential yield and the gap between
actual and potential yield. We estimated increases in crop productivity that ranged between 25 and 163% depending on the time
slice and scenario compared to the baseline year (2000). The increases were the smallest for the regional environmental scenario
and the largest for the global economic scenario. Technology development was identified as the most important driver but
relationships that determine technology development remain unclear and deserve further attention. Estimated productivity
changes beyond 2020 were consistent with changes in the world-wide demand for food crops projected by IMAGE. However,
estimated increases in productivity exceeded expected demand changes in Europe for most scenarios, which is consistent with
* Corresponding author. Tel.: +31 317 48 47 71; fax: +31 317 48 48 92.
E-mail address: [email protected] (F. Ewert).
167-8809/$ – see front matter # 2004 Elsevier B.V. All rights reserved.
oi:10.1016/j.agee.2004.12.003
F. Ewert et al. / Agriculture, Ecosystems and Environment 107 (2005) 101–116102
the observed present oversupply in Europe. The developed scenarios enable exploration of future land use changes within the
IPCC SRES scenario framework.
# 2004 Elsevier B.V. All rights reserved.
Keywords: Crop productivity; Modelling; Technology development; Climate change; Increasing CO2; Land use change
1. Introduction
Demand for food will further increase in the 21st
century (Dyson, 1999; Johnson, 1999; Rosegrant
et al., 2001; FAO, 2003b) which can only be met
through increases in production area or in the amount
of production per unit land area, henceforth ‘‘pro-
ductivity’’. However, limited available land, expan-
sion of other land use types and environmental
sustainability issues restrict further extension of
agricultural land in large parts of the world. In fact,
agricultural land use in Europe has declined over the
last four decades by about 13% (Rounsevell et al.,
2003). At the same time crop productivity has
increased considerably and food production even
exceeded demand for food. Further increases in the
productivity of crops are likely to have substantial
implications for agricultural land use.
Changes in crop productivity depend on different
bio-physical and socio-economic factors and are
difficult to assess. Process-based, bio-physical models
are increasingly used to estimate productivity and food
supply under climate change (Rosenzweig and Parry,
1994; Harrison and Butterfield, 1996; Nonhebel, 1996;
Brown and Rosenberg, 1997; Downing et al., 1999;
Easterling et al., 2001; Parry et al., 2004), but have
several limitations. Important yield restricting factors
such as pests and diseases, soil salinity and acidity and
atmospheric pollution are often not considered and
simulations of actual yields remain difficult (Landau
et al., 1998; Jamieson et al., 1999; Ewert et al., 2002).
Also, advances in technology associated with
improved crop management and better varieties via
progress in breeding that are largely responsible for the
obtained yield increases in the past decades (Evans,
1997; Amthor, 1998; Reynolds et al., 1999) are not
accounted for in bio-physical models as quantification
of such effects was not an original aim for their
development. While only few studies have explicitly
evaluated scaling-up procedures for crop models from
field to regional scale (Easterling et al., 1998; Olesen
et al., 2000), there are many examples in which site-
based models have been applied in regional and larger
scale studies on climate change impacts (Easterling
et al., 1993; Downing et al., 1999; Parry et al., 1999,
2004; Izaurralde et al., 2003; Reilly et al., 2003; Tan
and Shibasaki, 2003). Generally, the state of model
validation for regional application of site-based models
is unsatisfactory (Ewert et al., 2002; Tubiello and
Ewert, 2002) and the confidence in the obtained results
is still limited. Another group of models explicitly
developed to simulate vegetation growth and dynamics
at larger scales such as LPJ (Sitch et al., 2003), CASA
(Potter et al., 1993) or IMAGE (IMAGE-team, 2001)
makes no specific or only fragmented (IMAGE-team,
2001) reference to agricultural crops.
In the absence of a sufficient mechanistic under-
standing of relationships that determine regional
changes in actual yields, statistical models provide
an alternative option as they allow relatively simple
description of important relationships. However, the
applicability of such models outside the range of
conditions that were used for their development is
limited and prediction of future productivity is not
possible. Alternatively, future developments can be
explored with scenarios that represent coherent,
internally consistent and plausible descriptions of
the system under investigation. Importantly, scenario
development emphasises joint definition of a problem
and synthesis of ideas, rather than extended and deeper
analysis of a single viewpoint (Davis, 2002). A
suitable concept for the development of alternative
scenarios of future crop productivity is provided by the
IPCC Special Report on Emission Scenarios (SRES)
(Nakicenovic et al., 2000). The unique character of the
SRES scenario framework lies in the integrated
representation for alternative scenarios of the bio-
physical and socio-economic dimensions of future
development. The four scenario families describe
future worlds that may be global economic (A1),
global environmental (B1), regional economic (A2) or
regional environmental (B2).
F. Ewert et al. / Agriculture, Ecosystems and Environment 107 (2005) 101–116 103
Predictions of crop productivity world-wide or for
selected world regions have been made based on
statistical trends (Tweeten, 1998; Dyson, 1999;
Johnson, 1999; Rosegrant et al., 2001; FAO, 2003b).
However, extrapolation of historic trends was often
done for one scenario only without consideration of
changes in climatic conditions and CO2 concentration.
In fact, alternative scenarios of future productivity that
consider combined changes in bio-physical factors and
technology development and which are consistent with
the SRES storylines to allow scenario-based analyses
of land use change are not yet available.
The aim of the present study was the development of
alternative scenarios for future changes in crop
productivity in Europe. The scenarios follow the SRES
storylines A1FI (i.e. the fossil fuel intensive scenario
within the A1 scenario family), A2, B1 and B2.
Productivity changes were calculated for the time
period from 2000 (baseline year) until 2080 with an
emphasis on the years 2020, 2050 and 2080. The
scenarios were developed as an integrated part of a
larger framework aiming at the construction of quanti-
tative regional scenarios of agricultural land use change
in Europe (Rounsevell et al., 2005). This work contri-
butes to the integration of knowledge about bio-
physical and socio-economic processes that determine
changes in crop productivity. It intends to provide
information in support of investigations about future
land use in Europe and related consequences for multi-
functional agriculture and sustainable food production.
In order to avoid complicated representation of a com-
plex system, it was important to develop an approach
that is simple and transparent but still captures impor-
tant relationships and drivers of productivity change.
2. Methods
2.1. Analysis of historic yield trends
The analysis of historic yield trends for major
European crops was based on data provided by the
Food and Agriculture Organization (FAO, 2003a).
Crop yields were considered from 1961 until 2002 of
the 15 EU-member countries (EU15)1 plus Norway
1 The EU had 15 member countries at the time the present study
was performed.
and Switzerland. Yield trends were calculated by
fitting linear regression lines through the observed
data. For most crops and countries, historic increases
in crop yields were best described by single regression
line for the time period considered which had the
form:
Ye ¼ fY � ty þ b (1)
where Ye is the estimated yield at a particular year ty.
The annual rate of yield change is represented by fY,
and b is an empirical parameter. Definitions of para-
meters are summarised in Table 1. Changes in yield
trends in Europe, i.e. higher annual rates of yield
increase, were observed at about 1960 (Evans,
1997; Calderini and Slafer, 1998), and have been
almost stable since this time. Importantly, relative
changes in estimated yields declined as yields
increased (see Section 2.2.2) and were calculated from
Yr ¼YeðtyÞ
Yeðty � 1Þ (2)
where Yr represents the relative yield change between
years calculated from the fitted regression lines
through observed yields.
2.2. Modelling future changes in primary
productivity
2.2.1. Supply–demand model
The developed model for estimating productivity
changes is part of a larger modelling approach that
aimed to estimate future changes in agricultural land
use in Europe (Rounsevell et al., 2005). The model is
based on simple supply/demand relationships and is
described in more detail elsewhere (Rounsevell et al.,
2005). Briefly, it is assumed that changes in
agricultural land use (L) at any time in the future (t)
compared to the present baseline (t0) are determined
by changes in demand (D), productivity (P) and
oversupply (O):
Lt
Lt0
¼ Dt
Dt0
Pt0
Pt
Or;t
Or;t0
(3)
Changes in productivity were modelled in more detail
accounting for effects on crop productivity of climate
change, increasing CO2 concentration and technology
development that are known as the most important
drivers of productivity change. Importantly, it was
assumed that the effects of these factors on crop
F. Ewert et al. / Agriculture, Ecosystems and Environment 107 (2005) 101–116104
Table 1
Definition of symbols and parameter values (see text for further explanation)
Symbol Unit Definition
b t ha�1 Empirical parameter
C ppm Atmospheric CO2 concentration
D t Demand for food crops
fCO,r ppm�1 Relative CO2 effect on yield (0.08 ppm�1)
fT;Gr – Factor that represents actual yield as a relative fraction of potential yield which changes due
to technology development
fT;Pr – Factor that accounts for changes in potential yield gains due to technology development
fy t ha�1 year�1 Rate of yield change
L ha Area of agricultural land use
n – Number of grid cells (18508)
Or – Relative oversupply
P t Productivity
Pt,CO t Future productivity as affected by increasing atmospheric CO2 concentration
Pt,Cl t Future productivity as affected by climate change
Pt,T t Future productivity as affected by technology development
t years Year of estimation
t0 years Baseline year
ts years Scenario time period
ty years Year of estimated yield
Ye t ha�1 Estimated yield
Yr – Relative yield change
Yr,a – Annual increment in the relative yield change with reference to the baseline year
YGit ha�1 Average yield in a 10 ft � 10 ft grid cell
productivity were additive. Interactions between these
factors have been reported, e.g. CO2 effects are likely
to change with temperature increase (Long, 1991;
Morison and Lawlor, 1999), water or nitrogen avail-
ability (Kimball et al., 2002). However, experimental
evidence from which to derive relationships for dif-
ferent regions and management practices is limited
(Ewert et al., 2002; Tubiello and Ewert, 2002) and
there is no evidence about the significance of such
interactions at larger spatial scales such as regions,
countries or even globally. Thus, changes in produc-
tivity were calculated from:
Pt0
Pt¼ 1
1 þ ððPt;Cl=Pt0� 1Þ þ ðPt;CO=Pt0
� 1ÞþðPt;T=Pt0
� 1ÞÞ
(4)
where Pt,Cl, Pt,CO and Pt,T represent future productiv-
ity as affected by climate change, increasing CO2
concentrations and technology development, respec-
tively.
2.2.2. Effects of technology development
Yields of major European crops have steadily
increased since the 1960s (Table 2) which has largely
been due to technology development. The term
technology development as used in this study refers
to all measures related to crop management (e.g.
improved machinery, pesticides and herbicides, etc.,
and agronomic knowledge of farmers) and breeding
(development of higher yielding varieties through
improved stress resistance and/or yield potential) that
result in yield increase. Higher yields were achieved
both through increasing potential yield and reducing
the gap between potential and actual yields, further
referred to as the ‘‘yield gap’’. While increase in
potential yield is achieved through breeding (e.g. via
improved light capturing or light conversion efficiency
into biomass), decrease in the yield gap may be realised
via improved crop management practices or breeding
(e.g. via improved resistance to biotic or abiotic
stresses). Increasing demand for food and competitive
pressure posed by other land use types (e.g. urban land
use) are likely to require further productivity raises that
can only be achieved via advances in technology
(Austin, 1999; Evans and Fischer, 1999; Johnson,
1999; Reynolds et al., 1999; Borlaug, 2000).
Technology effects on future productivity were
modelled based on historic yield trends. However,
F. Ewert et al. / Agriculture, Ecosystems and Environment 107 (2005) 101–116 105
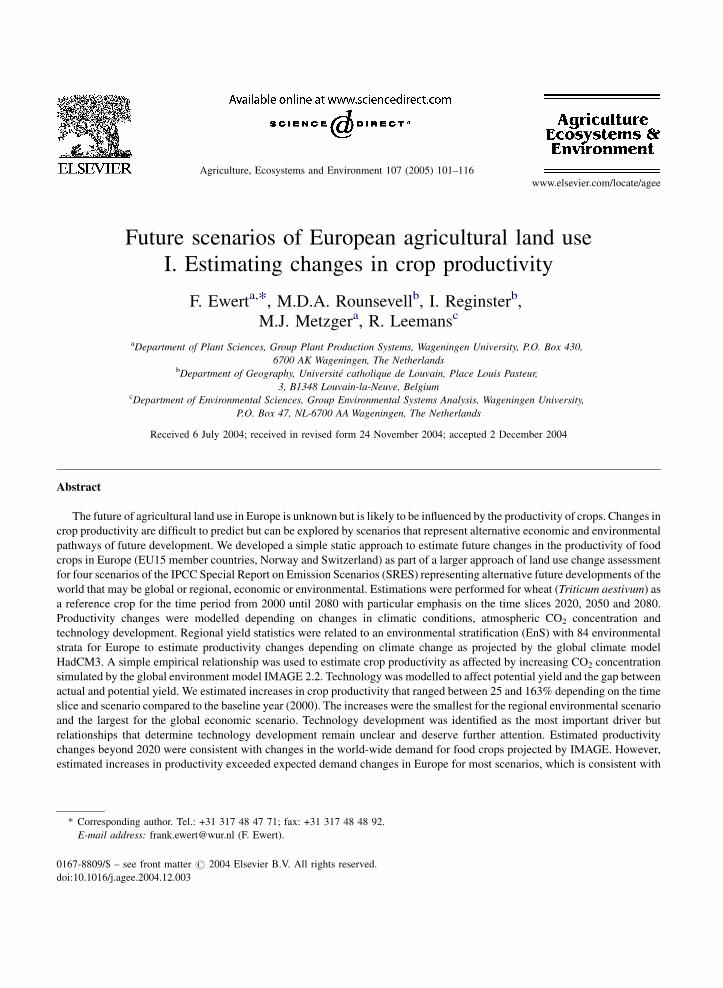
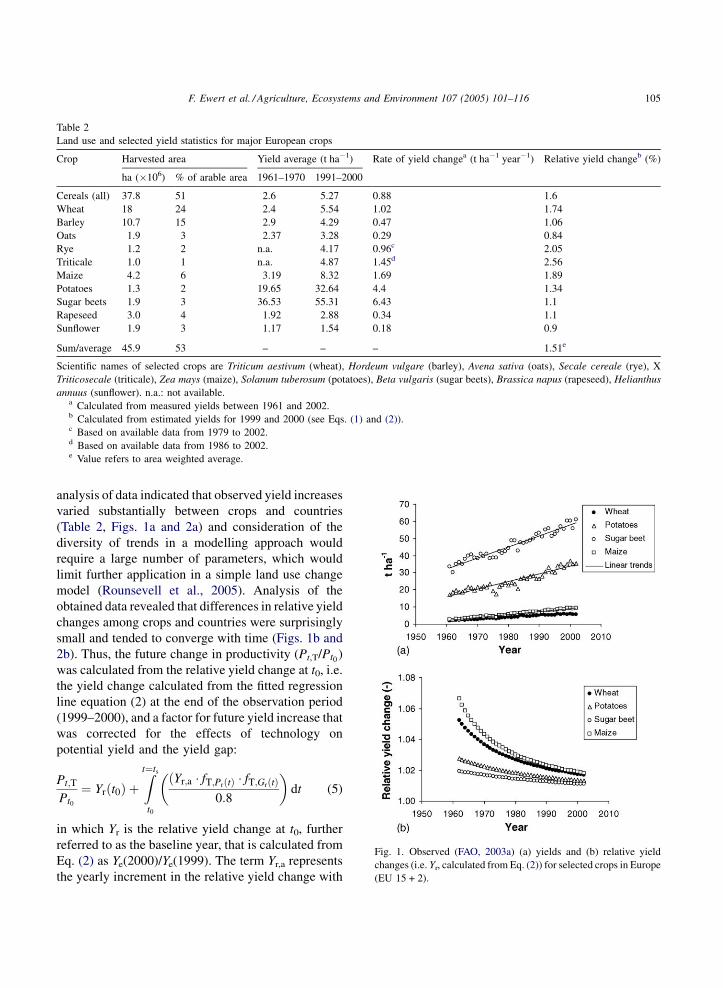
Fig. 1. Observed (FAO, 2003a) (a) yields and (b) relative yield
changes (i.e. Yr, calculated from Eq. (2)) for selected crops in Europe
(EU 15 + 2).
Table 2
Land use and selected yield statistics for major European crops
Crop Harvested area Yield average (t ha�1) Rate of yield changea (t ha�1 year�1) Relative yield changeb (%)
ha (�106) % of arable area 1961–1970 1991–2000
Cereals (all) 37.8 51 2.6 5.27 0.88 1.6
Wheat 18 24 2.4 5.54 1.02 1.74
Barley 10.7 15 2.9 4.29 0.47 1.06
Oats 1.9 3 2.37 3.28 0.29 0.84
Rye 1.2 2 n.a. 4.17 0.96c 2.05
Triticale 1.0 1 n.a. 4.87 1.45d 2.56
Maize 4.2 6 3.19 8.32 1.69 1.89
Potatoes 1.3 2 19.65 32.64 4.4 1.34
Sugar beets 1.9 3 36.53 55.31 6.43 1.1
Rapeseed 3.0 4 1.92 2.88 0.34 1.1
Sunflower 1.9 3 1.17 1.54 0.18 0.9
Sum/average 45.9 53 – – – 1.51e
Scientific names of selected crops are Triticum aestivum (wheat), Hordeum vulgare (barley), Avena sativa (oats), Secale cereale (rye), X
Triticosecale (triticale), Zea mays (maize), Solanum tuberosum (potatoes), Beta vulgaris (sugar beets), Brassica napus (rapeseed), Helianthus
annuus (sunflower). n.a.: not available.a Calculated from measured yields between 1961 and 2002.b Calculated from estimated yields for 1999 and 2000 (see Eqs. (1) and (2)).c Based on available data from 1979 to 2002.d Based on available data from 1986 to 2002.e Value refers to area weighted average.
analysis of data indicated that observed yield increases
varied substantially between crops and countries
(Table 2, Figs. 1a and 2a) and consideration of the
diversity of trends in a modelling approach would
require a large number of parameters, which would
limit further application in a simple land use change
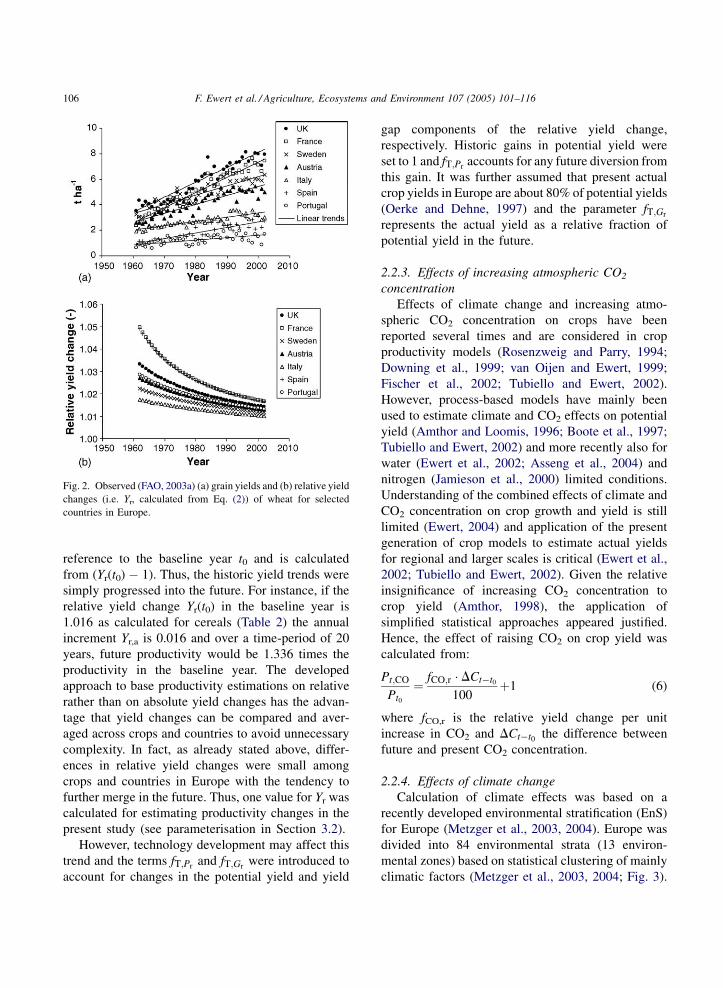
model (Rounsevell et al., 2005). Analysis of the
obtained data revealed that differences in relative yield
changes among crops and countries were surprisingly
small and tended to converge with time (Figs. 1b and
2b). Thus, the future change in productivity (Pt,T/Pt0 )
was calculated from the relative yield change at t0, i.e.
the yield change calculated from the fitted regression
line equation (2) at the end of the observation period
(1999–2000), and a factor for future yield increase that
was corrected for the effects of technology on
potential yield and the yield gap:
Pt;T
Pt0
¼ Yrðt0Þ þZt¼ts
t0
ðYr;a � fT;PrðtÞ � fT;GrðtÞ0:8
� �dt (5)
in which Yr is the relative yield change at t0, further
referred to as the baseline year, that is calculated from
Eq. (2) as Ye(2000)/Ye(1999). The term Yr,a represents
the yearly increment in the relative yield change with
F. Ewert et al. / Agriculture, Ecosystems and Environment 107 (2005) 101–116106
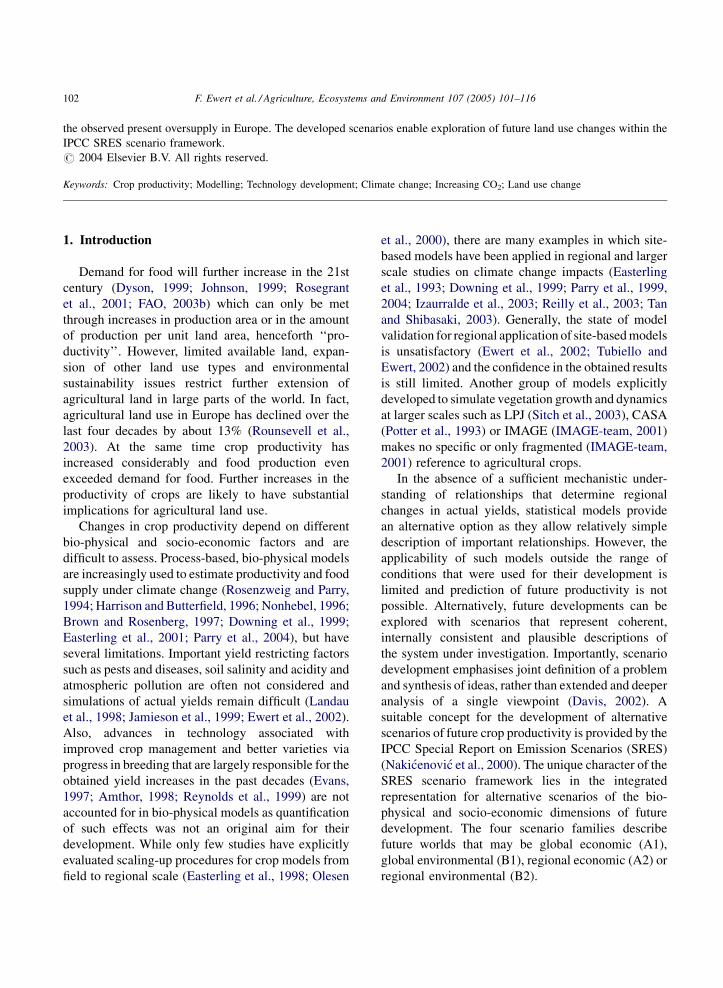
Fig. 2. Observed (FAO, 2003a) (a) grain yields and (b) relative yield
changes (i.e. Yr, calculated from Eq. (2)) of wheat for selected
countries in Europe.
reference to the baseline year t0 and is calculated
from (Yr(t0) � 1). Thus, the historic yield trends were
simply progressed into the future. For instance, if the
relative yield change Yr(t0) in the baseline year is
1.016 as calculated for cereals (Table 2) the annual
increment Yr,a is 0.016 and over a time-period of 20
years, future productivity would be 1.336 times the
productivity in the baseline year. The developed
approach to base productivity estimations on relative
rather than on absolute yield changes has the advan-
tage that yield changes can be compared and aver-
aged across crops and countries to avoid unnecessary
complexity. In fact, as already stated above, differ-
ences in relative yield changes were small among
crops and countries in Europe with the tendency to
further merge in the future. Thus, one value for Yr was
calculated for estimating productivity changes in the
present study (see parameterisation in Section 3.2).
However, technology development may affect this
trend and the terms fT;Pr and fT;Gr were introduced to
account for changes in the potential yield and yield
gap components of the relative yield change,
respectively. Historic gains in potential yield were
set to 1 and fT;Pr accounts for any future diversion from
this gain. It was further assumed that present actual
crop yields in Europe are about 80% of potential yields
(Oerke and Dehne, 1997) and the parameter fT;Gr
represents the actual yield as a relative fraction of
potential yield in the future.
2.2.3. Effects of increasing atmospheric CO2
concentration
Effects of climate change and increasing atmo-
spheric CO2 concentration on crops have been
reported several times and are considered in crop
productivity models (Rosenzweig and Parry, 1994;
Downing et al., 1999; van Oijen and Ewert, 1999;
Fischer et al., 2002; Tubiello and Ewert, 2002).
However, process-based models have mainly been
used to estimate climate and CO2 effects on potential
yield (Amthor and Loomis, 1996; Boote et al., 1997;
Tubiello and Ewert, 2002) and more recently also for
water (Ewert et al., 2002; Asseng et al., 2004) and
nitrogen (Jamieson et al., 2000) limited conditions.
Understanding of the combined effects of climate and
CO2 concentration on crop growth and yield is still
limited (Ewert, 2004) and application of the present
generation of crop models to estimate actual yields
for regional and larger scales is critical (Ewert et al.,
2002; Tubiello and Ewert, 2002). Given the relative
insignificance of increasing CO2 concentration to
crop yield (Amthor, 1998), the application of
simplified statistical approaches appeared justified.
Hence, the effect of raising CO2 on crop yield was
calculated from:
Pt;CO
Pt0
¼ fCO;r � DCt�t0
100þ1 (6)
where fCO,r is the relative yield change per unit
increase in CO2 and DCt�t0 the difference between
future and present CO2 concentration.
2.2.4. Effects of climate change
Calculation of climate effects was based on a
recently developed environmental stratification (EnS)
for Europe (Metzger et al., 2003, 2004). Europe was
divided into 84 environmental strata (13 environ-
mental zones) based on statistical clustering of mainly
climatic factors (Metzger et al., 2003, 2004; Fig. 3).
F. Ewert et al. / Agriculture, Ecosystems and Environment 107 (2005) 101–116 107
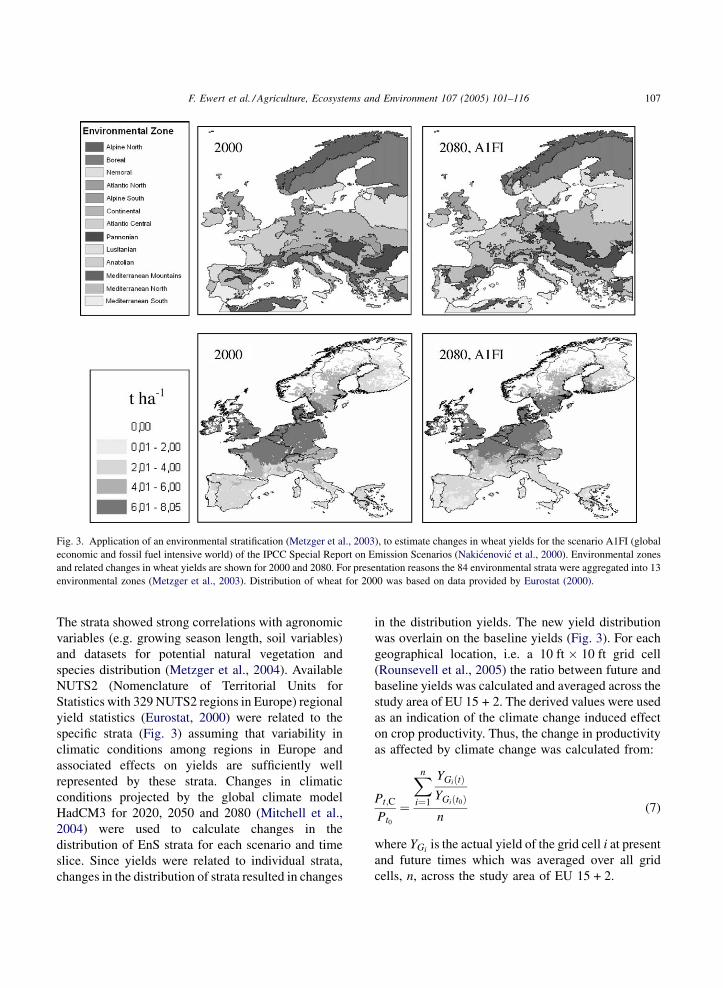
Fig. 3. Application of an environmental stratification (Metzger et al., 2003), to estimate changes in wheat yields for the scenario A1FI (global
economic and fossil fuel intensive world) of the IPCC Special Report on Emission Scenarios (Nakicenovic et al., 2000). Environmental zones
and related changes in wheat yields are shown for 2000 and 2080. For presentation reasons the 84 environmental strata were aggregated into 13
environmental zones (Metzger et al., 2003). Distribution of wheat for 2000 was based on data provided by Eurostat (2000).
The strata showed strong correlations with agronomic
variables (e.g. growing season length, soil variables)
and datasets for potential natural vegetation and
species distribution (Metzger et al., 2004). Available
NUTS2 (Nomenclature of Territorial Units for
Statistics with 329 NUTS2 regions in Europe) regional
yield statistics (Eurostat, 2000) were related to the
specific strata (Fig. 3) assuming that variability in
climatic conditions among regions in Europe and
associated effects on yields are sufficiently well
represented by these strata. Changes in climatic
conditions projected by the global climate model
HadCM3 for 2020, 2050 and 2080 (Mitchell et al.,
2004) were used to calculate changes in the
distribution of EnS strata for each scenario and time
slice. Since yields were related to individual strata,
changes in the distribution of strata resulted in changes
in the distribution yields. The new yield distribution
was overlain on the baseline yields (Fig. 3). For each
geographical location, i.e. a 10 ft � 10 ft grid cell
(Rounsevell et al., 2005) the ratio between future and
baseline yields was calculated and averaged across the
study area of EU 15 + 2. The derived values were used
as an indication of the climate change induced effect
on crop productivity. Thus, the change in productivity
as affected by climate change was calculated from:
Pt;C
Pt0
¼
Xn
i¼1
YGiðtÞYGiðt0Þ
n(7)
where YGiis the actual yield of the grid cell i at present
and future times which was averaged over all grid
cells, n, across the study area of EU 15 + 2.
F. Ewert et al. / Agriculture, Ecosystems and Environment 107 (2005) 101–116108
Table 3
Values of parameters that represent the effect of technology on
potential yield (fT;Pr ) and yield gap (fT;Gr ) for different scenarios of
the IPCC Special Report on Emission Scenarios (Nakicenovic et al.,
2000) and time slices
Parameter Year Scenario
A1FIa A2b B1c B2d
fT;Pr 2020 0.9 0.8 0.6 0.2
2050 0.8 0.6 0.4 0
2080 0.7 0.4 0.2 0
fT;Gr 2020 0.85 0.85 0.85 0.6
2050 0.9 0.9 0.9 0.6
2080 0.95 0.95 0.95 0.6
a Global economic and fossil fuel intensive world.b Regional economic world.c Global environmental world.d Regional environmental world.
3. Parameterisation
3.1. Historic yield trends and baseline yield increase
It is unclear to what extent the steady increases in
yields of major European crops since the Green
Revolution (Table 2) can be sustained into the future.
There is some evidence that yields have approached a
ceiling for a number of countries in recent years
(Calderini and Slafer, 1998). Further increase in
potential yield appears difficult with present agronomic
and breeding practices (Cassman, 1999). Also, crops in
developed countries have approached about 80% of
potential yields (Oerke and Dehne, 1997), which leaves
little room for increases in actual yields through
improved agronomic practices and varieties. However,
there is justifiable optimism for potential yield to further
increase in the future and meet the growing demand for
food (Austin, 1999; Evans and Fischer, 1999; Reynolds
et al., 1999), but to achieve this, advances in agronomic
and breeding techniques will be required (Evans and
Fischer, 1999). Progressing present yield increases into
the future will apparently provide sufficiently high
yields to meet future demands (Johnson, 1999). Thus,
present yield trends were considered to be the possible
maximum for future increases in productivity related to
technology development.
Analysis of available yield statistics for most
important crops in Europe indicated that the estimated
annual relative yield change was on average 1.45% for
EU 15 in 2000 (Table 2). Changes were more pro-
nounced for cereals such as wheat (Triticum aestivum)
(1.74%) and maize (Zea mays) (1.89%) than for root
crops such as potatoes (Solanum tuberosum) (1.34%)
and sugar beet (Beta vulgaris) (1.1%). Considering the
importance of individual crops in terms of growing
area, the area-weighted average was 1.51% (Table 2).
Since wheat is by far the most important food crop in
Europe it was considered as the reference crop and the
relative yield change of 1.75% (i.e. Yr = 1.0175 in
Eq. (5)) in 2000 as the theoretical maximum for future
increases in productivity (Table 2).
3.2. Technology development
Effects on productivity of technology development,
climate change and increasing CO2 concentration
were estimated following the IPCC SRES scenario
approach. Again, this was not an attempt to provide a
single and true prediction, but a range of alternative
possibilities for productivity changes. Thus, para-
meters had to reflect the future SRES worlds that could
be economic or environmental, global or regional.
Consequently, the scenario-specific parameters might
divert from the ‘‘real’’ development which, however,
should still fall within the range of possibilities
marked by the alternative scenarios. Selected char-
acteristics of the main SRES scenario families that are
likely to determine agricultural-technology develop-
ment in the future are summarized in Fig. 4.
Technology development was assumed to affect
potential yield and yield gap. Genetic gains in potential
yield have been almost 1% for irrigated wheat
(Reynolds et al., 1999) and improvement in genetic
yield potential is an important contributor to yield
increase in the future (Austin, 1999; Evans and Fischer,
1999; Reynolds et al., 1999). With the introduction of
the parameter fT;Pr (Eq. (5)) we calculated any diversion
from the historic gains in potential yield which was set
to 1. It was assumed that gains in potential yield will
gradually decrease depending on the scenario to
between 70 (A1FI) and 0% (B2) by 2080 compared
to 2000 (Table 3). There is evidence to suggest that the
present rate of yield increases can be maintained for
another decade with varieties currently tested in field
trials (Austin, 1999). In the global economic scenario
(A1FI) emphasis is on technology development to meet
the increasing world food demand (Fig. 4). Optimism
related to possible advances in biotechnology suggests
F. Ewert et al. / Agriculture, Ecosystems and Environment 107 (2005) 101–116 109
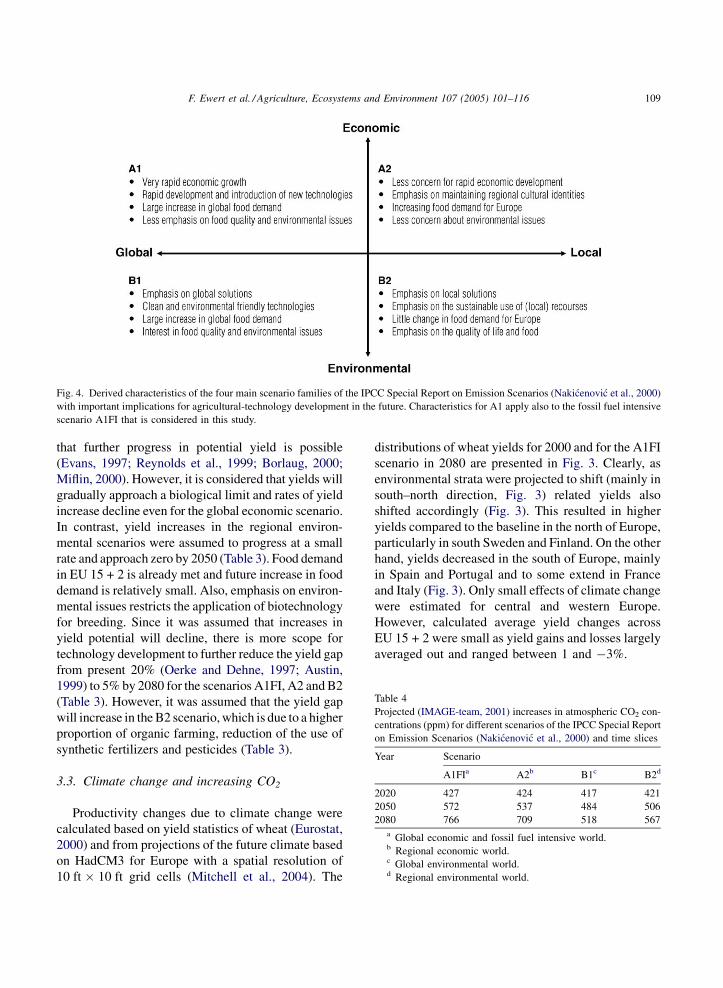
Fig. 4. Derived characteristics of the four main scenario families of the IPCC Special Report on Emission Scenarios (Nakicenovic et al., 2000)
with important implications for agricultural-technology development in the future. Characteristics for A1 apply also to the fossil fuel intensive
scenario A1FI that is considered in this study.
Table 4
Projected (IMAGE-team, 2001) increases in atmospheric CO2 con-
centrations (ppm) for different scenarios of the IPCC Special Report
on Emission Scenarios (Nakicenovic et al., 2000) and time slices
Year Scenario
A1FIa A2b B1c B2d
2020 427 424 417 421
2050 572 537 484 506
2080 766 709 518 567
a Global economic and fossil fuel intensive world.b Regional economic world.c Global environmental world.d Regional environmental world.
that further progress in potential yield is possible
(Evans, 1997; Reynolds et al., 1999; Borlaug, 2000;
Miflin, 2000). However, it is considered that yields will
gradually approach a biological limit and rates of yield
increase decline even for the global economic scenario.
In contrast, yield increases in the regional environ-
mental scenarios were assumed to progress at a small
rate and approach zero by 2050 (Table 3). Food demand
in EU 15 + 2 is already met and future increase in food
demand is relatively small. Also, emphasis on environ-
mental issues restricts the application of biotechnology
for breeding. Since it was assumed that increases in
yield potential will decline, there is more scope for
technology development to further reduce the yield gap
from present 20% (Oerke and Dehne, 1997; Austin,
1999) to 5% by 2080 for the scenarios A1FI, A2 and B2
(Table 3). However, it was assumed that the yield gap
will increase in the B2 scenario, which is due to a higher
proportion of organic farming, reduction of the use of
synthetic fertilizers and pesticides (Table 3).
3.3. Climate change and increasing CO2
Productivity changes due to climate change were
calculated based on yield statistics of wheat (Eurostat,
2000) and from projections of the future climate based
on HadCM3 for Europe with a spatial resolution of
10 ft � 10 ft grid cells (Mitchell et al., 2004). The
distributions of wheat yields for 2000 and for the A1FI
scenario in 2080 are presented in Fig. 3. Clearly, as
environmental strata were projected to shift (mainly in
south–north direction, Fig. 3) related yields also
shifted accordingly (Fig. 3). This resulted in higher
yields compared to the baseline in the north of Europe,
particularly in south Sweden and Finland. On the other
hand, yields decreased in the south of Europe, mainly
in Spain and Portugal and to some extend in France
and Italy (Fig. 3). Only small effects of climate change
were estimated for central and western Europe.
However, calculated average yield changes across
EU 15 + 2 were small as yield gains and losses largely
averaged out and ranged between 1 and �3%.
F. Ewert et al. / Agriculture, Ecosystems and Environment 107 (2005) 101–116110
The calculation of the CO2 effect on productivity
was based on estimations of future CO2 concentration
from the IMAGE model (IMAGE-team, 2001;
Table 4). The relative yield change per unit increase
in CO2 concentration was set to 0.08% ppm�1
suggesting that doubling present CO2 concentration
would increase crop yields by about 30% (Ewert et al.,
1999; van Oijen and Ewert, 1999; Amthor, 2001).
4. Results
The developed approach enabled calculation of
future productivity changes for crops across Europe.
The presented estimations (Table 5) of the effects on
productivity of changes in climatic conditions, CO2
concentration and technology development refer to
wheat as a reference crop. Differences in relative yield
changes among crops were relatively small and are not
further emphasized in this study (see Section 5.4). The
estimations suggest increases in crop productivity
ranging from 25 to 163% depending on time slice and
scenario compared to the baseline year of 2000
(Table 5). The increases were the smallest for the
Table 5
Estimated relative changes in crop productivity as affected by
changes in climatic conditions, CO2 concentration and technology
development for different scenarios of the IPCC Special Report on
Emission Scenarios (Nakicenovic et al., 2000) and time slices
(estimations refer to wheat)
Factor Year Scenario
A1FIa A2b B1c B2d
Climate 2020 0.99 0.99 1.01 1
2050 0.98 0.97 1 0.99
2080 0.98 0.98 1 1
CO2 2020 1.04 1.04 1.03 1.04
2050 1.16 1.13 1.09 1.11
2080 1.32 1.27 1.12 1.15
Technology 2020 1.37 1.37 1.30 1.20
2050 1.87 1.81 1.63 1.28
2080 2.34 2.17 1.87 1.28
All factors 2020 1.41 1.40 1.34 1.25
2050 2.01 1.92 1.72 1.37
2080 2.63 2.42 1.98 1.43
a Global economic and fossil fuel intensive world.b Regional economic world.c Global environmental world.d Regional environmental world.
regional environmental scenario (B2) with 25, 37 and
43% increase in productivity for 2020, 2050 and 2080,
respectively. The largest increases were calculated for
the global economic scenario (A1FI) with 41, 101 and
163% for 2020, 2050 and 2080, respectively.
Differences among scenarios were relatively small
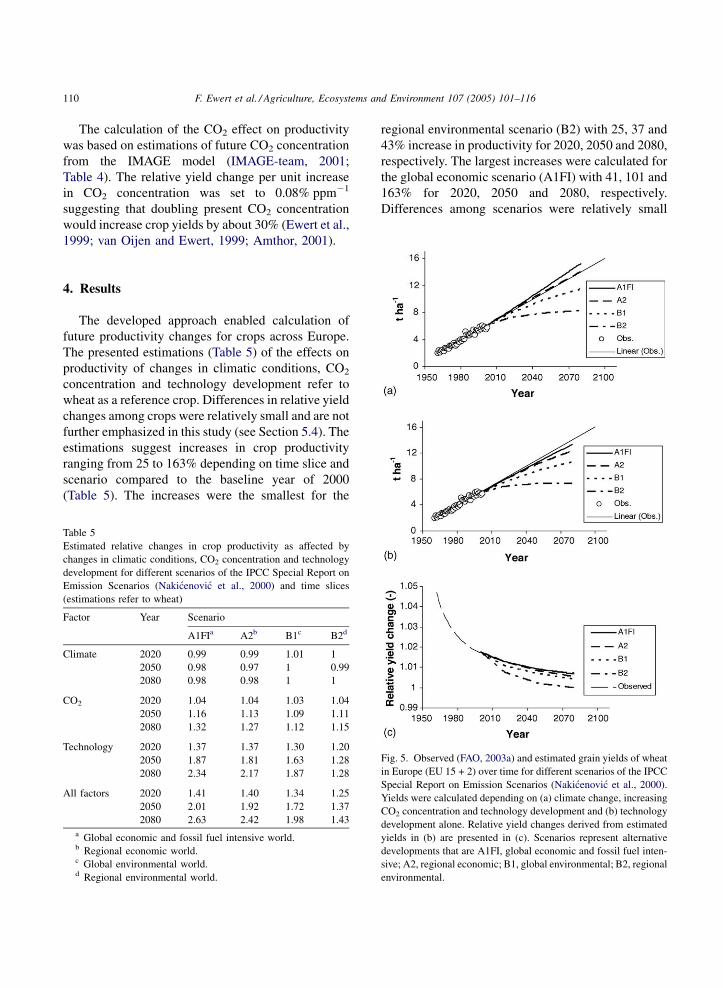
Fig. 5. Observed (FAO, 2003a) and estimated grain yields of wheat
in Europe (EU 15 + 2) over time for different scenarios of the IPCC
Special Report on Emission Scenarios (Nakicenovic et al., 2000).
Yields were calculated depending on (a) climate change, increasing
CO2 concentration and technology development and (b) technology
development alone. Relative yield changes derived from estimated
yields in (b) are presented in (c). Scenarios represent alternative
developments that are A1FI, global economic and fossil fuel inten-
sive; A2, regional economic; B1, global environmental; B2, regional
environmental.
F. Ewert et al. / Agriculture, Ecosystems and Environment 107 (2005) 101–116 111
in 2020, but increased with time indicating higher
uncertainties for productivity change estimates at
more distant futures. Importantly, changes in produc-
tivity were mostly due to the effects of technology
development, particularly in the global and economic
scenarios A1FI, B1 and A2 (Table 5). In contrast, the
effects of climate change were relatively small,
although calculated yield responses to climate change
were more significant in northern and particularly
southern Europe and even exceeded estimated
technology effects. However, these responses aver-
aged out at the European scale. The importance of
technological change is consistent with historical data
and largely due to the assumptions about future
advances in technology development.
Calculation of future wheat yields from estimated
relative productivity changes suggested that yields
will increase from about 6 t ha�1 for the baseline to
between 8 and 15 t ha�1 for the B2 and A1FI scenario,
respectively, in 2080 (Fig. 5a). Technology effects
alone were estimated to increase wheat yields within
the next 80 years to between 7 and 13 t ha�1
depending on the scenario (Fig. 5b). Accordingly,
relative yield change declined from about 1.75% in
2000 to 1.13, 0.9 and 0.68% in 2020, 2050 and 2080,
respectively, in the A1FI scenario (Fig. 5c). Annual
rates of yield change were smaller in the other
scenarios and gradually declined to 0% in 2050 for the
B2 scenario.
5. Discussion
5.1. Scope for future changes in crop productivity
In the present study we aimed to develop scenarios
of future crop productivity depending on alternative
assumptions about socio-economic and environmental
developments following the concept of the IPCC
SRES framework. Importantly, we neither attempted
to provide predictions of crop productivity nor did we
have any preferences of a particular future develop-
ment.
Our estimations suggest that increases in the
productivity of food crops were particularly high in
the economic scenarios (A1FI) which closely fol-
lowed the extrapolated trend line derived from historic
data (1961–2000) (Fig. 5). The potential for further
increases in crop yields at rates that have been
achieved in the past has been extensively discussed in
the literature. Some reports suggest that yields are
approaching a ceiling (Calderini and Slafer, 1998)
while others found little sign of a slowing down in
yield trends for most countries (Hafner, 2003).
Without doubt, yields will not increase infinitely
and we have considered a gradual diversion from the
extrapolated historic trend line as time progresses into
the future (Fig. 5b). However, as indicated by
physiologists and breeders, there is still scope for
further improvement in potential yields and in the
reduction of the yield gap (Evans, 1997; Austin, 1999;
Reynolds et al., 1999). Potential yield may continue to
increase via improved light capturing and light and
nitrogen use efficiency (Loomis and Amthor, 1999;
Borlaug, 2000). Continuing progress in agronomy
including pest, disease and weed management are
likely to further close the gap between actual and
potential yield. The application and development of
new breeding methodologies related to biotechnology
may result in yield gains from improved tolerance by
plants of toxicity and abiotic extremes and resistances
against pests and diseases (Borlaug, 2000; Miflin,
2000).
In contrast, estimated productivity increases were
smaller for the environmental scenarios, particularly
for the regional scenario B2. In the environmental
scenarios emphasis is on sustainability, environmental
protection and product quality, which are known to
correlate negatively with productivity. However, the
growing demand for food as projected for the B2
scenario (IMAGE-team, 2001) will require some
further productivity increase. According to our
interpretations of the SRES storylines it is unlikely
that future technology will decline and that yields will
fall below present levels. Thus, the confidence is
reasonably high that future yields will be within the
productivity range marked by our scenarios. A more
precise estimation of future productivity remains
difficult and requires better understanding of drivers
and underlying mechanisms.
5.2. Comparison between estimated productivity
changes and demand for food
Relationships between crop productivity and food
demand become particularly important when expan-
F. Ewert et al. / Agriculture, Ecosystems and Environment 107 (2005) 101–116112
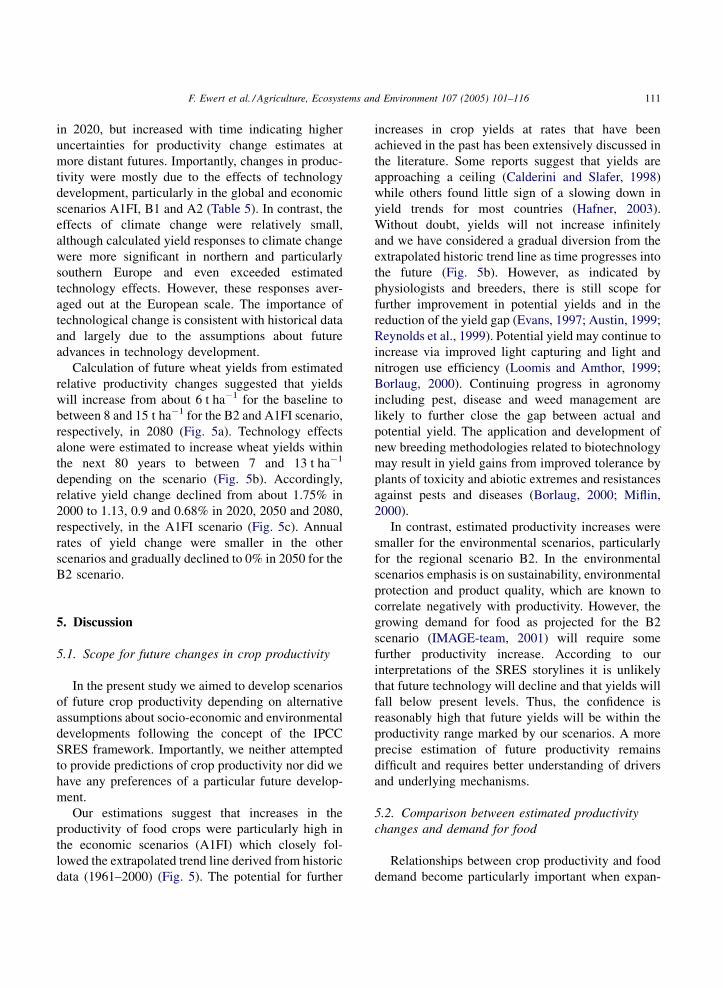
Fig. 6. Relative changes in the demand for food crops over time for
(a) OECD Europe and (b) the world. Changes were calculated from
projected demands by the global environment model IMAGE 2.2
(IMAGE-team, 2001). To enable better comparison, estimated
relative yield changes from Fig. 5c were superimposed onto the
graphs. For scenarios description see Fig. 5 or text.
sion of agricultural land is restricted. It has been
calculated that in order to meet future demands, cereal
yields in developed countries will have to increase by
32% in 2020 compared to 2000 which will require an
annual yield increase of 1.1% (Rosegrant et al., 2001).
The Food and Agricultural Organisation (FAO, 2003b)
predicts that crop production until 2030 will have to
grow with an annual rate of 1.4% per year world-wide
and 0.9% per year in industrial countries. Although
annual increases in food demand will decline in the
future an increase in productivity of about 0.8%
world-wide will be required to meet the expected
demand in 2050 (Tweeten, 1998). Assuming that
agricultural land use is likely to further decline,
particularly in developed countries due to growth in
urban areas and other land uses, the required
productivity changes are likely to be higher. The
above predictions from the literature fall within the
range of our estimated relative productivity changes
(Fig. 6).
Importantly, future changes in demand depend on
assumptions about demographic and economic devel-
opments and differ among world regions (IMAGE-
team, 2001). Annual changes in food demand will be
higher world-wide than in Europe (Fig. 6). Our
estimated yield increases were more pronounced than
the changes in demand for Europe, particularly for the
near future for most (except regional environmental)
scenarios (Fig. 6). This is consistent with historic data
where yield increases in Europe were higher than
changes in demand with the result that food supply
exceeded demand for food. In contrast, our estimated
yield increases coincided well with changes in world
food demand projected for the next few decades
(Fig. 6). However, relationships between regional
production and regional and global food demand are
complex and are difficult to model. Overproduction
and import/export relationships with other world
regions need to be taken into consideration when
estimating regional changes in crop productivity from
food demand.
5.3. Relative importance of drivers of productivity
change
The productivity of crops is determined by a set of
yield defining (e.g. climate, atmospheric CO2 con-
centration and crop characteristics), limiting (e.g.
water and nitrogen supply) and restricting (e.g. pest
and diseases) factors (Goudriaan and Zadoks, 1995;
van Ittersum et al., 2003). Based on this, we assumed
that productivity will change depending on climate
change, increasing CO2 concentration and technology
development. Importantly, technology was the most
important driver of productivity change outweighing
the effects of climate change and increasing CO2.
The effects of CO2 and climate change on crop
productivity were estimated based on relatively simple
statistical approaches. This is in contrast to the
increasing use of dynamic, process-based models in
global change impact assessment studies. However, as
recently indicated, CO2 effects on crop yields in the
past have been relatively insignificant (Amthor, 1998),
which questions the need to consider detailed
mechanisms for estimating yield trends at regional
F. Ewert et al. / Agriculture, Ecosystems and Environment 107 (2005) 101–116 113
and larger scales. In fact, as can be calculated from
Eq. (6), the CO2 effect between 1961 and 2000 was as
much as 4%, i.e. 0.12% yield increase per year which
is less than 5% of the total yield increase over this
period. If we consider that our assumption about the
CO2 effect refers to C3 crops and was based on
controlled or semi-controlled environment studies and
that CO2 effects might be smaller in the field and are
less pronounced for C4 crops, the contribution of
increasing CO2 to historic yield changes was even
smaller.
Estimations of climate change effects were even
less pronounced than for CO2 and only for the
economic scenarios a small decrease in productivity
was calculated for Europe (Table 5). More pronounced
negative effects of climate change on crop productiv-
ity in Europe were simulated by process-based crop
models (Downing et al., 1999) but combined effects of
climate change and elevated CO2 were still positive
for large parts of Europe (Downing et al., 1999), as
was also a result of the present study. However, recent
investigations suggest, that climate change effects on
productivity have been underestimated (Lobell and
Asner, 2003) in the past. Clearly, investigations are
required to further analyse the effects of past climate
changes on crop productivity in Europe and to further
evaluate the present approach to estimate climate
change effects on actual yields.
5.4. Variability in productivity changes across
crops and regions
Our estimations of crop productivity refer to the
aggregated European level. This is consistent with the
approach used in an accompanied study to first
calculate land use changes for Europe and then
allocate these changes to individual regions according
to scenario-specific rules (Rounsevell et al., 2005).
Consideration of regional differences would require
additional information that is difficult to obtain in
consistent detail across all regions in Europe (e.g.
management practices). It would also complicate the
present model which was intended to be simple and
transparent.
However, there were differences among regions
with respect to the estimated climate change effects.
Projected changes in climatic conditions will cause
severe yield reductions in southern Europe, but will
result in yield gains in northern Europe as growing
season length extends and zones of suitability for
production expand northwards. This is also evident
from other studies (Harrison and Butterfield, 1996;
Nonhebel, 1996; Downing et al., 1999).
Future technology development and impacts on
productivity may also differ among regions as was
observed for historic changes in absolute yields
(Fig. 2a). However, our analysis was based on relative
yield changes and not on absolute changes, and
revealed only small differences among regions. For
instance, absolute yield increase in France
(0.12 t ha�1 year�1, Fig. 2a) was about three times
the increase obtained in Spain (0.043 t ha�1 year�1,
Fig. 2a) but relative yield changes were almost similar
for both countries (i.e. about 1.7%, Fig. 2b). Thus,
consideration of one parameter for different regions
based on relative yield changes appears a fair
approximation.
The same applies to the crops analysed in this
study. Annual yield increases for potatoes were on
average across Europe about four times higher than
increases for wheat (Table 2). Again, differences in
relative yield changes were comparably small
(Table 2). However, instead of using an area-weighted
European average for important crops, we considered
wheat as a reference crop. Wheat is the most important
crop in Europe and much of the future work on crop
improvement will be on wheat. Thus, it is likely that
wheat marks the upper boundary of possible
productivity increases in the future which should
not fall outside the ranges of productivity changes
described by our scenarios.
6. Conclusions
We have developed an approach to estimate the
productivity of food crops in Europe for different
scenarios of the IPCC SRES framework from 2000
until 2080. The approach is simple and can easily be
applied, if parameterised appropriately, for other
regions. The importance of advances in technology
for future productivity as evident from our results
draws particular attention to relationships that
determine technology development. Our assumptions
about technology effects on potential yield and yield
gap were based on qualitative judgments and there is a
F. Ewert et al. / Agriculture, Ecosystems and Environment 107 (2005) 101–116114
clear scope for model improvement. Consideration of
dynamic feedback mechanisms between crop pro-
ductivity and demand for food, agricultural land use
and socio-economic conditions are likely to provide
further insights into the complex relationships
determining productivity change.
Our results indicate substantial increases in
productivity, particularly for a global economic world,
that are likely to result in further abandonment of
agricultural land in Europe as observed during the past
decades. Changes of agricultural land use and
emerging options for alternative land uses may have
far reaching implications for the development of
future food production systems. Our estimations of
productivity changes provide important information to
enable such analysis within the concept of the SRES
scenario framework.
Acknowledgements
This work was funded by the Energy, Environment
and Sustainable Development Programme of the
European Commission via the project ATEAM
(Advanced Terrestrial Ecosystem Analysis and Model-
ling, no. EVK2-2000-00075, http://www.pik-potsdam.
de/ateam/ateam.html). Helpful comments from two
anonymous referees are acknowledged.
References
Amthor, J.S., 1998. Perspective on the relative insignificance of
increasing atmospheric CO2 concentration to crop yield. Field
Crops Res. 58, 109–127.
Amthor, J.S., 2001. Effects of atmospheric CO2 concentration on
wheat yield: review of results from experiments using various
approaches to control CO2 concentration. Field Crops Res. 73,
1–34.
Amthor, J.S., Loomis, R.S., 1996. Integrating knowledge of crop
responses to elevated CO2 and temperature with mechanistic
simulation models: model components and research needs. In:
Koch, G.W., Mooney, H.A. (Eds.), Carbon Dioxide and Terres-
trial Ecosystems. Academic Press, San Diego, USA, pp. 317–
345.
Asseng, S., Jamieson, P.D., Kimball, B., Pinter, P., Sayre, K.,
Bowden, J.W., Howden, S.M., 2004. Simulated wheat growth
affected by rising temperature, increased water deficit and
elevated atmospheric CO2. Field Crops Res. 85, 85–102.
Austin, R.B., 1999. Yield of wheat in the United Kingdom: recent
advances and prospects. Crop Sci. 39, 1604–1610.
Boote, K.J., Pickering, N.B., Allen Jr., L.H., 1997. Plant modeling:
advances and gaps in our capability to predict future crop
growth and yield in response to global climate change. In:
Allen, Jr., L.H., Kirkham, M.B., Olszyk, D.M., Whitman,
C.E. (Eds.), Advances in Carbon Dioxide Effects Research.
American Society of Agronomy, Madison, USA, pp. 179–228.
Borlaug, N.E., 2000. Ending world hunger. The promise of bio-
technology and the threat of antiscience zealotry. Plant Physiol.
124, 487–490.
Brown, R.A., Rosenberg, N.J., 1997. Sensitivity of crop yield and
water use to change in a range of climatic factors and CO2
concentrations: a simulation study applying EPIC to the central
USA. Agric. For. Meteorol. 83, 171–203.
Calderini, D.F., Slafer, G.A., 1998. Changes in yield and yield
stability in wheat during the 20th century. Field Crops Res.
57, 335–347.
Cassman, K.G., 1999. Ecological intensification of cereal produc-
tion systems: yield potential, soil quality, and precision agri-
culture. PNAS 96, 5952–5959.
Davis, G., 2002. Scenarios as a tool for the 21st century. In:
Proceedings of the Probing the Future Conference. Group
External Affairs, SI, Shell Centre, Strathclyde University, p. 7.
Downing, T.E., Harrison, P.A., Butterfield, R.E., Lonsdale, K.G.,
1999. Climate change, climatic variability and agriculture in
europe: an integrated assessment. Research Report No. 21.
Environmental Change Unit, University of Oxford, Oxford, UK.
Dyson, T., 1999. World food trends and prospects to 2025. PNAS 96,
5929–5936.
Easterling, W.E., Weiss, A., Hays, C.J., Mearns, L.O., 1998. Spatial
scales of climate information for simulating wheat and maize
productivity: the case of the US Great Plains. Agric. For.
Meteorol. 90, 51–63.
Easterling, W.E., Mearns, L.O., Hays, C.J., Marx, D., 2001. Com-
parison of agricultural impacts of climate change calculated
from high and low resolution climate change scenarios. Part II.
Accounting for adaptation and CO2 direct effects. Clim. Change
51, 173–197.
Easterling, W.E., Crosson, P.R., Rosenberg, N.J., McKenney, M.S.,
Katz, L.A., Lemon, K.M., 1993. Agricultural impacts of
responses to climate change in the Missouri–Iowa–Nebraska–
Kansas (MINK) region. Clim. Change 24, 23–61.
Eurostat, 2000. Regio Database: User’s Guide. Commission des
communautes europeennes, Eurostat, Luxembourg, p. 115.
Evans, L.T., 1997. Adapting and improving crops: the endless task.
Phil. Trans. Roy. Soc. Lond.: Biol. Sci. 352, 901–906.
Evans, L.T., Fischer, R.A., 1999. Yield potential: its definition,
measurement, and significance. Crop Sci. 39, 1544–1551.
Ewert, F., 2004. Modelling plant responses to elevated CO2: how
important is leaf area index? Ann. Bot. 93, 619–627.
Ewert, F., van Oijen, M., Porter, J.R., 1999. Simulation of growth
and development processes of spring wheat in response to CO2
and ozone for different sites and years in Europe using mechan-
istic crop simulation models. Eur. J. Agron. 10, 231–247.
Ewert, F., Rodriguez, D., Jamieson, P., Semenov, M.A., Mitchell,
R.A.C., Goudriaan, J., Porter, J.R., Kimball, B.A., Pinter Jr., P.J.,
Manderscheid, R., Weigel, H.J., Fangmeier, A., Fereres, E.,
Villalobos, F., 2002. Effects of elevated CO2 and drought on
F. Ewert et al. / Agriculture, Ecosystems and Environment 107 (2005) 101–116 115
wheat: testing crop simulation models for different experimental
and climatic conditions. Agric. Ecosyst. Environ. 93, 249–266.
FAO, 2003a. Food and Agriculture Organization. http://
www.fao.org.
FAO, 2003b. World agriculture: towards 2015/2030. An FAO per-
spective. Earthscan Publications Ltd., London.
Fischer, G., van Velthuizen, H., Shah, M., Nachtergaele, F., 2002.
Global Agro-ecological Assessment for Agriculture in the 21st
Century: Methodology and Results. International Institute for
Applied Systems Analysis, Food and Agriculture Organization
of the United Nations, Laxenburg, A; Rome I, p. 119.
Goudriaan, J., Zadoks, J.C., 1995. Global climate change: modelling
the potential responses of agro-ecosystems with special refer-
ence to crop protection. Environ. Pollut. 87, 215–224.
Hafner, S., 2003. Trends in maize, rice, and wheat yields for 188
nations over the past 40 years: a prevalence of linear growth.
Agric. Ecosyst. Environ. 97, 275–283.
Harrison, P.A., Butterfield, R.E., 1996. Effects of climate change on
Europe-wide winter wheat and sunflower productivity. Clim.
Res. 7, 225–241.
IMAGE-team, 2001. The IMAGE 2.2 implementation of the SRES
scenarios: a comprehensive analysis of emissions, climate
change and impacts in the 21st century. National Institute of
Public Health and the Environment (RIVM), Bilthoven, The
Netherlands.
Izaurralde, R.C., Rosenberg, N.J., Brown, R.A., Thomson, A.M.,
2003. Integrated assessment of Hadley Center (HadCM2) cli-
mate-change impacts on agricultural productivity and irrigation
water supply in the conterminous United States. Part II. Regional
agricultural production in 2030 and 2095. Agric. For. Meteorol.
117, 97–122.
Jamieson, P.D., Porter, J.R., Semenov, M.A., Brooks, R.J., Ewert, F.,
Ritchie, J.T., 1999. Comments on ‘Testing winter wheat simula-
tion models’ predictions against observed UK grain yields’ by
Landau et al. Agric. For. Meteorol. 96, 157–161.
Jamieson, P.D., Berntsen, J., Ewert, F., Kimball, B.A., Olesen, J.E.,
Pinter Jr., P.J., Porter, J.R., Semenov, M.A., 2000. Modelling
CO2 effects on wheat with varying nitrogen supplies. Agric.
Ecosyst. Environ. 82, 27–37.
Johnson, D.G., 1999. The growth of demand will limit output growth
for food over the next quarter century. PNAS 96, 5915–5920.
Kimball, B.A., Kobayashi, K., Bindi, M., 2002. Responses of
agricultural crops to free-air CO2 enrichment. Adv. Agron.
77, 293–368.
Landau, S., Mitchell, R.A.C., Barnett, V., Colls, J.J., Craigon, J.,
Moore, K.L., Payne, R.W., 1998. Testing winter wheat simula-
tion models’ predictions against observed UK grain yields.
Agric. For. Meteorol. 89, 85–99.
Lobell, D.B., Asner, G.P., 2003. Climate and management contribu-
tions to recent trends in U.S. agricultural yields. Science 299,
1032.
Long, S.P., 1991. Modification of the response of photosynthesis
productivity to rising temperature by atmospheric CO2 concen-
tration: has its importance been underestimated? Plant Cell
Environ. 14, 729–739.
Loomis, R.S., Amthor, J.S., 1999. Yield potential, plant assimilatory
capacity, and metabolic efficiencies. Crop Sci. 39, 1584–1596.
Metzger, M., Bunce, B., Jongman, R., Mateus, V., Mucher, S., 2003.
The environmental classification of Europe, a new tool for
European landscape ecologists. Landschap 20, 50–54.
Metzger, M.J., Bunce, R.G.H., Jongman, R.H.G., Mucher, C.A.,
Watkins, J.W., 2004. A statistical stratification of the environ-
ment of Europe. Glob. Ecol. Biogeogr., submitted for publica-
tion.
Miflin, B., 2000. Crop improvement in the 21st century. J. Exp. Bot.
51, 1–8.
Mitchell, T.D., Carter, T.R., Jones, P.D., Hulme, M., New, M., 2004.
A comprehensive set of high-resolution grids of monthly climate
for Europe and the globe: the observed record (1901–2000)
and 16 scenarios (2001–2100). Tyndall Centre for Climate
Change Research Working Paper 55: 25. http://www.tyndall.
ac.uk/publications/working_papers/wp55.pdf.
Morison, J.I.L., Lawlor, D.W., 1999. Interactions between increas-
ing CO2 concentration and temperature on plant growth. Plant
Cell Environ. 22, 659–682.
Nakicenovic, N., Alcamo, J., Davis, G., de Vries, B., Fenhann, J.,
Gaffin, S., Gregory, K., Grubler, A., Jung, T.Y., Kram, T., Emilio
la Rovere, E., Michaelis, L., Mori, S., Morita, T., Pepper, W.,
Pitcher, H., Price, L., Riahi, K., Roehrl, A., Rogner, H.-H.,
Sankovski, A., Schlesinger, M.E., Shukla, P.R., Smith, S., Swart,
R.J., van Rooyen, S., Victor, N., Dadi, Z., 2000. Special Report
on Emissions Scenarios. Cambridge University Press, Cam-
bridge, UK.
Nonhebel, S., 1996. Effects of temperature rise and increase in CO2
concentration on simulated wheat yields in Europe. Clim.
Change 34, 73–90.
Oerke, E.C., Dehne, H.W., 1997. Global crop production and the
efficacy of crop protection-current situation and future trends.
Eur. J. Plant Pathol. 103, 203–215.
Olesen, J.E., Bocher, P.K., Jensen, T., 2000. Comparison of scales of
climate and soil data for aggregating simulated yields of winter
wheat in Denmark. Agric. Ecosyst. Environ. 82, 213–228.
Parry, M., Rosenzweig, C., Iglesias, A., Fischer, G., Livermore, M.,
1999. Climate change and world food security: a new assess-
ment. Glob. Environ. Change 9, S51–S67.
Parry, M.L., Rosenzweig, C., Iglesias, A., Livermore, M., Fischer,
G., 2004. Effects of climate change on global food production
under SRES emissions and socio-economic scenarios. Glob.
Environ. Change 14, 53–67.
Potter, C.S., Randerson, J., Field, C.B., Matson, P.A., Vitousek,
P.M., Mooney, H.A., Klooster, S.A., 1993. Terrestrial ecosystem
production: a process model based on global satellite and surface
data. Glob. Biogeochem. Cycl. 7, 811–841.
Reilly, J., Tubiello, F., McCarl, B., Abler, D., Darwin, R., Fuglie, K.,
Hollinger, S., Izaurralde, C., Jagtap, S., Jones, J., Mearns, L.,
Ojima, D., Paul, E., Paustian, K., Riha, S., Rosenberg, N.,
Rosenzweig, C., 2003. U.S. agriculture and climate change:
new results. Clim. Change 57, 43–69.
Reynolds, M.P., Rajaram, S., Sayre, K.D., 1999. Physiological and
genetic changes of irrigated wheat in the post-green revolution
period and approaches for meeting projected global demand.
Crop Sci. 39, 1611–1621.
Rosegrant, M.W., Paisner, M.S., Meijer, S., Witcover, J., 2001.
Global Food Projections to 2020. Emerging Trends and Alter-
F. Ewert et al. / Agriculture, Ecosystems and Environment 107 (2005) 101–116116
native Future. International Food Policy Research Institute,
Washington, DC.
Rosenzweig, C., Parry, M.L., 1994. Potential impact of climate
change on world food supply. Nature 367, 133–138.
Rounsevell, M.D.A., Annetts, J.E., Audsley, E., Mayr, T., Reginster,
I., 2003. Modelling the spatial distribution of agricultural land
use at the regional scale. Agric. Ecosyst. Environ. 95, 465–479.
Rounsevell, M.D.A., Ewert, F., Reginster, I., Leemans, R., Carter,
T.R., 2005. Future scenarios of European agricultural land use.
II. Projecting changes in cropland and grassland. Agric. Ecosyst.
Environ. 107, 117–135.
Sitch, S., Smith, B., Prentice, I.C., Arneth, A., Bondeau, A., Cramer,
W., Kaplan, J.O., Levis, S., Lucht, W., Sykes, M.T., Thonicke,
K., Venevsky, S., 2003. Evaluation of ecosystem dynamics, plant
geography and terrestrial carbon cycling in the LPJ dynamic
global vegetation model. Glob. Change Biol. 9, 161–185.
Tan, G., Shibasaki, R., 2003. Global estimation of crop productivity
and the impacts of global warming by GIS and EPIC integration.
Ecol. Model. 168, 357–370.
Tubiello, F.N., Ewert, F., 2002. Simulating the effects of elevated
CO2 on crops: approaches and applications for climate change.
Eur. J. Agron. 18, 57–74.
Tweeten, L., 1998. Dodging a Malthusian bullet in the 21st Century.
Agribusiness 14, 15–32.
van Ittersum, M.K., Leffelaar, P.A., van Keulen, H., Kropff, M.J.,
Bastiaans, L., Goudriaan, J., 2003. On approaches and applica-
tions of the Wageningen crop models. Eur. J. Agron. 18, 201–234.
van Oijen, M., Ewert, F., 1999. The effects of climatic variation in
Europe on the yield response of spring wheat cv Minaret to
elevated CO2 and O3: an analysis of open-top chamber experi-
ments by means of two crop growth simulation models. Eur. J.
Agron. 10, 249–264.


