
Full Year 2017

Disclaimer
Certain details included in this presentation are subject to updating, revision, further verification and amendment. Balta Group NV (the "Company") is not under any obligation to update or keep
current the information contained in this presentation.
In considering any performance information contained herein, you should bear in mind that past or projected performance is not necessarily indicative of future results, and there can be no assurance
that any entity referenced herein will achieve comparable results or that illustrative returns, if any, will be met. Statements in this presentation are made as of the date this presentation is made unless
stated otherwise, and the delivery of this presentation at any time shall under no circumstances create an implication that the information contained herein is correct as of any time after such date.
This presentation contains statements that, to the extent they are not recitations of historical fact, constitute "forward‐looking statements". Actual outcomes and results could differ materially from those
forecasts due to the impact of many factors beyond the control of the Company and its affiliates. Forward‐looking statements include statements concerning plans, objectives, goals, strategies, future
events or performance, and underlying assumptions and other statements, which are other than statements of historical facts. The words "believe", "expect", "anticipate", "intends", "plan", "estimate",
"aim", "forecast", "project", "will", "may", "might", "should", "could" and similar expressions (or their negative) identify certain of these forward‐looking statements. Forward‐looking statements include
statements regarding: business strategies, outlook and growth prospects; future plans and potential for future growth; growth in demand for soft flooring products; expected developments in production
capabilities, including technological advancements in soft flooring manufacturing; expected spending by our customers and competitors; liquidity, capital resources and capital expenditures; economic
outlook and industry trends; developments of markets; the impact of regulatory initiatives; and the strength of competitors. No statement in this presentation is intended to be nor may be construed as a
profit forecast.
The forward‐looking statements in this presentation are based upon various assumptions, many of which are based, in turn, upon further assumptions, including without limitation, management's
examination of historical operating trends, data contained in the Company's records and other data available from third parties. These assumptions are inherently subject to significant uncertainties and
contingencies which are difficult or impossible to predict and are beyond its control and it may not achieve or accomplish these expectations, beliefs or projections. In addition, important factors that, in
the view of the Company, could cause actual results to differ materially from those discussed in the forward‐looking statements include the achievement of the anticipated levels of profitability, growth,
the impact of competitive pricing, shifts in customer, market and consumer demand, competition risk, regulatory risk, financial markets risk, operational risks, the impact of general business, European
and Belgian economic conditions and other risks and factors. In light of these risks, uncertainties and assumptions, the forward-looking statements contained in this document might not prove to be
accurate and you should not place undue reliance upon them. All forward-looking statements attributable to us or persons acting on our behalf are expressly qualified in their entirety by the foregoing
cautionary statements.
Figures contained in the presentation may be rounded.
This document shall not constitute an offer to sell or the solicitation of an offer to buy any securities, nor shall there be any offer, solicitation or sale of securities in any jurisdiction in which such offer,
solicitation or sale would be unlawful prior to the registration or qualification under the securities laws of such jurisdiction. Any securities offered by the Company have not been and will not be
registered under the Securities Act, or under any applicable securities laws of any state or other jurisdiction of the United States. Distribution of this document may be prohibited in the United States.
You are required to inform yourself or, and comply with, all such restrictions or prohibitions and the Company does not accept liability to any person in relation thereto. By attending the meeting where
this presentation is made, or by reading the presentation slides, you agree to be bound by the above limitations.
The financial information included in this document includes figures that have not been subject to an audit or review by any independent auditor in accordance with generally accepted auditing
standards. This presentation also includes certain unaudited pro forma consolidated financial information. The unaudited pro forma adjustments are based upon available information and certain
assumptions that Balta management believes to be reasonable. The assumptions underlying the pro forma adjustments have not been audited or reviewed in accordance with any generally accepted
auditing standards.
1

Confidential
Business Update – Tom Debusschere CEO
2

Tom Debusschere CEO
▪ Our Strategy and Progress
▪ Update on Residential and Bentley
▪ Six Key Priorities in 2018
3
Introduction
Tom Gysens CFO
▪ Financial Review
▪ 2018 Outlook

4
Full Year Financial Headlines
+4.5% organic
+18.6% yoy sales growth
(consolidated)
• Organic performance driven by growth of Rugs +8.1% and
Commercial +8.0%
• Strong contribution from Bentley acquisition
(1.4%) FX impact
+15.4% M&A(1)
(5.8)% organic
+3.7% Adj. EBITDA
growth
(consolidated)
• Organic growth impacted by raw material price increases
• Material impact to earnings from FX
(7.1%) FX impact
+16.6% M&A(1)
2.9x Leverage
• Leverage reduced from 3.9x as at Q1 2017 and 3.3x a year ago
• Absolute net debt of €253.5m
Improved
leverage
(1) Bentley revenue and Adjusted EBITDA recognized from April 1st 2017

5
Our vision: “To bring beautiful design
at affordable prices to mid-segment
mass markets”
A progressive
dividend policy
Our goal is to be the:
Global innovation and design leader in machine-made rugs
Growing challenger in the North American and European commercial carpet and tiles segment
Leading carpet manufacturer for the European residential segment
Strengthen our leading
positions across core
segments
Continue to focus on
Operational Excellence
Selectively seek
complementary acquisition
opportunities
Our Strategy
Delivering Superior Sustainable Shareholder Returns

6
Strengthen Our Leading Positions Across Core Segments
• Rugs full year organic revenue growth 8.1% versus last year
– 2017 investment to increase our US sales and distribution infrastructure,
including a new warehouse in Georgia
• Commercial has doubled in revenue and EBITDA versus last year
– Commercial Europe full year organic revenue growth of 8.0%
– Bentley growing market share and presence in the US
– Increased investment in commercial resources in both Europe and the US
• Residential growing higher margin broadloom
– 20% of sales today, versus 15% a year ago and 7% two years ago

7
Continue to Focus on Operational Excellence
• Completed the full automation of the commercial tile plant in Zele, Belgium
– Increased capacity and cost competitiveness
– 2017 Q3 supply issue temporarily constrained sales
• Expanded production capacity in Turkish plants by 10% in 2017
– Expect this to continue in 2018
• Created a larger programme of Operational Excellence initiatives
– Mostly benefitting from second half of 2018
• Optimising the Residential footprint in Belgium is ahead of schedule

8
Update on Optimising the Residential Operational Footprint
• Consultation and social negotiation process completed, we will be:
– Absorbing Oudenaarde factory into two existing vertically integrated factories in Belgium
– Closing the rented warehouse in Sint-Niklaas, Belgium
• Project expected to finish ahead of schedule by the summer of 2018
– We have established a full Project Management Office
– SKU reduction programme in place with 20% less SKUs expected by Q3 2018 versus Q3 2017
• This will result in:
– Total cash benefit of €9.9m with one off costs of €12.4m
– Run rate EBITDA benefit of €8.3m in FY19, commencing from early Summer 2018

9
Bentley Mills Acquisition
Feb
2017
Jun
2017
Today
Q4
2017
Mid-
term
1. Cross-selling opportunities
• modulyss styles available in the US
• Bentley products showcased for European market at Domotex Jan 2018
• Major national US retailer contract won for modulyss in Q4 2017
2. Know-how transfer
• 100% of Bentley’s sales force trained to sell modulyss
• Investment made to improve and expand sales force to grow national account sales
and focus on regions where we see the greatest opportunities
• Transferring operational capabilities
• Utilize Balta’s global network to leverage Bentley sales and vice versa for modulyss
3 Procurement and logistics optimisation
• Procurement and operational synergies of $2m, mostly benefiting in 2018
• New modulyss warehouse opened to address inventory and sample requests
Integration Complete, Growing Market Share

10
A Strong H1 Offset by a Challenging H2
+15.1% yoy sales growth
(consolidated)
11.1% Adj. EBITDA
growth
(consolidated)
+22.4% yoy sales growth
(consolidated)
(4.1)% Adj. EBITDA
growth
(consolidated)
H2H1• H2 margins impacted by significant increase in raw material
cost that we did not fully offset by compensating actions
• FX negatively impacted full year EBITDA by 7%
• In addition
– European Commercial tile start-up issues led to missed
revenue and profit in the second half of the year
– Q4 partial ‘share of wallet’ loss with two US home
improvement customers in this seasons outdoor rug
collections

Grow Profitable Revenue:
1. Continue to grow Rugs sales in North America
• by increasing channel penetration and broadening
our channel reach
• underpinned by 2017 investment in sales and
distribution infrastructure
2. Continue Commercial sales growth, leveraging
• increased capacity of new automated commercial
line in Europe
• the 2017 investment to increase our sales force,
both in Europe and the US
3. Improve Residential product mix by
• growing sales of higher margin products
• capturing the right value for our products and
services through a strategic pricing excellence
project started. Benefits mostly in 2019
2
Six key Priorities for 2018
Management Actions to Materially Benefit H2 2018
Deliver increased level of cost savings:
4. Deliver the full benefits of the restructuring of
the operational footprint in Residential
• complete ahead of schedule in Summer 2018
• benefits commence early in H2 2018
5. Execute the larger Operational Excellence
programme
• Project Management Office in place
• delivering an increased run rate of cost savings
as of H2 2018
6. Execute the cost synergies between our
European and US commercial business
• operational and procurement synergies identified
of $2m, mostly delivered in 2018
11

Confidential
Financial Review – Tom Gysens CFO
12

13
Strong organic performance in
Rugs +8.1% and Commercial +8.0%
- All divisions grew organic revenue
Start-up issues in Belgium tile factory held back
Commercial performance
Group Full Year Revenue Performance
+8.1%
+0.6%(1.4%) +15.4%+8.0%

14
Group Full Year EBITDA and Margins
Adj. EBITDA margin (%)
13.1% 12.8%14.6%
Raw material increases have materially
impacted our organic margins
Adverse currency movements have materially
impacted our reported margins
(7.1%)
+16.6%

15
Rugs organic revenue decline of 2.4%
- reduction in ‘share of wallet’ with two
US home improvement customers
Commercial Europe back to full supply +14.8%
Group Q4 Revenue Performance
(1.9%) +21.2%
+14.8%
+2.4%
-2.4%
16
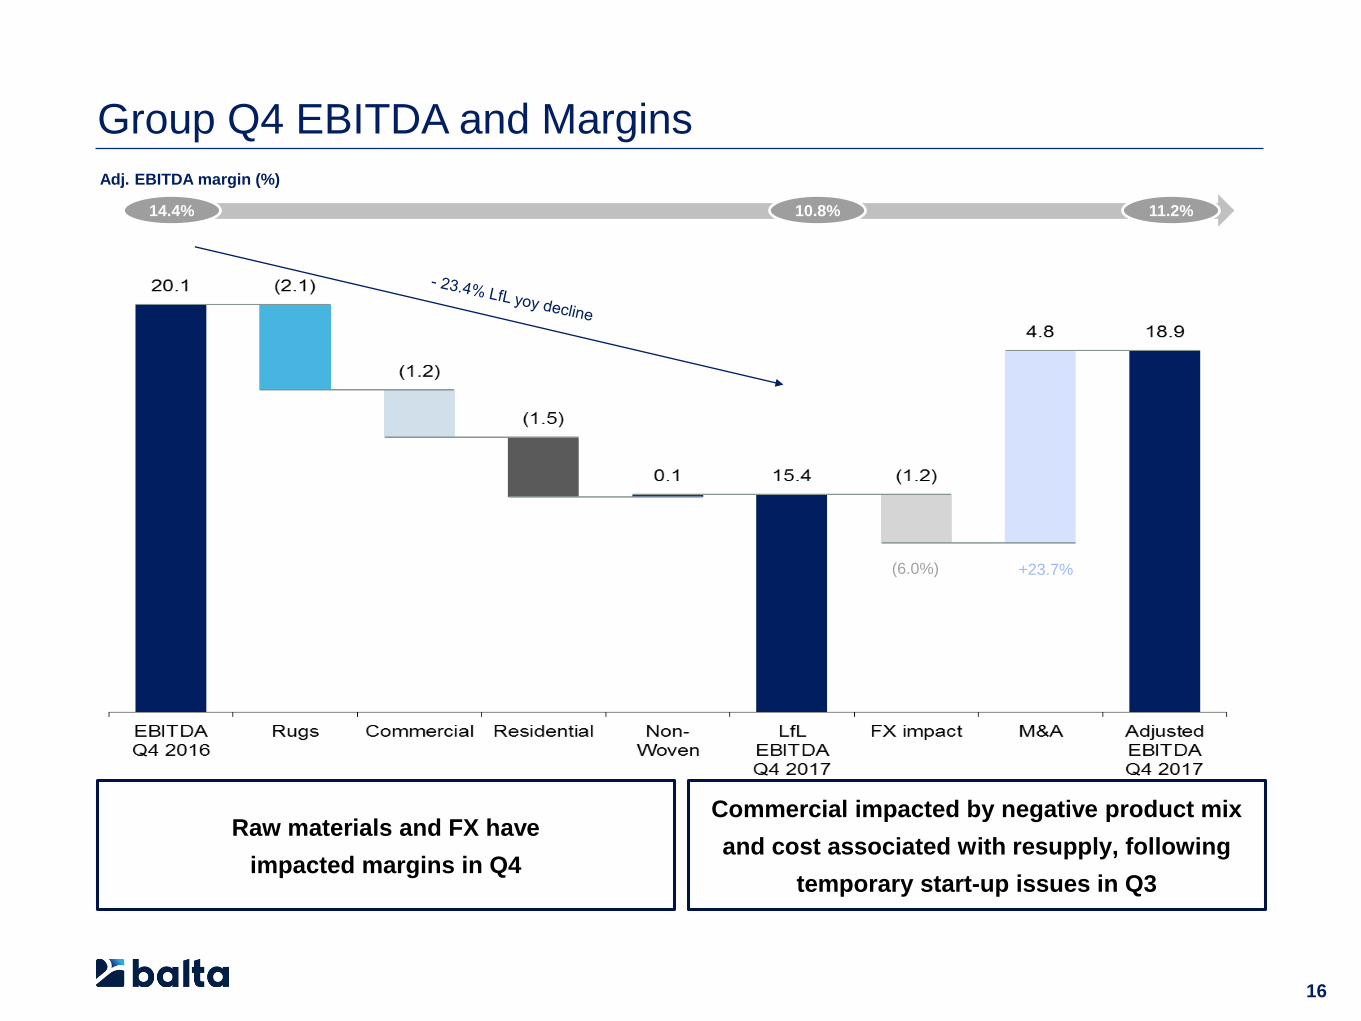
Group Q4 EBITDA and Margins
Adj. EBITDA margin (%)
10.8% 11.2%14.4%
Raw materials and FX have
impacted margins in Q4
Commercial impacted by negative product mix
and cost associated with resupply, following
temporary start-up issues in Q3
(6.0%) +23.7%

17
Non Recurring Items
€m 2016 2017
Profit for the period 25.3 3.0
Adjusted for non-recurring items:
Purchase price accounting - 1.8
Integration and restructuring expenses 5.1 11.4
Gains on asset disposals (1.6) -
Finance expenses - 9.3
Taxes (11.9) (8.6)
Adjusted profit for the period 17.0 16.8
• Bentley acquisition fair value adjustment, mostly to inventory, impact on EBITDA of
€2.9m, after-tax impact of €1.8m
• €8.2m Residential restructuring expense, remainder driven by IPO and acquisition
of Bentley
• €5.4m due to the debt financed acquisition of Bentley fully repaid in June from IPO
proceeds. €3.9m relates to partial early redemption of Senior Secured Notes
• In both periods, deferred tax assets have been adjusted to reflect portion of tax
credits that are expected to be used in the future. In addition, in 2017 deferred tax
liabilities have decreased to reflect impact of Belgian and US tax reform

€m 2016 2017
Revenues 557.7 661.3
Adjusted EBITDA 81.4 84.4
Depreciation and amortisation (28.7) (32.5)
Adjusted Operating Profit 52.7 51.9
Impact Purchase Price Accounting (2.9)
Non-recurring income/expenses (3.5) (11.4)
Operating Profit 49.2 37.6
Financial income and expenses (28.6) (37.3)
Profit Before Tax 20.6 0.3
Income Tax 4.7 2.7
Reported Net Income 25.3 3.0
Normalized Net Income (1) 17.0 16.8
From Adjusted EBITDA to Net Income
18
• Pro Forma Adjusted EBITDA of €87.3m when including Q1 EBITDA of Bentley Mills
• €8.2m costs for restructuring Residential, IPO and acquisition of Bentley
• Includes €9.3m costs of pre IPO structure and refinancing. Current run rate of €23m
• Belgian tax reform impact and re-measurement of deferred tax assets relating to tax
credits. Normalized ETR of 30% in 2017, expected to decrease in 2018 to 25-27%
• Stable performance when normalizing for one off non-recurring events
• Fair value adjustment following Bentley acquisition
(1) The non recurring items are detailed on page 17, which Reported Net Income has been adjusted by to calculate the Normalised Net Income
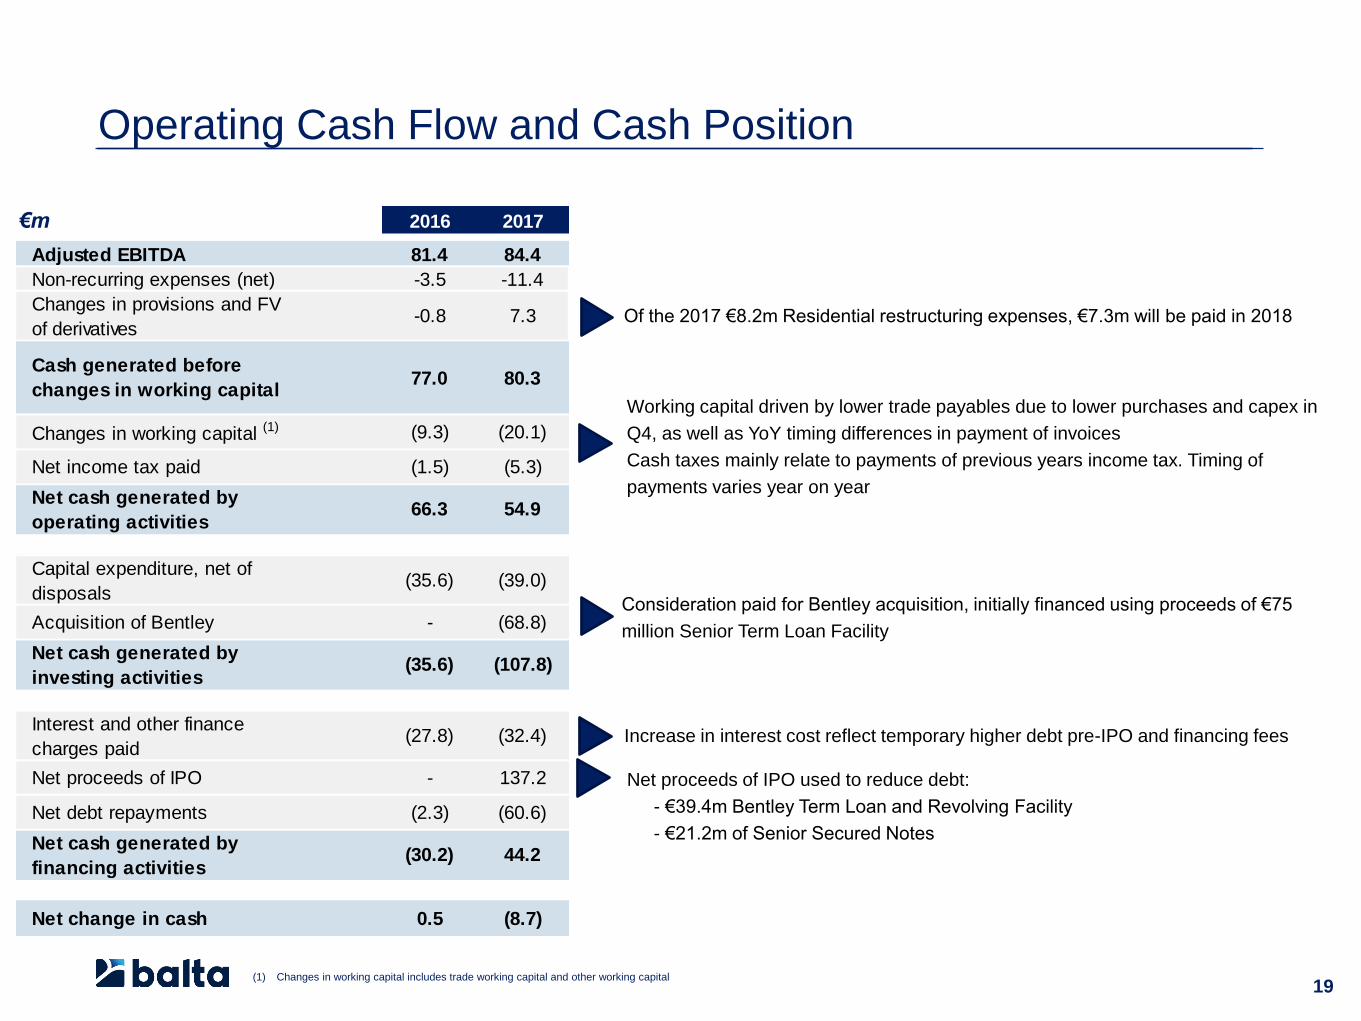
Operating Cash Flow and Cash Position
19(1) Changes in working capital includes trade working capital and other working capital
Consideration paid for Bentley acquisition, initially financed using proceeds of €75
million Senior Term Loan Facility
Increase in interest cost reflect temporary higher debt pre-IPO and financing fees
Net proceeds of IPO used to reduce debt:
- €39.4m Bentley Term Loan and Revolving Facility
- €21.2m of Senior Secured Notes
Working capital driven by lower trade payables due to lower purchases and capex in
Q4, as well as YoY timing differences in payment of invoices
Cash taxes mainly relate to payments of previous years income tax. Timing of
payments varies year on year
Of the 2017 €8.2m Residential restructuring expenses, €7.3m will be paid in 2018
€m 2016 2017
Adjusted EBITDA 81.4 84.4
Non-recurring expenses (net) -3.5 -11.4
Changes in provisions and FV
of derivatives-0.8 7.3
Cash generated before
changes in working capital77.0 80.3
Changes in working capital (1) (9.3) (20.1)
Net income tax paid (1.5) (5.3)
Net cash generated by
operating activities66.3 54.9
Capital expenditure, net of
disposals(35.6) (39.0)
Acquisition of Bentley - (68.8)
Net cash generated by
investing activities(35.6) (107.8)
Interest and other finance
charges paid(27.8) (32.4)
Net proceeds of IPO - 137.2
Net debt repayments (2.3) (60.6)
Net cash generated by
financing activities(30.2) 44.2
Net change in cash 0.5 (8.7)

20
YOY Reduction in Debt and Leverage
280292
269
385
257268
253.5
3.5x 3.6x
3.3x
3.9x
2.6x
2.9x 2.9x
Q2/16 Q3/16 Q4/16 Q1/17 Q2/17 Q3/17 Q4/17
Post
deleveraging
using primary
IPO net
proceeds
Acquisition of
Bentley
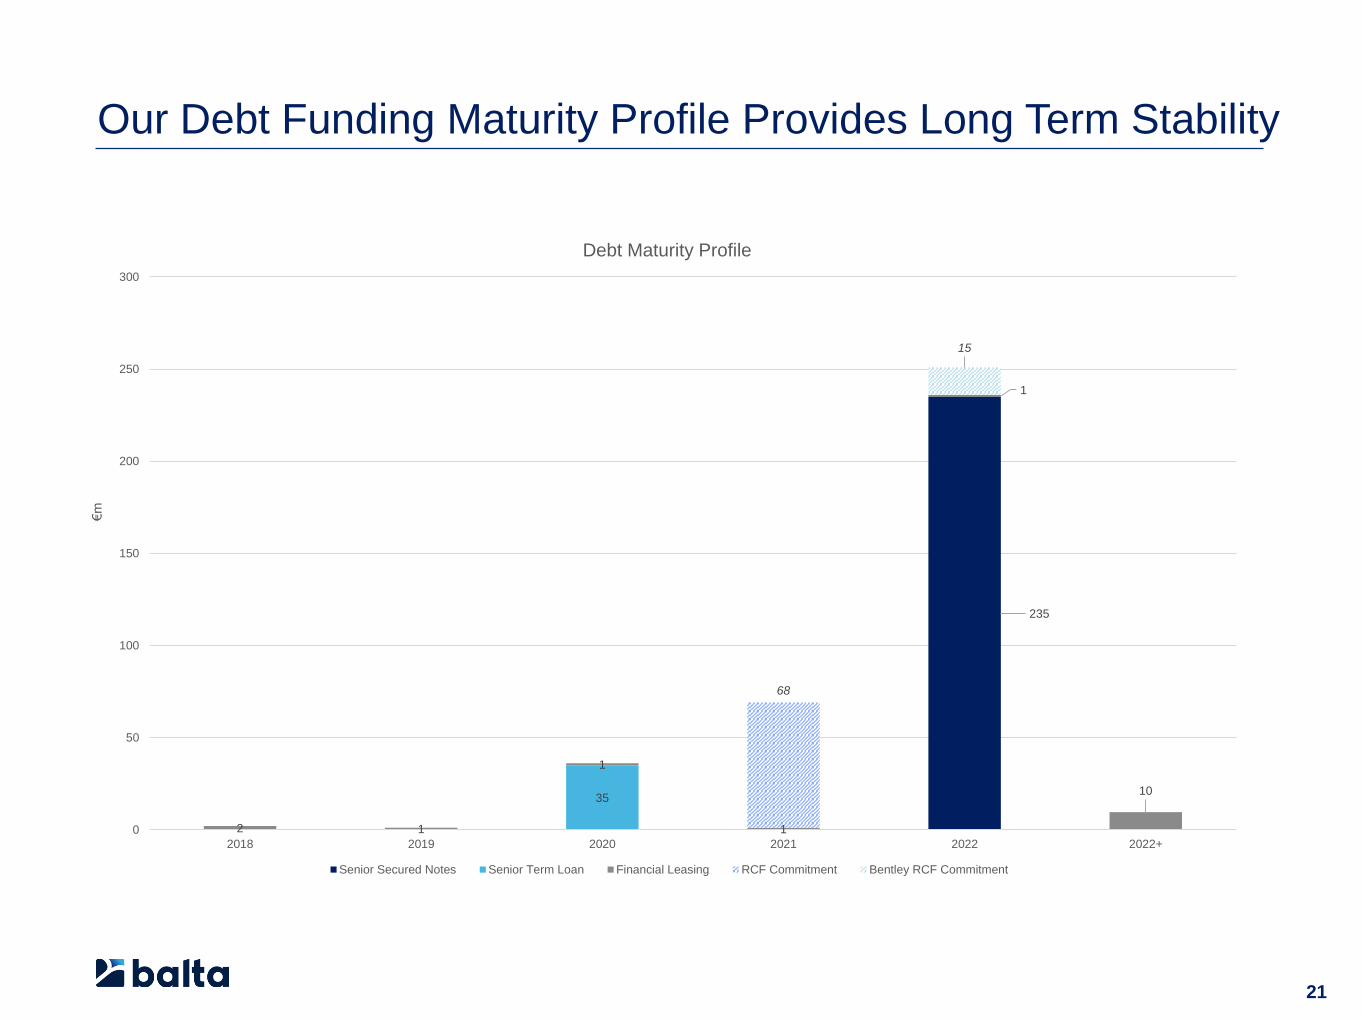
Our Debt Funding Maturity Profile Provides Long Term Stability
235
35
2 1
1
1
1
10
68
15
0
50
100
150
200
250
300
2018 2019 2020 2021 2022 2022+
€m
Debt Maturity Profile
Senior Secured Notes Senior Term Loan Financial Leasing RCF Commitment Bentley RCF Commitment
21

22
2018 Outlook
• Expect 2018 EBITDA to be between €82 and €87m
– Trends of H2 2017 to continue in H1 2018
– Rugs H1 revenue down by mid-teens due to timing effect of gains and losses in customers ‘share of wallet’
– Strong action taken to deliver increased cost savings, leading to a significantly stronger EBITDA run rate in
H2 2018
• Full year leverage expected to be in line with 2017
• Capex between €35-40m
• Effective Tax Rate between 25% to 27% on a like for like profit base

Q&A Session
23

Appendices
24

25
Full Year Revenue and Adjusted EBITDA by Segment
(€ million, unless otherwise stated) 2017 2016
%
change
o/w
organic
growth
o/w
FX
o/w
M&A
Rugs 228.3 214.5 6.4% 8.1% (1.7)% 0.0%
Commercial 171.7 80.1 114.5% 8.0% (1.0)% 107.6%
Residential 234.8 236.8 (0.8)% 0.6% (1.4)% 0.0%
Non-Woven 26.5 26.3 0.6% 0.6% 0.0% 0.0%
Consolidated Revenue 661.3 557.7 18.6% 4.5% (1.4)% 15.4%
Pro Forma Adjustment Bentley 27.7 110.7
Pro Forma Revenue 689.0 668.4 3.1% 4.6% (1.5)%
Rugs 37.6 38.0 (0.9)% 0.3% (1.3)% 0.0%
Commercial 23.9 12.1 98.5% (7.9)% (5.5)% 111.9%
Residential 20.2 28.4 (28.8)% (12.6)% (16.2)% 0.0%
Non-woven 2.6 2.9 (9.9)% (9.9)% 0.0% 0.0%
Consolidated Adjusted EBITDA 84.4 81.4 3.7% (5.8)% (7.1)% 16.6%
Pro Forma Adjustment Bentley 2.9 16.0
Pro Forma Adjusted EBITDA 87.3 97.4 (10.3)% (3.9)% (6.4)%
Rugs 16.5% 17.7%
Commercial 13.9% 15.1%
Residential 8.6% 12.0%
Non-Woven 9.9% 11.1%
Consolidated Adjusted EBITDA Margin 12.8% 14.6%
Pro Forma Adjustment Bentley 10.5% 14.5%
Pro Forma Adjusted EBITDA Margin 12.7% 14.6%

26
Q4 Revenue and Adjusted EBITDA By Segment
(€ million, unless otherwise stated) Q4 2017 Q4 2016
%
change
o/w
organic
growth
o/w
FX
o/w
M&A
Rugs 50.7 53.9 (5.9)% (2.4)% (3.4)% 0.0%
Commercial 52.7 20.5 157.7% 14.8% (1.5)% 144.4%
Residential 59.3 58.3 1.6% 2.4% (0.8)% 0.0%
Non-Woven 6.7 6.6 2.1% 2.1% 0.0% 0.0%
Consolidated Revenue 169.4 139.3 21.7% 2.3% (1.9)% 21.2%
Pro Forma Adjustment Bentley - 29.5
Pro Forma Revenue 169.4 168.8 0.4% 3.5% (3.2)%
Rugs 7.4 9.8 (24.0)% (21.5)% (2.5)% 0.0%
Commercial 6.6 3.1 114.4% (38.4)% (2.2)% 155.0%
Residential 4.3 6.7 (35.3)% (22.0)% (13.3)% 0.0%
Non-woven 0.6 0.5 11.0% 10.9% 0.1% 0.0%
Consolidated Adjusted EBITDA 18.9 20.1 (5.7)% (23.4)% (6.0)% 23.7%
Pro Forma Adjustment Bentley - 5.1
Pro Forma Adjusted EBITDA 18.9 25.2 (24.8)% (18.3)% (6.5)%
Rugs 14.7% 18.2%
Commercial 12.5% 15.0%
Residential 7.3% 11.4%
Non-Woven 8.8% 8.1%
Consolidated Adjusted EBITDA Margin 11.2% 14.4%

27
Profitable Growth:
• Mid-single digit top line growth
& margin expansion
A progressive
dividend policy
Strong underlying FCF conversion:
• Active working capital management
Disciplined and efficient
balance sheet:
• Medium term leverage
target to below 2x
• Minimise financing costs
1Allow us to prioritise value
accretive acquisitions:
• Enhance growth through
acquisition
• Margins to benefit from
synergy and scale
2Whilst maintain a
healthy dividend:
• Pay-out ratio 30-40% of
net profits
3
Our Disciplined Approach to Capital Allocation
Delivering superior shareholder returns


