Download - FRONTIERS OF REAL-TIME DATA ANALYSIS

FRONTIERS OF REAL-TIME DATA ANALYSIS
Dean Croushore
Associate Professor, University of RichmondInterim Director, Real-Time Data Research Center,
Federal Reserve Bank of Philadelphia
October 2008

Introduction
• First paper to do real-time data analysis:– Gartaganis-Goldberger, Econometrica (1955)
• Statistical properties of the statistical discrepancy between GNP and gross national income changed after data were revised in 1954
Research Categories
• Data Revisions
• Forecasting
• Monetary Policy
• Macroeconomic Research
• Current Analysis

Introduction
• Data sets– Real-Time Data Set for Macroeconomists
• Philadelphia Fed + University of Richmond
– Need for good institutional support– Club good: non-rival but excludable

Introduction
• Data sets– Unrestricted access:
• U.S.: Philadelphia Fed, St. Louis Fed, BEA• OECD• Bank of England (recently updated)
– Restricted access:• EABCN
– Fate unclear:• Canada
– One-time research projects:• Many, most not continuously updated
Introduction
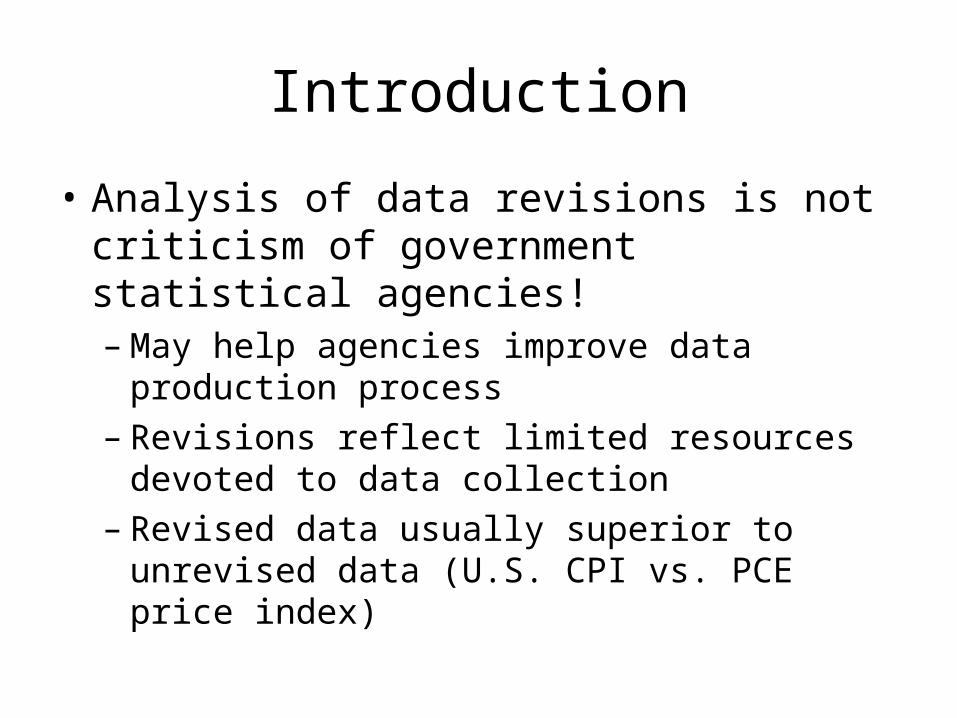
• Analysis of data revisions is not criticism of government statistical agencies!– May help agencies improve data production
process– Revisions reflect limited resources devoted to
data collection– Revised data usually superior to unrevised
data (U.S. CPI vs. PCE price index)

Introduction
• Structure of data sets– The data matrix
• Columns report vintages (dates on which data series are observed)
• Rows report dates for which economic activity is measured
• Moving across rows shows revisions• Main diagonal shows initial releases• Huge jumps in numbers indicate benchmark
revisions with base year changes

REAL OUTPUTVintage: 11/65 2/66 5/66 . . . 11/07 2/08Date47Q1 306.4 306.4 306.4 . . . 1570.5 1570.5 47Q2 309.0 309.0 309.0 . . . 1568.7 1568.7 47Q3 309.6 309.6 309.6 . . . 1568.0 1568.0 . . . . . . .. . . . . . .
. . . . . . .
65Q3 609.1 613.0 613.0 . . . 3214.1 3214.1 65Q4 NA 621.7 624.4 . . . 3291.8 3291.8 66Q1 NA NA 633.8 . . . 3372.3 3372.3 . . . . . . .. . . . . . .. . . . . . .07Q1 NA NA NA . . . 11412.6 11412.607Q2 NA NA NA . . . 11520.1 11520.107Q3 NA NA NA . . . 11630.7 11658.907Q4 NA NA NA . . . NA 11677.4

Data Revisions

Data Revisions
• What Do Data Revisions Look Like?• Are They News or Noise?• Is the Government Using Information Efficiently?• Are Revisions Forecastable?• How Should We Model Data Revisions?
• Key issue: are data revisions large enough economically to worry about?
Data Revisions
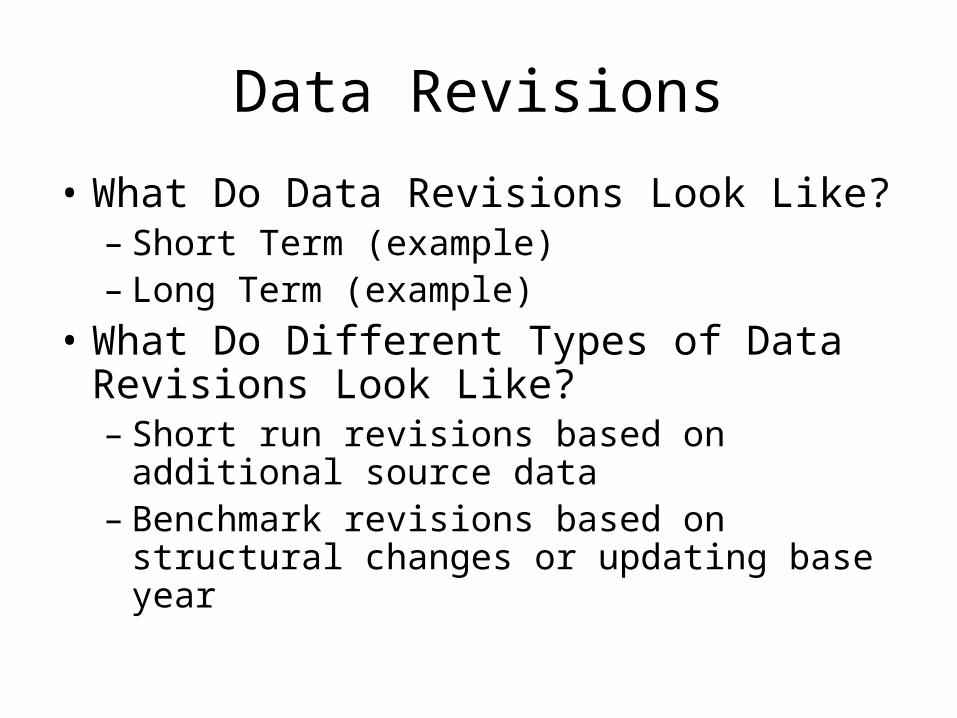
• What Do Data Revisions Look Like?– Short Term (example)– Long Term (example)
• What Do Different Types of Data Revisions Look Like?– Short run revisions based on additional
source data– Benchmark revisions based on structural
changes or updating base year

Figure 1Real Consumption Growth for 1973Q2
(as viewed from the perspective of 138 different vintages)
-1.5
-1.0
-0.5
0.0
0.5
1.0
1973 1976 1979 1982 1985 1988 1991 1994 1997 2000 2003 2006
Vintage
Per
cen
t

Table 2 Average Growth Rates of Real Consumption Over Five Years
Benchmark Vintages Annualized percentage points
Vintage Year: ‘75 ‘80 ‘85 ‘91 ‘95 ’99 ’03 ‘07
Period 49Q4 to 54Q4 3.6 3.3 3.3 3.7 3.9 3.8 3.8 3.8 54Q4 to 59Q4 3.4 3.3 3.3 3.3 3.4 3.5 3.5 3.5 59Q4 to 64Q4 4.1 3.8 3.8 3.7 3.8 4.0 4.1 4.1 64Q4 to 69Q4 4.5 4.3 4.4 4.4 4.5 4.8 4.8 4.8 69Q4 to 74Q4 2.3 2.6 2.6 2.5 2.6 2.8 2.8 2.9 74Q4 to 79Q4 NA 4.4 4.4 3.9 3.9 4.1 4.2 4.1 79Q4 to 84Q4 NA NA 2.8 2.5 2.5 2.6 2.8 2.9 84Q4 to 89Q4 NA NA NA 3.2 3.1 3.4 3.7 3.7 89Q4 to 94Q4 NA NA NA NA 2.3 2.1 2.4 2.6
94Q4 to 99Q4 NA NA NA NA NA NA 4.0 4.1

Data Revisions
• Are Data Revisions News or Noise?– Data Revisions Add News: Data are optimal
forecasts, so revisions are orthogonal to early data; revisions are not forecastable
– Data Revisions Reduce Noise: Data are measured with error, so revisions are orthogonal to final data; revisions are forecastable

Data Revisions
• Are Data Revisions News or Noise?– Mankiw-Runkle-Shapiro (1984): Money data
revisions reduce noise – Mankiw-Shapiro (1986): GDP data revisions
contain news– Mork (1987): GMM results show “final” NIPA
data contain news; other vintages are inefficient and neither noise nor noise
– UK: Patterson-Heravi (1991): revisions to most components of GDP reduce noise

Data Revisions
• Is the Government Using Information Efficiently?
• Theoretical Issue: Should the government report its sample information or project an unbiased estimate using extraneous information?

Data Revisions
• Is the Government Using Information Efficiently?
• Key Issue: What is the trade-off the government faces between timeliness and accuracy?– Zarnowitz (1982): evaluates quality of
different series – McNees (1989): found within-quarter
estimate of GDP to be as accurate as estimate released 15 days after quarter end

Data Revisions
• Findings of bias and inefficiency based on ex-post tests– UK: Garratt-Vahey (2003)– US: Aruoba (2008)

Data Revisions
• Findings of bias and inefficiency of seasonally revised data– Kavajecz-Collins (1995)– Swanson-Ghysels-Callan (1999)
• Revisions to seasonals may be larger than revisions to NSA data: Fixler-Grimm-Lee (2003)
• Key question: Are seasonal revisions predictable? Who cares if that is an artifact of construction?

Data Revisions
• Key Issue: If early government data are projections, then state of business cycle may be related to later data revisions.– Dynan-Elmendorf (2001): GDP is misleading
at turning points– Swanson-van Dijk (2004): volatility of
revisions to industrial production and producer prices increases in recessions

Data Revisions
• Are Revisions Forecastable?– Conrad-Corrado (1979): use Kalman filter to
improve government’s monthly data on retail sales
– Aruoba (2008): revisions to many U.S. variables are forecastable

Data Revisions
• Are Revisions Forecastable?– Key Issue: can revisions be forecast in real-
time (or just ex-post)?• Guerrero (1993): combines historical data with
preliminary data on Mexican industrial production to get improved estimates of final data
• Faust-Rogers-Wright (2005): Examines G-7 countries’ output forecasts; find Japan & U.K. output revisions forecastable in real time

Data Revisions
• How Should We Model Data Revisions?– Howrey (1978)– Conrad-Corrado (1979)– UK: Holden-Peel (1982)– Harvey-McKenzie-Blake-Desai (1983)– UK: Patterson (1995) – UK: Kapetanios-Yates (2004)

Data Revisions
• How Should We Model Data Revisions?– Is there any scope for new research here?
• Show predictability between different vintages to help data agencies improve methods
• Ex: US data on PCE inflation

Forecasting

Forecasting
• Forecasts are only as good as the data behind them
• Literature focuses on model development: trying to build a better forecasting model, especially comparing forecasts from a new model to other models or to forecasts made in real time
• Details: Croushore (2006) Handbook of Economic Forecasting

Forecasting
• Does the fact that data are revised matter significantly (in an economic sense) for forecasts?

Forecasting
• EXAMPLE: THE INDEX OF LEADING INDICATORS• Leading indicators: seem to predict recessions quite
well.• But did they do so in real time? The evidence suggests
skepticism.• Diebold and Rudebusch (1991) investigated the issue,
using real-time data• Their conclusion: The leading indicators do not lead and
they do not indicate! • The use of revised data gives a misleading picture of the
forecasting ability of the leading indicators.

Leading Indicators, vintage Sept 1974
140
145
150
155
160
165
170
175
180
18519
73:0
1
1973
:02
1973
:03
1973
:04
1973
:05
1973
:06
1973
:07
1973
:08
1973
:09
1973
:10
1973
:11
1973
:12
1974
:01
1974
:02
1974
:03
1974
:04
1974
:05
1974
:06
1974
:07
1974
:08
date
Val
ue
of
Lea
din
g In
dex

Forecasting
• EXAMPLE: THE INDEX OF LEADING INDICATORS
• Chart shows not much problem
• But recession started in November 1973
• Subsequently, leading indicators were revised & ex-post they do much better

Leading Indicators, vintage Sept 1974 and Dec. 1989
140
145
150
155
160
165
170
175
180
18519
73:0
1
1973
:02
1973
:03
1973
:04
1973
:05
1973
:06
1973
:07
1973
:08
1973
:09
1973
:10
1973
:11
1973
:12
1974
:01
1974
:02
1974
:03
1974
:04
1974
:05
1974
:06
1974
:07
1974
:08
date
Lea
din
g In
dex
82
84
86
88
90
92
94
96
98
100
Sept. 1974 vintage
Dec. 1989 vintage

Forecasting
• Why Are Forecasts Affected by Data Revisions?– Change in data input into model– Change in estimated coefficients– Change in model itself (number of lags)
– See experiments in Stark-Croushore (2002)

Forecasting
• What Do We Use as Actuals?– Answer: Depends on purpose– Best measures are probably latest-available
data for “truth” (though perhaps not in fixed-weighting era)
– But forecasters would not anticipate redefinitions and generally forecast to be consistent with government data methods (example: pre-chain-weighting period; 2013 capitalization of R&D)

Forecasting
• What Do We Use as Actuals?– Real-Time Data Set: many choices
• first release (or second, or third)• four quarters later (or eight or twelve)• Date of annual revision (July for U.S. data)• last benchmark (the last vintage before a
benchmark revision)• latest available

Forecasting
• How Should Forecasts Be Made When Data Are Revised?– Key issue: temptation to cheat!
• Try method; it doesn’t work; but that’s because of one outlier; dummy out that observation; the method works!
• If data are not available, use a real-time proxy, don’t peak at future data
• Cheating is inherent because you know the history already

Forecasting
• Forecasting with Real-Time versus Latest-Available Data– Denton-Kuiper (1965): first to compare forecasts with
real-time vs revised data– Cole (1969): data errors reduce forecast efficiency &
may lead to biased forecasts– Trivellato-Rettore (1986): data errors in a
simultaneous equations model affect everything: estimated coefficients and forecasts; but for small model of Italian economy, addition to forecast errors were not large

Forecasting
• Forecasting with Real-Time versus Latest-Available Data– Faust-Rogers-Wright (2003): research showing
forecastability of exchange rates depended on a particular vintage of data; other vintages show no forecastability
– Molodtsova (2007): combining real-time data with Taylor rule allows predictability of exchange rate
– Moldtsova-Nikolsko-Rzhevskyy-Papell (2007): dollar/mark exchange rate predictable only with real-time data

Forecasting
• Summary: for forecasting, sometimes data vintage matters, other times it doesn’t

Forecasting
• Levels versus Growth Rates– Howrey (1996): level forecasts of GNP more
sensitive than growth forecasts; so policy should feed back on growth rates, not levels
– Kozicki (2002): choice of forecasting with real-time or latest-available data is important for variables with large level revisions

Forecasting
• Model Selection and Specification– Swanson-White (1997): explores model selection– Robertson-Tallman (1998): real-time data affect
model specification for industrial production but not for GDP
– Harrison-Kapetanios-Yates (2005): it may be optimal to estimate a model without using most recent preliminary data
– Summary: model choice is sometimes affected by data revisions

Forecasting
• Evidence on Predictive Content of Variables – Croushore (2005): consumer confidence
indicators have no predictive power in real time, even when they appear to when using latest-available data

Forecasting
• Optimal Forecasting When Data Are Subject to Revision– Howrey (1978): adjusts for differing degrees
of revision using Kalman filter; in forecasting, use recent data but filter it
– Harvey-McKenzie-Blake-Desai (1983): use state-space methods with missing observations to account for irregular data revisions: large gain in forecast efficiency compared with ignoring data revisions

Forecasting
• Optimal Forecasting When Data Are Subject to Revision– Howrey (1984): use of state-space models to
improve forecasts of inventory investment yields little improvement
– Patterson (2003): illustrates how to combine measurement process with data generation process to improve forecasts for income & consumption

Forecasting
• Optimal Forecasting When Data Are Subject to Revision– What information set to use?
• Koenig-Dolmas-Piger (2003), Kishor-Koenig (2005): focus on diagonals to improve forecasting; treat data the same that have been revised to the same degree

Forecasting
• Optimal Forecasting When Data Are Subject to Revision– Summary: There are sometimes gains to
accounting for data revisions; but predictability of revisions (today for US data) is small relative to forecast error (mainly seasonal adjustment)

Forecasting
• A Troublesome Issue– Specifying a process for data revisions– Some papers specify an AR process
• But research on revisions suggests that benchmark revisions are not so easily characterized

Forecasting
• Key Issue: What are the costs and benefits of dealing with real-time data issues versus other forecasting issues?

Monetary Policy

Monetary Policy: Data Revisions
• How Much Does It Matter for Monetary Policy that Data Are Revised?
• How Misleading Is Monetary Policy Analysis Based on Final Data Instead of Real-Time Data?
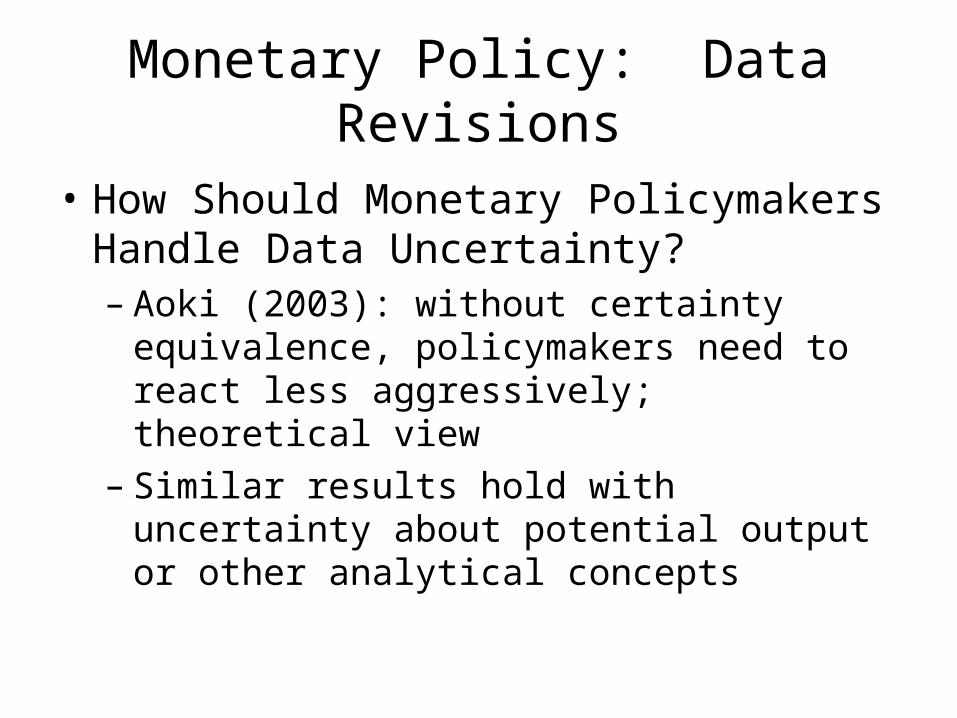
• How Should Monetary Policymakers Handle Data Uncertainty?

Monetary Policy: Data Revisions
• How Much Does It Matter for Monetary Policy that Data Are Revised?– Example: Fed’s favorite inflation measure is
the Personal Consumption Expenditures Price Index Excluding Food & Energy Prices (PCEPIXFE)
– But it has been revised substantially

Figure 1Core PCE Inflation Rate from 1997Q1 to 2002Q1, Vintage May 2002
1.0
1.2
1.4
1.6
1.8
2.0
2.2
2.4
1997 1998 1999 2000 2001 2002
Date
Infl
atio
n R
ate

Figure 3Core PCE Inflation Rate from 1997Q1 to 2002Q1, Vintages May 2002, Dec. 2003, Aug. 2005
1.0
1.2
1.4
1.6
1.8
2.0
2.2
2.4
1997 1998 1999 2000 2001 2002
Date
Infl
atio
n R
ate
August 2005
May 2002
Dec 2003

Monetary Policy: Data Revisions
• How Much Does It Matter for Monetary Policy that Data Are Revised?– Croushore (2008): PCE revisions could
mislead the Fed– Maravall-Pierce (1986): The Fed optimally
signal extracts from the noise in money data, so data revisions would not significantly affect monetary policy
– Kugler et al. (2005): Monetary policy shojuld be less aggressive because of data revisions

Monetary Policy: Data Revisions
• How Misleading Is Monetary Policy Analysis Based on Final Data Instead of Real-Time Data?– Croushore-Evans (2006): Data revisions do
not significantly affect measures of monetary policy shocks in recursive systems, but they make identification of simultaneous systems problematic

Monetary Policy: Data Revisions
• How Should Monetary Policymakers Handle Data Uncertainty?– Coenen-Levin-Wieland (2001): use money as
an indicator when GDP data are uncertain– Bernanke-Boivin (2003): use factor model to
incorporate much data; results do not depend on using real-time data instead of revised data

Monetary Policy: Data Revisions
• How Should Monetary Policymakers Handle Data Uncertainty?– Giannone-Reichlin-Sala (2005): extract real-
time information to determine a real shock and a nominal shock, which represent fundamental dynamics of US economy
Monetary Policy: Data Revisions
• How Should Monetary Policymakers Handle Data Uncertainty?– Aoki (2003): without certainty equivalence,
policymakers need to react less aggressively; theoretical view
– Similar results hold with uncertainty about potential output or other analytical concepts
Monetary Policy: Analytical Revisions
• What Happens When Economists or Policymakers Revise Conceptual Variables?– Output gap– Natural rate of unemployment– Equilibrium real interest rate
• Concepts are never observed, but are centerpiece of macroeconomic theory

Monetary Policy: Analytical Revisions
• Orphanides (2001): Fed overreacted to perceived output gap in 1970s, causing Great Inflation; but output gap was mismeasured

Monetary Policy: Analytical Revisions
• One strand of literature: plug alternative data vintages into Taylor rule:– Kozicki (2004) on U.S. data– Kamada (2005) on Japanese data
• Other Taylor rule work:– Rudebusch (2001): reverse engineer Taylor rule; it
would be more aggressive if data weren’t uncertain– Orphanides (2003): if policy rules are based on
revised data, they are too aggressive

Monetary Policy: Analytical Revisions
• Other real-time models of policy rules:– Cukierman-Lippi (2005): Fed was too
aggressive in 1970s, appropriately conservative in 1990s
– Boivin (2006): Fed changed policy parameters in 1970s and temporarily reduced response to inflation: causing Great Inflation
Monetary Policy: Analytical Revisions
• Other natural rate issues– Orphanides-Williams (2002): large costs to
ignoring mismeasurement of natural rate of unemployment and natural rate of interest
– Staiger-Stock-Watson (1997): tremendous uncertainty about natural rate of unemployment
– Clark-Kozicki (2005): ditto for natural rates of interest

Monetary Policy: Analytical Revisions
• Output gap uncertainty:– U.S.: Orphanides-van Norden (2002)– UK: Nelson-Nikolov (2003)– Germany: Gerberding-Seitz-Worms (2005)– Euro area: Gerdesmeieir-Roffia (2005)– Norway: Bernhardsen (2005)– Canada: Cayen-van Norden (2005)– Germany: Döpke (2005)

Monetary Policy: Analytical Revisions
• Policy models may change:– Tetlow-Ironside (2007): changes in FRB-US
model changed the story the model was telling to policymakers

Monetary Policy: Analytical Revisions
• What Happens When Economists or Policymakers Revise Conceptual Variables?– Key issue: end-of-sample inference for
forward-looking concepts (filters)– Key issue: optimal model of evolution of
analytical concepts• Most work is statistical; perhaps a theoretical
breakthrough is needed

Macroeconomic Research
Macroeconomic Research
• How Is Macroeconomic Research Affected By Data Revisions?– Croushore-Stark (2003): how results from
key macro studies are affected by alternative vintages
– Boschen-Grossman (1982): testing neutrality of money under rational expectations: support for RE with revised data, but not with real-time data

Macroeconomic Research
• How Is Macroeconomic Research Affected By Data Revisions?– Amato-Swanson (2001): the predictive
content of money for output is not clear in real time; only in revised data

Macroeconomic Research
• Should Macroeconomic Models Incorporate Data Revisions?– Aruoba (2004): business-cycle dynamics are
captured better by a DSGE model that accounts for data revisions than one that does not
– Edge, Laubach, Williams (2004): learning explains long-run productivity growth forecasts; helps explain cycles in employment, investment, long-term interest rates
Macroeconomic Research
• Do Data Revisions Affect Economic Activity?– Oh-Waldman (1990): false (positive) announcements
increase economic activity with leading indicators and industrial production in real time
– Bomfim (2001): improving the signal in data would exacerbate cyclical fluctuations if agents performed optimal signal extraction; but if agents ignore data revisions, then improving data quality would reduce cyclical fluctuations
Macroeconomic Research
• Overall: literature in its infancy: more work needed in all three areas (robustness of research results, incorporating data revisions into macro models, examining how or whether data revisions affect economic activity)

Current Analysis
• How Do Financial Markets React to Data Revisions?– Christoffersen-Ghysels-Swanson (2002):
need real-time data to properly determine announcement effects in financial markets

Current Analysis
• How Is Business Cycle Dating Affected By Data Revisions?– Economists like to argue about the state of
the business cycle . . .


Current Analysis
• How Is Business Cycle Dating Affected By Data Revisions?– Chauvet-Piger (2003, 2005): test algorithms
to identify turning points in real time– Chauvet-Hamilton (2006): develop alternative
recession indicators and forecasts in real time– Nalewaik (2007): using real-time gross
domestic income helps forecast recessions better than just using GDP

Current Analysis
• Overall: much additional research needed in current analysis in real time

Summary
• Field of real-time data analysis offers many opportunities for new research
• Most promising areas:– Macroeconomic research: incorporating data
revisions into macro models– Current analysis of business and financial
conditions– Other areas are more mature & need more
sophisticated analysis


