
Elsevier US Job code: NAAD Ch01-P370480 3-5-2007 10:03a.m. Page:1 Trim:7.5in×9.25in TS: Integra, India
Font: Bembo & Helvetica Size:11/13pt Margins:Top:4pc Gutter:68pt Width:30pc Depth: 38 lines COP: Facing 1 Color

Elsevier US Job code: NAAD Ch01-P370480 3-5-2007 10:03a.m. Page:2 Trim:7.5in×9.25in TS: Integra, India
Font: Bembo & Helvetica Size:11/13pt Margins:Top:4pc Gutter:68pt Width:30pc Depth: 38 lines COP: Facing 1 Color
C H A P T E R C O N T E N T S
1.1 Objectives
1.2 Preparation
1.3 Background
1.4 Overview of Analysis, Architecture, and Design Processes1.4.1 Process Components1.4.2 Tactical and Strategic Significance1.4.3 Hierarchy and Diversity1.4.4 Importance of Network Analysis1.4.5 Model for Network Analysis, Architecture, and Design
1.5 A Systems Methodology
1.6 System Description
1.7 Service Description
1.8 Service Characteristics1.8.1 Service Levels1.8.2 System Components and Network Services1.8.3 Service Requests and Requirements1.8.4 Service Offerings1.8.5 Service Metrics
1.9 Performance Characteristics1.9.1 Capacity1.9.2 Delay1.9.3 RMA1.9.4 Performance Envelopes
1.10 Network Supportability
1.11 Conclusion
1.12 Exercises
2
Elsevier US Job code: NAAD Ch01-P370480 3-5-2007 10:03a.m. Page:3 Trim:7.5in×9.25in TS: Integra, India
Font: Bembo & Helvetica Size:11/13pt Margins:Top:4pc Gutter:68pt Width:30pc Depth: 38 lines COP: Facing 1 Color
1Introduction
I begin this book with a description of the analysis, architecture, and design pro-cesses. Many of the concepts and terms used throughout this book are introducedand defined in this chapter. Some of these concepts may be new to you, while oth-ers are presented in a different light. Glossaries of terms and acronyms are presentedat the end of this book for easy reference.
1.1 ObjectivesIn this chapter I will introduce the fundamental concepts of this book: that thenetwork is part of a system that provides services to its end users; that there areprocesses for developing an analysis, an architecture, and a design for a network;and that there are ways to characterize a network.
1.2 PreparationIn order to understand and apply the concepts in this chapter, you should be familiarwith basic networking concepts. This includes the functions and features of theTCP/IP protocol suite, technologies such as the variants of Ethernet, synchronousoptical network (SONET), and wave division multiplexing (WDM), and the basicsof network routing, security, performance, and management.
1.3 BackgroundNetwork analysis, architecture, and design have traditionally been considered art,combining an individual’s particular rules on evaluating and choosing networktechnologies; knowledge about how technologies, services, and protocols can bemeaningfully combined; experience in what works and what doesn’t; along with(often arbitrary) selections of network architectures. However, as with other types ofart, success of a particular network design often depends primarily on who is doing
3
Elsevier US Job code: NAAD Ch01-P370480 3-5-2007 10:03a.m. Page:4 Trim:7.5in×9.25in TS: Integra, India
Font: Bembo & Helvetica Size:11/13pt Margins:Top:4pc Gutter:68pt Width:30pc Depth: 38 lines COP: Facing 1 Color
4 C H A P T E R 1 Introduction
the work, with results that are rarely reproducible. This may have been acceptablein the early days of networking, when networks were more of a hobby than acritical resource and did not directly support revenue generation. Today, however,networks are embedded within our work, home, and outside environments. Theyare considered “mission-critical”1 to corporate success and provide near real-timeaccess to information throughout the world. As such, the design of a network mustbe logical, reproducible, and defensible. This premise is the foundation for thisbook.
Traditionally, network analysis, architecture, and design have been based ondeveloping and applying a set of rules for the network. In developing a set of rules,an individual may draw from personal experience as well as from general rules suchas the 80/20 rule (where 80% of a network’s traffic is local and 20% is remote) orthe adage “bridge when you can, route when you must” (bridging being simpler,easier, and cheaper at the time). As we see later in this book, although both of theserules are ancient from the perspective of networking history, they still apply today,albeit in modified form. Such rules were useful when there weren’t many choicesin network technologies and services, and when the differences between choiceswere clearly understood. But times have changed, and our notion of designingnetworks must adapt to the variety of options now available to us, the variety ofservices that networks can offer to end users, and the subtle nuances brought aboutby combining network technologies, techniques, and services.
Example 1.1.
Consider the subtleties in network behavior introduced through the use of virtual privatenetworks, intranets, or VPNs. VPNs are quite useful; however, care must be taken tounderstand their potential impact on network security, routing, and management. SinceVPNs tunnel (encapsulate) and can encrypt traffic flowing across a network, they oftenrequire more effort to secure, monitor, and manage. How VPNs impact security, routing,and management will be considered during the architecture process.
Network analysis, architecture, and design have traditionally focused on capacityplanning, which is over-engineering a network to provide an amount of capacity(also known as bandwidth) estimated to accommodate most short- and long-termtraffic fluctuations over the life cycle of the design. The result is a bandwidth
1Ambiguous terms such as these will be defined in this chapter.

Elsevier US Job code: NAAD Ch01-P370480 3-5-2007 10:03a.m. Page:5 Trim:7.5in×9.25in TS: Integra, India
Font: Bembo & Helvetica Size:11/13pt Margins:Top:4pc Gutter:68pt Width:30pc Depth: 38 lines COP: Facing 1 Color
Background 5
“buffer” that can handle these fluctuations. As network traffic grows over time,this bandwidth buffer is reduced, and users experience problems related to trafficcongestion. This is an inefficient use of network resources, wasting money upfront in resources that are not used while failing to provide the flexibility neededto adapt to users’ changing traffic requirements. Network bandwidth is only onecomponent of network resources that we must consider. We also need to considerhow delay through the network, as well as network reliability, maintainability, andavailability (RMA), can be optimized. In today’s evolving networks, delay andreliability can be more important than capacity.
In this book we explore how the analysis, architecture, and design processeshave changed and how they continue to change. We discuss how these processeswork together in engineering a new or existing network. We approach networksfrom a different perspective—as a system providing services to its users—and wediscuss how networks can be designed to provide many different types of servicesto users. In taking this approach we emphasize network analysis, which helps usunderstand what is required of a network in supporting its customers and theirapplications and devices. As we will see, these processes require an investment intime and effort, but the return on investment is significant. These are powerful toolsthat can help you build better networks, improving the ability of your organizationto get its work done.
This book begins by applying a systems methodology to networking. Thismethodology is relatively new, and you will learn a number of useful definitions inregard to network analysis, architecture, and design. The rest of this book is logicallydivided into three sections. The first section covers the analysis process: specifically,how to develop requirements, understand traffic flows, and conduct a risk analysis.The analysis process prepares you for dealing with network architecture, discussedin the second section. Here I describe how to make technology and topologychoices for your network, how to understand the relationships among the variousfunctions within your network, and how to use this information to develop anarchitecture. In the final section the network architecture is used as input for thedesign process, where location information, equipment, and vendor selections areused to detail the design. Information flows between analysis, architecture, anddesign processes are presented in Figure 1.1.
Network analysis, architecture, and design will help you identify and applynetwork services and performance levels needed to satisfy your users. Throughthese processes you will be able to understand the problems you are trying toaddress with the new network; determine the service and performance objectives

Elsevier US Job code: NAAD Ch01-P370480 3-5-2007 10:03a.m. Page:6 Trim:7.5in×9.25in TS: Integra, India
Font: Bembo & Helvetica Size:11/13pt Margins:Top:4pc Gutter:68pt Width:30pc Depth: 38 lines COP: Facing 1 Color
6 C H A P T E R 1 Introduction
Analysis
Requirements,Flows, Risks
SectionOne
Architecture
Technology and Topology Choices;Relationships within and between
Network Functions
SectionTwo
Design
Equipment, Vendor Choices,Location Information
SectionThree
FIGURE 1.1 Information Flows Between Network Analysis, Architecture, and Design
needed to tackle these problems; and architect and design the network to providethe desired services and performance levels.
1.4 Overview of Analysis, Architecture,and Design Processes
Network analysis, architecture, and design are processes used to produce designsthat are logical, reproducible, and defensible. These processes are interconnected,in that the output of one process is used directly as input to the next, thus creatingflows of information from analysis to architecture, and from architecture to design.
Network analysis entails learning what users, their applications, and devices needfrom the network (Figure 1.2). It is also about understanding network behaviorunder various situations. Network analysis also defines, determines, and describesrelationships among users, applications, devices, and networks. In the process,network analysis provides the foundation for all the architecture and design decisionsto follow. The purpose of network analysis is twofold: first, to listen to users andunderstand their needs; and second, to understand the system.
In analyzing a network we examine the state of the existing network, includingwhatever problems it may be having. We develop sets of problem statements

Elsevier US Job code: NAAD Ch01-P370480 3-5-2007 10:03a.m. Page:7 Trim:7.5in×9.25in TS: Integra, India
Font: Bembo & Helvetica Size:11/13pt Margins:Top:4pc Gutter:68pt Width:30pc Depth: 38 lines COP: Facing 1 Color
Overview of Analysis, Architecture, and Design Processes 7
State of existing networkProblems with existing network and system
Requirements from users, applications, devices
Descriptions of problem statements for networkDescriptions of requirements for network
Descriptions of traffic flowsMappings of applications and devices to network
Descriptions of potential risks
NetworkAnalysis
FIGURE 1.2 Inputs To and Outputs From the Network Analysis Process
and objectives that describe what our target network will be addressing. And wedevelop requirements and traffic flows, as well as mappings of users, applications,and devices, in support of our problem statements and objectives. As such, networkanalysis helps us understand what problems we are trying to solve, and in theprocess we compile information that will be used in developing the architectureand design.
Example 1.2.
The analysis, architecture, and design processes can be applied to any network project,regardless of size or scope. Since we are developing sets of problem statements, objectives,and requirements as input to the analysis process, we can scale the architecture and designto meet the scope of the project. Consider the use of VPNs from Example 1.1. We candevelop problem statements, objectives, and requirements for VPNs in an existing network,and develop an analysis, architecture, and design solely around a VPN deployment.
Network architecture uses the information from the analysis process to developa conceptual, high-level, end-to-end structure for the network. In developingthe network architecture we make technology and topology choices for the net-work. We also determine the relationships among the functions of the network(addressing/routing, network management, performance, and security), and howto optimize the architecture across these relationships. There usually is not a single“right” architecture or design for a network; instead there are several that willwork, some better than others. The architecture and design processes focus on

Elsevier US Job code: NAAD Ch01-P370480 3-5-2007 10:03a.m. Page:8 Trim:7.5in×9.25in TS: Integra, India
Font: Bembo & Helvetica Size:11/13pt Margins:Top:4pc Gutter:68pt Width:30pc Depth: 38 lines COP: Facing 1 Color
8 C H A P T E R 1 Introduction
finding those best candidates for architecture and design (optimized across severalparameters) for your conditions.
The network architecture process determines sets of technology and topologychoices; the classes of equipment needed; and the relationships among networkfunctions (Figure 1.3).
Network design provides physical detail to the architecture. It is the target of ourwork, the culmination of analysis and architecture processes. Physical detail includesblueprints and drawings of the network; selections of vendors and service providers;and selections of equipment (including equipment types and configurations)(Figure 1.4).
Technology choices for networkTopology choices for network
Relationships between network functionsEquipment classes
Descriptions of problem statements for networkDescriptions of requirements for network
Descriptions of traffic flowsMappings of applications and devices to network
Descriptions of potential risks
NetworkArchitecture
FIGURE 1.3 Inputs To and Outputs From the Network Architecture Process
Technology selections for networkTopology selections for network
Relationships between network functionsEquipment classes
Vendor selections for networkService Provider selections for network
Equipment selections for networkBlueprints and drawings of network
NetworkArchitecture
FIGURE 1.4 Inputs To and Outputs From the Network Design Process
Elsevier US Job code: NAAD Ch01-P370480 3-5-2007 10:03a.m. Page:9 Trim:7.5in×9.25in TS: Integra, India
Font: Bembo & Helvetica Size:11/13pt Margins:Top:4pc Gutter:68pt Width:30pc Depth: 38 lines COP: Facing 1 Color
Overview of Analysis, Architecture, and Design Processes 9
During network design we use an evaluation process to make vendor, serviceprovider, and equipment selections, based on input from the network analysis andarchitecture. You will learn how to set design goals, such as minimizing networkcosts or maximizing performance, as well as how to achieve these goals, throughmapping network performance and function to your design goals and evaluatingyour design against its goals to recognize when the design varies significantly fromthese goals. Network design is also about applying the trade-offs, dependencies,and constraints developed as part of the network architecture. Trade-offs, such ascost versus performance or simplicity versus function, occur throughout the designprocess, and a large part of network design concerns recognizing such trade-offs(as well as interactions, dependencies, and constraints) and optimizing the designamong them. As part of the design process you will also learn how to developevaluation criteria for your designs.
As we show throughout the remainder of this book, network analysis, architec-ture, and design combine several things—requirements, traffic flows, architecturaland design goals, interactions, trade-offs, dependencies, constraints, and evaluationcriteria—to optimize a network’s architecture and design across several parameters.These parameters are chosen and analyzed during the analysis process and prioritizedand evaluated during the architecture and design processes. On completion of theseprocesses you should have a thorough understanding of the network and plenty ofdocumentation to take you forward to implementation, testing, and integration.
Example 1.3.
A network’s architecture and design are analogous to the architecture and design of ahome. Both the network and home architecture describe the major functional componentsof each (for the network: network management, addressing and routing, security andprivacy, and performance; for the home: plumbing, electrical, HVAC [heating, vacuum, airconditioning], framing) and the relationships among them (for the network: interactions,dependencies, trade-offs, and constraints; for the home: where each component is placedrelative to the others). The network and home designs are also similar in that they bothprovide physical detail to the architecture. For the network this means where major networkdevices are located; and, for the home, where ducts, outlets, faucets, drains, and so forthare located.
1.4.1 Process Components
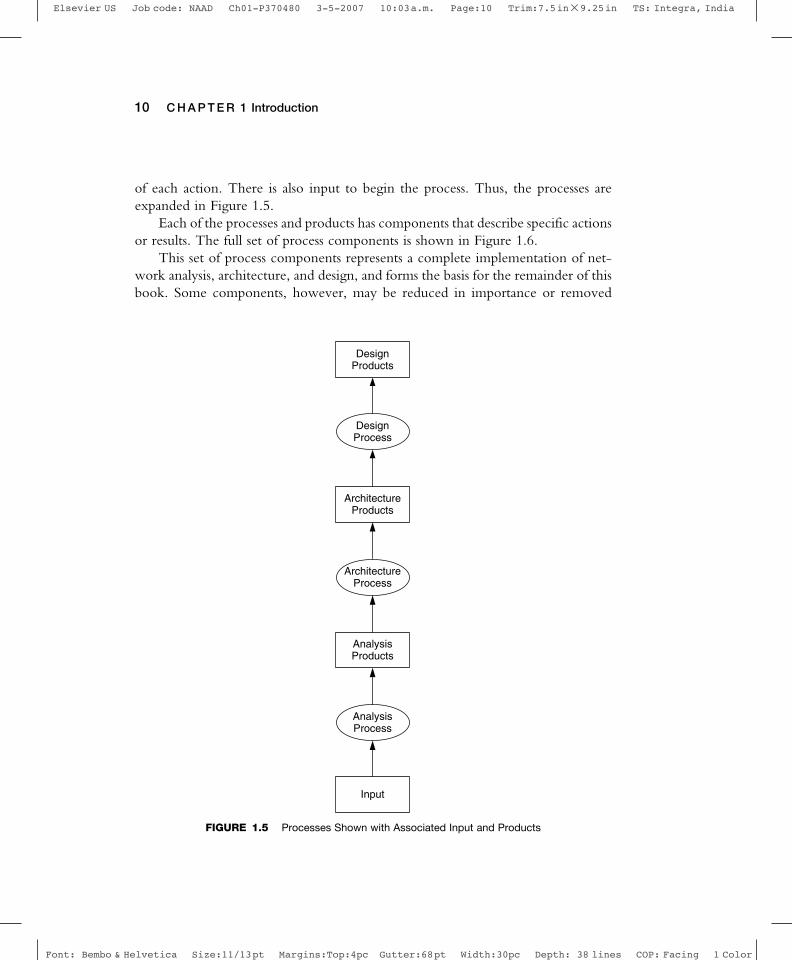
We now add detail to the analysis, architecture, and design processes. Each of theseprocesses has actions that will be taken by project personnel and results or products
Elsevier US Job code: NAAD Ch01-P370480 3-5-2007 10:03a.m. Page:10 Trim:7.5in×9.25in TS: Integra, India
Font: Bembo & Helvetica Size:11/13pt Margins:Top:4pc Gutter:68pt Width:30pc Depth: 38 lines COP: Facing 1 Color
10 C H A P T E R 1 Introduction
of each action. There is also input to begin the process. Thus, the processes areexpanded in Figure 1.5.
Each of the processes and products has components that describe specific actionsor results. The full set of process components is shown in Figure 1.6.
This set of process components represents a complete implementation of net-work analysis, architecture, and design, and forms the basis for the remainder of thisbook. Some components, however, may be reduced in importance or removed
Input
AnalysisProducts
ArchitectureProducts
DesignProducts
DesignProcess
ArchitectureProcess
AnalysisProcess
FIGURE 1.5 Processes Shown with Associated Input and Products

Elsevier US Job code: NAAD Ch01-P370480 3-5-2007 10:03a.m. Page:11 Trim:7.5in×9.25in TS: Integra, India
Font: Bembo & Helvetica Size:11/13pt Margins:Top:4pc Gutter:68pt Width:30pc Depth: 38 lines COP: Facing 1 Color
Overview of Analysis, Architecture, and Design Processes 11
Pro
blem
Sta
tem
ent
Initi
alC
ondi
tions
Wor
kflo
wD
ata
Exi
stin
gP
olic
ies
Mod
elD
evel
opm
ent
Tra
ffic
Flo
wA
naly
sis
Req
uire
men
tsD
evel
opm
ent
Ris
k/C
usto
mer
Dev
elop
men
t
Inpu
t
Ana
lysi
sP
roce
ss
Ana
lysi
sP
rodu
cts
Arc
hite
ctur
eP
roce
ss
Arc
hite
ctur
eP
rodu
cts
Des
ign
Pro
cess
Des
ign
Pro
duct
s
Eva
luat
ions
Rel
atio
nshi
pD
evel
opm
ent
Ris
kA
sses
smen
tM
odel
Ref
inem
ent
Ven
dor/
SP
Equ
ip E
vals
Net
wor
kLa
yout
Ris
kT
rack
ing/
Ref
inem
ent
Mod
elR
efin
emen
t
Req
uire
men
ts S
peci
ficat
ion
Flo
w S
peci
ficat
ion
Top
olog
yS
elec
tion
Tec
hnol
ogy
Sel
ectio
nE
quip
men
tT
ype/
Cla
ssS
trat
egic
Loca
tions
Com
pone
ntR
elat
ions
hips
Ref
ined
Ris
ksA
rchi
tect
ure
Val
idat
ion
Arc
hite
ctur
eB
ound
arie
s
Req
uire
men
tsS
ervi
ces
Loca
tion
Info
rmat
ion
Tra
ffic
Flo
ws
Arc
h/D
esig
nT
hrus
tsR
isk
Ana
lysi
sR
equi
rem
ents
Bou
ndar
ies
Tra
ffic
Flo
wV
alid
atio
n
Ven
dor/
SP
Sel
ectio
nsE
quip
men
tS
elec
tions
Con
figur
atio
nD
ata
Net
wor
kB
luep
rints
Com
pone
ntP
lans
Des
ign
Val
idat
ion
Des
ign
Bou
ndar
ies
Ref
ined
Ris
ks
Pro
cess
Pro
cess
Com
pone
nts
and
Pro
duct
sM
odel
ing/
Sim
ulat
ion
Ris
kM
anag
emen
t
FIG
UR
E1
.6Th
eFu
llS
etof
Pro
cess
Com
pon
ents
Elsevier US Job code: NAAD Ch01-P370480 3-5-2007 10:03a.m. Page:12 Trim:7.5in×9.25in TS: Integra, India
Font: Bembo & Helvetica Size:11/13pt Margins:Top:4pc Gutter:68pt Width:30pc Depth: 38 lines COP: Facing 1 Color
12 C H A P T E R 1 Introduction
on a per-project basis. Throughout this book we discuss which components arenecessary, and which may be reduced in importance.
1.4.2 Tactical and Strategic Significance
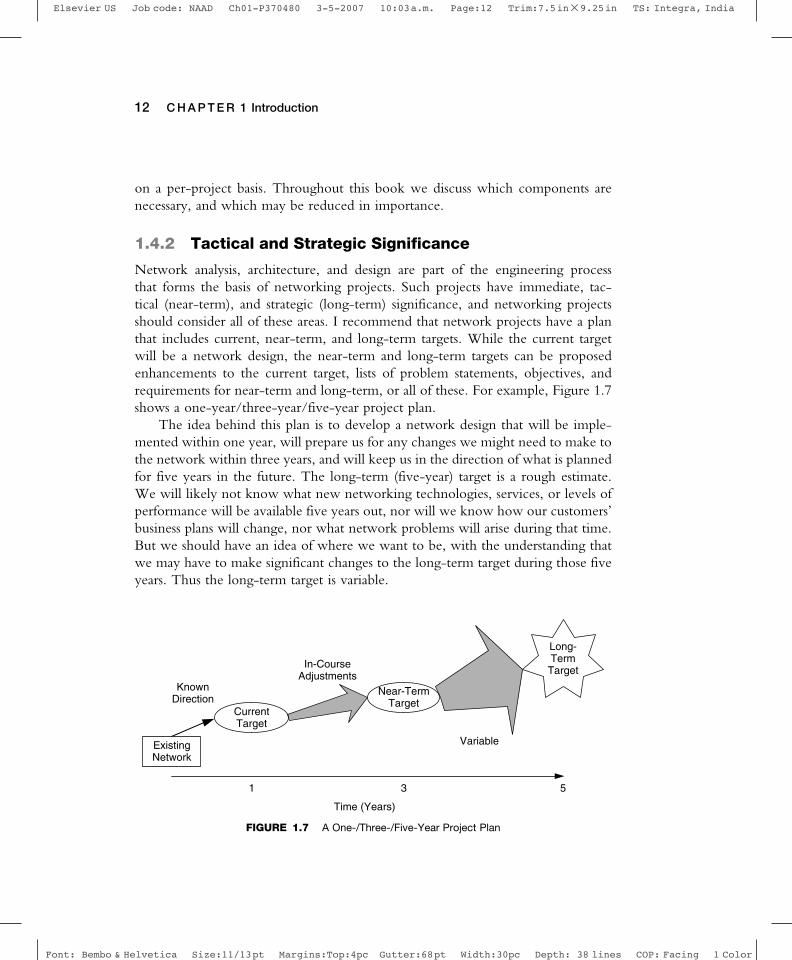
Network analysis, architecture, and design are part of the engineering processthat forms the basis of networking projects. Such projects have immediate, tac-tical (near-term), and strategic (long-term) significance, and networking projectsshould consider all of these areas. I recommend that network projects have a planthat includes current, near-term, and long-term targets. While the current targetwill be a network design, the near-term and long-term targets can be proposedenhancements to the current target, lists of problem statements, objectives, andrequirements for near-term and long-term, or all of these. For example, Figure 1.7shows a one-year/three-year/five-year project plan.
The idea behind this plan is to develop a network design that will be imple-mented within one year, will prepare us for any changes we might need to make tothe network within three years, and will keep us in the direction of what is plannedfor five years in the future. The long-term (five-year) target is a rough estimate.We will likely not know what new networking technologies, services, or levels ofperformance will be available five years out, nor will we know how our customers’business plans will change, nor what network problems will arise during that time.But we should have an idea of where we want to be, with the understanding thatwe may have to make significant changes to the long-term target during those fiveyears. Thus the long-term target is variable.
Time (Years)
1 3 5
CurrentTarget
Long-Term
Target
Near-TermTarget
KnownDirection
In-CourseAdjustments
VariableExistingNetwork
FIGURE 1.7 A One-/Three-/Five-Year Project Plan

Elsevier US Job code: NAAD Ch01-P370480 3-5-2007 10:03a.m. Page:13 Trim:7.5in×9.25in TS: Integra, India
Font: Bembo & Helvetica Size:11/13pt Margins:Top:4pc Gutter:68pt Width:30pc Depth: 38 lines COP: Facing 1 Color
Overview of Analysis, Architecture, and Design Processes 13
The current (one-year) target should be well understood and is the focus ofour analysis, architecture, and design effort. In between the one-year and five-yeartargets, the near-term (three-year) target is intended to be somewhat flexible, yetbetter understood than the long-term target. A significant change in the long-termtarget (e.g., the result of a planned merger, outsourcing, or major change in acompany’s business) can be mediated by course corrections in the near-term plan.
Although a one-/three-/five-year plan is shown here, the important concept isto have both tactical and strategic approaches to your plan. Experience shows thatone-/three-/five-year plans are very good starting points, but depending on yourcustomers, you may rapidly evolve your network with a six-month/one-year/two-year plan, or take a longer-term view with a one-year/five-year/ten-year plan.I have seen all of these plans work to meet the needs of their customers.
Example 1.4.
Voice over IP (VoIP) is of interest to many organizations and is an example of a networkproject that would benefit from tactical and strategic plans. If we apply the one-/three-/five-year plan discussed earlier, the current target (one-year plan) would include the networkdesign for VoIP, based on what is achievable within one year, and the problem statements,objectives, and requirements that result from the requirements analysis process. For example,the current target may be a design that only prepares for VoIP by improving the overallreliability of the network. The near-term target (three-year plan) would conceivably buildon the current target to add or expand VoIP to those areas that can support it. Thelong-term target (five-year plan) would address any major changes that occurred over theprevious four years, including advancements in VoIP technology and an assessment whetherto continue with VoIP or evolve to new or different technologies.
These plans are intended to be iterative and should be regularly reviewed,on the order of twice yearly, once per year, or every two years, depending onyour plan. At each iteration the current, near-term, and long-term targets arereviewed and checked against the ongoing sets of problem statements, objectives,and requirements developed during the analysis, architecture, and design processes.One iteration of the cycle (including network implementation, test, and acceptance)is shown in Figure 1.8.
Each iteration is an incremental step toward the near-term and long-termtargets, as shown in Figure 1.9. The steps 1, 2, 3, and 4 correspond to the steps inthe process shown in Figure 1.8. Thus each iteration is a full cycle as shown above.

Elsevier US Job code: NAAD Ch01-P370480 3-5-2007 10:03a.m. Page:14 Trim:7.5in×9.25in TS: Integra, India
Font: Bembo & Helvetica Size:11/13pt Margins:Top:4pc Gutter:68pt Width:30pc Depth: 38 lines COP: Facing 1 Color
14 C H A P T E R 1 Introduction
RequirementsGathering
Requirementsand Flow Analyses
NetworkArchitectureand Design
NetworkImplementation, Test,
and Acceptance
OneIteration
ofProcess
1
2
3
4
Steps in Process
FIGURE 1.8 The Cyclic and Iterative Nature of Processes
Time
tegraT
mreT-gnoL ot noitulov
E
1 2 3 4
Steps1st Iteration(Baseline)
1 2 3 4
Steps
2nd Iteration
1 2 3 4
Steps
3rd Iteration
1 2 3 4
Steps
Nth Iteration
Long-TermTarget
FIGURE 1.9 Process Iterations Evolve Toward the Long-Term Target
1.4.3 Hierarchy and Diversity
All of these processes center around two important characteristics of networks:their levels of hierarchy and diversity. Hierarchy is the degree of concentration ofnetworks or traffic flows at interconnection points within the network, as well as
Elsevier US Job code: NAAD Ch01-P370480 3-5-2007 10:03a.m. Page:15 Trim:7.5in×9.25in TS: Integra, India
Font: Bembo & Helvetica Size:11/13pt Margins:Top:4pc Gutter:68pt Width:30pc Depth: 38 lines COP: Facing 1 Color
Overview of Analysis, Architecture, and Design Processes 15
the number of tiers of interconnection points within the network. In general, asnetworks grow in size and numbers of users, applications, and devices increase,hierarchies provide separation and structure within the network. Hierarchies areimportant because they help us in determining the sizes of networks, includingrouting and addressing configurations, and the scaling of network technologies,performance, and service levels. A key concept of this book is understanding thesehierarchies, learning how and where they will occur, and learning how to takeadvantage of them.
Along with hierarchy, there must be some consideration for the degree of diver-sity (a.k.a. redundancy or interconnectivity) in the network design. As hierarchyprovides structure in the network, diversity balances this structure by interconnect-ing the network at different levels in the design to provide greater performancethrough parts of the network. Diversity is important in that it provides a mechanismto achieve performance within a hierarchical structure. The dynamic between hier-archy and diversity is perhaps one of the most fundamental trade-offs in networkarchitecture and design, and it shows up several times in the analysis, architecture,and design processes.
Hierarchy and diversity may be a bit confusing at this point, but this conceptwill become clearer as we progress through the book. Hierarchy is fundamentalto networking (as it is throughout nature) because it provides a separation of thenetwork into segments. These segments may be separate, smaller networks (subnets)or broadcast domains. Hierarchy is necessary when the amount of traffic on thenetwork grows beyond the capacity of the network or when interactions betweendevices on the network result in congestion (e.g., broadcast storms).
Figure 1.10 illustrates levels of hierarchy and diversity in a network. This is atypical tree structure for a network, with circles representing networks or routersand lines representing the communications links between networks and/or routers.In this figure there are four levels of hierarchy, from core (or backbone) networksto access networks closest to users. Note that the end points of this tree (commonlyreferred to as leaves; they represent the end networks, devices, or users) all occurat the same level of hierarchy. This does not have to be the case; indeed, in mostnetworks there are leaves at most levels of hierarchy.
An example of adding hierarchy to a network is changing from a flat (bridgedor layer 2 switched) structure to a routed structure. This may be done to reducethe size of the broadcast domain or the number of devices reached by a broadcastmessage. Adding routing to the network breaks a broadcast domain into a numberof smaller broadcast domains, and traffic flows are concentrated at routers. Figure1.11 shows this scenario. Hierarchy is also added to networks when evolving from

Elsevier US Job code: NAAD Ch01-P370480 3-5-2007 10:03a.m. Page:16 Trim:7.5in×9.25in TS: Integra, India
Font: Bembo & Helvetica Size:11/13pt Margins:Top:4pc Gutter:68pt Width:30pc Depth: 38 lines COP: Facing 1 Color
16 C H A P T E R 1 Introduction
…… … … … … … … … … … … … … … …End Users
Core
Access
Levels of Hierarchy Levels of Diversity
FIGURE 1.10 Hierarchy and Diversity in a Network
Routed network with one level of hierarchy added—three broadcastdomains
Broadcast Domain
Broadcast DomainBroadcast Domain
Broadcast Domain
FIGURE 1.11 Hierarchy Added to a Network

Elsevier US Job code: NAAD Ch01-P370480 3-5-2007 10:03a.m. Page:17 Trim:7.5in×9.25in TS: Integra, India
Font: Bembo & Helvetica Size:11/13pt Margins:Top:4pc Gutter:68pt Width:30pc Depth: 38 lines COP: Facing 1 Color
Overview of Analysis, Architecture, and Design Processes 17
a single autonomous system (AS) to connecting multiple ASs, as well as whenmigrating from Interior Gateway Protocols (IGPs) to Exterior Gateway Protocols(EGPs) and to policy-based routing.
A content delivery network (CDN) is an example of adding diversity to anetwork. A CDN bypasses the core of a network, where congestion is most likelyto occur, and directly connects devices or networks lower in the hierarchy (Figure1.12). This provides better, more predictable performance but can also affect thenetwork hierarchy by modifying its routing behavior.
Network
Network Network
Hierarchical networkFlows are forced through hierarchy,
impacting performance
Network
Network
Network
Network Network Network Network
CDN
CDN is added, providing direct connectivity between networks,bypassing hierarchy and providing better performance
Network Network
Network Network
FIGURE 1.12 Diversity Added to a Network

Elsevier US Job code: NAAD Ch01-P370480 3-5-2007 10:03a.m. Page:18 Trim:7.5in×9.25in TS: Integra, India
Font: Bembo & Helvetica Size:11/13pt Margins:Top:4pc Gutter:68pt Width:30pc Depth: 38 lines COP: Facing 1 Color
18 C H A P T E R 1 Introduction
1.4.4 Importance of Network Analysis
The importance of network analysis is emphasized in this book because experiencehas shown that networking personnel find it extremely valuable—once they areconvinced of its importance. Analysis takes work, and when you know that therewill be a payoff, you are more likely to do that work.
In this book you will learn how to gather and analyze network requirementsand traffic flows. Network requirements are requests for capabilities in the network,usually in terms of performance and function, which are necessary for the successof that network. Network requirements can be gathered and/or derived from cus-tomers, applications, and devices. Such requirements are fundamental to a network’sarchitecture and design because they form the basis for customer expectationsand satisfaction. Requirements, in conjunction with measurements on the existingnetwork (if there is one), are used to derive traffic flows (sets of network trafficthat have some common attributes, such as source/destination address, informationtype, routing, or other end-to-end information). Analysis of these flows impartslocation and directional information onto requirements. This is where performancerequirements and architecture start to converge and is often the point in theseprocesses where one can begin to see where “hot spots”—focal points for networkperformance—will appear in the network. As we will see, evaluating security risksis also part of the analysis process.
Results of the analysis process, the requirements and flow specifications, arethen used as input for both network architecture and design. In developing thenetwork architecture, a number of component architectures, targeting particularfunctions of the network, are evaluated. Desired component architectures are thencombined into the reference architecture, which provides a high-level view ofyour network. This high-level view is then physically detailed during the networkdesign process.
Network analysis is important in that it helps us understand the complexityand nuances of each network and the systems they support. Analysis also providesdata upon which various decisions are made, and these data can and should bedocumented as part of an audit trail for the architecture and design processes. Suchdata help ensure that the resulting architecture and design are defensible.
Understanding Network and System ComplexityIn general, networks and the systems they support are becoming increasingly com-plex. Part of this complexity lies in the sophistication of the capabilities providedby that network. Consider, for example, how services can be incorporated intoa current state-of-the-art network. Infrastructure capacity planning, which often

Elsevier US Job code: NAAD Ch01-P370480 3-5-2007 10:03a.m. Page:19 Trim:7.5in×9.25in TS: Integra, India
Font: Bembo & Helvetica Size:11/13pt Margins:Top:4pc Gutter:68pt Width:30pc Depth: 38 lines COP: Facing 1 Color
Overview of Analysis, Architecture, and Design Processes 19
includes traffic over-engineering, may now be expanded to include support fordelay-constrained applications and may contain a variety of capacity and delaycontrol mechanisms, such as traffic shaping, quality of service at multiple levels inthe network, service-level agreements to couple services to customers, and policiesto govern and implement service throughout the network. (Note that quality ofservice refers to determining, setting, and acting on priority levels for traffic flows.A service-level agreement is an informal or formal contract between a provider anduser that defines the terms of the provider’s responsibility to the user and the typeand extent of accountability if those responsibilities are not met. Finally, policiesare high-level statements about how network resources are to be allocated amongusers.) Analysis of these mechanisms—how they work and interoperate—is coveredin detail later in this book.
Network and system complexity is nonlinear. Network optimization mustconsider competing and often conflicting needs. In addition, multiple groups withdiffering ideas and desires (e.g., users, corporate management, network staff) influ-ence the network design. The network is either designed by committee or througha systematic approach that the groups can agree on.
Networks have evolved to incorporate more sophisticated capabilities. Early(first-generation) networks focused on supporting basic connectivity betweendevices and on how to scale networks to support growing numbers of users(e.g., segmenting networks using bridges or routers). Second-generation networksfocused on interoperability to expand the scope and scale of networks to allowconnections among multiple disparate networks. We are currently at the stage innetwork evolution where service delivery is important to the success of users andtheir applications. This stage can be considered the third generation of networking.Figure 1.13 illustrates the various generations of networking and their interactions.
We are beginning to see steps toward next-generation capabilities, such as rudi-mentary decision making within the network. It may be expected that componentsof the network will evolve to become self-configurable and manageable, especiallyfor those networks that must be configured or administered by end users (e.g.,telecommuters, users of mobility/portability services). Indeed, this will becomenecessary as the complexity and performance of networks increase and as servicesoffered by networks become more sophisticated. Grid networks are a clear step inthis direction.
Users, applications, and devices are also evolving more sophisticated capabilities.An example of this is the dynamic between hierarchy and diversity that can beseen in the current Internet. As application and device traffic flows evolve toincorporate information regarding quality, performance, and cost (e.g., real-time

Elsevier US Job code: NAAD Ch01-P370480 3-5-2007 10:03a.m. Page:20 Trim:7.5in×9.25in TS: Integra, India
Font: Bembo & Helvetica Size:11/13pt Margins:Top:4pc Gutter:68pt Width:30pc Depth: 38 lines COP: Facing 1 Color
20 C H A P T E R 1 Introduction
First Generation: Connectivity(Technology Choices, Price)
Second Generation: Interoperability(Flexibility)
Third Generation: Services(Performance, Security, Manageability)
Fourth Generation: RudimentaryDecision-Making Capability
InteractionsInteractions
Com
plex
ity
FIGURE 1.13 Generations of Networking
streaming media), it is expected that these characteristics can be used to ensure pathsthrough the Internet that will support high-performance or high-quality delivery ofsuch traffic. Hierarchy in the Internet often forces traffic flows through nonoptimalpaths, crossing several ASs with differing performance and service characteristics,hindering high-performance, high-quality delivery. Figure 1.14 shows a hierarchyof multiple levels of networks from core (or backbone) network providers to accessnetwork providers. Traffic flows between end users may travel across several levelsof this hierarchy.
…… … … … … … … … … … … … … … …End Users
Core
Access
Non-optimized, FullyHierarchical Path
InternetHierarchy
FIGURE 1.14 Hierarchy and Traffic Flow

Elsevier US Job code: NAAD Ch01-P370480 3-5-2007 10:03a.m. Page:21 Trim:7.5in×9.25in TS: Integra, India
Font: Bembo & Helvetica Size:11/13pt Margins:Top:4pc Gutter:68pt Width:30pc Depth: 38 lines COP: Facing 1 Color
Overview of Analysis, Architecture, and Design Processes 21
Preferred Path
…… … … … … … … … … … … … … … …End Users
Core
Access
Non-optimized, FullyHierarchical Path
InternetHierarchy
FIGURE 1.15 Diversity Added to Improve Performance of Select Traffic Flows
To counteract the impact of hierarchy, diversity can be introduced into theInternet at strategic points, providing shortcuts that bypass parts of the Internet.The result is that, for some select flows, paths are optimized for high-performance,high-quality delivery (Figure 1.15). The dynamic between hierarchy and diversityexists in all networks to some degree, and part of the analysis process is determiningwhere and how to apply it. In Figure 1.15 connections are added between networksat the same level of hierarchy, in essence providing a “shortcut” or “bypass” aroundpart of the Internet, resulting in better performance characteristics. This concept ofadding diversity to improve performance along select paths can be readily appliedto enterprise networks.
Analysis helps us understand how technologies influence networks, users, appli-cations, and devices (and vice versa). This is important for gauging how usersof the network will adapt to the network, which affects the overall life cycle ofthe network. Consider, for example, the evolution of routing protocols, shownin Figure 1.16. Although the Routing Information Protocol (RIP), an InteriorGateway Protocol (IGP) deployed as part of early TCP/IP releases, was simple andeasy to use, its limitations were stressed as networks expanded to accommodatelarger groups of users (workgroups) and even groups of networks (autonomoussystems [ASs]). Routing technology adapted by adding hierarchy to routing, interms of new IGPs such as Open Shortest Path First (OSPF), as well as in devel-opment of Exterior Gateway Protocols (EGPs) such as Border Gateway Protocol(BGP), which can accommodate hierarchy in groups of networks (AS hierarchy).This process continues today as high-level policies are being introduced to control

Elsevier US Job code: NAAD Ch01-P370480 3-5-2007 10:03a.m. Page:22 Trim:7.5in×9.25in TS: Integra, India
Font: Bembo & Helvetica Size:11/13pt Margins:Top:4pc Gutter:68pt Width:30pc Depth: 38 lines COP: Facing 1 Color
22 C H A P T E R 1 Introduction
New TechnologyImplemented
Environment Adaptsto Technology
RIP Developed
RIP Incorporated in TCP/IP
Workgroups Expand
OSPF Developed
OSPF Added
Hierarchy Addedto Environment BGP4 Developed
Policies Developed
BGP4 Added, Confederations
AS Hierarchy New Technology Emerges
FIGURE 1.16 Routing Evolution
routing at a level above IGPs or EGPs, and BGP4 introduces hierarchy throughgrouping BGP4 routers into confederations. We discuss routing protocols in detailin the addressing and routing architecture (see Chapter 6).
Similarly, users, applications, and devices also influence their environment. Asnew, upgraded, or different users, applications, and devices are added to a network,the requirements on that network may change. The analysis process must examinehow high-end computer and applications servers, data storage, analysis and archivalsystems, and specialized environment-specific devices such as PDAs, video cameras,or medical equipment impact the network.
Finally, the analysis process helps us understand the forces and changes at workwithin the system (network and its users, applications, and devices). Networks arehighly dynamic, changing the rest of the system and being changed by the system.Some of the factors leading to change in the system include usage behavior andpatterns; what, how, where, and when each user impacts the system; the emergenceof new capabilities—for example, optical switching, faster central processing units(CPUs), and cheaper memory; and changes in scope and scale of the environment,including consolidation and outsourcing.
Architecture and Design DefensibilityAn important (and often overlooked) part of network analysis is the documentationthat provides information about decision making in the network architecture anddesign processes. During the analysis process we are gathering data that can beused to determine which architectural and design decisions need to be made,details regarding each decision (including reasons for each decision), dependenciesbetween decisions, and any background material used to arrive at these decisions.
Elsevier US Job code: NAAD Ch01-P370480 3-5-2007 10:03a.m. Page:23 Trim:7.5in×9.25in TS: Integra, India
Font: Bembo & Helvetica Size:11/13pt Margins:Top:4pc Gutter:68pt Width:30pc Depth: 38 lines COP: Facing 1 Color
Overview of Analysis, Architecture, and Design Processes 23
Data from network analysis, along with any decisions made during the process,can be documented to form an audit trail, that is, the set of documents, data, anddecisions, for the architecture and design. Audit trails are useful for describing anddefending a particular network architecture or design. An audit trail helps addressquestions such as “Why did you choose that technology?” “Why doesn’t this newnetwork perform as expected?” or “Why did this network cost so much?” Havingdocumented your analysis of the existing network, the problems to be addressed,requirements for the new network, and all decisions made regarding that network,you will be able to answer questions at any time about your new network.
Decisions made regarding the network architecture and design need to bedefensible from several perspectives: technical, in order to be able to addressany technical challenges made against your architecture and design; budgetary, toensure that network costs are within budget or to justify why a budget has beenexceeded; schedule, to ensure that time frames for development, installation, test-ing, and operations are being met; and resources, such as personnel or equipment,to ensure that the customer has everything necessary to build and operate thisnetwork.
An audit trail is also useful as a historical document about the network. Overtime, after the network is made operational, new network personnel can reviewthis document to understand the logic behind the way the network was designed.Ideally, this document should be periodically reviewed, with new informationadded regarding changes to the network. Thus, an audit trail becomes a history forthat network.
Experience shows that the set of documents, data, and decisions in an audittrail can be vital in making day-to-day tactical design decisions throughout theproject. The investment in time at this phase of the project can save large amountsof time and resources later in the project.
The Web is a great tool to use in building an audit trail. Because an audittrail contains information about the old network, the new network, and decisionsmade about the new network, having this information easily accessible by thosewho use the network makes a lot of sense. Putting such information on internalWeb pages allows easy access by everyone, and changes or additions to the audittrail can be seen immediately. Although there may be some information that yourcustomer might not want everyone to view, such as the results of a risk analysis,most information usually can be accessible to everyone. For information that isrestricted (need-to-know), hidden and password-protected Web pages can be used.Of course, when putting sensitive information at a common location, such as aWeb site, sufficient security from outside attacks (hackers) should be provided.

Elsevier US Job code: NAAD Ch01-P370480 3-5-2007 10:03a.m. Page:24 Trim:7.5in×9.25in TS: Integra, India
Font: Bembo & Helvetica Size:11/13pt Margins:Top:4pc Gutter:68pt Width:30pc Depth: 38 lines COP: Facing 1 Color
24 C H A P T E R 1 Introduction
An audit trail can be developed using standard word processing and spreadsheetsoftware tools, and software tools specialized for this purpose are available. Problemstatements, objectives, requirements, decisions, and all background data are enteredinto the audit trail, and all information is time stamped. Examples of audit trailinformation are presented later in this book.
1.4.5 Model for Network Analysis, Architecture,and Design
Networking traditionally has had little or no basis in analysis or architectural devel-opment, with designers often relying on technologies that are either most familiarto them or that are new, popular, or suggested by vendors and/or consultants.There are serious problems with this traditional approach. In particular, decisionsmay be made without the due diligence of analysis or architectural development,and such decisions, especially those made during the early phases of the project,are uninformed.
As a result, there may not be an audit trail for the architecture and design;and therefore, the architecture and design may not be defensible. In addition,such an architecture/design may lack consistency in its technological approach.Lacking data from analysis and architecture, we may not have a basis for makingtechnology comparisons and trade-offs. And most importantly, without the properrequirements gathering and analysis, we cannot be sure if our network will meetthe needs of its users. Therefore, network analysis, architecture, and design arefundamental to the development of a network.
Network analysis, architecture, and design are similar to other engineeringprocesses in that they address the following areas:
• Defining the problems to be addressed• Establishing and managing customer expectations• Monitoring the existing network, system, and its environment• Analyzing data• Developing a set of options to solve problems• Evaluating and optimizing options based on various trade-offs• Selecting one or more options• Planning the implementation

Elsevier US Job code: NAAD Ch01-P370480 3-5-2007 10:03a.m. Page:25 Trim:7.5in×9.25in TS: Integra, India
Font: Bembo & Helvetica Size:11/13pt Margins:Top:4pc Gutter:68pt Width:30pc Depth: 38 lines COP: Facing 1 Color
Overview of Analysis, Architecture, and Design Processes 25
Defining the problems to be addressed should entail a quick evaluation of theenvironment and project—in essence performing a sanity check on the task at hand,as well as determining the size and scope of the problems, determining that you areworking on the right problems, and checking the levels of difficulty anticipated inthe technologies, potential architectures and designs, administration, management,and politics in that environment. As you size up the problems faced in this project,you should begin to estimate the level of resources needed (e.g., budget, schedule,personnel). You should also develop your own view of the problems affectingthat environment. You may find that, from your analysis of the situation, yourdefinition of the problems may differ from the customer’s definition. Dependingon how far apart your definitions are, you may need to adjust your customer’sexpectations about the project.
Example 1.5.
Once, in performing an analysis on a customer’s metropolitan-area network (MAN), Irealized that the problem was not what the customers thought. They thought that thetechnology chosen at that time, switched multimegabit data service (SMDS), and the routingprotocol (OSPF) were not working properly together. However, the problem actually wasthat the network personnel had forgotten to connect any of their LANs to the MAN. Ofcourse, when they ran tests from one LAN to another, no data were being passed. It wasan easy problem to fix, but a lot of work was spent changing the customer’s view on theproblem and expectations of what needed to be done. The customer originally wantedto change vendors for the routing equipment and replace the SMDS service. Eventually,they were convinced that the equipment and service were fine and that the problem wasinternal to the organization.
Although SMDS is not widely available anymore, its behavior as a non-broadcastmultiple-access (NBMA) technology is similar to other currently available technologies.
An early part of every project is determining what your customer’s expectationsare and adjusting these expectations accordingly. The idea here is not to givecustomers false expectations or to let them have unrealistic expectations, becausethis will lead to difficulties later in the project. Instead, the goal is to provide anaccurate and realistic view of the technical problems in the network and whatit will take to solve them. Customers’ expectations will likely focus on budget,schedule, and personnel but may also include their opinions about technologiesand methodologies. And, at times, politics become embedded within the projectand must be dealt with. The key here is to separate technical from nontechnicalissues and to focus on technical and resource issues.

Elsevier US Job code: NAAD Ch01-P370480 3-5-2007 10:03a.m. Page:26 Trim:7.5in×9.25in TS: Integra, India
Font: Bembo & Helvetica Size:11/13pt Margins:Top:4pc Gutter:68pt Width:30pc Depth: 38 lines COP: Facing 1 Color
26 C H A P T E R 1 Introduction
Part of determining customers’ expectations means understanding whatcustomers want to do with their network. This may involve understanding the cus-tomer’s business model and operations. In addition, the customer may expect to havesignificant input into the development of the network. As you set the customer’sexpectations, you may need to establish the lines of communication between thenetwork architecture/design group, management, users, and network staff.
Having established what the customer’s expectations are, you may need toadjust and manage these expectations. This can be done by identifying trade-offs andoptions for resources, technologies, architectures, and designs and then presentingand discussing trade-offs and options with your customer. Bringing customers intothe process and working with them to make critical decisions about the networkwill help them become comfortable with the process.
If an existing network is part of this project, monitoring this network, as wellas other parts of the system and its environment, can provide valuable informationabout the current behavior of users, applications, and devices and their requirementsfor the new network. Monitoring can also validate your and your customer’sdefinitions of the problems with the existing network. When it is possible tomonitor the network, you will need to determine what data you want to collect(based on what you want to accomplish with the data), any strategic places in thenetwork where you want to collect this data, and the frequency and duration ofdata collection.
At this point in the process you should have several sets of information withwhich you can begin your network analysis. You may have historical data fromnetwork management; data captured during monitoring; requirements gatheredfrom users, staff, and management; the customer’s definition of the problem; andyour definition. All of these data are used in the network analysis, of which thereare three parts: requirements or needs analysis, flow analysis, and a risk (security)analysis. Information in these analyses can be placed on the customer’s internalWeb page, as mentioned earlier, although some information (e.g., the results ofthe risk analysis) may have to be kept private.
Results of the network analysis are used in the architecture and design processes,where sets of options are developed, including potential architectures, designs,topologies, technologies, hardware, software, protocols, and services.
These sets of options are then evaluated to determine the optimal solutions forthe problems. Criteria need to be developed throughout the analysis, architecture,and design processes in order to evaluate these options. Along with these criteria,you will use the results of the network analysis, including requirements, trade-offs,and dependencies between options.

Elsevier US Job code: NAAD Ch01-P370480 3-5-2007 10:03a.m. Page:27 Trim:7.5in×9.25in TS: Integra, India
Font: Bembo & Helvetica Size:11/13pt Margins:Top:4pc Gutter:68pt Width:30pc Depth: 38 lines COP: Facing 1 Color
A Systems Methodology 27
Having selected one or more options, you can complete the network architec-ture and design and prepare for implementation. At this point you may considerdeveloping a project plan to determine schedule, budget, and resources, as well asmajor and minor milestones, checkpoints, and reviews.
1.5 A Systems MethodologyWe begin the network analysis process with a discussion of the systems methodologyapproach to networking. Applying a systems methodology to network analysis,architecture, and design is a relatively new approach, particularly in the InternetProtocol (IP) world. Systems methodology (as applied to networking) means viewingthe network that you are architecting and designing, along with a subset of itsenvironment (everything that the network interacts with or impacts), as a system.Associated with this system are sets of services (levels of performance and function)that are offered by the network to the rest of the system. This approach considersthe network as part of a larger system, with interactions and dependencies betweenthe network and its users, applications, and devices. As you will see, the systemsmethodology reveals interesting concepts which are used throughout this book.
One of the fundamental concepts of the systems methodology is that networkarchitectures and designs take into account the services that each network will pro-vide and support. This reflects the growing sophistication of networks, which haveevolved from providing basic connectivity and packet-forwarding performance tobeing a platform for various services. As discussed earlier, we are currently at thestage in network evolution where services are important to the success of manynetworks (third-generation networks). Some examples of third-generation net-works are service-provider networks that support multiple levels of performanceand pricing to their customers, content-distribution networks that specialize inhigh-performance transport, and enterprise networks that incorporate and applybilling and usage models to their customers.
When a network is viewed as part of a system that provides services, the systemsmethodology works quite well for a variety of networks, from small and simpleto large, complex networks. It helps in determining, defining, and describing theimportant characteristics and capabilities of your network.
1.6 System DescriptionA system is a set of components that work together to support or provide connec-tivity, communications, and services to users of the system. Generically speaking,

Elsevier US Job code: NAAD Ch01-P370480 3-5-2007 10:03a.m. Page:28 Trim:7.5in×9.25in TS: Integra, India
Font: Bembo & Helvetica Size:11/13pt Margins:Top:4pc Gutter:68pt Width:30pc Depth: 38 lines COP: Facing 1 Color
28 C H A P T E R 1 Introduction
Network
User
Application
Device
User
Application
Device
FIGURE 1.17 Generic Components of a System
components of the system include users, applications, devices, and networks.Although users of the system can be considered to be outside the system, they alsohave requirements that include them as part of the system. Throughout this bookwe include users as part of the system. Figure 1.17 shows how these componentsare connected within the system.
Figure 1.17 shows the generic components of a system. These components canbe subdivided, if necessary, to focus on a particular part of the system. For example,users in a corporate network could be further described as network and computersupport personnel, as well as developers and customers of that corporation’s product.In a similar sense, applications may be specific to a particular user, customer orgroup, generic to a customer base, or generic across the entire network.
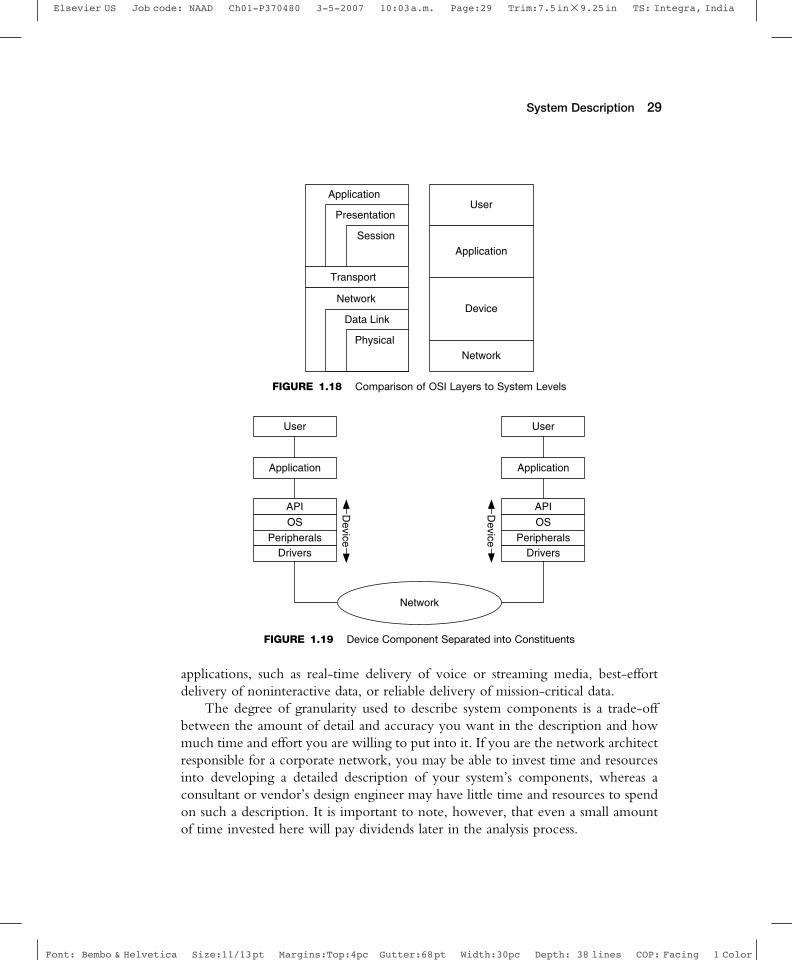
If we were to compare this view of a system with the open system interconnect(OSI) protocol model, it would look like Figure 1.18. Note that, in this comparison,some of the OSI layers are modified. This is to show that there may be multipleprotocol layers operating at one of the system levels. For example, the OSI physical,data link, and network layers may be present at the device level and may also bepresent multiple times at the network level (e.g., at switches and routers throughoutthe network).
Figure 1.19 shows that devices can be subdivided by class to show specializedfunctions, such as storage, computing, or application servers, or an individual devicemay be subdivided to show its operating system (OS), device drivers, peripheralhardware, or application programming interface (API).
All of these components work together to provide connectivity and commu-nications across the network, among users, applications, and devices. The connec-tivity and communications can be tailored to meet the specific needs of users and
Elsevier US Job code: NAAD Ch01-P370480 3-5-2007 10:03a.m. Page:29 Trim:7.5in×9.25in TS: Integra, India
Font: Bembo & Helvetica Size:11/13pt Margins:Top:4pc Gutter:68pt Width:30pc Depth: 38 lines COP: Facing 1 Color
System Description 29
Transport
User
Application
Device
Network
Network
Data Link
Physical
Application
Presentation
Session
FIGURE 1.18 Comparison of OSI Layers to System Levels
Network
User
Application
User
Application
API
OS
PeripheralsDrivers
API
OS
PeripheralsDrivers
Device
Device
FIGURE 1.19 Device Component Separated into Constituents
applications, such as real-time delivery of voice or streaming media, best-effortdelivery of noninteractive data, or reliable delivery of mission-critical data.
The degree of granularity used to describe system components is a trade-offbetween the amount of detail and accuracy you want in the description and howmuch time and effort you are willing to put into it. If you are the network architectresponsible for a corporate network, you may be able to invest time and resourcesinto developing a detailed description of your system’s components, whereas aconsultant or vendor’s design engineer may have little time and resources to spendon such a description. It is important to note, however, that even a small amountof time invested here will pay dividends later in the analysis process.

Elsevier US Job code: NAAD Ch01-P370480 3-5-2007 10:03a.m. Page:30 Trim:7.5in×9.25in TS: Integra, India
Font: Bembo & Helvetica Size:11/13pt Margins:Top:4pc Gutter:68pt Width:30pc Depth: 38 lines COP: Facing 1 Color
30 C H A P T E R 1 Introduction
Network
Device Device
FIGURE 1.20 Traditional View of a System
The traditional view of a system focused on the network providing connec-tivity between devices (Figure 1.20) and typically did not consider the users orapplications.
This traditional view of a system is not complete enough for today’s net-works. In particular, we need to include users and their applications in the systemdescription. Experience shows that this degree of descriptiveness in the set (users,applications, devices, and networks) is usually sufficient to provide a complete andaccurate description of most general-access systems, yet not so large as to be over-whelming to the network architect. (General-access is a term to describe commonaccess of users to applications, computing, and storage resources across a network.)Within this set, users represent the end users, or customers, of the system. Theseend users are the final recipients of the network services supported by the system.
One reason for identifying components of the system is to understand howthese components interface with one another across component boundaries. Bydefining what the components of the system are, we are also setting what isto be expected across each interface. For example, using the standard set (users,applications, devices, and networks), Figure 1.21 shows potential interfaces.
Network
User
Application
Device
User
Application
Device
User–Application Interface(Displays, UI)
Application–Device Interface(API, QoS)
Device–Network Interface(Device Drivers)
FIGURE 1.21 A Generic System with Interfaces Added

Elsevier US Job code: NAAD Ch01-P370480 3-5-2007 10:03a.m. Page:31 Trim:7.5in×9.25in TS: Integra, India
Font: Bembo & Helvetica Size:11/13pt Margins:Top:4pc Gutter:68pt Width:30pc Depth: 38 lines COP: Facing 1 Color
Service Description 31
Although the description of the system given in Figure 1.21 is usually satis-factory for the start of most network architectures, there may be times when youwant to describe more components or have more defined interfaces. For example,the device-network interface may be simple or complex, depending on what youare trying to accomplish. For a network that will be providing simple connectivity,the network-device interface may be a standard LAN interface (e.g., 100BaseTEthernet) without any prioritization or virtual LAN (VLAN 802.1p/q) tagging. Fora network that provides more than simple connectivity, such as quality of service,the device-network interface may be more closely coupled with the device orapplication. This may be accomplished by using drivers that bypass portions of theprotocol stack and APIs that can interpret application performance requirements.
Although the system description is an attempt to identify components acrossthe entire system, we need to recognize that most systems are not completelyhomogeneous and that components may change in various parts of the system.This usually occurs in parts of the system that perform specific functions, suchas a device-specific network (e.g., a video distribution network) or a storage-areanetwork (SAN). For example, although an SAN may be described as the set (users,applications, devices, and networks), users may be other devices in the system, andthe only application may be for system storage and archival.
1.7 Service DescriptionThe concept of network services in this book builds upon the services work fromthe Internet Engineering Task Force (IETF). This organization has been developingservice descriptions for IP networks. In general, they see network services as sets ofnetwork capabilities that can be configured and managed within the network andbetween networks. We apply this concept to network analysis, architecture, anddesign, integrating services throughout the entire system. This will help you takeadvantage of the services concept by analyzing, architecting, and designing basedon services, and it will also prepare you for the near future, when services will beconfigurable and manageable within the network.
Network services, or services, are defined here as levels of performance andfunction in the network. We can look at this from two perspectives: as servicesbeing offered by the network to the rest of the system (the devices, applications,and users) or as sets of requirements from the network that are expected bythe users, applications, or devices. Levels of performance are described by theperformance characteristics capacity, delay, and RMA (reliability, maintainability,
Elsevier US Job code: NAAD Ch01-P370480 3-5-2007 10:03a.m. Page:32 Trim:7.5in×9.25in TS: Integra, India
Font: Bembo & Helvetica Size:11/13pt Margins:Top:4pc Gutter:68pt Width:30pc Depth: 38 lines COP: Facing 1 Color
32 C H A P T E R 1 Introduction
and availability), whereas functions are described as security, accounting, billing,scheduling, and management (and others). This is described in more detail in thenext section.
It is important to note that the concept of services used in this book is basedon what networks can deliver to the system. Thus, it is not to be confused withservices that other parts of the system (e.g., applications) can deliver to each other(e.g., graphics rendering services). When the term service is used in this book, it isin reference to network service.
Network services in most of today’s networks are based on best-effort (unpre-dictable and unreliable) delivery. In addition to best-effort delivery, we examinesome new types of services, including high-performance, predictable (stochastic orprobabilistic), and guaranteed services. These new services require some differentways of looking at networks, and you will see how to incorporate such servicesinto your architecture and design. We also look at single-tier and multiple-tierperformance in the network, and show how to distinguish between them and howthey relate to best-effort, predictable, and guaranteed services.
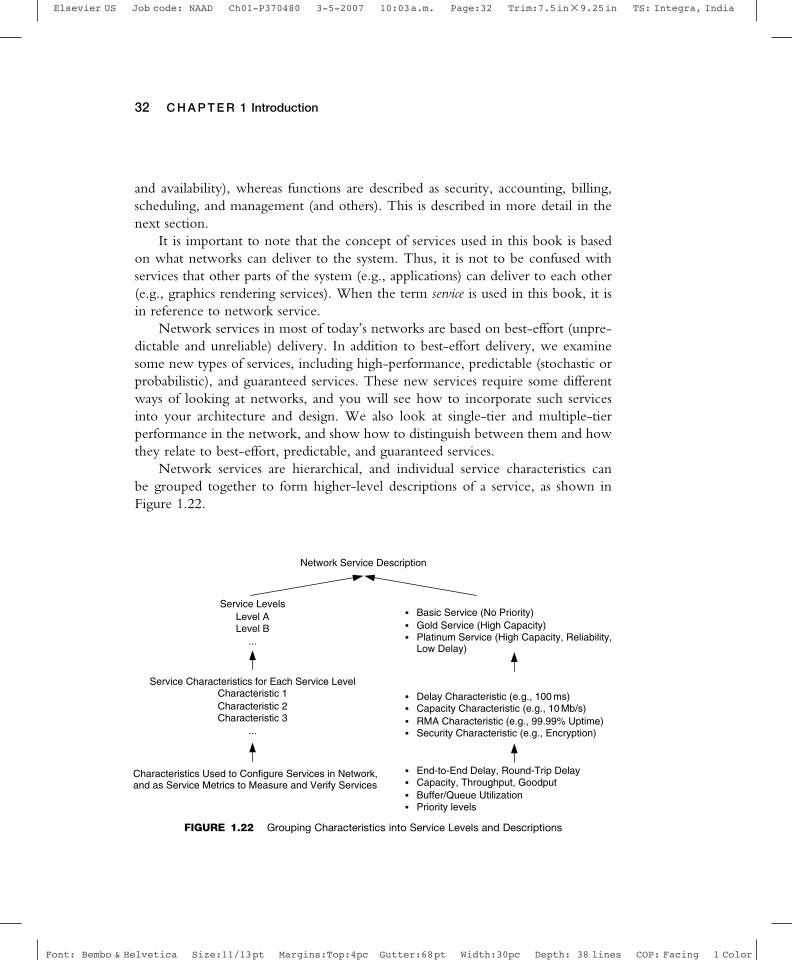
Network services are hierarchical, and individual service characteristics canbe grouped together to form higher-level descriptions of a service, as shown inFigure 1.22.
Characteristics Used to Configure Services in Network,and as Service Metrics to Measure and Verify Services
Service Characteristics for Each Service LevelCharacteristic 1Characteristic 2Characteristic 3
...
Service LevelsLevel ALevel B
...
Network Service Description
End-to-End Delay, Round-Trip DelayCapacity, Throughput, GoodputBuffer/Queue UtilizationPriority levels
Delay Characteristic (e.g., 100 ms)Capacity Characteristic (e.g., 10 Mb/s)RMA Characteristic (e.g., 99.99% Uptime)Security Characteristic (e.g., Encryption)
Basic Service (No Priority)Gold Service (High Capacity)Platinum Service (High Capacity, Reliability,Low Delay)
FIGURE 1.22 Grouping Characteristics into Service Levels and Descriptions
Elsevier US Job code: NAAD Ch01-P370480 3-5-2007 10:03a.m. Page:33 Trim:7.5in×9.25in TS: Integra, India
Font: Bembo & Helvetica Size:11/13pt Margins:Top:4pc Gutter:68pt Width:30pc Depth: 38 lines COP: Facing 1 Color
Service Characteristics 33
1.8 Service CharacteristicsOne of the goals of network analysis is to be able to characterize services sothat they can be designed into the network and purchased from vendors and ser-vice providers (e.g., via requests for information [RFI], quote [RFQ], or proposal[RFP], documents used in the procurement process). Service characteristics are indi-vidual network performance and functional parameters that are used to describeservices. These services are offered by the network to the system (the service offering)or are requested from the network by users, applications, or devices (the servicerequest). Characteristics of services that are requested from the network can also beconsidered requirements for that network.
Examples of service characteristics range from estimates of capacity require-ments based on anecdotal or qualitative information about the network to elaboratelistings of various capacity, delay, and RMA requirements, per user, application,and/or device, along with requirements for security, manageability, usability, flex-ibility, and others.
Example 1.6.
Examples of service characteristics are:• Defining a security or privacy level for a group of users or an organization• Providing 1.5 Mb/s peak capacity to a remote user• Guaranteeing a maximum round-trip delay of 100 ms to servers in a server farm
Such requirements are useful in determining the need of the system for services,in providing input to the network architecture and design, and in configuringservices in network devices (e.g., routers, switches, device operating systems).Measurements of these characteristics in the network to monitor, verify, and manageservices are called service metrics. In this book we focus on developing servicerequirements for the network and using those characteristics to configure, monitor,and verify services within the network.
For services to be useful and effective, they must be described and provisionedend-to-end at all network components between well-defined demarcation points.“End-to-end” does not necessarily mean only from one user’s device to anotheruser’s device. It may be defined between networks, from users to servers, or betweenspecialized devices (Figure 1.23). When services are not provisioned end-to-end,some components may not be capable of supporting them, and thus the services

Elsevier US Job code: NAAD Ch01-P370480 3-5-2007 10:03a.m. Page:34 Trim:7.5in×9.25in TS: Integra, India
Font: Bembo & Helvetica Size:11/13pt Margins:Top:4pc Gutter:68pt Width:30pc Depth: 38 lines COP: Facing 1 Color
34 C H A P T E R 1 Introduction
User PC Server
User PC User PC
Server NetworkU
ser–Server
User–Server or LAN–LAN
LAN–WAN
IP Router
WAN
WAN Service
EthernetSwitch
FIGURE 1.23 Example Demarcations Points to Describe End-to-End within a Network
will fail. The demarcation points determine where end-to-end is in the network.Determining these demarcation points is an important part of describing a service.
Services also need to be configurable, measurable, and verifiable within the sys-tem. This is necessary to ensure that end users, applications, and devices are gettingthe services they have requested (and possibly have been paying for), and this leads toaccounting and billing for system (including network) resources. You will see howservice metrics can be used to measure and verify services and their characteristics.
Services are also likely to be hierarchical within the system, with differentservice types and mechanisms applied at each layer in the hierarchy. For example,Figure 1.24 shows a quality-of-service (QoS) hierarchy that focuses on bulk traffic
Access Network
User PC User PC
...
Access Network
User PC User PC
...
Bulk Transport of Traffic,QoS Service Is
Generalized
Traffic Is Generated/Terminated Here, QoS
Service Is Specific
NetworkHierarchy
Core Network
Traffic Is Generated/Terminated Here, QoS
Service Is Specific
FIGURE 1.24 An Example of Service Hierarchy within a Network
Elsevier US Job code: NAAD Ch01-P370480 3-5-2007 10:03a.m. Page:35 Trim:7.5in×9.25in TS: Integra, India
Font: Bembo & Helvetica Size:11/13pt Margins:Top:4pc Gutter:68pt Width:30pc Depth: 38 lines COP: Facing 1 Color
Service Characteristics 35
transport in the core of the network while placing specific services at the accessnetwork close to the end users, applications, and devices.
1.8.1 Service Levels
Service characteristics can be grouped together to form one or more service levelsfor the network. This is done to make service provisioning easier in that you canconfigure, manage, account, and bill for a group of service characteristics (servicelevel) instead of a number of individual characteristics. For example, a service level(e.g., premium) may combine capacity (e.g., 1.5 Mb/s) and reliability (as 99.99%uptime). Service levels are also helpful in billing and accounting. This is a service-provider view of the network, where services are offered to customers (users) fora fee. This view of networking is becoming more popular in enterprise networks,displacing the view of networks as purely the infrastructure of cost centers.
There are many ways to describe service levels, including frame relay committedinformation rates (CIRs), which are levels of capacity; classes of service (CoSs),which combine delay and capacity characteristics; and IP types of service (ToSs) andqualities of service (QoSs), which prioritize traffic for traffic conditioning functions,which are described in the performance architecture (see Chapter 8). There canalso be combinations of the aforementioned mechanisms, as well as custom servicelevels, based on groups of individual service characteristics. These combinationsdepend on which network technology, protocol, mechanism, or combination isproviding the service.
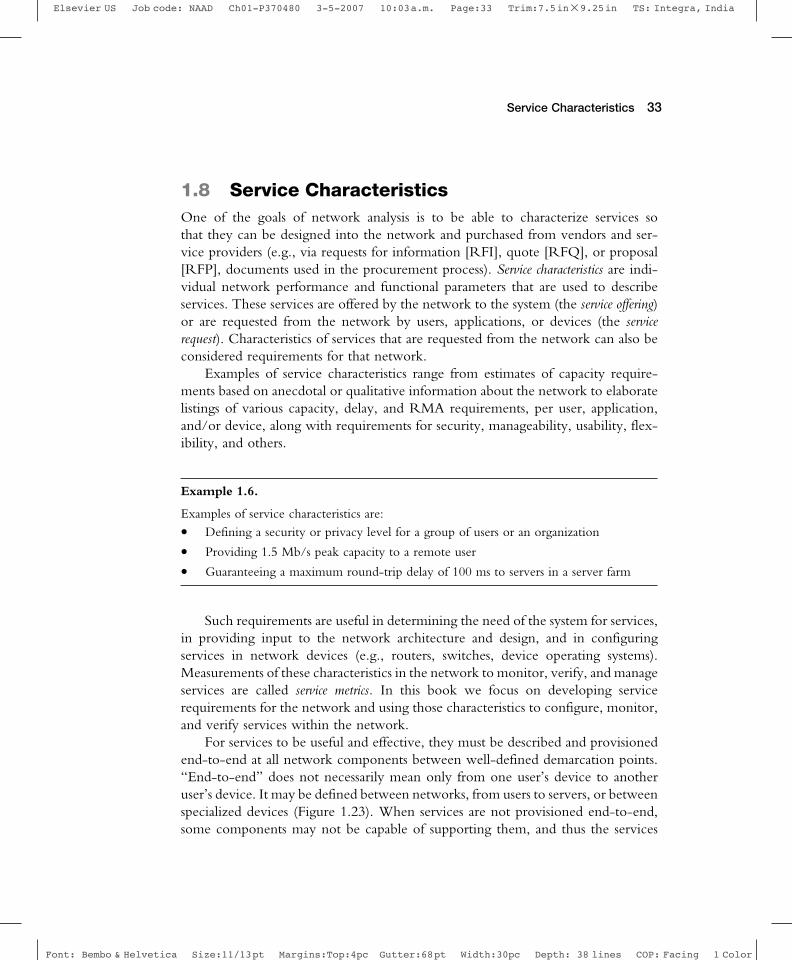
In Figure 1.25 service offerings, requests, and metrics are shown applied tothe system. In this example a demarcation of services is shown between the deviceand network components. Depending on the service requirement or characteristic,however, demarcation may also be between the device and application components.
Network
User
Application
Device
User
Application
DeviceService MetricsService Request/
Requirement
Service Offering
FIGURE 1.25 Service Requests, Offerings, and Metrics

Elsevier US Job code: NAAD Ch01-P370480 3-5-2007 10:03a.m. Page:36 Trim:7.5in×9.25in TS: Integra, India
Font: Bembo & Helvetica Size:11/13pt Margins:Top:4pc Gutter:68pt Width:30pc Depth: 38 lines COP: Facing 1 Color
36 C H A P T E R 1 Introduction
Example 1.7.
A request came from a customer that each building should have Fast Ethernet (FE) capacityto the rest of the network. As part of the requirements analysis, this request became arequirement for 100 Mb/s peak capacity from the users in each building. This service requestwas then matched in the requirements and design processes by a technology choice thatcould meet or exceed the request. In this case FE was chosen as the technology, and theservice offering was 100 Mb/s to each building. Service metrics were then added, consistingof measuring the FE connections from the IP switch or router at each building to thebackbone.
Services and service levels can be distinguished by their degrees of predictabilityor determinism. In the next section we discuss best-effort delivery, which is notpredictable or deterministic, as well as predictable and guaranteed services. Servicesand service levels are also distinguished by their degrees of performance. You willsee how the service performance characteristics capacity, delay, and RMA are usedto describe services and service levels.
1.8.2 System Components and Network Services
Network services are derived from requirements at each of the components inthe system. They are end-to-end (between end points that you define) within thesystem, describing what is expected at each component. Service requirements forthe network we are building are derived from each component. There can beuser requirements, application requirements, device requirements, and (existing)network requirements. Because we are building the network component, anyrequirements from the network component come from existing networks that thenew network will incorporate or connect to.
Component requirements are added one to another, being refined andexpanded as the network comes closer to being realized. User requirements, whichare the most subjective and general, are refined and expanded by requirementsfrom the application component, which are in turn refined and expanded by thedevice and network components. Thus, requirements filter down from user toapplication to device to network, resulting in a set of specific requirements thatcan be configured and managed in the network devices themselves. This resultsin a service offering that is end-to-end, consisting of service characteristics thatare configured in each network device in the path (e.g., routers, switches, hubs).As in Figure 1.26, service characteristics are configured and managed within each

Elsevier US Job code: NAAD Ch01-P370480 3-5-2007 10:03a.m. Page:37 Trim:7.5in×9.25in TS: Integra, India
Font: Bembo & Helvetica Size:11/13pt Margins:Top:4pc Gutter:68pt Width:30pc Depth: 38 lines COP: Facing 1 Color
Service Characteristics 37
RouterSwitch
User
Application
Device
User Requirements(e.g., Interaction Delay)
Application Requirements(e.g., Application Processing Delay)
Device Requirements(e.g., Maximum End-to-End Delay)
Network Requirements(e.g., Maximum End-to-End Delay)
Network Element Requirements(e.g., Buffer Sizes or Priorities)
Server
Network
FIGURE 1.26 Requirements Flow Down Components, from User to Network
element and at interfaces between elements. These services are the most specific ofall and have the smallest scope (typically a single network device).
Defining network services and service metrics helps keep the system functioningand can provide extra value or convenience to users and their applications. Bydefining service metrics we are determining what we will be measuring in thenetwork, which will help us in network monitoring and management.
Recall that network services are sets of performance and function, so require-ments may also include functions of one of the components. Examples of functionsinclude network monitoring and management, security, and accounting. Servicessuch as these must be considered an integral part of the network architecture anddesign. In this book, security (and privacy) and network management each havetheir own architectures. This may seem obvious, but traditionally, services suchas security and network management have been afterthoughts in architecture anddesign, often completely forgotten in the architecture until problems arise.
Example 1.8.
The network path shown in Figure 1.27 was designed to optimize performance betweenusers and their servers. The graph at the bottom of the figure is an estimate of the expectedaggregate capacity at each segment of the path. In this network a packet over SONET(POS) link at the OC-48 level (2.544 Gb/s) connects two routers, which then connect toGigabit Ethernet (GigE) switches.

Elsevier US Job code: NAAD Ch01-P370480 3-5-2007 10:03a.m. Page:38 Trim:7.5in×9.25in TS: Integra, India
Font: Bembo & Helvetica Size:11/13pt Margins:Top:4pc Gutter:68pt Width:30pc Depth: 38 lines COP: Facing 1 Color
38 C H A P T E R 1 Introduction
GigESwitch
GigESwitch
Servers(4)
Router
POS/OC-48
User PCs(100)
GigE OC-48 FE
Pot
entia
l Agg
rega
teC
apac
ity (
Gb/
s)
1
10
0.1
Distance along Transmission Path
GigE OC-48 GigE
Router
FIGURE 1.27 The Capacity at Each Point in the Transmission Path before the Addition of a SecurityFirewall
After it was implemented, a security firewall was added at the users’ LAN (with FEinterfaces), without it being considered part of the original analysis, architecture, or design.The result was that the firewall changed the capacity characteristics across the path byreducing throughput between the user PCs and the GigE switch, as shown in Figure 1.28.
GigESwitch
GigESwitch
Servers(4)
POS/OC-48
User PCs(100)
GigE FE
Distance along Transmission Path
SecurityFirewall
FE
FESwitch
OC-48GigE OC-48 GigE FE
Pot
entia
l Agg
rega
teC
apac
ity (
Gb/
s)
1
10
0.1
Router Router
FIGURE 1.28 The Capacity at Each Point in the Transmission Path after the Addition of a SecurityFirewall
One of our architectural and design goals is to identify such performancebottlenecks before the network is implemented. By considering security, networkmanagement, services, and routing and addressing in the analysis process, we are

Elsevier US Job code: NAAD Ch01-P370480 3-5-2007 10:03a.m. Page:39 Trim:7.5in×9.25in TS: Integra, India
Font: Bembo & Helvetica Size:11/13pt Margins:Top:4pc Gutter:68pt Width:30pc Depth: 38 lines COP: Facing 1 Color
Service Characteristics 39
much more likely to understand their behavior and effect on each other and thenetwork. We are therefore able to architect the network to accommodate theirrequirements and interoperability.
When service characteristics apply to individual network devices, such asrouters, switches, data service units (DSUs), and so on, some of these characteristicsmay be vendor specific. In this book we focus on those characteristics that are partof public standards and not vendor specific.
It is important to note that although standards-based characteristics are “stan-dardized” on the basis of having their descriptions publicly available (e.g., via anIETF RFC), sanctioned by an organization recognized by the networking com-munity, or generally accepted and used as a de facto standard, the implementation ofcharacteristics is open to interpretation and often varies across vendors and vendorplatforms.
1.8.3 Service Requests and Requirements
Service requests and requirements are, in part, distinguished by the degree ofpredictability needed from the service by the user, application, or device makingthe request. Based on their predictability, service requests are categorized as besteffort, predictable, or guaranteed. Service requests and requirements can also beappropriate for single- or multiple-tier performance for a network.
Best-effort service means that there is no control over how the network willsatisfy the service request—that there are no guarantees associated with this service.Such requests indicate that the rest of the system (users, applications, and devices)will need to adapt to the state of the network at any given time. Thus, the expectedservice for such requests will be both unpredictable and unreliable, with variableperformance across a range of values (from the network being unavailable to thelowest common denominator of performance across all of the technologies inthe end-to-end path). Such service requests either have no specific performancerequirements for the network or are based solely on estimates of capacity. Whenrequirements are nonspecific, network performance cannot be tuned to satisfy anyparticular user, application, or device requirement.
Guaranteed service is the opposite of best-effort service. Where best-effort serviceis unpredictable and unreliable, guaranteed service must be predictable and reliableto such a degree that, when service is not available, the system is held accountable.A guaranteed service implies a contract between the user and provider. For periodswhen the contract is broken (e.g., when the service is not available), the providermust account for the loss of service and, possibly, appropriately compensate the user.

Elsevier US Job code: NAAD Ch01-P370480 3-5-2007 10:03a.m. Page:40 Trim:7.5in×9.25in TS: Integra, India
Font: Bembo & Helvetica Size:11/13pt Margins:Top:4pc Gutter:68pt Width:30pc Depth: 38 lines COP: Facing 1 Color
40 C H A P T E R 1 Introduction
With best-effort and guaranteed services at opposite ends of the service spec-trum, many services fall somewhere between. These are predictable services, whichrequire some degree of predictability (more than best effort) yet do not require theaccountability of a guaranteed service.
Predictable and guaranteed service requests are based on some a priori knowl-edge of and control over the state of the system. Such requests may require thatthe service either operates predictably or is bounded. Therefore, such services musthave a clear set of requirements. For the network to provision resources to supporta predictable or guaranteed service, the service requirements of that request must beconfigurable, measurable, and verifiable. This is where service requests, offerings,and metrics are applied.
Note that there are times when a service can be best effort, predictable,or guaranteed, depending on how it is interpreted. Therefore, it is importantto understand the need for a good set of requirements because these will helpdetermine the types of services to plan for. Also, although the term predictable liesin a gray area between best effort and guaranteed, it is the type of service mostlikely to be served by most performance mechanisms, as we see in Chapter 8.
For example, suppose a device requires capacity (bandwidth) between 4 and10 Mb/s. There must be a way to communicate this request across the network, away to measure and/or derive the level of resources needed to support this request,a way to determine whether the required resources are available, and a method tocontrol the information flow and network resources to keep this service between4 and 10 Mb/s.
Capacity (or bandwidth) is a finite resource within a network. For example,the performance of a 100 Mb/s FE connection between two routers is boundedby that technology. If we were to look at the traffic flows across that 100 Mb/sconnection, we would see that, for a common best-effort service, capacity wouldbe distributed across all of the traffic flows. As more flows were added to thatconnection, the resources would be spread out until, at some point, congestionoccurs. Congestion would disrupt the traffic flows across that connection, affectingthe protocols and applications for each flow. What is key here is that, in terms ofresource allocation, all traffic flows have some access to resources.
This is shown in Figure 1.29. In this figure available capacity (dashed curve)decreases as the number of traffic flows increases. Correspondingly, the loading onthe network (solid curve) from all of the traffic flows increases. However, at somepoint congestion affects the amount of user traffic being carried by the connection,and throughput of the connection (heavy curve) drops. As congestion interfereswith the end-to-end transport of traffic, some protocols (e.g., TCP) will retransmit

Elsevier US Job code: NAAD Ch01-P370480 3-5-2007 10:03a.m. Page:41 Trim:7.5in×9.25in TS: Integra, India
Font: Bembo & Helvetica Size:11/13pt Margins:Top:4pc Gutter:68pt Width:30pc Depth: 38 lines COP: Facing 1 Color
Service Characteristics 41
Cap
acity
of F
ast E
ther
net C
onne
ctio
n(M
b/s)
50
Number of Concurrent Traffic Flows
100
0
ResourceLoading
CapacityAvailable
Throughput
Congestion Beginsto Load Network
FIGURE 1.29 The Performance of a Fast Ethernet Connection under Best-Effort Conditions
traffic. The difference between the loading and the throughput curves is due toretransmissions. This is undesirable, for while the connection is being loaded, onlya percentage of that loading are successfully delivered to destinations. At some pointall of the traffic on that connection could be due to retransmissions and throughputwould approach zero. This approach is used in best-effort networks.
In contrast, consider a traditional telephony network. Calls are made on thisnetwork, and resources are allocated to each call. As more calls are added to thenetwork, at the point where all of the resources have been allocated, additionalcalls are refused. The exiting calls on the network may suffer no performancedegradation, but no new calls are allowed until resources are available. Call admissioncontrol (CAC) is a mechanism to limit the number of calls on a network, therebycontrolling the allocation of resources.
This is shown in Figure 1.30. Individual calls are shown in this figure, and eachcall is 10 Mb/s for simplicity. As each call is accepted, resources are allocated toit, so the availability drops and loading increases for each call. When the resourcesare exhausted, no further calls are permitted. Congestion is not a problem for theexisting calls, and throughput is maximized. This approach is similar to a guaranteedservice.
There is a trade-off between these two approaches to resource allocation in anetwork. Although a best-effort network allows access to as many traffic flows aspossible, performance degradation across all of the traffic flows can occur. Admis-sion control preserves resources for traffic flows that have already been allocatedresources but will refuse additional traffic flows when resources are exhausted.

Elsevier US Job code: NAAD Ch01-P370480 3-5-2007 10:03a.m. Page:42 Trim:7.5in×9.25in TS: Integra, India
Font: Bembo & Helvetica Size:11/13pt Margins:Top:4pc Gutter:68pt Width:30pc Depth: 38 lines COP: Facing 1 Color
42 C H A P T E R 1 Introduction
Cap
acity
of F
ast E
ther
net C
onne
ctio
n(M
b/s)
50
Number of Concurrent Traffic Flows (Calls)
100
0
ResourceLoading
No More Calls Allowed Until ResourcesAre Available
As CallsAre Added,ResourceLoading
Increases
System Resources Are FullyLoaded at This Point
FIGURE 1.30 The Performance of a Fast Ethernet Connection under CAC
In many networks both approaches (or a hybrid between them) are desired. Forexample, a voice over IP (VoIP) service, which provides a telephony serviceacross a data network, requires some of the characteristics of CAC while operat-ing over a best-effort network. Such hybrid approaches are discussed in detail inChapter 8.
Service requests and requirements can also be low or high performance interms of capacity, delay, and RMA. Low- and high-performance requirementsdepend on each particular network. A requirement is low or high performancerelative to other requirements for that network. Low performance is an indicatorthat the service request or requirement’s performance characteristics are less thana performance threshold determined for that network. Likewise, high performance isan indicator that the service request or requirement’s performance characteristicsare greater than a performance threshold determined for that network. Thus, indetermining low and high performance for a network, we will develop one or moreperformance thresholds for that network. Multiple-tier performance indicates thatthere are multiple tiers of performance for that network. Single-tier performancerequirements are roughly equivalent within a network.
Note that low and high performances are not described in terms of best-effort,predictable, or guaranteed service because they are independent of each other.Best-effort, predictable, and guaranteed service refer to the degree of predictability ofa request or requirement, whereas low and high performances refer to a relativeperformance level for that request or requirement. For example, a network can be

Elsevier US Job code: NAAD Ch01-P370480 3-5-2007 10:03a.m. Page:43 Trim:7.5in×9.25in TS: Integra, India
Font: Bembo & Helvetica Size:11/13pt Margins:Top:4pc Gutter:68pt Width:30pc Depth: 38 lines COP: Facing 1 Color
Service Characteristics 43
entirely best effort (most current networks are), yet we can often distinguish low-and high-performance requirements for such a network. And when a network haslow- and high-performance regions for capacity, delay, and RMA, there may bepredictable or guaranteed requirements in either region.
By their nature, each service has its associated set of requirements. Theserequirements are based on the levels of performance and function desired bythe user, application, or device requesting service. Performance requirements aredescribed in terms of capacity, delay, and RMA, whereas functional requirementsdescribe specific functions needed in the service, such as multicast, security, manage-ment, or accounting. We use requests for performance and function in developingthe network architecture and design—for example, in describing the overall levelof performance needed in the network.
As mentioned earlier, service performance requirements (capacity, delay, andRMA) can be grouped together, forming one or more service levels. For example,a service request may couple a specific capacity (e.g., 1.5 Mb/s) with a boundon end-to-end delay (e.g., 40 ms). At times, such service levels can be mappedto well-known service mechanisms such as frame relay CIR or IP ToS or QoS.Thus, service levels are a way to map performance and functional requirements toa well-known or standard network service offering. A properly specified serviceprovides insight into which performance characteristics should be measured in thenetwork to verify service delivery.
1.8.4 Service Offerings
Service requests that are generated by users, applications, or devices are supportedby services offered by the network. These service offerings (e.g., via frame relayCIR or IP ToS or QoS, mentioned in the previous section) are the networkcounterparts to user, application, and device requests for service.
Service offerings map to service requests and thus can also be categorized as besteffort, predictable, or guaranteed. Best-effort service offerings are not predictable—they are based on the state of the network at any given time. There is little orno prior knowledge about available performance, and there is no control over thenetwork at any time. Most networks today operate in best-effort mode. A goodexample of a network that offers best-effort service is the current Internet.
Best-effort service offerings are compatible with best-effort service requests.Neither the service offering nor the request assumes any knowledge about the stateof or control over the network. The network offers whatever service is availableat that time (typically just available bandwidth), and the rest of the system adaptsthe flow of information to the available service (e.g., via TCP flow control).

Elsevier US Job code: NAAD Ch01-P370480 3-5-2007 10:03a.m. Page:44 Trim:7.5in×9.25in TS: Integra, India
Font: Bembo & Helvetica Size:11/13pt Margins:Top:4pc Gutter:68pt Width:30pc Depth: 38 lines COP: Facing 1 Color
44 C H A P T E R 1 Introduction
Example 1.9.
An example of a best-effort service request and offering is a file transfer (e.g., using FTP)over the Internet. FTP uses TCP as its transport protocol, which adapts, via a sliding-window flow-control mechanism, to approximate the current state of the network it isoperating across. Thus, the service requirement from FTP over TCP is best effort, and thecorresponding service offering from the Internet is best effort. The result is that, when theFTP session is active, the performance characteristics of the network (Internet) and flowcontrol (TCP windows) are constantly interacting and adapting, as well as contending withother application sessions for network resources. In addition, as part of TCP’s service tothe applications it supports, it provides error-free, reliable data transmission.
On the other hand, predictable and guaranteed service offerings have some degreeof predictability or are bounded. To achieve this, there has to be some knowledgeof the network, along with control over the network, in order to meet performancebounds or guarantees. Such services must be measurable and verifiable.
Just because a service is predictable or guaranteed does not necessarily implythat it is also high performance. Take, for example, the telephone network. Itoffers predictable service but low performance (in terms of capacity). To supportvoice conversations, this network must be able to support fairly strict delay anddelay variation tolerances, even though the capacity per user session (telephonecall) is relatively small, or low performance. What is well known from a telephonyperspective is somewhat new in the current world of data networking. Supportfor strict delay and delay variation is one of the more challenging aspects of datanetwork architecture and design.
Predictable and guaranteed service offerings should be compatible with theircorresponding service requests. In each case, service performance requirements(capacity, delay, and RMA) in a service request are translated into the correspondingperformance characteristics in the service offering.
Example 1.10.
An example of a predictable service request and offering can be seen in a network designedto support real-time streams of telemetry data. An architectural/design goal for a networksupporting real-time telemetry is the ability to specify end-to-end delay and have thenetwork satisfy this delay request. A real-time telemetry stream should have an end-to-enddelay requirement, and this requirement would form the basis for the service request. Forexample, this service request may be for an end-to-end delay of 25 ms, with a delay variation

Elsevier US Job code: NAAD Ch01-P370480 3-5-2007 10:03a.m. Page:45 Trim:7.5in×9.25in TS: Integra, India
Font: Bembo & Helvetica Size:11/13pt Margins:Top:4pc Gutter:68pt Width:30pc Depth: 38 lines COP: Facing 1 Color
Service Characteristics 45
of ±400 �s. This would form the request and the service level (i.e., a QoS level) that needsto be supported by the network. The network would then be architected and designedto support a QoS level of 25 ms end-to-end delay and a delay variation of ±400 �s.Delay and delay variation would then be measured and verified with service metrics in thesystem, perhaps by using common utilities, such as ping (a common utility for measuringround-trip delay) or TCPdump (a utility for capturing TCP information), or by using acustom application.
We use various methods to describe service performance requirements andcharacteristics within a network, including thresholds, bounds, and guarantees. Wealso show how to distinguish between high and low performance for each networkproject.
This approach does not mean that best-effort service is inherently low per-formance or that predictable or guaranteed services are high performance. Rather,it signifies that predictability in services is an important characteristic and is sep-arate from performance. There are times when a network is best architected forbest-effort service, and other times when best-effort, predictable, and guaranteedservices are needed. We will see that when predictable or guaranteed services arerequired in the network, consideration for those requirements tends to drive thearchitecture and design in one direction, while consideration for best-effort servicedrives them in another direction. It is the combination of all services that helpsmake the architecture and design complete.
1.8.5 Service Metrics
For service performance requirements and characteristics to be useful, they mustbe configurable, measurable, and verifiable within the system. Therefore, we willdescribe performance requirements and characteristics in terms of service metrics,which are intended to be configurable and measurable.
Because service metrics are meant to be measurable quantities, they can beused to measure thresholds and limits of service. Thresholds and limits are used todistinguish whether performance is in conformance (adheres to) or nonconformance(exceeds) with a service requirement. A threshold is a value for a performancecharacteristic that is a boundary between two regions of conformance and, whencrossed in one or both directions, will generate an action. A limit is a boundarybetween conforming and nonconforming regions and is taken as an upper or lowerlimit for a performance characteristic. Crossing a limit is more serious than crossinga threshold, and the resulting action is usually more serious (e.g., dropping ofpackets to bring performance back to conformance).

Elsevier US Job code: NAAD Ch01-P370480 3-5-2007 10:03a.m. Page:46 Trim:7.5in×9.25in TS: Integra, India
Font: Bembo & Helvetica Size:11/13pt Margins:Top:4pc Gutter:68pt Width:30pc Depth: 38 lines COP: Facing 1 Color
46 C H A P T E R 1 Introduction
For example, a threshold can be defined to distinguish between low and highperformance for a particular service. Both low- and high-performance levels areconforming to the service, and the threshold is used to indicate when the boundaryis crossed. This threshold can be measured and monitored in the network, triggeringsome action (e.g., a flashing red light on an administrator’s console) when thisthreshold is crossed. An example of this might be in measuring the round-trip delayof a path. A threshold of N ms is applied to this measurement. If the round-triptimes exceed N ms, an alert is generated at a network management station. Wediscuss this in greater detail in the chapter on network management architecture(Chapter 7).
In a similar fashion, limits can be created with service metrics to provideupper and lower boundaries on a measured quantity. When a limit is crossed,traffic is considered nonconforming (it exceeds the performance requirement), andaction is taken to bring the traffic back into conformance (e.g., by delaying ordropping packets). Figure 1.31 shows how limits and thresholds may be appliedin the system. In this figure, a threshold of 6 Mb/s is the boundary between lowand high performance for a service requirement, and an upper limit of 8 Mb/s isthe boundary between conformance and nonconformance for that service. Whentraffic crosses the 6 Mb/s threshold, a warning is sent to network management(with a color change from green to yellow). These notices can be used to do trendanalysis on the network—for example, to determine when capacity needs to be
Per
form
ance
Cha
ract
eris
tic(e
.g.,
Cap
acity
in M
b/s)
5
Time
12
0
Threshold Exceeded—Notedin Network Management
Database
Limit on Capacity8
Threshold on Capacity6
Boundary Exceeded—Action Taken (e.g.,Packets Dropped)
Conformance(e.g., Color: Green)
Conformance—Warning(e.g., Color:Yellow)
Nonconformance(e.g., Color:Red)
Per
form
ance
Cha
ract
eris
tic(e
.g.,
Cap
acity
in M
b/s)
5
Time
12
0
Threshold Exceeded—Notedin Network Management
Database
Limit on Capacity8
Threshold on Capacity6
Boundary Exceeded—Action Taken (e.g.,Packets Dropped)
Conformance—Warning(e.g., Color: Yellow)
Nonconformance(e.g., Color: Red)
FIGURE 1.31 Performance Limits and Thresholds

Elsevier US Job code: NAAD Ch01-P370480 3-5-2007 10:03a.m. Page:47 Trim:7.5in×9.25in TS: Integra, India
Font: Bembo & Helvetica Size:11/13pt Margins:Top:4pc Gutter:68pt Width:30pc Depth: 38 lines COP: Facing 1 Color
Performance Characteristics 47
upgraded. When traffic crosses the 8 Mb/s limit, the network takes action to reducethe capacity used by that traffic flow and an alert is sent to network management(with a color change from yellow to red) until the capacity level drops below 8Mb/s and is again conforming.
Thresholds and limits are useful applications of service metrics to understandand control performance levels in the network, in support of services.
1.9 Performance CharacteristicsServices may include one or more of the performance characteristics we havementioned so far in this chapter: capacity, delay, and RMA. Each characteristicis actually a label for a class of characteristics of that type. For example, theterm capacity is used as a label for the class of characteristics that involves movinginformation from place to place, including bandwidth, throughput, goodput, andso forth. Similarly, delay is a label for the class of characteristics that includes end-to-end delay, round-trip delay, and delay variation. RMA is a label for the class ofcharacteristics that includes reliability, maintainability, and availability. Thus, whenthe terms capacity, delay, and RMA are used in this book, you can use other termsfrom each class, depending on your network.
There are times when it makes more sense to describe capacity in terms ofthroughput—for example, when developing requirements for applications. Round-trip delay is commonly used as a measure for delay, although at times delayrequirements are expressed in terms of one-way delay.
1.9.1 Capacity
Capacity is a measure of the system’s ability to transfer information (voice, data,video, or combinations of these). Several terms are associated with capacity, suchas bandwidth, throughput, or goodput. Although we use the generic term capacitythroughout this book to reference this class of characteristics, you may choose touse another term in place of or along with capacity.
Example 1.11.
The bandwidth of a SONET OC-3c link is 155.52 Mb/s, which is three times thebandwidth of an OC-1 link (51.84 Mb/s). This bandwidth does not include data-link,network, or transport-layer protocol (e.g., SONET, IP, or transport control protocol/user

Elsevier US Job code: NAAD Ch01-P370480 3-5-2007 10:03a.m. Page:48 Trim:7.5in×9.25in TS: Integra, India
Font: Bembo & Helvetica Size:11/13pt Margins:Top:4pc Gutter:68pt Width:30pc Depth: 38 lines COP: Facing 1 Color
48 C H A P T E R 1 Introduction
datagram protocol [TCP/UDP]) overhead or, in the case of wide-area networks, the lossin performance due to the bandwidth × delay product in the network. When a networkor element is performing at its theoretical capacity, it is said to be performing at linerate. When an OC-3c circuit was tested, values of realizable capacity (throughput) rangedfrom approximately 80 to 128 Mb/s (measurements taken at the transport [TCP] layerof the National Research and Education Network [NREN] and Numerical AerodynamicSimulation [NAS] networks, NASA Ames Research Center, March 1996).
1.9.2 Delay
Delay is a measure of the time difference in the transmission of information acrossthe system. In its most basic sense, delay is the time difference in transmittinga single unit of information (bit, byte, cell, frame, or packet) from source todestination. As with capacity, there are several ways to describe and measure delay.There are also various sources of delay, such as propagation, transmission, queuing,and processing. Delay may be measured in one direction (end-to-end) and bothdirections (round-trip). Both end-to-end and round-trip delay measurements areuseful; however, only round-trip delays can be measured with the use of thepractical and universally available utility ping.
Another measure of delay incorporates device and application processing, takinginto account the time to complete a task. As the size of a task increases, theapplication processing times (and thus the response time of the system) also increase.This response time, termed here latency, may yield important information about thebehavior of the application and the network. Latency can also be used to describethe response time of a network device, such as the latency through a switch orrouter. In this case the processing time is of that switch or router.
Delay variation, which is the change in delay over time, is an important char-acteristic for applications and traffic flows that require constant delay. For example,real-time and near-real-time applications often require strict delay variation. Delayvariation is also known as jitter.
Together, delay (end-to-end and round-trip), latency, and delay variation helpdescribe network behavior.
1.9.3 RMA
RMA refers to reliability, maintainability, and availability. Reliability is a statisticalindicator of the frequency of failure of the network and its components andrepresents the unscheduled outages of service. It is important to keep in mind

Elsevier US Job code: NAAD Ch01-P370480 3-5-2007 10:03a.m. Page:49 Trim:7.5in×9.25in TS: Integra, India
Font: Bembo & Helvetica Size:11/13pt Margins:Top:4pc Gutter:68pt Width:30pc Depth: 38 lines COP: Facing 1 Color
Performance Characteristics 49
that only failures that prevent the system from performing its mission, or mission-critical failures (more on this in Chapter 2), are generally considered in this analysis.Failures of components that have no effect on the mission, at least when they fail,are not considered in these calculations. Failure of a standby component needstending to but is not a mission-critical failure.
Reliability also requires some degree of predictable behavior. For a service tobe considered reliable, the delivery of information must occur within well-knowntime boundaries. When delivery times vary greatly, users lose confidence in thetimely delivery of information. In this sense the term reliability can be coupledwith confidence in that it describes how users have confidence that the network andsystem will meet their requirements.
A parallel can be seen with the airline industry. Passengers (users) of the airlinesystem expect accurate delivery of information (in this case the passengers themselves)to the destination. Losing or misplacing passengers is unacceptable. In addition, pre-dictable delivery is also expected. Passengers expect flights to depart and arrive withinreasonable time boundaries. When these boundaries are crossed, passengers are likelyto use a different airline or not fly at all. Similarly, when an application is being used,the user expects a reasonable response time from the application, which is dependenton the timely delivery of information across the system.
Along with reliability is maintainability. Maintainability is a statistical measureof the time to restore the system to fully operational status after it has experienceda fault. This is generally expressed as a mean-time-to-repair (MTTR). Repairinga system failure consists of several stages: detection; isolation of the failure to acomponent that can be replaced; the time required to deliver the necessary partsto the location of the failed component (logistics time); and the time to actuallyreplace the component, test it, and restore full service. MTTR usually assumes thelogistics time is zero; this is an assumption, which is invalid if a component mustbe replaced to restore service but takes days to obtain.
To fully describe this performance class, we add availability to reliability andmaintainability. Availability (also known as operational availability) is the relationshipbetween the frequency of mission-critical failures and the time to restore service.This is defined as the mean time between mission-critical failures (or mean timebetween failures) divided by the sum of mean time to repair and mean timebetween mission-critical failures or mean time between failures. These relationshipsare shown in the following equation, where A is availability.
A = (MTBCF)/(MTBCF + MTTR) or A = (MTBF)/(MTBF + MTTR)

Elsevier US Job code: NAAD Ch01-P370480 3-5-2007 10:03a.m. Page:50 Trim:7.5in×9.25in TS: Integra, India
Font: Bembo & Helvetica Size:11/13pt Margins:Top:4pc Gutter:68pt Width:30pc Depth: 38 lines COP: Facing 1 Color
50 C H A P T E R 1 Introduction
Capacity, delay, and RMA are dependent on each other. For example, the empha-sis of a network design may be to bound delay: A system supporting point-of-saletransactions may need to guarantee delivery of customer information and com-pletion of the transaction within 15 seconds (where the network delay is on theorder of 100s of ms); a Web application can have similar requirements. However,in a computation-intensive application we may be able to optimize the systemby buffering data during periods of computing. In this case, delay may not beas important as a guarantee of eventual delivery. On the other hand, a systemsupporting visualization of real-time banking transactions may require a round-tripdelay of less than 40 ms, with a delay variation of less than 500 �s. If these delayboundaries are exceeded, the visualization task fails for that application, forcing thesystem to use other techniques.
1.9.4 Performance Envelopes
Performance requirements can be combined to describe a performance range forthe system. A performance envelope is a combination of two or more performancerequirements, with thresholds and upper and/or lower limits for each. Within thisenvelope, levels of application, device, and/or network performance requirementsare plotted. Figures 1.32 and 1.33 show two such envelopes. The performance
Application 2
Dat
a S
ize
(MB
ytes
)
1/Delay (Seconds–1)10
100
103
106Application 4
10210010–110–210–310–4
101
102
104
105
Gb/sM
B/s
Appl 5
Application 3
Application 1
FIGURE 1.32 An Example of a 2D Performance Envelope

Elsevier US Job code: NAAD Ch01-P370480 3-5-2007 10:03a.m. Page:51 Trim:7.5in×9.25in TS: Integra, India
Font: Bembo & Helvetica Size:11/13pt Margins:Top:4pc Gutter:68pt Width:30pc Depth: 38 lines COP: Facing 1 Color
Network Supportability 51
Delay
Capacity
RMAUpper Limit
Threshold
Low-Performance
Region
High-Performance
Region
FIGURE 1.33 An Example of a 3D Performance Envelope
envelope in Figure 1.32 consists of capacity, in terms of data sizes transferred acrossthe network, and end-to-end delay. In this figure, delay is shown as 1/delay forconsistency.
Figure 1.33 is a 3D performance envelope, showing capacity, delay, and RMA.This envelope also describes two regions of performance, low and high perfor-mance, which are functions of the limits and thresholds for capacity, delay, andRMA.
Performance envelopes such as these are useful for visualizing the regions ofdelay, capacity, and RMA in which the network will be expected to operatebased on requirements developed for that network. In Chapter 2 we discuss howrequirements are developed for a network.
1.10 Network SupportabilityThe ability of the customer to sustain the required level of performance (thatarchitected and designed into the network) over the entire life cycle of the networkis an area of networking that is often neglected. It is a mistake to assume thata successful network architecture and design meet the requirements only on the dayit is delivered to the customer and that future requirements are the responsibilityof the customer.
Experience indicates operations and support constitute 80% of the life-cyclecosts of a system, whereas development, acquisition, and installation represent only

Elsevier US Job code: NAAD Ch01-P370480 3-5-2007 10:03a.m. Page:52 Trim:7.5in×9.25in TS: Integra, India
Font: Bembo & Helvetica Size:11/13pt Margins:Top:4pc Gutter:68pt Width:30pc Depth: 38 lines COP: Facing 1 Color
52 C H A P T E R 1 Introduction
20%. Good network architects/designers take into account the major factors thataffect operability and supportability as they make their decisions. Knowledgeablecustomers insist that they understand the operations and support implications of anetwork architecture and design. At times, such issues may be of more concernthan the feasibility of a new technology.
The postimplementation phases of a network’s life cycle can be broken intothree elements: operations, maintenance, and human knowledge. The operationselement focuses on ensuring that the network and system are properly operated andmanaged and that any required maintenance actions are identified. The maintenanceelement focuses on preventive and corrective maintenance and the parts, tools,plans, and procedures for accomplishing these functions. The human knowledgeelement is the set of documentation, training, and skilled personnel required tooperate and maintain the network and system. Design decisions affect each of thesefactors and have a direct impact on the ability of the customer to sustain the highlevel of service originally realized upon implementation of the network.
Failure to consider supportability in the analysis, architecture, and design pro-cesses has a number of serious consequences. First, a smart customer, when facedwith a network architecture/design that obviously cannot be operated or main-tained by his or her organization, will reject the network project or refuse to payfor it. Second, a customer who accepts the architecture/design and subsequentimplementation will have inadequate resources to respond to network and systemoutages, experience unacceptable performance after a period of time, and may suf-fer adverse effects in his or her operation or business (e.g., a loss of their customersor revenue). Other customers will be highly dissatisfied with their network andeither require the architect/designer to return and repair the network by providingadequate materials to sustain its required performance level or will prematurelyreplace it. None of these cases reflects positively on the network architect/designeror implementation team and can lead to finger pointing that can be more painfulthan any acceptance test.
Key characteristics of a network architecture and design that affect the postim-plementation costs include:
• Network and system reliability• Network and system maintainability• Training of the operators to stay within operational constraints• Quality of the staff required to perform maintenance actions

Elsevier US Job code: NAAD Ch01-P370480 3-5-2007 10:03a.m. Page:53 Trim:7.5in×9.25in TS: Integra, India
Font: Bembo & Helvetica Size:11/13pt Margins:Top:4pc Gutter:68pt Width:30pc Depth: 38 lines COP: Facing 1 Color
Conclusion 53
Some examples of key network architecture/design decisions that affect thesecharacteristics include:
• Degree of diversity of critical-path components in network architecture/design• Quality of network components selected for installation• Location and accessibility of components requiring frequent maintenance• Implementation of built-in test equipment and monitoring techniques
Supportability must be considered throughout the life cycle of the network. Anaccurate assessment of the requirements for continuous service at full performancelevel must be included in the requirements analysis process, along with a statementof specific, measurable requirements. During the architecture and design processes,trade-offs must take into account the impact of supportability, and the concept ofoperations must be formulated. Last, during implementation, two major tasks mustbe accomplished to ensure supportability:
1. Conformance to the network architecture and design must be validated andnonconformance corrected or (at least) documented to ensure that performanceis adequate and that maintenance can be performed.
2. Operations and maintenance personnel must understand and be trained in thetechnologies that are being deployed, including how to operate the networkand system properly, when to perform maintenance, and how to most quicklyrestore service in the event of a fault.
A detailed discussion of how supportability fits into the overall architecture anddesign processes is provided in Chapter 2.
1.11 ConclusionIn this chapter you learned definitions of network analysis, architecture, and design;the importance of network analysis in understanding the system and providinga defensible architecture and design; and the model for the network analysis,architecture, and design processes.
You have also learned that networks are not independent entities but rather apart of the system and that the delivery of network services is a goal of the system.Network services consist of performance and function and are offered to users,

Elsevier US Job code: NAAD Ch01-P370480 3-5-2007 10:03a.m. Page:54 Trim:7.5in×9.25in TS: Integra, India
Font: Bembo & Helvetica Size:11/13pt Margins:Top:4pc Gutter:68pt Width:30pc Depth: 38 lines COP: Facing 1 Color
54 C H A P T E R 1 Introduction
applications, and devices so that they can accomplish their work on the system.In order to architect and design a network to support services, you need to knowwhat they are, how they work together, and how to characterize them. Once youdo this, you will have a broad view of what the network will need to support,which you can take to the next levels of detail as you proceed with the networkanalysis.
By describing the system as a set of components (e.g., user, application, device,network), you can apply interfaces between these components to help understandthe relationships, inputs, and outputs between each of the components.
You have also learned about different types of services, from best-effort, unpre-dictable, and unreliable service to predictable, bounded, and somewhat predictableservice, to guaranteed services with accountability.
To go to a level deeper in the discussion about services, we considered theservice performance characteristics capacity, delay, and RMA (reliability, maintain-ability, and availability). These characteristics are useful only if we can measureand verify their values in the system. We discussed these values, as well as servicemetrics, thresholds, and boundaries. We learned that performance characteristicscan be combined into a performance envelope.
Having thought about systems, services, and their characteristics, we are nowready to quantify what we want from our networks. To do this, we first needto gather, analyze, and understand the requirements from the system. This isrequirements analysis, the next step in the network analysis process.
1.12 Exercises1. In Example 1.3, an analogy was drawn between a network’s architecture and
design and a home’s architecture and design. Provide a similar analogy, using acomputer’s architecture and design.
2. Hierarchy and interconnectivity are a fundamental trade-off in networks. Given thenetwork hierarchy shown in Figure 1.30, with costs assigned to each link, showhow interconnectivity would improve the performance of traffic flowing betweenJoe’s computer and Sandy’s computer. Costs are shown as numbers but couldrepresent the capacity of each link or the costs incurred by using each link. Whatis the total cost of traveling the hierarchy between Joe’s computer and Sandy’s?In this figure, where would you add a link of cost 15 so that the total cost betweenJoe’s computer and Sandy’s is less than it is when you travel the entire hierarchy?
3. In Figure 1.9, connections are added between networks in the Internet to providea better performing path for select traffic flows. An example of this is a content
Elsevier US Job code: NAAD Ch01-P370480 3-5-2007 10:03a.m. Page:55 Trim:7.5in×9.25in TS: Integra, India
Font: Bembo & Helvetica Size:11/13pt Margins:Top:4pc Gutter:68pt Width:30pc Depth: 38 lines COP: Facing 1 Color
Exercises 55
delivery network (CDN). What is a CDN? Show how a CDN uses interconnectivityto provide better performance characteristics to its users.
4. In defining where services can be applied in a network, end-to-end is determinedby where you want a service to start and stop. For example, if your WAN is suppliedby a service provider (e.g., an ATM or frame relay service), you may want to definethe end points and characteristics of that service. If you use IP routers at eachLAN-WAN interface to that service, describe the following: (1) at which networkdevices would you define the end points of the service, and (2) what characteristics(service metrics) would you use to measure the service?
5. Service requirements flow from user to application to device to network, becomingmore specific along the way. If you were given an application requirement forend-to-end delay (e.g., 100 ms) between an application server on one network andusers on another network, for example, how might that translate into delay in thenetwork and devices? What types of service metrics could you use to measure it?
6. For Example 1.5, the delay characteristics for the segments (including the pro-cessing at the switches) are as follows: for each GigE segment, 100 �s; for the PoSOC-48 segment between routers, 1 ms; for each FE segment, 200 �s; and for thesecurity firewall, 5 ms. Draw graphs showing the end-to-end delay performance(in the direction from user PC to server) before and after the security firewall isadded.
7. Which of the following applications require best-effort (unpredictable and unre-liable), guaranteed (predictable and reliable, with accountability), or predictableservice. Give reasons for your choices.• High-quality (phone company-grade) voice calls• Voice over IP (VoIP) calls• File transfers via FTP• Audio file downloads• A commercial video-on-demand service• User access to servers in a corporation
8. Show how performance boundaries and thresholds could be used in the followingscenarios.• An application has a service requirement for round-trip delay to be less than
100 ms. If delay is greater than 100 ms, notify the network administrator.• A user requires capacity of up to 512 Kb/s but may not exceed 1.5 Mb/s. You
want to keep track of how much time the user’s capacity is between 512 Kb/sand 1.5 Mb/s.


