FMTOMOFMTOMO
Fast Marching Tomography Package:
Instruction Manual
by Nick Rawlinson
Research School of Earth Sciences, Australian National University, Canberra ACT 0200

Contents
1 Introduction 4
1.1 Associated documentation . . . . . . . . . . . . . . . . . . . . . . . . . . . 5
1.2 External software requirements . . . . . . . . . . . . . . . . . . . . . . . . 6
1.3 Compatibility and operation . . . . . . . . . . . . . . . . . . . . . . . . . . 6
2 Unpacking and compiling the code 7
3 Constructing initial and synthetic models 10
3.1 Model Parameterization . . . . . . . . . . . . . . . . . . . . . . . . . . . . 11
3.2 Using grid3dg to generate a model . . . . . . . . . . . . . . . . . . . . . . 14
3.2.1 Setting the model dimensions . . . . . . . . . . . . . . . . . . . . . 15
3.2.2 Specifying the propagation grid . . . . . . . . . . . . . . . . . . . . 16
3.2.3 Defining the velocity grids . . . . . . . . . . . . . . . . . . . . . . . 18
3.2.4 Defining the interface grids . . . . . . . . . . . . . . . . . . . . . . . 24
4 Solving the forward problem with fm3d 26
5 Solving the inverse problem with invert3d 27
6 Constructing a tomographic solution model with tomo3d 35
7 Data input 37
7.1 Path signatures . . . . . . . . . . . . . . . . . . . . . . . . . . . . . . . . . 38
7.2 Constructing synthetic datasets with moddata . . . . . . . . . . . . . . . 39
7.3 Including observational data with obsdata . . . . . . . . . . . . . . . . . . 43
7.4 Generating a synthetic traveltime dataset . . . . . . . . . . . . . . . . . . . 47
8 Plotting the output 49
8.1 Producing GMT output with gmtslice . . . . . . . . . . . . . . . . . . . . 49
8.2 Using the GMT plotting scripts . . . . . . . . . . . . . . . . . . . . . . . . 56
9 Examples 57
9.1 Example 1: Hypocenter relocation . . . . . . . . . . . . . . . . . . . . . . . 57
9.2 Example 2: Inversion for interface and velocity structure . . . . . . . . . . 61
2

9.3 Example 3: Joint inversion of active and passive source datasets . . . . . . 64
10 FAQs 68
3

1 Introduction
This document describes how to use the Fortran software package FMTOMO to perform
3-D traveltime tomography. FMTOMO uses the fast marching method (FMM) for the
forward step of traveltime prediction, and a subspace inversion scheme to adjust model
parameters in order to satisfy data observations. The method is iterative non-linear in that
the inversion step assumes local linearity, but repeated application of FMM and subspace
inversion allows the non-linear relationship between velocity and traveltime perturbations
to be reconciled.
The long term goal of the FMTOMO project is to produce a comprehensive package
for carrying out many different classes of traveltime tomography. In its current form
(version 1.0), model structure is represented by subhorizontal layers in spherical coordi-
nates. Within a layer, velocity is permitted to vary smoothly in all three dimensions.
The geometry of layer boundaries may also vary, but all interfaces must completely span
the horizontal dimensions of the model region, and cannot be multi-valued in depth (i.e.
cannot fold over on itself). Although structures such as discrete bodies or salt domes
cannot be accurately represented with this style of parameterization, a wide variety of
other structures (e.g. a subducting slab) may nevertheless be considered.
FMTOMO uses the fm3d package to solve the forward problem. fm3d is based on
the so called multi-stage Fast Marching Method (FMM), a grid based eikonal solver that
implicitly tracks the evolution of wavefronts in 3-D layered media. Phases comprising any
number of reflection and refraction branches may be tracked (including P-S conversions).
Tests show it to be computationally efficient and robust in the presence of severe variations
in both velocity and interface structure. Sources may lie at the surface, at depth, or
outside the model region (i.e. teleseismic events), thus allowing many different types of
traveltime datasets to be predicted, including reflection, refraction, local earthquake and
teleseismic.
The subspace inversion scheme minimizes an objective function simultaneously along
multiple search directions that together span a subspace of model space. Both damping
and smoothing regularization can be applied in order to address the problem of solution
non-uniqueness. At this stage, FMTOMO can simultaneously invert one or more classes
of traveltime dataset for variations in wavespeed, interface depth and source location.
It is important to realize that a common drawback of sophisticated academic software
4

packages is that they are often not user friendly, and require a serious time commitment
before they yield the desired results. The flexibility offered by FMTOMO to some extent
necessitates a rather complex user interface, which from experience with “novice” users,
takes a fair amount of time to comprehend. Therefore, if you are serious about using
this package, be prepared to spend a day or two carefully reading though this instruction
manual, the instructions associated with fm3d and journal papers that have used FM-
TOMO. In addition, it is strongly recommended that the three examples that come with
this distribution are examined, and that the results they contain can be reproduced using
your compilation of the code.
1.1 Associated documentation
• The following paper (a PDF version is included in the docs/ directory) uses FM-
TOMO to invert synthetic data for source location (see Example 1), and velocity
and interface structure (see Example 2):
Rawlinson, N., de Kool, M. and Sambridge, M., 2006. Seismic wavefront track-
ing in 3-D heterogeneous media: applications with multiple data classes. Explor.
Geophys., 37, 322-330.
• The following paper (a PDF version is included in the docs/ directory) uses FM-
TOMO to simultaneously invert wide-angle and teleseismic data for both Moho
geometry and lithospheric velocity structure beneath Tasmania, south-east Aus-
tralia (see Example 3):
Rawlinson, N. and Urvoy, M., 2006. Simultaneous inversion of active and passive
source datasets for 3-D seismic structure with application to Tasmania. Geophys.
Res. Lett., 33 L24313, doi:10.1029/2006GL028105.
• The following paper (a PDF version is included in the docs directory) describes the
fm3d package in detail:
de Kool, M., Rawlinson, N. and Sambridge, M. 2006. A practical grid based method
for tracking multiple refraction and reflection phases in 3D heterogeneous media,
Geophys. J. Int., 167, 253-270.
• The instructions for using fm3d can be found in the sub-directory fmcode/ (open
the text file README 0.7). Note that in theory, you do not need a comprehensive
5

understanding of fm3d in order to use FMTOMO.
1.2 External software requirements
• The home page for the fm3d package can be found at:
http://rses.anu.edu.au/seismology/fmmcode
Note that the source code comes with the FMTOMO distribution, so there is no
need to download it separately.
• The plotting routines that come with FMTOMO make use of GMT (the Generic
Mapping Tool), a script-based visualization package. It is freely available to down-
load from:
http://gmt.soest.hawaii.edu
• fm3d includes an option for output files in OpenDX format. OpenDX is a sophis-
ticated 3-D visualization package that is available for free from:
http://www.opendx.org
1.3 Compatibility and operation
FMTOMO has been tested on several UNIX/Linux platforms. In theory, it should work
with most Fortran 90 (or later) compilers. Under Linux, it has been successfully compiled
and executed with Pathscale, g95 and ifort (Intel Fortran Compiler). On Sun Solaris
operating systems (with both AMD and UltraSparc CPUs), it has correctly compiled and
executed using the Sun Fortran 90 compiler. However, note that from our experience
with Sun Blade Workstations that use UltraSparc CPUs, execution time is very slow (at
least an order of magnitude slower) compared to machines that use recent Intel and AMD
CPUs. Our best results have come from using Pentium 4 (or later) Intel CPUs together
with Intels ifort compiler.
The memory requirements of FMTOMO vary depending on the size of the problem be-
ing solved. For most realistic scenarios (e.g. Example 3 in the distribution), a workstation
with 512 Mb - 1 Gb of RAM should be sufficient.
6

2 Unpacking and compiling the code
FMTOMO is distributed as a tarred and gzipped archive. In order to unpack the code,
type something like:
• gunzip -c fmtomov1.0.tar.gz | tar xvof -
or
• tar -xvzf fmtomov1.0.tar.gz
at the command prompt. One of the above commands will create a set of subdirectories
below the current directory, which should contain:
• bin/: Contains all executable files associated with FMTOMO. Prior to compilation,
the only executable file that should be present in this subdirectory is tomo3d, which
is a shell script.
• compileall: A shell script for compiling all software and placing executables in bin/.
• docs/: Contains documentation associated with FMTOMO, including this instruc-
tion manual. Several journal papers which use the code are also included.
• example1/: Synthetic test example which attempts to relocate earthquake hypocen-
ters in the presence of 3-D velocity and interface structure.
• example2/: Synthetic test example which simultaneously inverts teleseismic and
wide-angle data for both velocity and interface structure.
• example3/: Inverts observed teleseismic and wide-angle traveltime data for the struc-
ture of the Tasmanian (south east Australia) lithosphere.
• fmcode/: Contains the source files for building fm3d and constructing the binary
traveltime tables for predicting global phases in spherically symmetric Earth models
(for tracking teleseismic arrivals).
• gmtfiles/: Contains several GMT shell scripts for plotting cross-sections through
models produced by FMTOMO.
• source/: Contains all source files for FMTOMO, with the exception of the source
files for fm3d.
7

FMTOMO is made up of a number of different Fortran programs. These include:
• arraygen: A simple program for generating rectangular arrays of receivers (latitude,
longitude, depth) for performing synthetic tests.
• fm3d: Solves the forward problem of traveltime prediction by applying the so-called
multi-stage Fast Marching Method. fm3d can also output ray paths and Frechet
derivatives, the latter of which are required by the inversion routine.
• gmtslice: A program for taking output from the tomographic inversion routine and
converting it into a format suitable for use with GMT. Various types of horizontal
and vertical sections can be taken through a 3-D model. Ray paths, sources and
receivers may also be visualized.
• grid3dg: A program for constructing 3-D models in the format required by fm3d. It
can be used to construct checkerboard or other synthetic test models (e.g. random
structure), and initial models for tomographic inversion. In the latter case, it is best
for producing models in which velocity varies with depth only, and interfaces are
planar. However, it does allow more complex models to be generated using separate
grid files supplied by the user.
• invert3d: This program uses the subspace inversion method to invert the traveltime
data for model structure. Regularization in the form of damping and smoothing
can be imposed.
• moddata: A program for generating source and receiver input files in the format
required by fm3d. These files also contain information about path signatures, and
do not have a very intuitive structure. moddata is best used for purely synthetic
tests (e.g. Examples 1 and 2), and not cases where observational data is involved
(e.g. Example 3). For these situations, obsdata is usually a better option.
• obsdata: A program for generating source, receiver and traveltime input files in the
format required by fm3d. This program is best used for cases where observed data
are involved. obsdata expects these observations to be listed in separate files which
it can access. The difference between moddata and obsdata may seem confusing
at this stage, but it will be made clearer later on.
8

• residuals: Computes summary traveltime residuals (RMS, variance and χ2) associ-
ated with the current model.
• synthdata: A simple program for generating synthetic traveltimes. It takes output
from fm3d (the list of arrival time predictions contained in arrivals.dat), and adds
random noise (if required) and an estimate of picking error (required by invert3d).
The output file can be used as input to the tomography routine for performing a
synthetic test (e.g. a checkerboard test).
• remodl,setbrn: A pair of programs that, when run sequentially, produces the travel-
time tables required for predicting the arrival times of global phases. The default
setting assumes an ak135 global model, and the binary files produced are called
ak135.hed and ak135.tbl. Note that if teleseismic arrival time prediction is required,
these files must be in the same directory in which fm3d is executed. The source
code for the two programs are contained in fmtomo/aktimes/.
All of the above programs can be compiled separately and moved to the bin subdi-
rectory (except for remodl and setbrn, which only need to be executed once to produce
the binary tables for the specific machine architecture that is used). However, it is much
simpler to run the script compileall, which is the only file contained in the root directory
of the distribution. This script will compile all of the above code and move the executa-
bles to bin/. It will also build and execute remodl and setbrn, and copy the output files
ak135.hed and ak135.tbl to source/inputfiles.
Prior to running compileall, perform the following steps:
1. Open compileall in your favourite editor and check that the ksh directive on the
first line points to the correct location. If you do not have ksh, use zsh instead.
2. On line 22 of compileall, enter the name of the Fortran 90 (or later) compiler you
wish to use for compiling all the code except fm3d.
3. Open the Makefile contained in the subdirectory fmcode/. On line 7, enter the
name of the the Fortran 90 (or later) compiler you wish to use for compiling fm3d.
4. Open the Makefile contained in the subdirectory fmcode/aktimes/ and enter the
name of the Fortran compiler you wish to use for compiling remodl and setbrn.
9
Although these programs are written in Fortran 77, you should be able to use the
same compiler you used for the other programs.
At this stage, you should be able to type compileall at the command line, hit Enter,
and all the code will successfully compile (fingers crossed). On a 1.6 GHz AMD Opteron
workstation running SuSe Linux 9.3, this process takes about 30 seconds when the Intel
Fortran compiler (ifort) is used. There will be some screen output associated with the
compilation of fm3d and the creation of the binary traveltime tables (a list of numbers
and global phase names will appear at the end), so do not be alarmed. When compileall
is complete, it will print the statement “compilation complete” to the screen. In order to
run the executables from any directory, you will need to make sure that the path to the
bin/ directory is correctly set in your startup shell script. Alternatively, you could copy
the executables to a directory that you know is already specified in the path list, although
this is perhaps the less desirable option. In the former case, if you use a .cshrc file, then
you could add a line like:
• set path = ($path /directories/bin)
after the path is initially set. In the above example, directories refers to the directory
structure above the bin directory (e.g. ∼/tomography/fmtomo).
Before using FMTOMO, open tomo3d, which is contained in the bin subdirectory,
and make sure that the ksh directive on the first line points to the correct location. If
you do not have ksh, use zsh instead. At this stage, you are in a position to go ahead and
see if your compiled version of the code will correctly reproduce the examples provided.
3 Constructing initial and synthetic models
The first step in performing a tomographic inversion is to specify how model structure
is to be represented (i.e. how the model is to be parameterized). This is a crucial choice
because it immediately imposes limitations on the types of structure that can be recovered
(in a sense, it represents a kind of implicit regularization of the problem). In the case
of FMTOMO, velocity is represented by a regular grid of points with cubic B-splines
applied to define a continuum. Interfaces are represented by a regular grid of points in
latitude and longitude, the depths of which can vary, with cubic B-splines used to define
a continuous surface.
10

Given that the underlying parameterization has already been imposed, the remaining
choices for the user are: the number of layers; the density of nodes describing each velocity
field and layer interface; and the values associated with these nodes. When choosing an
initial or starting model for subsequent inversion, a priori information is often such that
only a laterally homogeneous structure needs to be generated. However, when independent
information on lateral structure is available, or when synthetic tests are to be performed,
then it is often necessary to construct more complex models.
Details on how the interface and velocity grid files are structured can be found in the
README 0.7 file under fmtomo. This information is not provided here because the format
of these input files is dictated by fm3d, which is a separate package. However, a useful
program provided as part of this distribution, called grid3dg, makes the task of generating
initial and synthetic models much simpler than it otherwise might be. Before describing
the input requirements of this program, a brief overview of the model parameterization
used by FMTOMO is provided.
3.1 Model Parameterization
As mentioned previously, FMTOMO represents structure by a series of one or more
subhorizontal layers which completely span the model region in latitude and longitude.
Within each layer, the velocity field is defined by a regular grid of nodes. These nodes
are used as the control vertices of a mosaic of cubic B-spline volume elements, which
define the continuum. Layer interfaces are described by a regular mesh in latitude and
longitude, which control a mosaic of cubic B-spline surface patches that describe the com-
plete interface. Cubic B-spline functions are desirable because they exhibit local control
(i.e. changing the value of a single node only affects the interface or velocity field in the
vicinity of the node), continuity of the second derivative, and can be rapidly evaluated.
This last property is important because in order to use the multi-stage FMM, a propaga-
tion grid must be defined over which the narrow band evolves; typically, this will involve
many evaluations of the spline function.
Figure 1 demonstrates (in cross-section) the basic concept of the layered parameteriza-
tion. One of the most important things to understand is that the velocity grid within each
layer is defined independently of the other layers. This means, for example, that in the
first layer v1(r, θ, φ) has its own grid of velocity nodes, which is separate from v2(r, θ, φ)
11
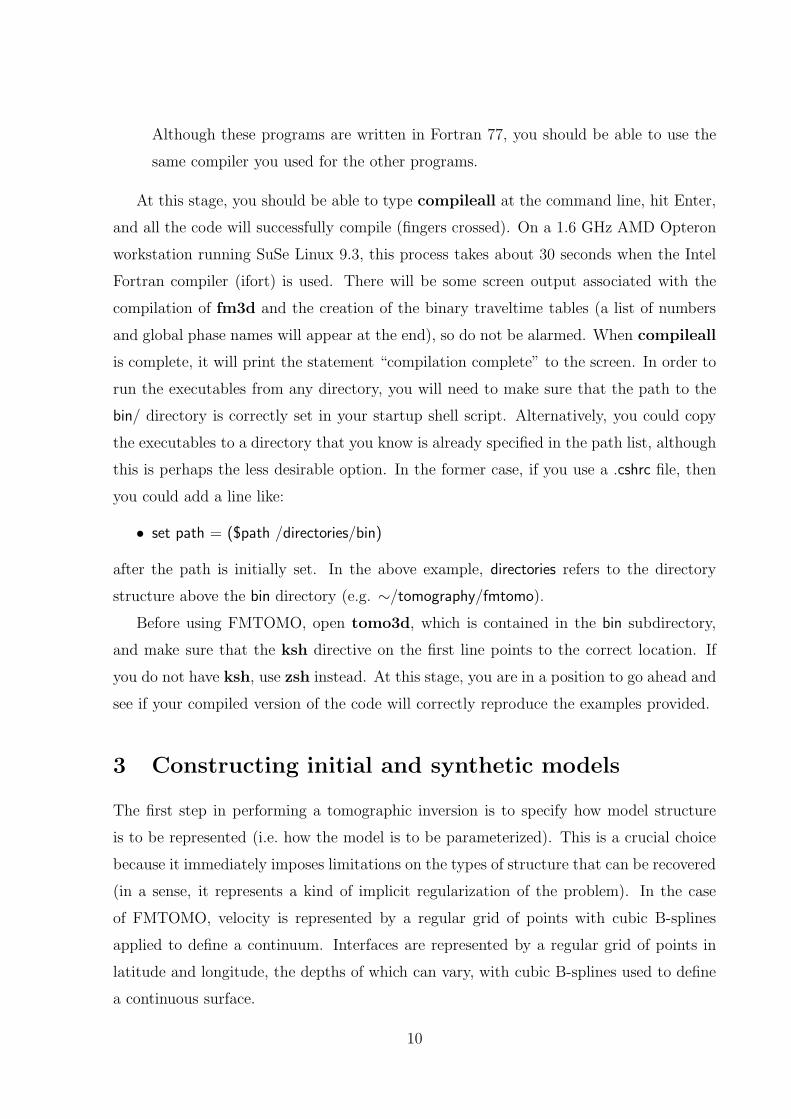
in the second layer. The node spacing of these grids can be different (although in Figure
1 they are the same), and they can also spatially overlap. When interface structure is
inverted for, interface nodes are perturbed in depth, which means that vertically, the layer
can expand or contract. In effect, this will make some velocity nodes redundant (they will
not influence traveltime), but will also activate previously redundant nodes. fm3d will
automatically select which region of the velocity grid to use depending on the structure
of the bounding interfaces.
v (r,θ,φ)1
v (r,θ,φ)3
v (r,θ,φ)2
v (r,θ,φ)4
Interface 1
Interface 2
Interface 5
Interface 3
Interface 4
Interface node Boundary interface node Velocity node Boundary velocity node
Figure 1: Schematic diagram showing in vertical cross-section the model parameteriza-
tion adopted by FMTOMO. Velocity within each layer is independent of the velocity in
adjacent layers. Both velocity and interface grids must have a set of boundary nodes.
Note that the velocity continuum and interface surface defined by cubic B-splines need
not interpolate the velocity and interface nodes.
Several other features of Figure 1 are also worth noting. First, both the interface
and velocity grids are required to have a cushion of boundary nodes. The continuous
velocity fields and interface surfaces do not extend out to these cushion nodes, but cease
exactly one node inboard of the boundary. Thus, if a grid is defined by N nodes in a
particular dimension, the velocity continuum or interface surface will only span N − 2 of
these nodes. A second notable feature of Figure 1 is that the surfaces do not necessarily
interpolate the interface nodes. This is also true of the velocity continuum (and obviously
can’t be shown in Figure 1), which does not necessarily interpolate the velocity nodes.
12

Both of these features stem from the use cubic B-splines to define the interface surfaces
and velocity fields. Cubic B-spline functions are basically piecewise cubic polynomials
that are continuous in curvature where they suture together. In addition, they are locally
controlled (unlike natural cubic splines) in that only four control nodes are required in
order to define a single segment. Figure 2 illustrates this concept.
Figure 2: Segment of a cubic B-spine curve. In order to ensure local control and continuity
of curvature, these splines are non-interpolating.
Figure 1 also includes a layer pinch-out, something that is permitted by FMTOMO.
When this occurs, two adjacent interfaces essentially overlap, which effectively results in
the layer bounded by these interfaces becoming horizontally discontinuous. In order to
facilitate this feature, fm3d requires the horizontal node spacing of all interface grids to
be identical.
−400
−300
−200
−100
0
−400
−300
−200
−100
0
136 137 138 139 140 141 142 143 144 145
136 137 138 139 140 141 142 143 144 145
4 5 6 7 8 9 10 11v (km/s)
Figure 3: Cross-section through a complex layered velocity model (ostensibly showing a
synthetic subduction zone) defined using the FMTOMO parameterization scheme.
An example of a cross-section through a complex synthetic velocity model that con-
13

forms to the above parameterization is shown in Figure 3. Note that both velocity and
interface structure varies smoothly, and multiple layer pinchouts can be specified.
3.2 Using grid3dg to generate a model
A program called grid3dg is provided with this distribution to facilitate the generation
of a range of models for use either as input starting models for a tomographic inversion, or
for generating synthetic data (e.g. for a checkerboard resolution test). grid3dg requires
an input parameter file, called grid3dg.in, in order to generate a model. A generic version
of this input file can be found in source/inputfiles/.
To some extent, the format of grid3dg.in is self-explanatory, but we will nevertheless
attempt to describe a selection of the more important entries. If you open the input file
located in source/inputfiles, you will see that the first entry block is as follows:
ccccccccccccccccccccccccccccccccccccccccccccccccccccccccccccc
c Specify number of layers (= number of interfaces -1)
ccccccccccccccccccccccccccccccccccccccccccccccccccccccccccccc
2 c: Number of layers in model
1 c: Number of velocity grid types (1 or 2)
0.02 c: Pinchout distance (km) (>=0.0)
vgrids.in c: Output velocity grid file
interfaces.in c: Output interface grid file
145678 c: Seed for random number generation (int)
The first line specifies the number of layers in the model. As indicated in Figure 1, the
number of layers must equal the number of interfaces minus 1. The second line indicates
the number of velocity grid types. fm3d allows both a P-wave velocity field and an S-
wave velocity field to be independently defined within a single layer. This is to facilitate
mode conversions (e.g. SmP). Thus, if you are only interested in a single velocity type
(P or S), then set this value to 1. Note that at this stage, the ability of FMTOMO
to simultaneously invert for both P and S velocities has not been properly tested. If
your dataset does not include mode conversions, then there is no need to specify more
than one velocity field within a single layer. The third line sets the minimum pinchout
14

distance between adjacent interfaces. grid3dg automatically checks to see whether you
have specified interfaces that intersect and applies a correction if necessary. Although in
some cases you may want a layer to fully pinch-out, it is usually safer to specify some
small tolerance to avoid potential complications with fm3d (e.g. round-off error).
The next two lines specify the names of the velocity (vgrids.in) and interface (inter-
faces.in) files that are created by grid3dg. Together, these two files fully specify the
model, and constitute two of the input files required by fm3d. As such, they have been
given the appropriate filenames that are needed for fm3d. The final line sets the seed for
random number generation. This is used to seed the generation of random noise with a
Gaussian distribution, which in turn is used to superimpose random structure on a model
if required by the user (e.g. for a synthetic test).
3.2.1 Setting the model dimensions
The second entry block is as follows:
ccccccccccccccccccccccccccccccccccccccccccccccccccccccccccccc
c Set 3-D grid size and location. Note that all layer
c velocity grids have the same spatial dimension, but can
c have different node densities. Interface grids have the
c same node distribution.
ccccccccccccccccccccccccccccccccccccccccccccccccccccccccccccc
1.50 -80.10 c: Radial range (top-bottom) of grid (km)
-40.0 -42.0 c: Latitudinal range (N-S) of grid (degrees)
140.0 143.0 c: Longitudinal range (E-W) of grid (degrees)
6371.0 c: Earth radius
These options specify the location of the model and its dimensions (in spherical coordi-
nates). The radial range of the model is relative to the surface of the Earth, and defines
how far the model extends in depth. In this case, the “top” of the model is 1.5 km above
the surface of the Earth, and the “bottom” of the model is 80.1 km below the surface.
When surface topography is a factor, it is usually necessary to have the top of the model
above the surface of the Earth to ensure that receivers do not lie outside the bounds of
15

the model. When defining the N-S range of the model, note that northern hemisphere
latitudes are positive, and southern hemisphere latitudes are negative. Longitudes should
be defined as East of the meridian, rather than west (e.g. you should convert 115 W to
245 E). Note: grid3dg automatically adds a cushion of boundary nodes (see Figure 1)
to the defined grid. Therefore, the 3-D model region you define will be fully spanned by
all velocity fields and interface surfaces.
3.2.2 Specifying the propagation grid
The third block of parameters in grid3dg.in is:
cccccccccccccccccccccccccccccccccccccccccccccccccccccccccccccc
c Set up propagation grid file
cccccccccccccccccccccccccccccccccccccccccccccccccccccccccccccc
propgrid.in c: Name of propagation grid file
21 41 41 c: Number of points in rad lat, long
5 10 c: Refine factor & no. of local cells
0.05 c: Cushion factor for prop grid (<<1)
These parameters don’t actually influence the model structure at all; instead, they define
what is known as the propagation grid for implicitly tracking seismic wavefronts using
fm3d. However, the reason why these parameters are defined here is that the propgrid.in
file required by fm3d needs the origin of the propagation grid and the propagation grid
spacing to be specified. Rather than try and enter this information manually in propgrid.in,
it is easier to specify it at this point to avoid inconsistencies. In theory, propgrid.in can
span a subset of the defined model, but grid3dg automatically scales the propagation
grid to the boundary of the complete model. The first line above defines the name of
the propagation grid file which is to be read in by fm3d (therefore, you should not need
to change this filename). The second line specifies the number of points defining the
propagation grid in depth, latitude and longitude. In this case, there are 21 propagation
grid nodes spanning a depth range from 1.5 km to -80.1 km, which results in a grid spacing
of 4.08 km.
16

It is important to understand the difference between the inversion grid and the
propagation grid. The inversion grid describes the model (via vgrids.in and interfaces.in)
- i.e. it represents the grid of velocity and interface control nodes (e.g. Figure 1) that
describes the velocity and interface variations (in terms of cubic B-spline functions). The
propagation grid, on the other hand, represents a discrete sampling of the velocity fields
(and implicitly the interface surfaces) for use by fm3d, which is a grid-based eikonal
solver. Thus, there is no relationship between these two grids. [If we were using ray
tracing instead of FMM to solve the forward problem, then we would not need to define
a propagation grid].
The third line in the above block of parameters defines the source grid refinement
parameters that are used to improve traveltime accuracy. When energy emanates from a
seismic point source, the curvature of the wavefront is very high, which means that the
underlying global propagation grid does not capture its true shape very accurately. It has
been shown that errors that arise from this effect in the source neighbourhood dominate
the total traveltime errors of FMM. In order to mitigate this problem, fm3d defines a
local cubic region of grid points about the source within which a much higher density of
propagation grid points is defined. When the wavefront impinges on the edge of this local
region, traveltimes are mapped back to the coarser global grid. This idea is illustrated
in Figure 4, which shows a schematic cross-section through a locally refined grid. The
refinement factor refers to the number of subdivisions of the global propagation grid; in
Figure 4, this value is 3. The number of local cells refers to the number of cells outward
from the source (in all three dimensions) that the refined region extends. In Figure 4,
this value is also 3. In the above block of parameters from the generic input file, the
refinement factor is set to 5, and the number of local cells is set to 10.
In general, care should be taken in choosing appropriate values for the refined region.
The propagation grid defined above has a dimension of 21×41×41 = 35, 301 nodes. The
refined grid is defined by a total of (50× 2)3 = 1, 000, 000 nodes, which means that most
of the computational effort is taken up by computing traveltimes in the source neighbour-
hood. In general, you will find that using a refinement factor of 5 and a cell number of 5
greatly decreases computing time (125,000 local nodes instead of 1,000,000), and does not
diminish accuracy very much. The final line of the above block of parameters defines a
so-called cushion factor for the propagation grid. This is a rather ad hoc parameter I have
included which makes sure that the propagation grid does not extend outside the actual
17

Figure 4: Schematic diagram showing the use of local grid refinement about the source
in order to improve traveltime accuracy. As soon as the wavefront hits the edge of the
refined grid, it is mapped back onto the coarser global propagation grid.
model bounds. I have found that fm3d can complain if the propagation grid extends
laterally right up to the boundary of the interface surfaces. This value defines by how
much the propagation grid should lie within the horizontal bounds of the model. Set it
to as small a value as possible (if it is too small, fm3d will complain).
3.2.3 Defining the velocity grids
The next step is to set up the velocity grids which define the model. For each layer that
is defined, there are four blocks of parameters that must be repeated. In the generic
example, the first block is:
cccccccccccccccccccccccccccccccccccccccccccccccccccccccccccccc
c Set velocity grid values for layer 1
cccccccccccccccccccccccccccccccccccccccccccccccccccccccccccccc
12 12 c: Number of radial grid points (type 1 & 2)
12 2 c: Number of grid points in theta (N-S)
12 12 c: Number of grid points in phi (E-W)
1 c: Use model (0) or constant gradient (1)
P c: Use P or S velocity model
18

ak135.vel c: Velocity model (option 0)
1 c: Dimension of velocity model (1=1-D,3=3-D)
5.4 4.0 c: Velocity at origin (km/s) (option 1)
7.0 5.0 c: Velocity at maximum depth (km/s) (option 1)
The first line specifies the number of grid points in radius. The reason why there are two
entries is that, as mentioned earlier, it is possible to have both a P-wave velocity field and
an S-wave velocity field independently defined in the same layer. If you specified (second
parameter line in file) that there is only one velocity grid type, then you only have to deal
with the left hand column of numbers. In this case, 12 grid points will span the depth
range of the model volume. The higher you make this number, the greater the detail that
can be described by the model (i.e. it will be able to resolve finer features). In general, it
is good practice to have this number much smaller than the corresponding propagation
grid number, otherwise the propagation grid will poorly represent the true velocity model,
which will introduce traveltime error.
The second and third lines in the above block specify the number of grid points in
latitude and longitude respectively. Note that the velocity grid for any layer actually
spans the entire model volume. This means that there is considerable redundancy in
their definition (unless the model is described by a continuous velocity field i.e. there
is only one layer). However, in practice this does not detrimentally effect computation
time, as only those nodes that lie within the layer are selected. The reason for defining
the model in this way, apart from simplicity, is that during an inversion, interfaces can be
perturbed in depth, in which case it is difficult to know in advance the actual grid extent
that is required. Although 12 nodes in depth, latitude and longitude have been specified
to define the velocities in layer 1, the actual number of nodes is 14, because cushion nodes
are automatically added (see Figure 1). As shown in Figure 2, a minimum of four nodes
in each dimension are required to define a cubic B-spline function, so you cannot specify
less than two grid points. The grid spacing in depth for the above parameter block is 7.4
km.
The remaining lines in the above block are related to the velocity values that are as-
signed to the grid nodes. As indicated on the fourth line, there are two options; to use
a specified model from an external file (option 0), or a simple constant velocity gradient
19

in depth (Option 1). In the former case, you can choose to use either P or S velocities
(as specified on the next line). If you decide to use a velocity model defined in an exter-
nal file, the the name of that external file must be entered on the 6th line. In this case
it is a 1-D velocity model (ak135). An example of how this file should be formatted follows:
-100.000 5.8000 3.4600
0.000 5.8000 3.4600
20.000 5.8000 3.4600
20.000 6.5000 3.8500
35.000 6.5000 3.8500
35.000 8.0400 4.4800
77.500 8.0450 4.4900
120.000 8.0500 4.5000
165.000 8.1750 4.5090
etc.
The first column indicates the depth below the surface, and the second and third columns
indicate the corresponding P and S velocities respectively at these depths. Note that on
the first row, the depth has been set to -100.0 km (i.e. 100 km above the surface); this is
to ensure that cushion boundary nodes (see Figure 1) will always have a value associated
with them. As long as you adhere to the above format, you can introduce whatever 1-D
velocity model you like. Note that it must span the complete depth range of the 3-D
model (including cushion boundary nodes).
If you would like to introduce 3-D velocity variations from an external file, then insert
the file name on line six of this parameter block, and set the value in the line below to
3, to indicate that we are now dealing with a 3-D input velocity model. This file must
have (nvr + 2) × (nvt + 2) × (nvp + 2) entries, where nvr, nvt, and nvp are the number
of velocity nodes in depth, latitude and longitude respectively (nnr = nnt = nnp = 12
in this case). Thus, your input file must in effect specify the complete velocity grid for
this layer, including the boundary nodes. Unfortunately, this requires some effort by the
user to properly grid their velocity field, but it would be very difficult to set up a more
sophisticated input scheme. When the grid is read in by grid3dg, the innermost loop is
20

over longitude and the outmost loop is over radius. The pseudo Fortran code associated
with this process is as follows:
DO i=0,nvr+1
DO j=0,nvt+1
DO k=0,nvp+1
READ velocity value
ENDDO
ENDDO
ENDDO
which means that there is only one velocity value per line. If you choose to read in
S-velocities (i.e. set line 5 to S), then you will need to append a list of S-velocities to the
end of the P-velocities (in exactly the same format). The velocity value at i = j = k = 1
corresponds to the point at the southwest corner of the model region at the base of the
box (i.e. maximum depth).
The final two lines in the above parameter block are only relevant if you chose the
constant velocity gradient option (i.e. set the field in line 4 to 1). The first column
represents velocities for the first velocity field, and the second column represents velocities
for the second velocity field, which are used only if you set the number of velocity grid
types to 2 (see entry two of the input file). The first value on the LHS (5.4 in this case)
refers to the velocity at the top of the model, and the second value on the LHS (7.0 in
this case) refers to the velocity at the bottom of the model. Linear interpolation between
these two values is used to define the complete velocity field.
Once the basic velocity field for a particular layer has been defined, it is possible to
superimpose several different types of laterally varying structures. These options are use-
ful for performing synthetic resolution tests, for example. The first class of structure that
can be superimposed is random velocity perturbations. The input parameter block that
controls this option is:
cccccccccccccccccccccccccccccccccccccccccccccccccccccccccccccc
c Optionally apply random structure to layer 1
21

cccccccccccccccccccccccccccccccccccccccccccccccccccccccccccccc
1 c: Add random structure (0=no,1=yes)
1.5 c: Standard deviation of Gaussian noise
1 c: Add a priori model covariance (0=no,1=yes)?
0.3 c: Diagonal elements of covariance matrix
The first option is a switch which allows the random structure to be turned off (0) or
on (1). The second option specifies the standard deviation of the Gaussian noise that
will be superimposed onto the velocity nodes. The third and fourth options are not
actually associated with the random noise specification. Rather, they allow the diagonal
elements of the a priori covariance matrix to be specified (only as a single constant
value). Essentially, this represents the a priori uncertainty (in km/s) associated with
each parameter value. This estimate is required by the inversion program, so should be
included if you are going to use the model as a starting model for the inversion. The
magnitude of this value is in itself not very significant, as it will trade off against the
damping parameter. However, its value relative to what may be specified for the other
layers and interfaces that are inverted for is significant.
The next parameter block allows a 3-D checkerboard pattern to be superimposed on
the layer velocity field:
cccccccccccccccccccccccccccccccccccccccccccccccccccccccccccccc
c Optionally apply checkerboard to layer 1
cccccccccccccccccccccccccccccccccccccccccccccccccccccccccccccc
0 c: Add checkerboard (0=no,1=yes)
1.5 c: Maximum perturbation of vertices
2 c: Checkerboard size (N×N×N)
1 c: Use spacing (0=no,1=yes)
The first option is a switch which toggles the checkerboard on (1) or off (0). The next
parameter sets the maximum perturbation of the velocity vertices. In this case, each
velocity value will be set to either v + 1.5 km/s or v − 1.5 km/s, where v is the velocity
of the grid node prior to the checkerboard pattern being superimposed. The third option
22

sets the checkerboard size. In this case, N = 2, which means that along any of the
three orthogonal directions, nodes will be perturbed in pairs (i.e. the first two set to
v + 1.5 km/s, the second two to v − 1.5 km/s etc.). Increasing the value of N increases
the size of each checkerboard element. Note that if you set N = 1, the amplitude of
the checkerboard will appear diminished; this is due to the non-interpolating nature of
cubic B-splines. The final parameter is a switch which indicates whether spacing should
be used between adjacent checkerboard elements. This spacing will be of size N . Thus,
rather than switching between positive and negative perturbations, there will be a gap of
N points which remain unperturbed if this switch is set to 1. Again, note that the non-
interpolating nature of cubic B-splines will mean that velocity field will not have exactly
zero perturbation at these points. Turning this switch on results in a lower density
checkerboard pattern.
The final parameter block for layer 1 introduces discrete “spikes” into the model if
they are required:
cccccccccccccccccccccccccccccccccccccccccccccccccccccccccccccc
c Optionally, apply spikes to layer 1
cccccccccccccccccccccccccccccccccccccccccccccccccccccccccccccc
0 c: Apply spikes (0=no,1=yes)
1 c: Number of spikes
2.50 c: Amplitude of spike 1
-15.0 -41.9 141.5 c: Coordinates of spike 1 (depth, lat, long)
The first entry switches the spikes on (1) or off (0). The second entry specifies the number
of spikes. The following pairs of lines (only one in this case as only one spike is specified)
sets the amplitude of the spike (can be positive or negative) and the coordinates of the
spike. If this option is turned on, grid3dg will find the nearest node to each specified
point, and will apply the perturbation indicated. Due to the smooth behaviour of cubic
B-spline functions, the resulting “spike” will not be a delta-like function; rather, it will
be more like a small blob.
Once the properties of the first layer have been defined, the four parameter blocks
shown above must be repeated for each subsequent layer. In the generic input file, there
23

are only two layers, which is why the four parameter blocks are only repeated once. For
M layers, they must be specified M times (and obviously in the correct order - from the
top to the bottom layer).
3.2.4 Defining the interface grids
Once the layer velocity fields have been specified, the next step is to define each of the
interface grids. If M layers have been specified, then there must be M +1 interfaces. The
top and bottom interfaces bound the velocity model; wavefronts may reflect from them,
but they cannot penetrate or transmit through them. The first parameter block sets up
the grid spacing:
cccccccccccccccccccccccccccccccccccccccccccccccccccccccccccccc
12 c: Number of grid points in theta (N-S)
12 c: Number of grid points in phi (E-W)
The first entry is the number of grid nodes in latitude, and the second entry is the number
of grid nodes in longitude. Note that grid3dg automatically adds cushion nodes, so the
total number of nodes defining the interfaces will be 14 × 14 = 196. As stated earlier,
one restriction of fm3d is that the horizontal grid node distribution for each interface
must be the same. The remaining parameter blocks for each interface closely resembles
the parameter blocks used for defining the layer velocities.
For interface 1, the first parameter block is:
cccccccccccccccccccccccccccccccccccccccccccccccccccccccccccccc
c Set up interface grid for interface 1
cccccccccccccccccccccccccccccccccccccccccccccccccccccccccccccc
0 c: Obtain grid from external file (0=no,1=yes)
interface1.z c: External interface grid file (option 1)
1.3 c: Height of NW grid point (option 0)
1.3 c: Height of NE grid point (option 0)
1.3 c: Height of SW grid point (option 0)
24

The first entry specifies whether the interface structure is to be obtained from an external
file or not. If the switch is set to 1, then the interface grid information will be read in
from an external file. As in the case of reading in a 3-D velocity grid, the interface grid
file must have an entry associated with each node (196 in this case), and must include
values for the cushion vertices. The pseudo Fortran code for reading in the external file is
DO i=0,nvt+1
DO j=0,nvp+1
READ interface depth value
ENDDO
ENDDO
which means that there is only one interface depth entry per line. The value at i = j = 1
corresponds to the depth of the surface at the southwestern corner of the model.
If option 0 is chosen, then grid3dg will construct the interface depths from the three
values provided in the third, fourth and fifth entries. These three values are used to define
a plane. If they are all set equal, then the interface will not vary in depth (it won’t be
exactly planar, due to the curvature of the coordinate system). In the above case, the
top surface is set to 1.3 km above the Earth’s surface; note that this is slightly below the
top of the velocity grid, which is set at 1.5 km height (the top surface should always be
just slightly below the top of the velocity grid). By varying these three values, a dipping
plane of arbitrary orientation can be specified. Note that if adjacent interfaces intersect
each other, grid3dg will attempt to apply a correction.
The second, third and fourth parameter blocks have more or less exactly the same
form as the corresponding blocks which define the velocity field. The only real difference
is that we are now dealing with a surface rather than a volume. In this case, the random
structure will be applied to the interface depths. As in the case of the velocity fields, an
estimate of a priori model covariance is required if the model is to be used as an initial
model in a tomographic inversion. Each of the four parameter blocks must be repeated
for each interface, and if there are M layers, there must be M + 1 interfaces (three in
this example). The bottom interface should at least lie slightly above the bottom of the
model.
Once you have edited grid3dg.in to your satisfaction, you can go ahead and execute
25

grid3dg. It will produce three files: vgrids.in, interfaces.in and propgrid.in. These files
must be placed in the same directory that you execute fm3d or tomo3d from.
4 Solving the forward problem with fm3d
fm3d is used to solve the forward problem of traveltime prediction, and also computes the
Frechet derivatives that are used in the gradient based inversion procedure. A detailed
discussion of how fm3d works will not be given here, as it is a separate stand-alone code
with its own set of instructions (see the file README 0.7 in the subdirectory fmcode/).
The input files required by fm3d are as follows:
• mode set.in: This file sets some basic parameters for fm3d, including whether
to save ray paths, generate OpenDX output files etc. If you look at the default
mode set.in file in source/inputfiles/, you will see that a lengthy explanation of each
entry is given. For use with FMTOMO, I would recommend setting file mode to
false and no pp mode to true. Saving ray paths takes a lot of disk space, especially
for large problems, so don’t do so unless you want to visualize them. If you have
access to a cluster, then you may want to turn on parallel mode. display mode is
only useful if you would like to visualize interfaces and rays using OpenDX. The final
option, save timefields mode, saves specified time fields to file. This may be useful
if you want to perform non-linear hypocenter relocation with your own inversion
code, but is not needed for FMTOMO. Note that if you set this option to true, then
you will also need to provide an additional input file called gridsave.in.
• frechet.in: This file specifies which parameters are to be inverted for, so that fm3d
knows which Frechet derivatives to compute. If the first entry is set to zero, then no
Frechet derivatives will be computed. When using fm3d in forward mode, this file
will still be read in by the code. How this file can be created for use with FMTOMO
will be described in the next section.
• interfaces.in: Specifies the structure of all the interfaces that describe the input
model. The generation of this file was discussed in the previous section.
• proppgrid.in: Defines the propagation grid (the sampling of the velocity model)
used by fm3d to evolve the wavefront using finite difference solution of the eikonal
26

equation. The construction of this file was described in the previous section.
• vgrids.in: Specifies the velocity field in each layer of the input model. The gener-
ation of this file was discussed in the previous section.
• receivers.in: Lists all the receiver coordinates and their association with each
source. How one may construct this file will be described later in this instruction
manual.
• sources.in: Lists all the sources and their associated path signatures (the phase
types produced by each source). The construction of this file will be described later.
Once all of these files are present in a given directory, then fm3d can be executed
from the command line. As it runs, fm3d provides quite verbose screen output, which
can be rather hard to follow in real time. If you wish, you can always redirect this output
to file with the appropriate shell command (e.g. fm3d >! filename.txt). The two output
files produced by fm3d that the inversion step requires are:
• arrivals.dat: This file essentially lists all of the source-receiver traveltimes that
have been requested, along with some other information. Refer to the README 0.7
in the subdirectory fmcode/ for more information.
• frechet.dat: Contains all the Frechet derivatives requested by frechet.in.
When you use FMTOMO to run a tomographic inversion, you do not need to run
fm3d separately, as the tomo3d script will do this for you. However, if you want to
construct a dataset for a synthetic resolution test (for example), then you will need to
run fm3d by itself.
5 Solving the inverse problem with invert3d
The inverse problem involves adjusting the model parameter values (i.e. interface depth,
velocity, hypocenter location) in order to try and satisfy the data observations (source-
receiver traveltimes), subject to any imposed regularization. The program invert3d uses
a subspace inversion method to solve this problem. Subspace inversion is a gradient
based technique, and therefore requires Frechet derivatives (which fm3d provides). The
27

objective function which invert3d minimizes in order to solve the inverse problem has
the form:
S(m) =1
2[Ψ(m) + ǫΦ(m) + ηΩ(m)]
where ǫ is referred to as the damping factor and η as the smoothing factor. The vector m
represents the model vector of unknowns that are adjusted during the inversion process.
The first term on the RHS of the above equation is defined by:
Ψ(m) = (g(m) − dobs)TC−1
d (g(m) − dobs)
where Cd is a data covariance matrix. Here, g(m) represents the traveltime predictions
associated with the model defined by m. Thus, Ψ(m) is minimized when the model
traveltimes g(m) most closely resemble the observed traveltimes dobs. The data errors
are assumed to be uncorrelated, in which case Cd = [δij(σj
d)2] where σj
d is the uncertainty
of the jth data point.
A common problem with tomographic inversion is that not all model parameters will
be well constrained by the data alone (i.e. the problem may be under-determined or
mixed-determined). To help combat this problem, several regularization terms are added
to the objective function. The first term Φ(m) is defined by
Φ(m) = (m− m0)TC−1
m (m −m0)
where Cm is an a priori model covariance matrix. Uncertainties in the initial model are
assumed to be uncorrelated, so Cm = [δij(σjm)2] where σj
m is the uncertainty associated
with the jth model parameter of the initial model. The effect of Φ(m) is to encourage
solution models m that are near a reference model m0 (in this case the starting model).
The values used in Cm are usually based on prior information.
Another approach to regularisation is the minimum structure solution which attempts
to find an acceptable trade-off between satisfying the data and finding a model with the
minimum amount of structural variation. This can be implemented by defining Ω(m) as:
Ω(m) = mTDTDm
where Dm is a finite difference estimate of a specified spatial derivative. Here, D is the
second derivative operator, so Ω(m) reduces in size as the model becomes more smooth.
The two tuning parameters in the objective function, ǫ and η, govern the trade-off
between how well the solution mest will satisfy the data, how closely mest is to m0, and
the smoothness of mest.
28

The input parameter file associated with invert3d is invert3d.in, a generic copy of
which can be found in source/inputfiles/:
ccccccccccccccccccccccccccccccccccccccccccccccccccccccccccccccccccccccc
c This file contains all required input parameters and files for the
c inversion program ”invert3d.f90”
ccccccccccccccccccccccccccccccccccccccccccccccccccccccccccccccccccccccc
vgridsref.in c: Reference velocity grid
vgrids.in c: Current velocity grid
interfacesref.in c: Reference interface grid
interfaces.in c: Current interface grid
sourcesref.in c: Reference source coords
sources.in c: Current source coordinates
stimes.dat c: Current source time perturbations
receivers.in c: Receiver coordinates
otimes.dat c: Observed traveltimes
mtimes.dat c: Model traveltimes
rtimeso.dat c: Reference teleseismic traveltimes
frechet.in c: Frechet derivative parameters
frechet.dat c: Frechet derivatives
inviter.in c: File indicating current inversion step
propgrid.in c: File containing propagation grid parameters
0.07 c: Minimum distance between interfaces (km)
0.5 c: Minimum permitted velocity (km/s)
1 c: Remove mean from predicted teleseisms (0=no,1=yes)
0 1.0 1.0 c: Velocity inversion (0=no,1=yes),damp,smooth
1 0.1 1.0 c: Interface inversion (0=no, 1=yes),damp,smooth
0 1.0 1.0 c: Source inversion (0=no, 1=yes),damp1,damp2
20 c: Subspace dimension (max=50)
1.0 c: Global damping factor (epsilon)
1 c: Apply second derivative smoothing (0=no,1=yes)
1.0 c: Global smoothing factor (eta)
29

6371.0 c: Earth radius in km
The first and third entries of this file specify the initial or starting velocity (vgridsref.in)
and interface grids (interfacesref.in) for the inversion. These can be constructed using
grid3dg (you will have to rename the default output files). After invert3d is executed,
it will write the updated interface and velocity grid files to vgrids.in and interfaces.in. Since
source locations can also be inverted for, invert3d requires a reference source input file
called (sourcesref.in). Updated source locations will be written to sources.in. Note that
all three reference files are required, even if one or more of the parameter types are not
inverted for (i.e. you must provide vgridsref.in, interfacesref.in and sourcesref.in), in which
case the corresponding output file will simply be a copy of the reference input file (e.g. if
you do not invert for source location, then sourcesref.in and sources.in will be identical).
The output file called stimes.dat stores the time perturbations associated with each
source hypocenter that is inverted for. Thus, if invert3d deems that the source origin
time is late by λ seconds, then λ will be written to stimes.dat for that source. This assumes
that the a priori traveltimes are equal to the receiver arrival time minus the a priori origin
time.
The input receivers.in file lists the receiver locations. The vector of observed traveltimes
dobs is given in the file otimes.dat. How this file can be produced from your pick files is
described later. Traveltimes and their associated errors are listed in the same order as the
output traveltime file produced by fm3d (arrivals.dat). The vector of model traveltimes
g(m) is given in the file mtimes.dat. It is simply the file (arrivals.dat) produced by fm3d
for the current model, that has been renamed to mtimes.dat.
The next file, rtimeso.dat, describes the reference model traveltimes for teleseisms. For
teleseismic events, it is assumed that the traveltime information input into otimes.dat is in
the form of arrival time residuals, which are equal to the arrival times minus the predicted
arrival times from a global reference model. In addition, arrival time residuals associated
with each source usually have their means removed, which makes them relative arrival
time residuals. Since fm3d computes the total traveltimes from source to receiver, for
teleseisms, we need a set of predicted reference traveltimes in order to compute model
arrival time residuals. This is provided by rtimeso.dat. By default, tomo3d will produce a
file called rtimes.dat, which represents the traveltimes through the reference model defined
30

by interfacesref.in and vgridsref.in. In many cases, it is o.k. to use this file to provide the
reference model traveltimes. However, if the observed residuals includes a contribution
from topography which has not been accounted for, you may want to create your own
rtimes.dat file (in which case you must relabel it to rtimeso.dat or something so that it
doesn’t get overwritten by tomo3d) which is computed with all station elevations set to
zero. It is acknowledged that this approach to matching observed residuals is perhaps not
the most self-consistent, as it would be best to use the same reference model predictions
for both the observations and the model predictions. In the end, it makes little difference,
but if you want to be technically correct, you could just compute your observed residuals
by using the predictions provided by rtimes.dat.
The next two input files, frechet.in and frechet.dat are the input and output Frechet
derivative files used by fm3d. inviter.in simply contains one integer which defines the
current iteration number of tomo3d. This is required for housekeeping purposes (it tells
invert3d whether we are dealing with the first or some later iteration). The final file
that is listed, propgrid.in, is the propagation grid file used by fm3d.
Following the list of files, invert3d.in specifies the minimum allowed distance between
adjacent interfaces. This is similar to the specification in grid3dg.in, and limits how
close interfaces can come together. A limit can also be set on the minimum permitted
velocity. Particularly in regions of low velocity (e.g. volcanic caldera or uncompacted wet
sediment), uncertainties in traveltime picks and other factors may result in near zero or
negative velocities, which may cause fm3d to fail (quite understandably so).
The next parameter indicates whether the mean should be removed from the predicted
teleseismic residuals (if they are present) on a source-by-source basis. In most case,
observed residuals have their means removed to account for errors in source location and
broad-scale structure outside the model region. However, removing the mean from the
predicted dataset can often make little difference in this case, because the average vertical
variations in structure are usually preserved when teleseismic data are inverted. When
combined with other classes of data, it may be more necessary to remove the mean from
the model data.
The next three lines allows the user to choose whether to invert for velocity structure,
interface structure and/or source location. In the first two cases, damping and smoothing
factors can be specified for the velocity fields and interface surfaces. If different damping
is needed for different layers and interfaces, then this should be accomplished via the a
31

priori model covariance matrix. The damp1 and damp2 factors associated with the source
inversion refer to the damping of the spatial and temporal locations of the hypocenter
respectively. More refinement as to which velocity, interface and source parameters are
inverted for can be achieved by editing the frechgen.in file. This will be discussed shortly.
The next parameter sets the subspace dimension. Subspace inversion works by re-
stricting the minimization of the quadratic approximation of the objective function S(m)
to an n-dimensional subspace of model space; thus, the perturbation δm is restricted to
occur in the space spanned by a set of n orthogonal basis vectors. In the generic input
file, the subspace dimension is set to 20. Increasing this value can potentially improve
convergence, but at greater computational cost. In practice though, it is difficult to gen-
erate a large number of linearly independent search directions that significantly influence
the objective function, so there is not a lot of point in making this value very large. In
any case, SVD (singular value decomposition) is used to identify basis vectors that are
not independent and discards them anyway. Therefore, you could set n = 50 (maximum
allowed value) and not lose much in computational cost.
The next parameter is described as the “global damping factor”, which is ǫ in our
definition of the objective function. This simply pre-multiplies each of the damping fac-
tors that have been defined separately for the velocity, interface and source inversions.
Likewise, one can set a global smoothing factor, which pre-multiplies the interface and
velocity specific smoothing factors. A separate switch is provided for turning the second
derivative smoothing off and on. Note that the specification of the Earth radius (last line)
should be consistent with previous specifications (e.g. in grid3dg.in).
Although the invert3d.in file allows one to choose whether to invert for velocity struc-
ture, interface geometry, and/or source location, it does not offer the option of only invert-
ing for a subset of, for example, source locations, or velocity layers. This can be achieved
via the frechgen program, which constructs the frechet.in file. The input file used by
frechgen is called frechgen.in, a generic copy of which can be found in source/inputfiles/.
In determining which parameters are to be constrained in the inversion, frechgen actually
consults both invert3d.in and frechgen.in; therefore, frechgen should always be executed
whenever one of the three inversion parameters in invert3d.in is adjusted. The generic
frechgen.in file is constructed as follows:
32

invert3d.in c: Input file for invert3d
frechet.in c: File specifying derivatives for fm3d
vgridsref.in c: File containing reference velocity grid
sourcesref.in c: File containing reference source locations
-1 c: Velocity derivatives (>0=subset, -1=all)
1 c: If all, type 1 (1), type 2 (2) or both (3)
2 c: Indices of velocity grids (if subset chosen)
1 c: Velocity types for inversion (1 or 2)
1 c: Interface derivatives (>0=subset, -1=all)
2 c: Indices of interface grids (if subset chosen)
-1 c: Source derivatives (>0=subset, -1=all)
sourcederivs.in c: File specifying sources for inversion (if subset chosen)
The first entry simply specifies the default input parameter filename of invert3d. The
second entry is the name of the output file produced by frechgen, which becomes the
Frechet parameter input file to fm3d. The third and fourth files contain the reference
velocity grid and source locations. The next four lines select the velocity fields that are
to be constrained in the inversion. If on line 5, the switch is set to -1, then the velocity
parameters in all of the layers are selected. If a subset of m layers is to be inverted for,
then m should be entered in the place of -1. On line 6, it is possible to specify which type
of velocity field is used. This switch only gets activated if the switch on the line above
is set to -1. If there is only one type of velocity field present (P or S), then this switch
should be set to 1. If both P and S are present, then setting this switch to 1, 2 or 3 will
result in the selection of P, S or both P and S velocity fields respectively.
The next two parameters are activated when only a subset of the velocity fields is
chosen. For example, if for some model, the velocities in layers 2, 3, 5, 6 are to be
inverted for, then m = 4, and line 7 should read 2 3 5 6. Line 8 then lists the
velocity types associated with these four layers that are to be constrained. If there is only
one velocity type present (P or S), then line 8 should read 1 1 1 1 . The specification
for interfaces is similar to that of velocity; the entry on line 9 indicates whether all (-1) or
some subset (m) of the interfaces are to be inverted for. In the latter case, the m interfaces
are listed on the line below. For example, if interfaces 2 and 4 are to be constrained by
33

the inversion, then m = 2 and line 10 should read 2 4.
The final two lines control which sources are relocated. If the second last line is set
to -1, then all sources are selected. Otherwise, a subset of sources, listed in the file
sourcederivs.in will be relocated. The reason that this information is kept in an external
file is that the subset of m sources may be quite large (e.g. 100s). If you do not wish
to edit this file by hand, the programs moddata and obsdata, described in subsequent
sections, gives you the option of generating sourcederivs.in.
The input files invert3d.in and frechgen.in provide a two-level hierarchy for determining
which parameters become unknowns in the inversion. invert3d.in allows you to activate
or deactivate each parameter class. For example, if you do not want to invert for velocity
structure, then set the velocity inversion switch in invert3d.in to 0. This will over-rule any
velocity parameter directive contained in frechgen.in. However, if the velocity inversion
switch is set to 1, then frechgen.in will determine which layers are inverted for. Prior to
running invert3d, the program frechgen should be executed.
Note that the tomo3d script automatically runs frechgen prior to the first iteration,
so all you need to do is make sure that you have edited invert3d.in and frechgen.in to suit
your requirements. In general, when using the FMTOMO package, there should be no
need to run invert3d as a stand alone program, as the tomo3d script will carry out this
step automatically.
When invert3d is executed, it produces very minimal screen output; if it works cor-
rectly, it will generate something like:
Due to redundancy, the subspace dimension
is being reduced from 20 to 15
Message from SVD orthogonalization algorithm
PROGRAM invert successfully completed!!
The first three lines may or may not be produced, depending on whether the SVD or-
thogonalization algorithm identifies any redundant search directions.
34

6 Constructing a tomographic solution model with
tomo3d
tomo3d is a relatively simple shell script that sequentially executes fm3d and invert3d
to iteratively minimize the objective function S(m). Re-running fm3d after each inver-
sion iteration ensures that the non-linearity of the inverse problem is taken into account.
The input file used by tomo3d is called tomo3d.in, a generic copy of which can be found
in source/inputfiles/:
6
0
0
The first entry simply sets the number of inversion iterations that are to be executed. If
this number is set to some value p, then fm3d will be executed p+1 times, and invert3d
will be executed p times. This occurs because fm3d will be executed first (traveltimes
through initial model) and last (traveltimes through final model). If you run the inversion
process for p iterations, and then decide you would like to run it for a set of additional
iterations, then set the second entry to 1. If you do this, then you will need to specify
(line 3) whether tomo3d begins by executing invert3d (option 0) or fm3d (option 1).
In most cases, you should set this to 0, because tomo3d will have computed traveltime
predictions for the previous solution model.
tomo3d can be executed from the command line like any of the other programs. All
of the programs it uses will be executed in the current directory, so the relevant input
files must be present. When tomo3d is executed with line 2 of tomo3d.in set to 0, it will
start off by copying vgridsref.in to vgrids.in, interfacesref.in to interfaces.in and sourcesref.in
to sources.in. It will then create the frechet.in file by executing frechgen. fm3d will
then be run in order to generate traveltimes and Frechet derivatives for the initial model.
After this has completed, the output arrivals.dat file will be copied to mtimes.dat, and
traveltime residuals for this model will be generated by the program residuals, and
stored in residuals.dat. invert3d and fm3d will then be executed in sequence a total of p
times, with residuals computed at the end of each iteration, and appended to residuals.dat.
35

The generic input file residuals.in (see sources/inputfiles/) for the program residuals
has 5 entries:
otimes.dat c: Observed times
mtimes.dat c: Model times
sourcesref.in c: Source file
rtimeso.dat c: Reference teleseismic times
invert3d.in c: Inversion parameters (indicates if mean is
to be removed from teleseismic
traveltimes)
None of these filenames should be changed, with the possible exception of the entry on
the 4th line. This specifies the reference teleseismic times, which by default is rtimes.dat
(tomo3d will automatically construct this file from the initial model traveltimes). If you
want to use rtimes.dat as computed by tomo3d, then you should edit line 4 accordingly.
When residuals is executed, traveltime residual information is written to screen (tomo3d
redirects this output to residuals.dat). The three values it produces are, in order from left
to right, RMS traveltime residual (in milliseconds), variance (in seconds2), and χ2 (which
is dimensionless).
For most problems, the vast majority of computing time will be taken up running
fm3d; even for problems with large numbers of unknowns, invert3d executes very rapidly.
The verbose screen output generated by fm3d is automatically redirected by tomo3d to
a file called fm3dlog.out. Thus, the only screen output will be generated by invert3d.
Therefore, do not be alarmed when you do not immediately see screen output when you
execute tomo3d; fm3d will have to run first with the initial model before invert3d is
executed and produces screen output.
The input files that must be present in the directory from which you execute tomo3d
are:
• frechet.in
• frechgen.in
• interfacesref.in
36

• invert3d.in
• mode set.in
• otimes.dat
• propgrid.in
• receivers.in
• residuals.in
• sourcesref.in
• tomo3d.in
• vgridsref.in
Two additional files may also be needed:
• rtimeso.dat: Required if reference model teleseismic traveltimes are not computed
from the initial model (filename doesn’t have to be rtimeso.dat in this case). If they
are to be computed from the initial model, then tomo3d will automatically generate
rtimes.dat. Obviously, rtimes.dat or rtimeso.dat are only required if teleseismic data
are considered.
• sourcederivs.in: Required only if a subset of sources are going to be relocated.
7 Data input
The data required by the FMTOMO package in order to produce a solution model from
some given initial model are the two point traveltimes and associated phase information
(path signatures) for a given set of sources and receivers. All of this information is
contained in the three files sourcesref.in, receivers.in and otimes.in. The format of these
files is exactly that of the files sources.in, receivers.in and arrivals.dat respectively, which are
used by fm3d (although we do add a column to sourcesref.in and otimes.in which indicates
the uncertainty associated with source location and traveltime picks). As such, the exact
format of these files will not be described here, as they can be found in the README 0.7
file located in fmcode/. However, before examining two programs for generating these
input files, the concept of path signatures, as used by fm3d, will be explained.
37

7.1 Path signatures
In continuous media, the only type of phase that can be tracked by fm3d is the direct
first arrival. However, when interfaces are present, a wide variety of other phases can be
tracked. At any interface, an impinging wavefront can produce a transmission, a reflection
or a mode conversion (P-S or S-P). When requesting the traveltime between any source
or receiver from fm3d, the associated path signature, which describes the interaction of
the wavefront with any interfaces that are present, must be specified.
Source
TeleseismicsourceRay ID Path signature
0 1
0 2 2 1
0 2 2 3 3 2 2 1
0 2 2 3 2 1
4 3 3 2 2 1
0 2 2 3 3 4 4 3 3 4 4 3 3 2 2 1
Interface 1
Interface 2
Interface 3
Interface 4
1 2 3 4
2
1
3
4
5
6
5 6
Figure 5: Schematic diagram demonstrating the path signature format used by fm3d to
describe phases. In this case, all receivers lie in layer 1, but this need not be the case in
general.
fm3d expects the path signature to be defined as a string of integer pairs, which
describes the propagation of the wavefront between two interfaces (the multi-stage FMM
tracks wavefronts from one interface to the next; at each interface, the FMM procedure
is reinitialized). When beginning from a point source, the first number will be 0. To
complete the first integer pair, the second number will either be the number of the top or
bottom interface which bounds the layer in which the source resides. For subsequent steps,
38

the first number is the starting interface and the second number is the other bounding
interface. Remember that interfaces are numbered starting at the surface and increase
downwards.
If two equal numbers are entered as an integer pair, then fm3d assumes that a min-
imax phase is requested (a double bounce like PP), and performs reflection matching.
FMTOMO has not been tested with this type of phase. Examples of several different ray
paths and their associated path signature are shown in Figure 5.
7.2 Constructing synthetic datasets with moddata
moddata is a program designed to produce sources.in and receivers.in with relatively
simple input provided by the user. It does not produce an otimes.dat file, and as such,
is best used for purely synthetic tests (e.g. Examples 1 and 2). The main restriction of
this program is that it assumes that a path exists for every source-receiver pair. These
limitations may make you wonder why you would want to use moddata, but it turns out
to be a useful tool for examining what kind of path coverage and hence resolving power
a particular source-receiver configuration may produce. Also, purely synthetic tests like
Example 1 and 2 are interesting in their own right, as they allow one to investigate the
capabilities of the package.
The input file required by moddata is called moddata.in. A generic copy of this pro-
gram can be found in sources/inputfiles/. The first block of this input file contains the
following:
cccccccccccccccccccccccccccccccccccccccccccccccccccccccccccccccccc
c Input file for generating source and receiver files
c for use by 3D FMM code. Every receiver must
c detect a traveltime from every source.
cccccccccccccccccccccccccccccccccccccccccccccccccccccccccccccccccc
sources.in c: Output source file
receivers.in c: Output receiver file
sourcederivs.in c: Output source derivative file
arraygen.out c: Input receiver file
2 c: Number of input source files
39
The first two entries specify the source (sources.in) and receiver (receivers.in) files that
will be created by moddata. These files can then be used as input files for fm3d. The
next entry, sourcederivs.in, is the name of the output file that identifies those sources that
are to be inverted for. This file is required by tomo3d if a subset of sources are to be
relocated. The last file on this list is the receiver input file. All this contains is the number
of receivers (top line), and on each subsequent line, the latitude, longitude and depth of
each receiver (negative values are above the surface). For example:
100
-41.70000 138.3000 -1.000000
-41.70000 138.6778 -1.000000
-41.70000 139.0556 -1.000000
-41.70000 139.4333 -1.000000
-41.70000 139.8111 -1.000000
etc.
The last line of the first parameter block specifies the number of input source files (in this
case 2). The reason for having different source files is that it allows you to distinguish
between, for example, local sources (which you may want to relocate), teleseismic sources
and explosive sources. You can specify as many different source files as you like.
The second block of parameters contains the following:
cccccccccccccccccccccccccccccccccccccccccccccccccccccccccccccccccc
c First input source file and associated path information
cccccccccccccccccccccccccccccccccccccccccccccccccccccccccccccccccc
sourceswa.in c: Input source file
0 c: Local (0) or teleseismic sources (1)
0 c: Compute source derivatives (0=no, 1=yes)
2 c: Number of paths from these sources
2 c: Number of path segments for path 1
40

c: Path sequence information plus velocity fields below
0 2 2 1
1 1
1 c: Number of path segments for path 2
c: Path sequence information plus velocity fields below
0 1
1
The first entry is the name of the source input file. It has been named sourceswa.in to
indicate that these sources generate wide-angle paths (refractions and wide-angle reflec-
tions from explosive sources). This file has exactly the same format as the receiver file,
except that an additional three column of numbers must be included if the sources are
going to be relocated. For example:
30
-41.50000 138.5000 0.000000 0.2 0.2 10.0
-41.50000 140.0000 0.000000 0.2 0.2 10.0
-41.50000 141.5000 0.000000 0.2 0.2 10.0
-40.50000 138.5000 0.000000 0.2 0.2 10.0
-40.50000 140.0000 0.000000 0.2 0.2 10.0
etc.
Thus, the top number is the number of sources in the file, and the first three numbers from
left to right give the latitude, longitude and depth (negative is above the surface) of each
source. The last three numbers of each row specify the a priori uncertainty associated
with the latitude, longitude and depth of each source respectively. In the case of active
sources which don’t need to be relocated, the last three column of numbers will be ignored.
The second entry in the parameter block is a switch which indicates whether we are
dealing with local (0) or teleseismic (1) sources. Local sources must lie within the model
volume, while teleseismic sources must lie outside the model volume. If teleseismic sources
are specified, then the input source file has a slightly different format: on the line below
each source location, the phase type must be specified (e.g. P, ScP, PP, PKiKP etc.).
41
Note that this is not related to the path signature specification discussed above, because
these phases are tracked to the edge of the model region prior to the implementation of
FMM. An example of a source file for teleseisms is given below:
12
-33.00 80.00000 33.0000
P
-13.0 190.0000 33.0000
P
-30.0 180.0000 33.0000
PcP
10.0 100.0000 33.0000
P
etc.
a priori source uncertainty estimates are not required in the case of teleseismic events,
because they cannot be relocated.
The third entry of the second parameter block indicates whether source derivatives
should be computed. If this is set to 1, then the i.d. of all the sources in this file are
written to sourcederivs.in. Thus, if only a subset of sources are relocated, then this output
file can be used with frechgen.in.
The fourth entry indicates the number of paths that are to be tracked from these
sources. You can use any number you like; for q path types, the four input lines following
the specification of q on line 4 must be repeated q times. In this case, there are two
path types, so 8 lines follow. For each path type, the number of path segments must be
specified. The first path contains two segments, the path signature of which is given by
0 2 2 1, which corresponds to a simple reflection if the source lies in layer 1. For
each ray segment, the velocity type must be specified in the line below. If the velocity
model only specifies one type of velocity (P or S) within the relevant layer, then this should
be set to 1. Mode conversions can be obtained by setting consecutive entries to different
values (e.g. [1 2] gives a P-S conversion, and [2 1] gives an S-P conversion) provided
two velocity fields have been defined for the corresponding layers. For p path segments,
42

the path sequence must contain p pairs of integers, and the velocity field specification
must contain p integers. The second parameter block must be repeated for every input
source file that is specified.
When moddata is executed, it will produce sources.in, receivers.in and optionally sourced-
erivs.in. These can then be copied to the directory from which tomo3d is to be run.
A very simple program called arraygen has been provided which generates a square
grid of evenly spaced sources or receiver locations. A generic input file arraygen.in can be
found in sources/inputfiles/:
arraygen.out c: Output file name
-32.0 -34.0 c: N-S bounds of grid
138.5 141.5 c: W-E bounds of grid
0.0 c: Depth of receiver grid
10 10 c: Number of receivers in lat and long
The first entry is the name of the output receiver (or source) file. The next two entries
specifies the horizontal bounds of the square grid of points that will be generated. The
fourth entry specifies the depth of the point (negative is above the surface), and the last
entry specifies the number of points in latitude and longitude (10 × 10 = 100 points in
total). Although of limited value, arraygen may be of some use if you want to span a
region with a rectangular array of receivers, for example.
7.3 Including observational data with obsdata
Although moddata is useful in some cases, generally one wants to convert their database
of picked traveltimes into a format suitable for input into FMTOMO. The program ob-
sdata offers one possible route for achieving this. In many ways obsdata is similar to
moddata, but has some additional flexibility built in. The input file to obsdata is called
obsdata.in, a generic version of which can be found in sources/inputfiles/. The basic format
of this file is the same as moddata.in, with the exception of the first parameter block:
cccccccccccccccccccccccccccccccccccccccccccccccccccccccccccccccccc
43

c Input file for generating source and receiver files
c for use by 3D FMM code. Will also generate traveltime
c file if required.
cccccccccccccccccccccccccccccccccccccccccccccccccccccccccccccccccc
sources.in c: Output source file
receivers.in c: Output receiver file
sourcederivs.in c: Output source derivative file
picks/ c: Directory containing input receiver files
2 c: Number of input source files
1 c: Extract traveltimes (0=no, 1=yes)
otimes.dat c: File containing extracted traveltimes
The fourth entry specifies a subdirectory which contains all of the receiver input files
(which contain traveltimes measured from recordings at each receiver). The format of
these files will be described below. The last two entries are related to constructing a
list of observed traveltimes. If the traveltime extraction specification is set to 1, then all
traveltimes will be read in from the files contained in picks/ and written to otimes.dat.
This file can then be used as the input to tomo3d.
The input source files read in by obsdata have a very different format to those read
in by moddata. An example of an input file containing local sources (explosions for
wide-angle data) is given below:
16
-41.742333 145.093333 -0.200
1
1 1 pick04.9pm
-41.195666 144.818667 -0.139
3
1 1 pick05.8pm
1 1 pick05.9pm
3 2 pick05.8pg
etc.
44
The first line contains the number of sources. For each source, the coordinates are given
as latitude, longitude and depth in km (negative values are above the surface). For a
particular source, the number of associated pick files are then specified. In the above
example, source 1 has one pick file, and source 2 has three pick files. Following this
specification, the name of each pick file is listed below. These pick files must be located in
the subdirectory picks/, which is specified in entry 4 of obsdata.in. In each row containing
the name of a pick file, the filename is preceeded by two integers. The first integer specifies
which path from the source these picks are associated with. This information is provided
in obsdata.in (the “number of paths from these sources” entry associated with each source
input file). In the above example, at least 3 path types must have been defined for this
source file, because the third pick file of source 2 is associated with path type 3. In the
generic obsdata.in file described above, the first path is a PmP phase, the second a Pn
phase, and the third a Pg phase. You can see that the pick file name extensions given
above correspond to these phases. The second integer simply indicates that, of the total
number of different phase types for a particular source, where a particular pick file sits on
this list. For example, source 2 has two out of a possible three phase types, and although
the third pick file corresponds to path type 3, it is only the second type of phase for this
source.
As pointed out in the previous section, if source relocation is to be carried out, then
the input source file must contain uncertainty estimates for each source coordinate. These
values are appended to each source location. For example, if a local earthquake source
has an initial location at, say, (42±0.2 S, 140±0.2 W, 33±20 km depth), the source line
would be entered as:
-42.0 220.0 33.0 0.2 0.2 20.0
where the last three entries represent the uncertainty in latitude (in degrees), longitude
(also in degrees), and depth (in km) respectively.
The format of the traveltime pick files for local sources is relatively simple, as shown
in the example below:
45
22
-42.5010778 148.304078 0. 15.6749245 0.117747625
-42.4852975 148.315989 0. 15.9046817 0.130464375
-42.4718477 148.327002 0. 16.1281673 0.141703125
-42.4550508 148.342275 0. 16.3976353 0.11687775
-42.4419621 148.354095 0. 16.599588 0.12822025
-42.4276707 148.366749 0. 16.8457135 0.119055
-42.4138321 148.379216 0. 17.0651105 0.115553
etc.
The first entry specifies the number of picks contained in the file. This is followed by a
traveltime pick list. From left to right, each line contains the receiver coordinate corre-
sponding to the pick (latitude, longitude, depth), the picked traveltime (in seconds), and
some estimate of uncertainty associated with the pick (also in seconds).
When teleseismic sources are used instead of local sources, the format of both the
input source file and the traveltime pick file is slightly different. An example input source
file for teleseisms is given below:
110
1 1 ts0761933.ttr
1 1 ts0762143.ttr
1 1 ts0772224.ttr
1 1 ts0782214ScP.ttr
1 1 ts0782214.ttr
1 1 ts0810910.ttr
1 1 ts0810922.ttr
etc.
The difference between this file and the example input file for local sources given above
is that the source location is not specified. This is because the teleseismic source location
has been included in the associated pick file. An example pick file for teleseismic events
46

is given below:
64
-20.52 162.18 33.
P
-40.9743 145.1336 -0.166 -0.16640625 0.0754
-41.0399 145.2852 -0.276 -0.11640625 0.0616
-41.094 145.4457 -0.278 -0.06640625 0.0488
-41.1135 145.6235 -0.307 0.03359375 0.0908
-41.1899 145.7724 -0.289 0.08359375 0.0479
-41.246 145.893 -0.397 -0.01640625 0.0623
-41.3242 146.097 -0.45 -0.06640625 0.0634
etc.
The first line of this file specifies the number of teleseismic picks associated with this
source. The second line gives the teleseismic source coordinate. Note that you cannot
relocate teleseismic sources, so there is no need to include uncertainty estimates. The
third line specifies the global phase associated with the picks. Most common phase types
can be used (e.g. P, PP, ScP, PcP, PKiKP etc.). The list of entries that follow provides the
pick information for each receiver in the form of the location (latitude, longitude, depth
[negative values are above the surface]), the associated traveltime residual (in seconds),
and an uncertainty estimate. Note that in most cases, the mean will have been removed
from the traveltime residuals on a source by source basis.
7.4 Generating a synthetic traveltime dataset
In some cases, it is desirable to generate a synthetic traveltime dataset (e.g. for a checker-
board resolution test). This is relatively simple to do once all of the necessary input
files for fm3d (i.e. mode set.in, frechet.in, interfaces.in, propgrid.in, vgrids.in, receivers.in,
sources.in) have been constructed. For a given synthetic model, executing fm3d in the
directory containing these files will produce a file called arrivals.dat. This basically com-
prises the synthetic dataset, but a minimal amount of processing is required prior to it
being copied to otimes.dat where it can be used to constrain a tomographic inversion. At
47

the very least, for local sources, some estimate of error needs to be included with each
traveltime. For teleseismic sources, the two-point traveltime needs to be reduced to a
teleseismic arrival time residual. It is also common practice to infect synthetic datasets
with random noise in order to make them more realistic (since any observational dataset
will contain noise).
A program called synthdata is provided with the FMTOMO distribution to help ac-
complish all of these tasks. A generic input file (synthdata.in) is located in source/inputfiles/,
and contains the following list of parameters:
../syntimes.dat c: Input observed times
0.1 c: Data covariance (s)
otimes.dat c: Output file
../sourcesref.in c: Source file
../rtimes.dat c: Reference teleseismic times
0.0 c: DC offset to traveltimes
1 c: Add noise to synthetic times (0=no,1=yes)
0.100 c: Standard deviation of added noise (local)
0.077 c: Standard deviation of added noise (teleseismic)
1 c: Weight with standard deviation (1) or noise (2)
99827374 c: Random seed for noise generation
The first entry names the file containing the synthetic traveltimes. In this example, the
output arrivals.dat file from fm3d has simply been renamed to syntimes.dat. The second
entry is a constant data covariance value that will be associated with each traveltime pick
if random noise is not added to the data. The third entry is the output filename containing
the synthetic “observed” traveltime dataset. This can be used as input to FMTOMO. The
fourth line specifies the current sourcesref.in file, and the fifth line specifies the reference
teleseismic traveltime file (only needed if teleseisms are present). This can be generated
by running fm3d with your reference model. Currently, the mean is not removed from
the residuals. The sixth line allows you to add a constant DC (positive or negative) offset
to the traveltimes. This should only be set to a non-zero value if you are dealing with
a synthetic local earthquake dataset, and want to test the accuracy of the hypocenter
48

relocation in time as well as space.
The entry on the seventh line is a switch which allows you to add Gaussian noise
to the synthetic dataset. The two lines below let you set the standard deviation of the
noise (in seconds) for local and teleseismic sources. On the second last line is a switch
which toggles between using the standard deviation of the added noise as the uncertainty
associated with each traveltime pick (option 1), or the actual noise value that is added
to the pick (option 2). The last line is simply a random seed (integer) which initializes
the noise generation. When synthdata is executed in the presence of synthdata.in, it will
produce the file otimes.dat.
8 Plotting the output
An important step in analysing the results of a tomographic inversion is visualization of
the solution model. When dealing with 3-D models, this is not a simple task. These days,
however, there are many sophisticated software packages for performing 3-D visualization
that can be used. As note earlier, fm3d has the option of producing files in OpenDX
format. These files allow sources, receivers, rays and interfaces to be visualized, but not
velocity variations. Given that OpenDX is capable of volume visualization, this could
be accomplished quite readily. However, the FMTOMO package has taken the simpler
route of providing a program which can take a variety of cross-sections through a 3-D
model and output the result in a format that can be read in by GMT. The Generic
Mapping Tool is a flexible script-based plotting program that has the dual advantage of
being almost ubiquitous in the Earth Sciences community, and producing high quality
PostScript output suitable for publication.
Please note that you must have at least a basic working knowledge of GMT in order
to use the plotting scripts provided with this distribution.
8.1 Producing GMT output with gmtslice
gmtslice is a Fortran 90 program that is capable of taking slices through a 3-D model
in fm3d format (as defined by the files interfaces.in and vgrids.in), and producing output
in GMT format. It can also project the ray paths, sources and receivers onto the slices
that are chosen. In order to run gmtslice, you will need an input file called gmtslice.in,
49

a generic copy of which can be found in sources/inputfile/. The first parameter block of
this file contains the following:
cccccccccccccccccccccccccccccccccccccccccccccccccccccccccccccc
c Input file names
cccccccccccccccccccccccccccccccccccccccccccccccccccccccccccccc
../vgrids.in c: Inversion model velocity vertices
../vgridsref.in c: Reference model velocity vertices
../interfaces.in c: Inversion model interface vertices
../interfacesref.in c: Reference model interface vertices
6371.0 c: Earth radius (km)
0 c: Generate P(0) or S(1) velocities
The first entry in this block specifies the inversion model velocity grid file (or any velocity
model you may wish to visualize). For example, if you have executed tomo3d and wish
to visualize the result, then the name entered here should be the vgrids.in file located in
the directory from which tomo3d was executed. The second entry is a reference vgrids.in
file; this file is only used if you specify later on in gmtslice.in that you want to visualize
velocity perturbations rather than absolute velocity. The corresponding interface grid
files are listed below the velocity grid files; again, it is possible to plot perturbations
in interface depth rather than absolute interface depth, which is why interfacesref.in is
include. The fifth entry is simply the Earth radius, and the final entry lets you choose
between P or S velocity. This should only be set to 1 if both P and S velocity grids are
present in vgrids.in and you wish to visualize P velocity rather than S. If only S velocities
are available in vgrids.in, then this option should still be set to 0.
The second parameter block of the input file contains:
cccccccccccccccccccccccccccccccccccccccccccccccccccccccccccccc
c Set parameters for plotting ray paths if required
cccccccccccccccccccccccccccccccccccccccccccccccccccccccccccccc
1 c: Generate raypaths (0=no, 1=yes)
../rays.dat c: File containing raypaths
50

raysd.xy c: File name for depth projection
raysew.xy c: File name for EW projection
raysns.xy c: File name for NS projection
raysgc.xy c: File name for GC projection
30 c: Plot every nth ray point
The first entry is a switch which gives you the option of generating raypaths. The second
entry is the name of the raypath output file generated by fm3d. You will need to make
sure that mode set.in is correctly set up to generate this file if you want to visualize ray
paths. The next four lines provide output file names for ray paths that are projected
in one of four ways. The first projection (raysd.xy) is simply a depth projection (rays
vary in longitude and latitude but not depth); the second (raysew.xy) is an east-west
projection (rays vary in longitude and depth but not latitude); the third (raysns.xy) is a
north-south projection (rays vary in latitude and depth but not longitude); and the final
file (raysgc.xy) contains rays that have been projected onto a great circle slice. Note that
in the last option, each point along the raypath is projected onto the closest point along
the great circle slice. All of these files are simple ASCII text files, but list the rays in a
format that GMT can interpret. The final option in the above block of parameters sets
the resampling level of the ray path, which is described by a set of points. fm3d typically
describes each ray path using a high density of points; for plotting purposes, it is often
not necessary to try and interpolate every point. In the above example, gmtslice will
simply describe the ray by taking every n = 30th point. When a large number of rays are
present, it is a good idea to undersample the raypaths, otherwise the resulting postscript
file will be very large.
The third parameter block of the input file contains:
cccccccccccccccccccccccccccccccccccccccccccccccccccccccccccccc
c Set parameters for plotting sources and receivers
cccccccccccccccccccccccccccccccccccccccccccccccccccccccccccccc
1 c: Generate sources & receivers (0=no, 1=yes)
../sources.in c: File containing sources
../receivers.in c: File containing receivers
51

sourcesd.xy c: Output source file for depth projection
sourcesew.xy c: Output source file for EW projection
sourcesns.xy c: Output source file for NS projection
sourcesgc.xy c: Output source file for GC projection
receiversd.xy c: Output receiver file for depth projection
receiversew.xy c: Output receiver file for EW projection
receiversns.xy c: Output receiver file for NS projection
receiversgc.xy c: Output receiver file for GC projection
The first entry sets the option of whether or not to produce source and receiver files
for plotting with GMT. The second two entries correspond to the source and receiver
input files used by fm3d, which contain all of the necessary location information. The
following block of 8 files lists the output source and receiver files in GMT format for the
four different projections (same as for the ray projections).
The next block of parameters set the slice parameters:
ccccccccccccccccccccccccccccccccccccccccccccccc
c Slice parameters
ccccccccccccccccccccccccccccccccccccccccccccccc
1 c: Extract depth slice? (0=no, 1=yes)
-1.0 c: Depth of slice (km)
bounddp.gmt c: GMT plotting bounds for depth slice
contint.d c: GMT depth contouring file
1 c: Extract N-S slice? (0=no, 1=yes)
244.90 c: Longitude of slice (degrees)
boundns.gmt c: GMT plotting bounds for N-S slice
1 c: Extract E-W slice? (0=no, 1=yes)
36.25 c: Latitude of slice (degrees)
boundew.gmt c: GMT plotting bounds for E-W slice
1 c: Extract great circle slice? (0=no,1=yes)
36.30 244.75 c: Lat,Long of first GC point
36.10 245.15 c: Lat,Long of second GC point
boundgc.gmt c: GMT plotting bounds for great circle slice
52

There are four separate sets of specifications relating to depth, east-west, north-south
and great circle slices. The first slice option specifies whether or not to take a depth
slice (i.e. a horizontal section). The depth of this slice then needs to be specified (here,
negative values are below the surface). The next entry, bounddp.gmt is the name of an
output file containing the plotting boundaries that are needed by GMT. These values will
automatically be read into the scripts provided. The final entry for the depth slice is the
name of an output contour file that contains the value of the depth slice. This will be
used by GMT to contour any interface that passes through this depth.
The next set of parameters relate to taking a north-south slice (in which case the
longitude of the slice is specified) and an east-west slice (in which case the latitude of the
slice is specified). The final four entries specify the great circle slice, which can be taken
between any two points in the model region. Thus, two sets of latitude and longitude
coordinates are required. Note that if two points of common longitude are chosen, then
the resulting slice will be equivalent to a north-south slice, which is also a great-circle
slice. However, if two points of common latitude are chosen, then the great circle slice
will not be equivalent (except at the equator) to an east-west slice, which is a slice of
common latitude. It is also important to note that the manner in which ray paths and
points (sources and receivers) are projected onto the great circle slice differ from the
way in which they are projected onto the north-south slice. In the latter case, points
are projected back along lines of constant latitude, and in the former case, points are
projected back along great circle paths to the nearest point on the slice. As a result, it is
not often the case that great circle slices should exactly resemble north-south or east-west
slices.
Following on from setting the slice parameters, the next step is to set the resolution
of the plotted velocity grid:
ccccccccccccccccccccccccccccccccccccccccccccccc
c Velocity grid parameters
ccccccccccccccccccccccccccccccccccccccccccccccc
1 c: 0=absolute, 1=relative velocity
10 10 c: Dicing in theta,phi
53

grid2dvd.z c: GMT output file for depth slice
10 10 c: Dicing in r,theta
grid2dvns.z c: GMT output file for N-S slice
10 10 c: Dicing in r,phi
grid2dvew.z c: GMT output file for E-W slice
300 30 c: Total number of GC points (horizontal, vertical)
grid2dvgc.z c: GMT output file for great circle slice
The first setting indicates whether or not absolute or relative velocities are to be plotted
(in the latter case, a reference velocity model must be properly specified in the second
entry of the file). This is followed by four sets of options, corresponding to the depth,
north-south, east-west and great circle slice. In the first three cases, a dicing factor is set
for the two orthogonal coordinates. When GMT plots the velocity variations, a colour
contour representation is used, which is composed of a large number of constant colour
pixels. Thus, the “smoothness” of the colour variation will depend on the size of the
pixels. The dicing settings in the above parameter block determine how many pixels each
of the velocity grid cells will be divided into. Here, a velocity grid cell is defined as the
area bounded by two pairs of consecutive nodes (in two orthogonal directions) defined in
vgrids.in. Thus, in the above case, each horizontal grid cell will be described by 100 pixels.
For example, if a velocity model is defined using a grid of 12 by 12 nodes horizontally (not
including the cushion nodes), then setting dicing factors to 10 in both θ and φ will result
in the depth slice being described by a total of (11× 10+ 1)2 = 12, 321 pixels. Therefore,
increasing the size of a dicing factor will result in an increased resolution of the plot in the
corresponding direction. The obvious trade-off, however, is that the file size will increase.
For the great circle slice, the total number of pixels in the horizontal and vertical
directions must instead be specified. This is because the great circle can span the region
between any arbitrary pair of points that lie within the model. In the above case, the
great circle slice will be described by a total of 300 × 30 = 9, 000 pixels. In addition to
the dicing factor, the name of the output GMT grid file ( .z file in ASCII format) must
be specified for each of the slices. These files will then be converted to binary .grd files
by the GMT scripts provided.
The second last block of parameters simply specifies the output names of the interface
54

line files corresponding to each of the three vertical slices (north-south, east-west, and
great-circle). These files enable the interfaces to be explicitly superimposed on top of the
velocity cross-sections. In the generic input file, these files are names as followed:
ccccccccccccccccccccccccccccccccccccccccccccccc
c Interface grid parameters
ccccccccccccccccccccccccccccccccccccccccccccccc
intns.xy c: GMT output file for N-S slice
intew.xy c: GMT output file for E-W slice
intgc.xy c: GMT output file for GC slice
The final block of parameters are related to contour plots of specific interface surfaces:
cccccccccccccccccccccccccccccccccccccccccccccccccccccccccccccc
cccccccccccccccccccccccccccccccccccccccccccccccccccccccccccccc
c Set parameters for contour plots of interfaces
cccccccccccccccccccccccccccccccccccccccccccccccccccccccccccccc
cccccccccccccccccccccccccccccccccccccccccccccccccccccccccccccc
0 c: 0=absolute, 1=relative depth
1 c: Number of interfaces to plot
10 10 c: Dicing in theta,phi
boundsint.gmt c: GMT plotting bounds for surface
2 c: ID of first interface to plot
gridint1.z c: GMT output file
2 c: ID of second interface to plot
gridint2.z c: GMT output file
The first entry determines whether you want to plot the absolute or relative depths of
the interfaces (in the latter case, the interfacesref.in file specified near the beginning of
the input file must point to the appropriate reference interface depths). The second entry
indicates how many separate GMT interface files are to be generated. The plotting script
55

provided can only plot one interface at a time. If you decide to generate more than one of
these files, then you will need to edit this script (called plotint) in order to select which
interface to visualize. The third entry specifies the dicing factor that is used to pixelate
the interface. This works in a way that is exactly analogous to the velocity case. The
fourth entry is the output GMT plotting bounds file which is used by the corresponding
GMT script to set the dimensions of the plotting box. The number of entries that follow
depends on the number of interfaces you have decided to generate for plotting purposes.
For each entry pair, you need to specify the ID of the interface to be plotted (1 = top
interface, m + 1 = bottom interface in a model with m layers), and the corresponding
GMT ASCII grid filename.
Once you have set up the gmtslice.in file, you simply need to execute gmtslice in the
same directory to generate all of the GMT output files.
8.2 Using the GMT plotting scripts
Five generic GMT plotting scripts have been provided in gmtfiles/, and must be executed
in the directory that contains all of the output files produced by gmtslice. plotd will plot
a depth slice (horizontal section). Before running this script, make sure that the projection
option is correctly set. By default, a Lambert conic projection is used. The output file
produced by this script will be called gmtslice.ps. You will need some understanding of
shell scripts and GMT to adjust this script to your liking. Note that a colour palette
file is also needed as input; you will have to provide this yourself (or modify one of those
included with any of the three examples provided with the distribution). By adding and
removing the comment command (#) to executables in the script, you can specify which
components of the output produced by gmtslice will be plotted.
Three of the remaining four scripts, plotew, plotgc, and plotns will generate east-
west, great-circle, and north-south slices respectively. By default, the horizontal axis of
plotew and plotns is in degrees; in the case of plotgc, it is in km. The final script,
plotint, produces a contour plot showing the depth variations of a specific interface. All
of these scripts have a similar structure to plotd, and can be edited in a similar way.
Note that all of these files by default generate a postscript file called gmtslice.ps; if you
find this confusing or annoying, then simply change the output file name specification in
each of the scripts. In order to get a better understanding of how these plotting scripts
56

can be used, you are advised to closely examine each of the three examples provided.
9 Examples
A set of three examples are provided with the FMTOMO distribution. The first two
examples are purely synthetic, but the final example uses observational data. Before
trying to use the FMTOMO package with your own data, you are strongly advised to
examine these examples and test whether your compilation of the code produces the
correct output.
9.1 Example 1: Hypocenter relocation
.
All the files relating to Example 1 can be found in the subdirectory example1/. This
is a relatively straightforward application of the FMTOMO package which attempts to
relocate five local earthquakes in the presence of significant lateral variations in structure.
Example 1 corresponds to the Earthquake relocation application presented in the following
paper:
• Rawlinson, N., de Kool, M. and Sambridge, M., 2006. Seismic wavefront track-
ing in 3-D heterogeneous media: applications with multiple data classes. Explor.
Geophys., 37, 322-330.
You should be able to recreate the plots in Figure 6 of this paper using the input files
provided.
If you enter the example1/ directory, you should be able to execute tomo3d without
needing to edit anything. With its current settings, tomo3d will perform six inversion
iterations, and should end up correctly relocating the five sources into a cross configuration
within a plane of constant latitude (see Figure 6 in this document). Note that the locations
will not be exactly the same as in Figure 6 of the paper. This is because the propgrid.in
file has been modified to make the example run faster. Originally, the last line of the
the propgrid.in file was set to [5 10]; in other words, the refined grid about each source
contained 106 grid nodes. This setting produced the result that you can see in Figure 6 of
the paper. In the propgrid.in file provided, the last line now reads [5 5], which means that
the refined source grid now only contains 125,000 points. Although traveltime accuracy
57
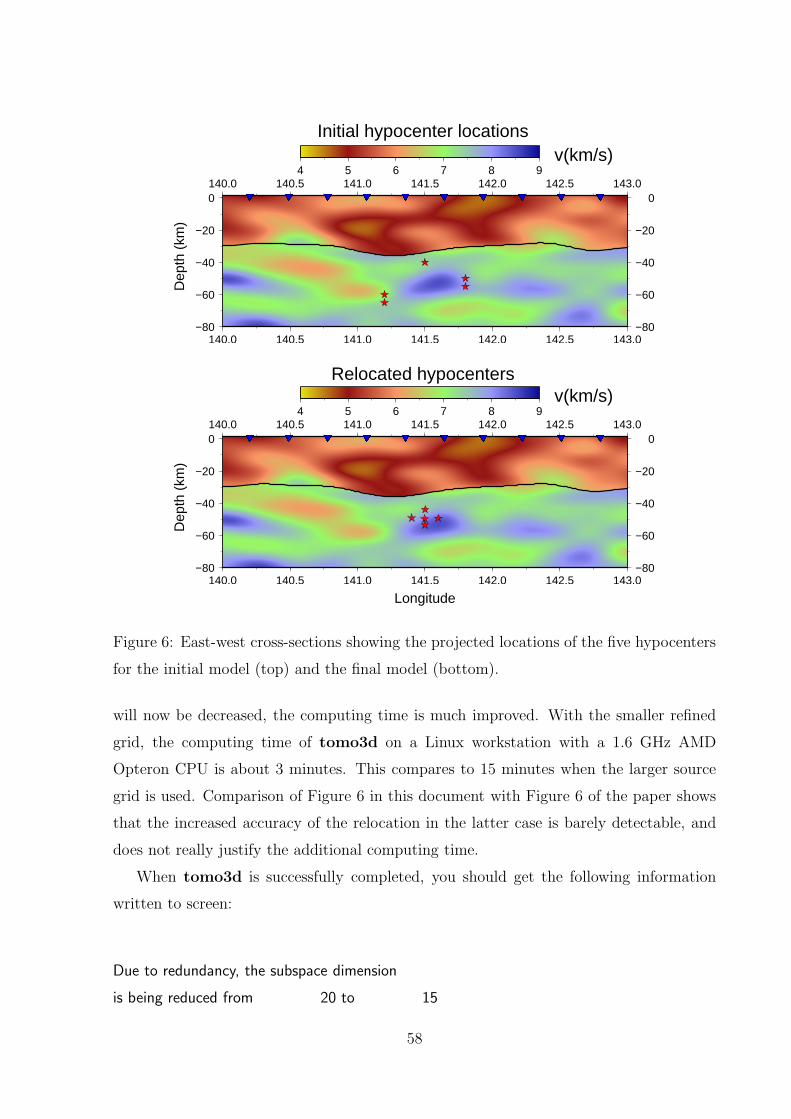
−80
−60
−40
−20
0
−80
−60
−40
−20
0
140.0 140.5 141.0 141.5 142.0 142.5 143.0
140.0 140.5 141.0 141.5 142.0 142.5 143.04 5 6 7 8 9
−80
−60
−40
−20
0
−80
−60
−40
−20
0
140.0 140.5 141.0 141.5 142.0 142.5 143.0
140.0 140.5 141.0 141.5 142.0 142.5 143.04 5 6 7 8 9
v(km/s)Relocated hypocenters
Dep
th (
km)
Longitude
v(km/s)Initial hypocenter locations
Dep
th (
km)
Figure 6: East-west cross-sections showing the projected locations of the five hypocenters
for the initial model (top) and the final model (bottom).
will now be decreased, the computing time is much improved. With the smaller refined
grid, the computing time of tomo3d on a Linux workstation with a 1.6 GHz AMD
Opteron CPU is about 3 minutes. This compares to 15 minutes when the larger source
grid is used. Comparison of Figure 6 in this document with Figure 6 of the paper shows
that the increased accuracy of the relocation in the latter case is barely detectable, and
does not really justify the additional computing time.
When tomo3d is successfully completed, you should get the following information
written to screen:
Due to redundancy, the subspace dimension
is being reduced from 20 to 15
58

Message from SVD orthogonalization algorithm
PROGRAM invert successfully completed!!
Due to redundancy, the subspace dimension
is being reduced from 20 to 15
Message from SVD orthogonalization algorithm
PROGRAM invert successfully completed!!
Due to redundancy, the subspace dimension
is being reduced from 20 to 15
Message from SVD orthogonalization algorithm
PROGRAM invert successfully completed!!
Due to redundancy, the subspace dimension
is being reduced from 20 to 15
Message from SVD orthogonalization algorithm
PROGRAM invert successfully completed!!
Due to redundancy, the subspace dimension
is being reduced from 20 to 15
Message from SVD orthogonalization algorithm
PROGRAM invert successfully completed!!
Due to redundancy, the subspace dimension
is being reduced from 20 to 15
Message from SVD orthogonalization algorithm
PROGRAM invert successfully completed!!
The residuals.dat file should contain the following list of numbers (allow for some slight
variation due to the use of different machine architecture and compilers):
2174.77 4.73971 472.96066
1052.36 1.10978 110.74583
378.22 0.14335 14.30517
309.36 0.09590 9.57022
312.90 0.09811 9.79057
312.92 0.09812 9.79188
59

311.69 0.09736 9.71515
Thus, the RMS traveltime residual (left column) has been reduced from 2.1 seconds to
0.3 seconds. Increasing the density of the propagation grid and the size of the refined
source grid will reduce the final number, but even with no traveltime error, the residual
is unlikely to reduce to zero.
The file stimes.dat contains the origin time perturbations associated with each of the
five sources. This should read:
5
-0.2874952
-0.2921612
-0.2727162
-0.3408791
-0.3534153
The origin time of all sources was perturbed by +0.25 s using the program synthdata.
Thus, if the relocation of each source was perfect in time, then each entry of stimes.dat
should read −0.25 s. Again, increasing the density of the propagation grid will improve
the accuracy of these times slightly.
The synthetic model and traveltime dataset used in this example was generated using
the input files contained in example1/mkmodel. The 3-D heterogeneous model is based on
the grid3dg.in file, and the source and receiver files are based on the moddata.in file. The
array of 100 receivers was generated using arraygen with the arraygen.in file provided.
In order to obtain the synthetic traveltime dataset, fm3d was run using the true source
locations in the presence of the 3-D velocity model. synthdata was then executed using
the synthdata.in file to produce otimes.dat. The sourcesle.in file specifies the true source
locations. The sources.in file produced by moddata was then copied to sourcestrue.in in
example1/. The sourcesref.in file was created by simply perturbing the source locations in
sourcestrue.in.
The subdirectory example1/gmtplot/ contains the files needed to produce slices through
the 3-D model using GMT. If you execute gmtslice in this directory, you will produce
60

all of the necessary GMT input files for plotting various sections, based on the values
provided in gmtslice.in. Try editing and executing several of the plotting scripts to see if
you can reproduce the plots contained in Figure 6 of the paper.
9.2 Example 2: Inversion for interface and velocity structure
All of the necessary input files relating to Example 2 can be found in the subdirectory
example2/. In this application, reflection, refraction and teleseismic arrival time residuals
are jointly inverted for 3-D velocity and interface structure. As in the previous example,
the dataset used for the inversion is purely synthetic. Example 2 corresponds to the “Joint
inversion of wide-angle and teleseismic traveltimes” example in the paper:
• Rawlinson, N., de Kool, M. and Sambridge, M., 2006. Seismic wavefront track-
ing in 3-D heterogeneous media: applications with multiple data classes. Explor.
Geophys., 37, 322-330.
You should be able to recreate the plots in Figure 7 of this paper using the input files
provided.
The format of this example is similar to Example 1, which means that you can enter
example2/ and execute tomo3d without modifying any files. However, note that you
now require the machine dependent binary files ak135.hed and ak135.tbl in this directory
in order to track the teleseismic phases outside the 3-D model region. These files are
produced when you execute compileall in the code compilation stage (see Section 2);
make sure that you copy them to the example2/ directory prior to executing tomo3d
in this case. With the tomo.in file provided, six inversion iterations will be performed.
The synthetic dataset was generated using a two-layer model (nominally a crust over a
mantle half-space), with a higher resolution velocity grid used in the crustal layer. The
background velocity within the model varies with depth, but a checkerboard pattern of
amplitude 0.8 km/s is added. The interface surface varies in depth between 33 km and
47 km. These lateral perturbations in seismic structure were created using grid3dg
with the velocity field checkerboard option turned on for both layers, and the random
structure generator turned on for interface 2 only. The starting model, described in the
files vgridsref.in and interfacesref.in, was created using the same grid3dg.in file, but with
the checkerboard and random interface structure options turned off. Note that when
61

synthdata was used to convert arrivals.in (produced by fm3d with the checkerboard
model) into otimes.dat, random data noise was not added.
138˚
138˚
139˚
139˚
140˚
140˚
141˚
141˚
142˚
142˚
−42˚ −42˚
−41˚ −41˚
−40˚ −40˚
−39˚ −39˚
−0.6 −0.4 −0.2 0.0 0.2 0.4 0.6
−100
−80
−60
−40
−20
0
−100
−80
−60
−40
−20
0
−42.0 −41.5 −41.0 −40.5 −40.0 −39.5 −39.0
−42.0 −41.5 −41.0 −40.5 −40.0 −39.5 −39.0−0.6 −0.4 −0.2 0.0 0.2 0.4 0.6
138˚
138˚
139˚
139˚
140˚
140˚
141˚
141˚
142˚
142˚
−42˚ −42˚
−41˚ −41˚
−40˚ −40˚
−39˚ −39˚
−45 −40 −35
−100
−80
−60
−40
−20
0
−100
−80
−60
−40
−20
0
138.0 138.5 139.0 139.5 140.0 140.5 141.0 141.5 142.0
138.0 138.5 139.0 139.5 140.0 140.5 141.0 141.5 142.0−0.6 −0.4 −0.2 0.0 0.2 0.4 0.6
138˚
138˚
139˚
139˚
140˚
140˚
141˚
141˚
142˚
142˚
−42˚ −42˚
−41˚ −41˚
−40˚ −40˚
−39˚ −39˚
−45 −40 −35
138˚
138˚
139˚
139˚
140˚
140˚
141˚
141˚
142˚
142˚
−42˚ −42˚
−41˚ −41˚
−40˚ −40˚
−39˚ −39˚
−0.6 −0.4 −0.2 0.0 0.2 0.4 0.6
−100
−80
−60
−40
−20
0
−100
−80
−60
−40
−20
0
−42.0 −41.5 −41.0 −40.5 −40.0 −39.5 −39.0
−42.0 −41.5 −41.0 −40.5 −40.0 −39.5 −39.0−0.6 −0.4 −0.2 0.0 0.2 0.4 0.6
−100
−80
−60
−40
−20
0
−100
−80
−60
−40
−20
0
138.0 138.5 139.0 139.5 140.0 140.5 141.0 141.5 142.0
138.0 138.5 139.0 139.5 140.0 140.5 141.0 141.5 142.0−0.6 −0.4 −0.2 0.0 0.2 0.4 0.6
V (km/s)pδ
V (km/s)pδ
V (km/s)pδ
V (km/s)pδ
Depth (km)
Longitude
Latitude
V (km/s)pδ
Depth (km)
Longitude
Latitude
Dep
th (
km)
Dep
th (
km)
V (km/s)pδ
20 km
Moho
40.25 S
140.25 E
20 km
Moho
140.25 E
40.25 S
Recovered modelTrue model
A’
B
B’
A
B B’
A A’
A’
B
B’
A
B B’
A A’
Figure 7: Velocity and interface structure of the synthetic model (left column) and the
recovered model (right column), obtained after six iterations of tomo3d. Colour contour
images of the Moho surface are shown in the bottom plots.
The execution time of tomo3d using the default input files provided is 24 minutes
on a Linux workstation with a 1.6 GHz AMD Opteron CPU. Note that, like Example 1,
62

fm3d uses a refined source grid comprising 125,000 points (as defined on the last line of
the propgrid.in file), rather than the 1,000,000 points used to produce the results in the
paper. It turns out that the improvements in the reconstruction achieved by using the
larger source grid are extremely minor, and are not justified by the significant increase in
CPU time that is required. Once tomo3d has finished, the following output should have
been written to screen:
PROGRAM invert successfully completed!!
PROGRAM invert successfully completed!!
PROGRAM invert successfully completed!!
PROGRAM invert successfully completed!!
PROGRAM invert successfully completed!!
PROGRAM invert successfully completed!!
which indicates that the six iterations have been successfully completed. Unlike Example
1, the SVD algorithm did not have to reduce the number of orthogonal search directions
in this case. Three cross-sections through the synthetic and solution model are shown in
Figure 7; as you can see, the recovered structure is virtually identical to that of Figure 7
in the paper, despite the use of a smaller source propagation grid. If at any time during
the execution of tomo3d you wish to examine the progress of fm3d, simply open the
fm3dlog.out file, which is continually updated.
The residuals.dat file should contain the following list of numbers (allow for some slight
variation due to the use of different machine architecture and compilers):
363.85 0.13243 13.23832
134.72 0.01816 1.81503
75.96 0.00577 0.57699
53.70 0.00288 0.28837
44.81 0.00201 0.20075
39.48 0.00156 0.15589
35.97 0.00129 0.12937
63

which indicates that the RMS traveltime residual has been reduced from 364 ms to 36 ms.
The vertical smearing of the checkerboard pattern that is evident in the upper mantle is
unlikely to be reduced by increasing the density of the propagation grid.
Note that both the velocity and interface inversion switches in invert3d.in have been
switched on (i.e. set to 1). In the frechgen.in file, the velocity derivative entry has been set
to -1, indicating that all velocity parameters will be inverted for. However, the interface
derivative entry has been set to 1, indicating that only one interface is to be inverted
for. The entry on the line below has been set to 2, which corresponds to interface 2 (the
Moho). It is important to understand how this two level hierarchy works when specifying
which parameters are to be constrained by the inversion.
The synthetic model and traveltime dataset used in this example are based on the
input files contained in example1/mkmodel/. The 3-D heterogeneous model is based on the
grid3dg.in file, and the source and receiver files are based on the moddata.in file. moddata
was used to generate the sources.in and receivers.in file. The input file to this program,
moddata.in, reads in two source input files, sourcestele.in and sourceswa.in. The first of
these files specifies the teleseismic source locations, and the second specifies the wide-
angle source locations. synthdata was used to create otimes.dat from the arrivals.dat file
produced by fm3d when run in forward mode with the synthetic model. The rtimes.dat
file, which specifies the traveltimes through the reference model, is used to create the
model arrival time residuals for the teleseisms (see invert3d.in).
The subdirectory example2/gmtplot/ contains all of the files necessary to produce slices
through the 3-D model using GMT. Simply run gmtslice to create the GMT input files,
and then execute any of the shell scripts provided (i.e. plotd, plotns, plotew, plotgc
and plotint).
9.3 Example 3: Joint inversion of active and passive source
datasets
The final example (see example3/) differs from the previous two in that observational
data extracted from seismograms are used, rather than synthetic data. The active source
data set comes from the 1995 TASGO project, which involved a large number of air-gun
shots fired during a complete circumnavigation of Tasmania (southeast Australia). An
array of land-based vertical component seismometers recorded the energy from the shots,
64

which arrived in the form of various phase types, including Pg, Pn, as well as PmP.
The passive source dataset was recorded in 2002 during the TIGGER experiment, which
involved the deployment of an array of vertical component short period seismometers
in northern Tasmania for a five month period. Approximately 101 teleseismic events
with sufficient signal-to-noise ratios to identify global phases such as P, PP, ScP, PKiKP
etc. were identified from the continuous recordings. In total, 9692 absolute and relative
traveltimes are used to simultaneously constrain the 3-D lithospheric P-wavespeed and
Moho geometry beneath northern Tasmania. The full results of this study can be found
in the paper (see the docs/ directory):
• Rawlinson, N. and Urvoy, M., 2006. Simultaneous inversion of active and passive
source datasets for 3-D seismic structure with application to Tasmania. Geophys.
Res. Lett., 33 L24313, doi:10.1029/2006GL028105.
You should be able to replicate the tomographic images contained in this paper using the
input files provided.
As in the previous example, you can construct the solution model by entering exam-
ple3/ and executing tomo3d without modifying any of the files. However, as in Example
2, note that you must copy the machine dependent binary traveltime tables ak135.hed
and ak135.tbl into this directory from their default location in sources/inputfiles/ (they
are placed there by compileall). Compared to Examples 1 and 2, this is a much larger
problem, and therefore takes significantly more CPU time to compute. Six iterations on a
Linux workstation with a 1.6 GHz AMD Opteron CPU took just over three hours. Note
that the solution in the paper uses a refined source grid comprising 1,000,000 points; here,
the refined grid only comprises 125,000 points (see the last line of the propgrid.in file). Al-
though this only affects the active source traveltimes, the difference in computing time is
still significant. The resulting solution model (see Figure 8) is virtually identical to that
produced in the paper (see Figure 3 of the GRL article), so the additional computation
times required by the larger source grid is not really warranted.
When tomo3d is executed, the full screen output that should eventually appear is as
follows:
PROGRAM invert successfully completed!!
PROGRAM invert successfully completed!!
65

144˚
144˚
145˚
145˚
146˚
146˚
147˚
147˚
148˚
148˚
149˚
149˚
−42˚ −42˚
−41˚ −41˚
−40˚ −40˚
−0.6 −0.4 −0.2 0.0 0.2 0.4 0.6
144˚
144˚
145˚
145˚
146˚
146˚
147˚
147˚
148˚
148˚
149˚
149˚
−42˚ −42˚
−41˚ −41˚
−40˚ −40˚
−0.6 −0.4 −0.2 0.0 0.2 0.4 0.6
144˚
144˚
145˚
145˚
146˚
146˚
147˚
147˚
148˚
148˚
149˚
149˚
−42˚ −42˚
−41˚ −41˚
−40˚ −40˚
−35 −30 −25
−160
−120
−80
−40
0
144 145 146 147 148 149
−160
−120
−80
−40
0
144 145 146 147 148 149
−160
−120
−80
−40
0
144 145 146 147 148 149
Dep
th (
km)
Longitude ( )
Dep
th (
km)
Longitude ( )
Dep
th (
km)
Longitude ( )
8.0%−8.0% −6.3% 6.3%(a) (b) (c)
(d)
??
??
??
?? ?
Smearing
Tamar River
??
?
?
??
Smearing
TFSSmearing Smearing TFS SmearingSmearing TFSSmearing Smearing
δVp (m/s)
15 km
δVp (m/s)
41.2 S
Moho depth (km)
52 km
MRV
41.4 S 41.6 S
Figure 8: Summary of Tasmania tomography results. (a) Crustal section at 15 km depth;
(b) Moho structure; (c) mantle section at 52 km depth; (d) three east-west cross-sections.
TFS = Tamar Fracture System; MRV = Mt. Read Volcanics.
PROGRAM invert successfully completed!!
PROGRAM invert successfully completed!!
PROGRAM invert successfully completed!!
PROGRAM invert successfully completed!!
which indicates that six iterations of the inversion routine has been completed. All basis
vectors used in the 20-D subspace inversion scheme are linearly independent, so the SVD
orthogonalization algorithm does not need to dynamically reduce the size of the subspace
(cf. Example 1). The traveltime residuals as a function of iteration number are summa-
rized in the file residuals.dat, which should contain something like:
297.27 0.08838 13.49418
185.65 0.03447 4.53093
158.23 0.02504 3.34427
148.66 0.02210 2.99040
145.15 0.02107 2.86967
142.13 0.02020 2.78905
66

141.70 0.02008 2.75926
This indicates that the RMS traveltime residual has been reduced from an initial value
of 297 ms to a final value of 142 ms (representing a 77% variance reduction, as computed
from the second column). The final column lists the χ2 value associated with each model.
Unless you really want to visualize the ray paths, it is not advisable to switch this option
on in mode set.in, because the resulting output file is several hundred Mb in size.
Note that both the invert3d.in file and the frechgen.in file are used to specify which
parameters are constrained in the inversion; in this case, both velocity layers and the
Moho structure are inverted for. The “Remove mean from predicted teleseisms” option
has been set to 0 in invert3d.in. To be consistent with the observed relative arrival time
residuals, this switch really should be set to 1. However, for this particular problem, doing
so results in the inversion diverging for some reason. It is not clear why this happens, but
since the initial model essentially represents the laterally averaged solution model, this
inconsistency is not serious.
Unlike Example 2, which also used teleseisms, reference teleseismic traveltimes (which
are used to compute model traveltime residuals) are not computed using rtimes.dat. This
is because the observed residuals in otimes.dat include a component due to elevation
(i.e. the observed residuals have not been corrected for elevation). Therefore, in order
to properly compare otimes.dat and mtimes.dat, the arrival time residuals in mtimes.dat
must also contain a component due to elevation. This is achieved by running fm3d
with the reference model, and setting all receiver elevations to zero (this is the file called
receiversnec.dat). The arrivals.dat file that was produced has been copied to rtimesnec.dat,
which then becomes the reference traveltime file. If you open invert3d.in and residuals.in,
you will see that rtimesnec.dat is used in place of rtimes.dat.
The reference model used in this application was generated using the grid3dg.in file
located in example3/mkmodel/. Note that an external 1-D crustal model (crust.vel) and a
modified ak135 model (ak135modified.vel) are used to describe the crust and upper mantle
velocities respectively. Since we are now dealing with observational data, the program
obsdata is used to generate the sources.in, receivers.in and otimes.dat file. All of the
traveltime pick files are located in the subdirectory picks. Note that the formats of the
sourcestele.in and sourceswa.in file are quite different to the equivalent files in the previous
67

example.
The subdirectory example3/gmtplot/ contains all of the files required to produce slices
through the solution model using GMT. Simply run gmtslice to convert FMTOMO
output to GMT input, and you will be able to execute the plotting scripts provided
(plotd, plotew, plotns, plotgc and plotint) to generate postscript output (i.e. the file
gmtslice.ps).
10 FAQs
1. Q. How can I optimize the speed of the tomographic inversion?
A. The key to getting the maximum performance from the code is to specify the
coarsest propagation grid spacing that still produces traveltimes with sufficient ac-
curacy. This is because the traveltime prediction step is much slower than the
inversion step, and FMM scales as O(NlogN), where N is the total number of points
on the computational grid. Therefore, if you halve the propagation grid spacing, the
computing time will increase by a factor of at least 8. The size and density of the
refined propagation grid that is used in the source neighbourhood is also a crucial
consideration. The refinement level parameter (κ) and grid cell spanning parameter
(τ), contained in the last line of propgrid.in, should be chosen carefully. Remember
that the total number of refined grid nodes is equal to (κ × τ × 2)3. For example,
if κ = τ = 5, then the total number of refined nodes is already 125,000.
One approach for finding the optimum size of the propagation grid is to begin by
making it very coarse, and then gradually refining it until the inversion solution
doesn’t change significantly. At this stage, there is little point in increasing the
accuracy of the traveltime predictions.
2. Q. Can hypocenters be relocated into different layers?
A: No. This is because the path signature associated with each traveltime must be
explicitly specified a priori. If a source is relocated to another layer by the gradient-
based routine, the original path signature specification will no longer be valid. In
future versions of the code, I will try and include a routine that attempts to deal
with this limitation by applying some assumptions (e.g. the phase can only transmit
through an interface).
68

3. Q. Does FMTOMO include a routine for performing fully non-linear earthquake
relocation?
A: No. However, you can edit mode set.in so that fm3d generates the traveltime
grid associated with all or a subset of sources. In theory, you could apply any
non-linear optimization routine to search these grids and relocate the source.
4. Q. Can FMTOMO be used for global tomography?
A: No. Although fm3d applies FMM in spherical coordinates, periodicity is not
accounted for, nor is the degeneration of the coordinate system at the poles. In
addition, no correction is made for the true ellipsoid shape of the Earth. One could
make make an a posteriori correction for Earth flattening, however. FMTOMO is
currently best used for local and regional problems.
5. Q. Can FMTOMO be used to solve problems in 2-D or 2.5D?
A: FMTOMO requires the input model to have a finite span in all three orthogonal
dimensions. Therefore, it cannot operate in 2-D space. 2.5D models, which exist
in three spatial dimensions but only have structure varying in two dimensions, also
cannot be inverted for. This is because cubic B-splines require at least four nodes in
any dimension. However, if you only specified four nodes in one of the dimensions,
then the resulting model may well be pseudo 2.5D, as the structure in this direction
would probably not change very much.
6. Q. I want to describe a model that is very detailed near the surface (e.g. sediment
layers), but becomes coarser at greater depths (e.g. the upper mantle). Can FM-
TOMO deal with this kind of situation?
A: It can to some extent. The parameterization allows velocity grids of different
resolutions to be specified for each layer; therefore, you could allow fine detail in one
layer, and only coarse detail in another. However, the horizontal grid spacings of all
layer boundaries must be identical, so this does not extend to interface geometry.
In addition, the propagation grid must be regular, so it may be that the high reso-
lution velocity layer gets undersampled, which will result in traveltime predictions
becoming less accurate.
7. Q. Will teleseismic wavefronts pass through the side of the model if necessary?
A: Yes, but take care with your specification of path signature to make sure that
69

no inconsistencies occur.
8. Q. Will new features be added to the code in future?
A. To begin with, I will try to fix any obvious bugs. In the longer term, I hope to
include the ability to jointly invert P and S traveltimes for Vp/Vs ratio or bulk sound
and shear moduli. Other suggestions for additional features would be welcome.
70


