
Flowserve Third Quarter 2016 Earnings Conference Call
SOLAR REFINING CHEMICAL
COAL-FIRED POWER NUCLEAR DESALINATION
October 28, 2016
2 Flowserve Q3 2016 Earnings Conference Call : Page
Special Note Safe Harbor Statement: This presentation includes forward-looking statements within the meaning of Section 27A of the Securities Act of 1933 and Section 21E of the Securities Exchange Act of 1934, which are made pursuant to the safe harbor provisions of the Private Securities Litigation Reform Act of 1995, as amended. Words or phrases such as, "may," "should," "expects," "could," "intends," "plans," "anticipates," "estimates," "believes," "forecasts," "predicts" or other similar expressions are intended to identify forward-looking statements, which include, without limitation, earnings forecasts, statements relating to our business strategy and statements of expectations, beliefs, future plans and strategies and anticipated developments concerning our industry, business, operations and financial performance and condition. The forward-looking statements included in this news release are based on our current expectations, projections, estimates and assumptions. These statements are only predictions, not guarantees. Such forward-looking statements are subject to numerous risks and uncertainties that are difficult to predict. We have based the forward-looking statements relating to our operations on our current expectations, estimates and projections about us and the markets we serve. We caution users of the enclosed financial information that these statements are not guarantees of future performance and involve risks and uncertainties. In addition, we have based many of these forward-looking statements on assumptions about future events that may prove to be inaccurate. Accordingly, actual outcomes and results may differ materially from what we have expressed or forecast in the forward-looking statements. Any differences could result from a variety of factors, including those detailed on Item 1A, Risk Factors, in our Annual Report on Form 10-K for 2015 and in our subsequent disclosures filed with the Securities and Exchange Commission. All forward-looking statements included in this presentation are based on information available to us on the date hereof, and we assume no obligation to update any forward-looking statement. Certain non-GAAP measures have been provided to facilitate comparison with the prior year. The Company reports its financial results in accordance with U.S. generally accepted accounting principles (GAAP). However, management believes that non-GAAP financial measures which exclude certain non-recurring items present additional useful comparisons between current results and results in prior operating periods, providing investors with a clearer view of the underlying trends of the business; throughout our materials we refer to non-GAAP measures as “Adjusted.” Management also uses these non-GAAP financial measures in making financial, operating, planning and compensation decisions and in evaluating the Company's performance. Non-GAAP financial measures, which may be inconsistent with similarly captioned measures presented by other companies, should be viewed in addition to, and not as a substitute for, the Company’s reported results prepared in accordance with GAAP. We have provided a table on pages 9 and 10 that reconcile these non-GAAP measures to their corresponding GAAP-based measures.
3 Flowserve Q3 2016 Earnings Conference Call : Page
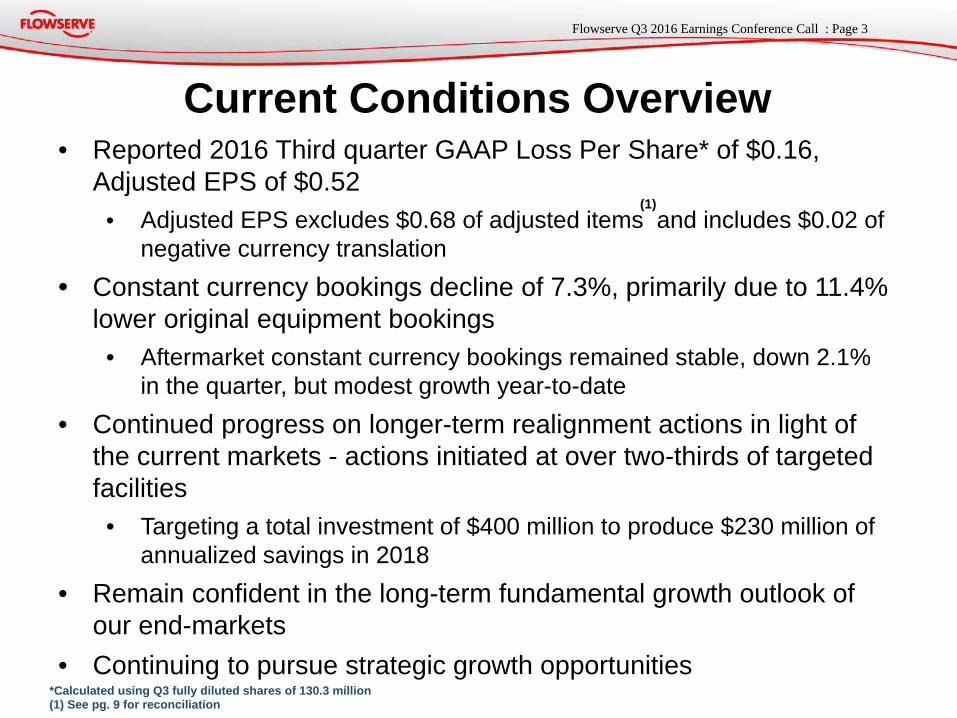
• Reported 2016 Third quarter GAAP Loss Per Share* of $0.16, Adjusted EPS of $0.52
• Adjusted EPS excludes $0.68 of adjusted items and includes $0.02 of negative currency translation
• Constant currency bookings decline of 7.3%, primarily due to 11.4% lower original equipment bookings
• Aftermarket constant currency bookings remained stable, down 2.1% in the quarter, but modest growth year-to-date
• Continued progress on longer-term realignment actions in light of the current markets - actions initiated at over two-thirds of targeted facilities
• Targeting a total investment of $400 million to produce $230 million of annualized savings in 2018
• Remain confident in the long-term fundamental growth outlook of our end-markets
• Continuing to pursue strategic growth opportunities
*Calculated using Q3 fully diluted shares of 130.3 million (1) See pg. 9 for reconciliation
Current Conditions Overview
(1)
4 Flowserve Q3 2016 Earnings Conference Call : Page
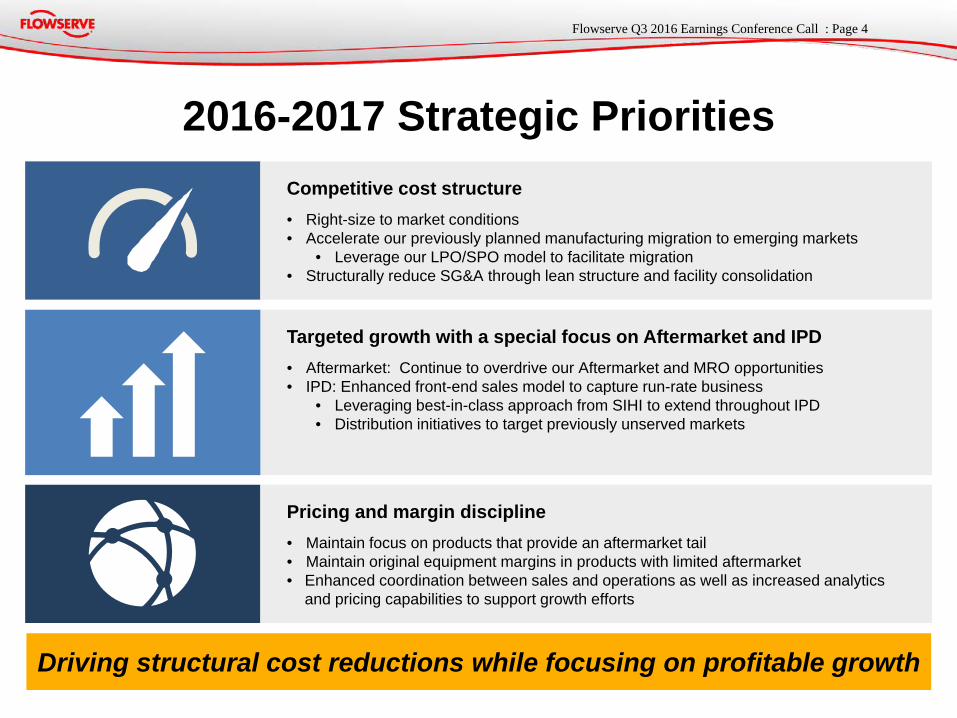
2016-2017 Strategic Priorities
Driving structural cost reductions while focusing on profitable growth
Targeted growth with a special focus on Aftermarket and IPD • Aftermarket: Continue to overdrive our Aftermarket and MRO opportunities • IPD: Enhanced front-end sales model to capture run-rate business
• Leveraging best-in-class approach from SIHI to extend throughout IPD • Distribution initiatives to target previously unserved markets
Competitive cost structure • Right-size to market conditions • Accelerate our previously planned manufacturing migration to emerging markets
• Leverage our LPO/SPO model to facilitate migration • Structurally reduce SG&A through lean structure and facility consolidation
Pricing and margin discipline • Maintain focus on products that provide an aftermarket tail • Maintain original equipment margins in products with limited aftermarket • Enhanced coordination between sales and operations as well as increased analytics
and pricing capabilities to support growth efforts
5 Flowserve Q3 2016 Earnings Conference Call : Page
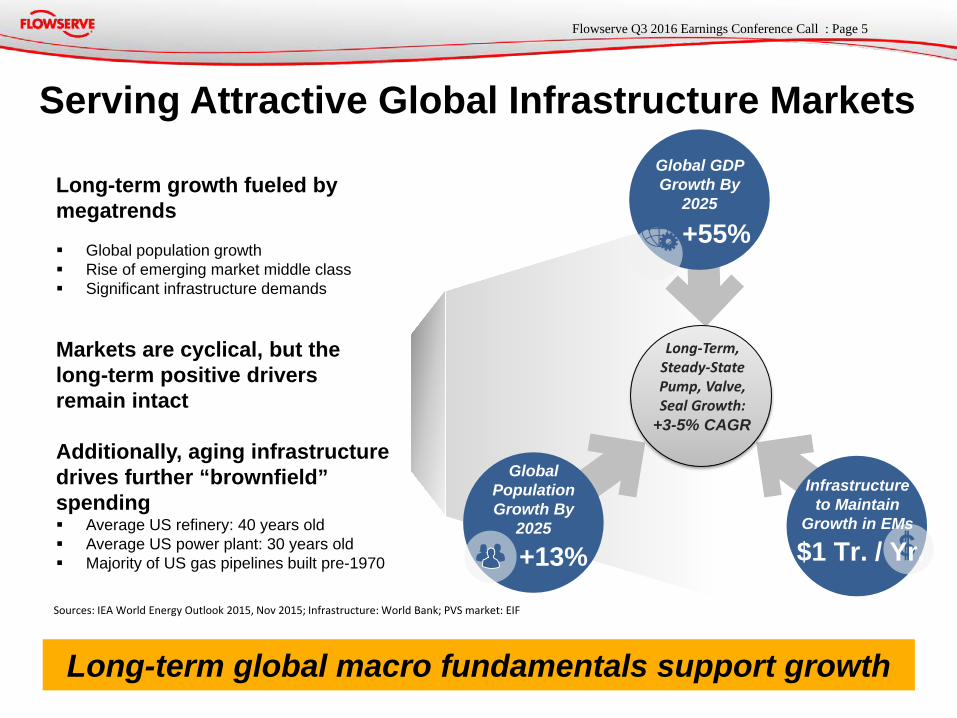
Serving Attractive Global Infrastructure Markets
Long-term global macro fundamentals support growth
Long-term growth fueled by megatrends Global population growth Rise of emerging market middle class Significant infrastructure demands
Markets are cyclical, but the long-term positive drivers remain intact Additionally, aging infrastructure drives further “brownfield” spending Average US refinery: 40 years old Average US power plant: 30 years old Majority of US gas pipelines built pre-1970
Long-Term, Steady-State Pump, Valve, Seal Growth:
+3-5% CAGR
$1 Tr. / Yr.
Infrastructure to Maintain
Growth in EMs
Global Population Growth By
2025
+13%
Global GDP Growth By
2025
+55%
Sources: IEA World Energy Outlook 2015, Nov 2015; Infrastructure: World Bank; PVS market: EIF
6 Flowserve Q3 2016 Earnings Conference Call : Page
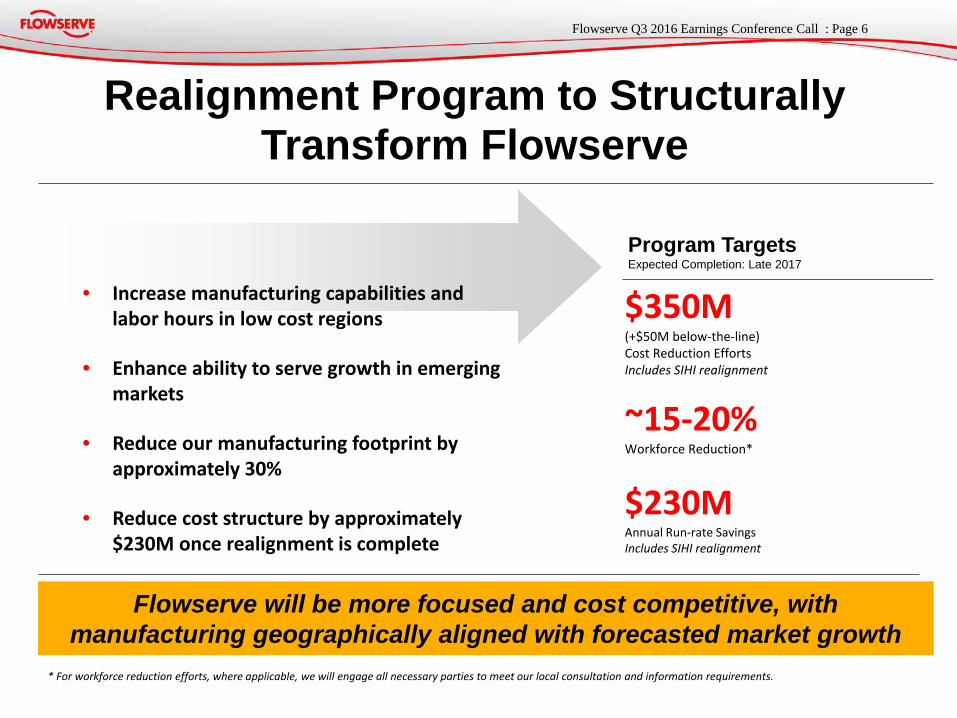
Realignment Program to Structurally Transform Flowserve
* For workforce reduction efforts, where applicable, we will engage all necessary parties to meet our local consultation and information requirements.
Flowserve will be more focused and cost competitive, with manufacturing geographically aligned with forecasted market growth
$350M (+$50M below-the-line) Cost Reduction Efforts Includes SIHI realignment
~15-20% Workforce Reduction*
$230M Annual Run-rate Savings Includes SIHI realignment
Program Targets Expected Completion: Late 2017
• Increase manufacturing capabilities and labor hours in low cost regions
• Enhance ability to serve growth in emerging markets
• Reduce our manufacturing footprint by approximately 30%
• Reduce cost structure by approximately $230M once realignment is complete
7 Flowserve Q3 2016 Earnings Conference Call : Page
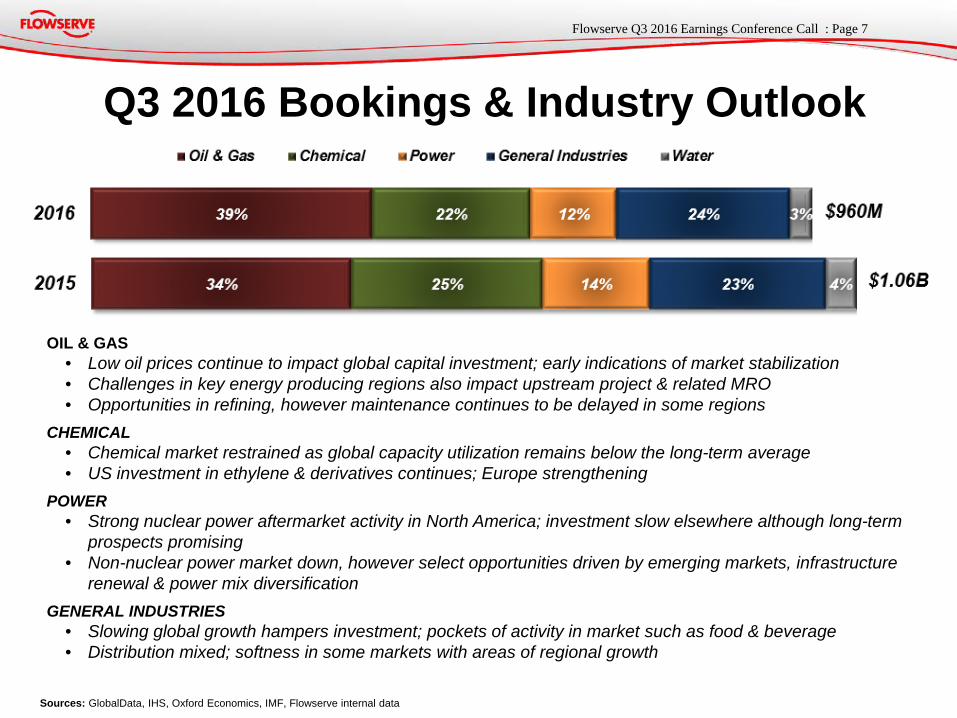
Q3 2016 Bookings & Industry Outlook
OIL & GAS • Low oil prices continue to impact global capital investment; early indications of market stabilization • Challenges in key energy producing regions also impact upstream project & related MRO • Opportunities in refining, however maintenance continues to be delayed in some regions
CHEMICAL • Chemical market restrained as global capacity utilization remains below the long-term average • US investment in ethylene & derivatives continues; Europe strengthening
POWER • Strong nuclear power aftermarket activity in North America; investment slow elsewhere although long-term
prospects promising • Non-nuclear power market down, however select opportunities driven by emerging markets, infrastructure
renewal & power mix diversification GENERAL INDUSTRIES
• Slowing global growth hampers investment; pockets of activity in market such as food & beverage • Distribution mixed; softness in some markets with areas of regional growth
Sources: GlobalData, IHS, Oxford Economics, IMF, Flowserve internal data

8 Flowserve Q3 2016 Earnings Conference Call : Page
NORTH AMERICA • Oil & gas capital and maintenance spending remains low; investment in ethylene & derivatives continues • Opportunities in the industrial & municipal markets, as well as power aftermarket
EUROPE • Refining & chemical market activity solidifies • Power generation challenged with some growth in fossil-fired; good future prospects in nuclear & renewables
MIDDLE EAST & AFRICA • Oil & gas spending remains down overall, despite opportunities in refining • Power markets difficult but some growth in fossil-fired & desalination
ASIA-PACIFIC • India growth accelerates while China slows • General industries on the rise across several market segments; distribution business improving
LATIN AMERICA • Opportunities in refining, however energy markets remain subdued due to challenges in Brazil and Venezuela • Mining still in decline but improvement in other general industries markets
Sources: GlobalData, IHS, Oxford Economics, IMF, Flowserve internal data
Q3 2016 Sales & Regional Outlook
9 Flowserve Q3 2016 Earnings Conference Call : Page
1. 2 2. x 3. x 4. x
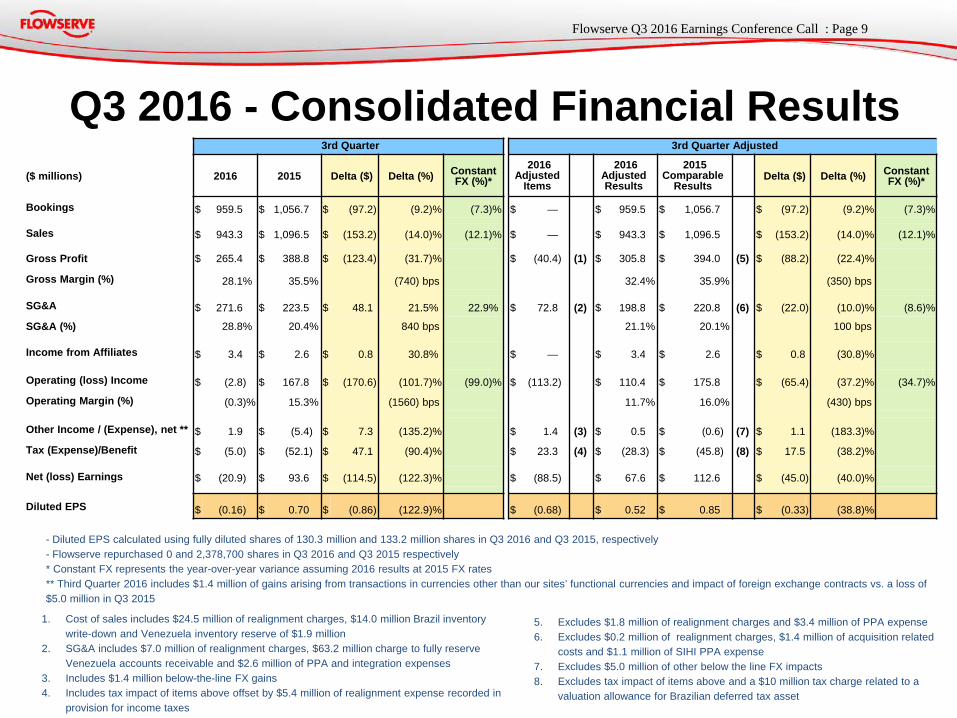
5. Excludes $1.8 million of realignment charges and $3.4 million of PPA expense 6. Excludes $0.2 million of realignment charges, $1.4 million of acquisition related
costs and $1.1 million of SIHI PPA expense 7. Excludes $5.0 million of other below the line FX impacts 8. Excludes tax impact of items above and a $10 million tax charge related to a
valuation allowance for Brazilian deferred tax asset
Q3 2016 - Consolidated Financial Results 3rd Quarter 3rd Quarter Adjusted
($ millions) 2016 2015 Delta ($) Delta (%) Constant FX (%)*
2016 Adjusted
Items
2016 Adjusted Results
2015 Comparable
Results Delta ($) Delta (%) Constant
FX (%)*
Bookings $ 959.5 $ 1,056.7 $ (97.2 ) (9.2 )% (7.3 )% $ — $ 959.5 $ 1,056.7 $ (97.2 ) (9.2 )% (7.3 )%
Sales $ 943.3 $ 1,096.5 $ (153.2 ) (14.0 )% (12.1 )% $ — $ 943.3 $ 1,096.5 $ (153.2 ) (14.0 )% (12.1 )%
Gross Profit $ 265.4 $ 388.8 $ (123.4 ) (31.7 )% $ (40.4 ) (1) $ 305.8 $ 394.0 (5) $ (88.2 ) (22.4 )%
Gross Margin (%) 28.1 % 35.5 % (740) bps 32.4 % 35.9 % (350) bps
SG&A $ 271.6 $ 223.5 $ 48.1 21.5 % 22.9 % $ 72.8 (2) $ 198.8 $ 220.8 (6) $ (22.0 ) (10.0 )% (8.6 )%
SG&A (%) 28.8 % 20.4 % 840 bps 21.1 % 20.1 % 100 bps
Income from Affiliates $ 3.4 $ 2.6 $ 0.8 30.8 % $ — $ 3.4 $ 2.6 $ 0.8 (30.8 )%
Operating (loss) Income $ (2.8 ) $ 167.8 $ (170.6 ) (101.7 )% (99.0 )% $ (113.2 ) $ 110.4 $ 175.8 $ (65.4 ) (37.2 )% (34.7 )%
Operating Margin (%) (0.3 )% 15.3 % (1560) bps 11.7 % 16.0 % (430) bps
Other Income / (Expense), net ** $ 1.9 $ (5.4 ) $ 7.3 (135.2 )% $ 1.4 (3) $ 0.5 $ (0.6 ) (7) $ 1.1 (183.3 )%
Tax (Expense)/Benefit $ (5.0 ) $ (52.1 ) $ 47.1 (90.4 )% $ 23.3 (4) $ (28.3 ) $ (45.8 ) (8) $ 17.5 (38.2 )%
Net (loss) Earnings $ (20.9 ) $ 93.6 $ (114.5 ) (122.3 )% $ (88.5 ) $ 67.6 $ 112.6 $ (45.0 ) (40.0 )%
Diluted EPS $ (0.16 ) $ 0.70 $ (0.86 ) (122.9 )% $ (0.68 ) $ 0.52 $ 0.85 $ (0.33 ) (38.8 )%
1. Cost of sales includes $24.5 million of realignment charges, $14.0 million Brazil inventory write-down and Venezuela inventory reserve of $1.9 million
2. SG&A includes $7.0 million of realignment charges, $63.2 million charge to fully reserve Venezuela accounts receivable and $2.6 million of PPA and integration expenses
3. Includes $1.4 million below-the-line FX gains 4. Includes tax impact of items above offset by $5.4 million of realignment expense recorded in
provision for income taxes
- Diluted EPS calculated using fully diluted shares of 130.3 million and 133.2 million shares in Q3 2016 and Q3 2015, respectively - Flowserve repurchased 0 and 2,378,700 shares in Q3 2016 and Q3 2015 respectively * Constant FX represents the year-over-year variance assuming 2016 results at 2015 FX rates ** Third Quarter 2016 includes $1.4 million of gains arising from transactions in currencies other than our sites’ functional currencies and impact of foreign exchange contracts vs. a loss of $5.0 million in Q3 2015
10 Flowserve Q3 2016 Earnings Conference Call : Page
1. x 2. x 3. x 4. Xx
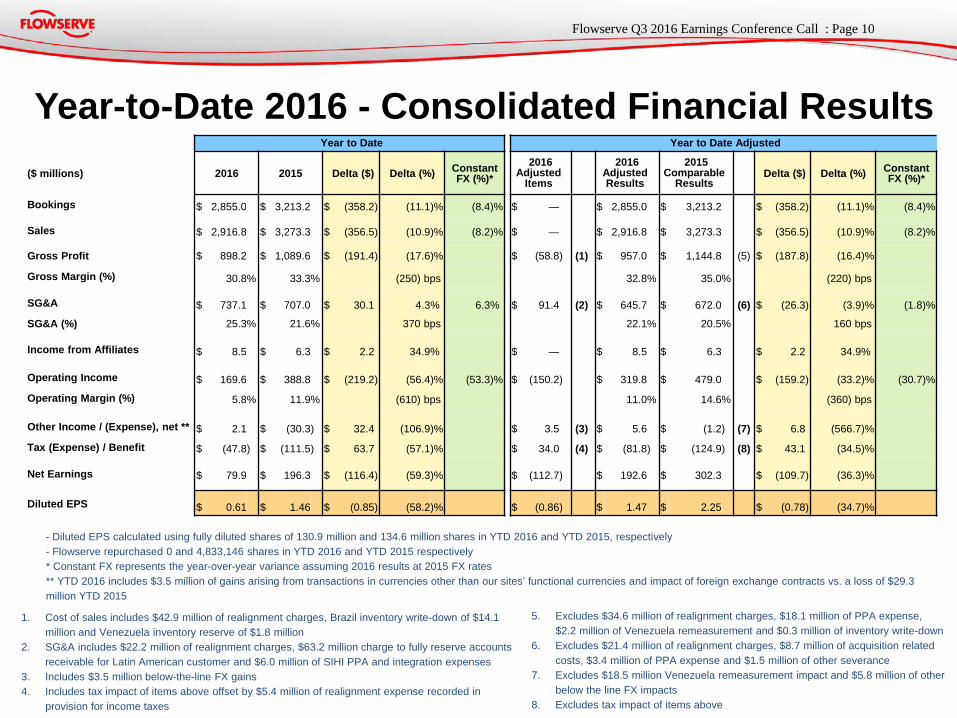
5. Excludes $34.6 million of realignment charges, $18.1 million of PPA expense, $2.2 million of Venezuela remeasurement and $0.3 million of inventory write-down
6. Excludes $21.4 million of realignment charges, $8.7 million of acquisition related costs, $3.4 million of PPA expense and $1.5 million of other severance
7. Excludes $18.5 million Venezuela remeasurement impact and $5.8 million of other below the line FX impacts
8. Excludes tax impact of items above
Year-to-Date 2016 - Consolidated Financial Results Year to Date Year to Date Adjusted
($ millions) 2016 2015 Delta ($) Delta (%) Constant FX (%)*
2016 Adjusted
Items
2016 Adjusted Results
2015 Comparable
Results Delta ($) Delta (%) Constant
FX (%)*
Bookings $ 2,855.0 $ 3,213.2 $ (358.2 ) (11.1 )% (8.4 )% $ — $ 2,855.0 $ 3,213.2 $ (358.2 ) (11.1 )% (8.4 )%
Sales $ 2,916.8 $ 3,273.3 $ (356.5 ) (10.9 )% (8.2 )% $ — $ 2,916.8 $ 3,273.3 $ (356.5 ) (10.9 )% (8.2 )%
Gross Profit $ 898.2 $ 1,089.6 $ (191.4 ) (17.6 )% $ (58.8 ) (1) $ 957.0 $ 1,144.8 (5) $ (187.8 ) (16.4 )%
Gross Margin (%) 30.8 % 33.3 % (250) bps 32.8 % 35.0 % (220) bps
SG&A $ 737.1 $ 707.0 $ 30.1 4.3 % 6.3 % $ 91.4 (2) $ 645.7 $ 672.0 (6) $ (26.3 ) (3.9 )% (1.8 )%
SG&A (%) 25.3 % 21.6 % 370 bps 22.1 % 20.5 % 160 bps
Income from Affiliates $ 8.5 $ 6.3 $ 2.2 34.9 % $ — $ 8.5 $ 6.3 $ 2.2 34.9 %
Operating Income $ 169.6 $ 388.8 $ (219.2 ) (56.4 )% (53.3 )% $ (150.2 ) $ 319.8 $ 479.0 $ (159.2 ) (33.2 )% (30.7 )%
Operating Margin (%) 5.8 % 11.9 % (610) bps 11.0 % 14.6 % (360) bps
Other Income / (Expense), net ** $ 2.1 $ (30.3 ) $ 32.4 (106.9 )% $ 3.5 (3) $ 5.6 $ (1.2 ) (7) $ 6.8 (566.7 )%
Tax (Expense) / Benefit $ (47.8 ) $ (111.5 ) $ 63.7 (57.1 )% $ 34.0 (4) $ (81.8 ) $ (124.9 ) (8) $ 43.1 (34.5 )%
Net Earnings $ 79.9 $ 196.3 $ (116.4 ) (59.3 )% $ (112.7 ) $ 192.6 $ 302.3 $ (109.7 ) (36.3 )%
Diluted EPS $ 0.61 $ 1.46 $ (0.85 ) (58.2 )% $ (0.86 ) $ 1.47 $ 2.25 $ (0.78 ) (34.7 )%
1. Cost of sales includes $42.9 million of realignment charges, Brazil inventory write-down of $14.1 million and Venezuela inventory reserve of $1.8 million
2. SG&A includes $22.2 million of realignment charges, $63.2 million charge to fully reserve accounts receivable for Latin American customer and $6.0 million of SIHI PPA and integration expenses
3. Includes $3.5 million below-the-line FX gains 4. Includes tax impact of items above offset by $5.4 million of realignment expense recorded in
provision for income taxes
- Diluted EPS calculated using fully diluted shares of 130.9 million and 134.6 million shares in YTD 2016 and YTD 2015, respectively - Flowserve repurchased 0 and 4,833,146 shares in YTD 2016 and YTD 2015 respectively * Constant FX represents the year-over-year variance assuming 2016 results at 2015 FX rates ** YTD 2016 includes $3.5 million of gains arising from transactions in currencies other than our sites’ functional currencies and impact of foreign exchange contracts vs. a loss of $29.3 million YTD 2015
11 Flowserve Q3 2016 Earnings Conference Call : Page
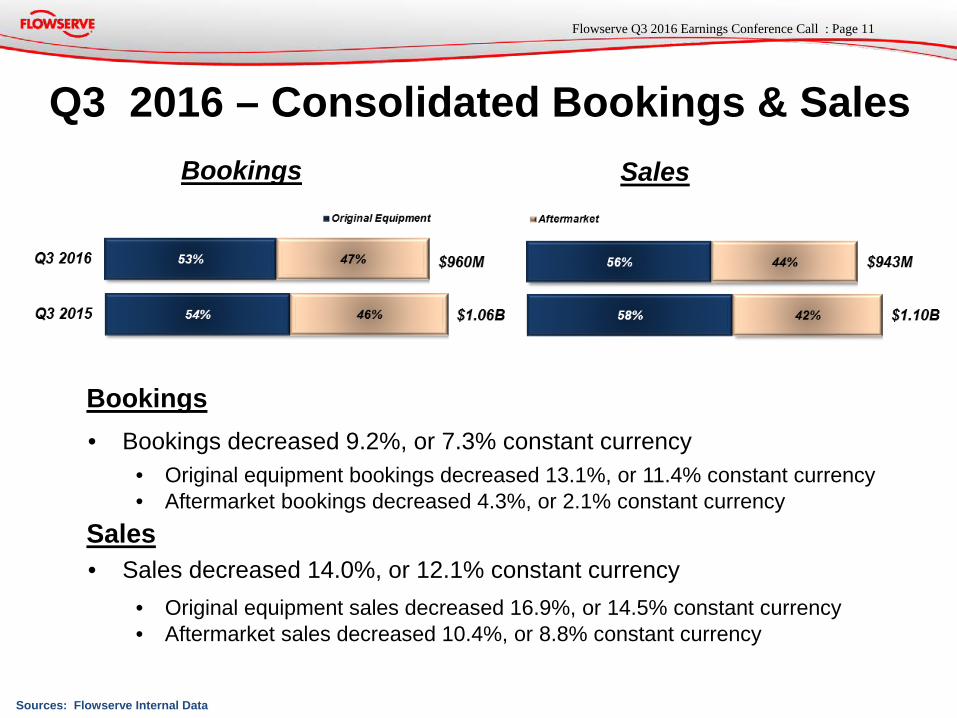
Q3 2016 – Consolidated Bookings & Sales
Sources: Flowserve Internal Data
Bookings • Bookings decreased 9.2%, or 7.3% constant currency
• Original equipment bookings decreased 13.1%, or 11.4% constant currency • Aftermarket bookings decreased 4.3%, or 2.1% constant currency
Sales • Sales decreased 14.0%, or 12.1% constant currency
• Original equipment sales decreased 16.9%, or 14.5% constant currency • Aftermarket sales decreased 10.4%, or 8.8% constant currency
Bookings Sales
12 Flowserve Q3 2016 Earnings Conference Call : Page
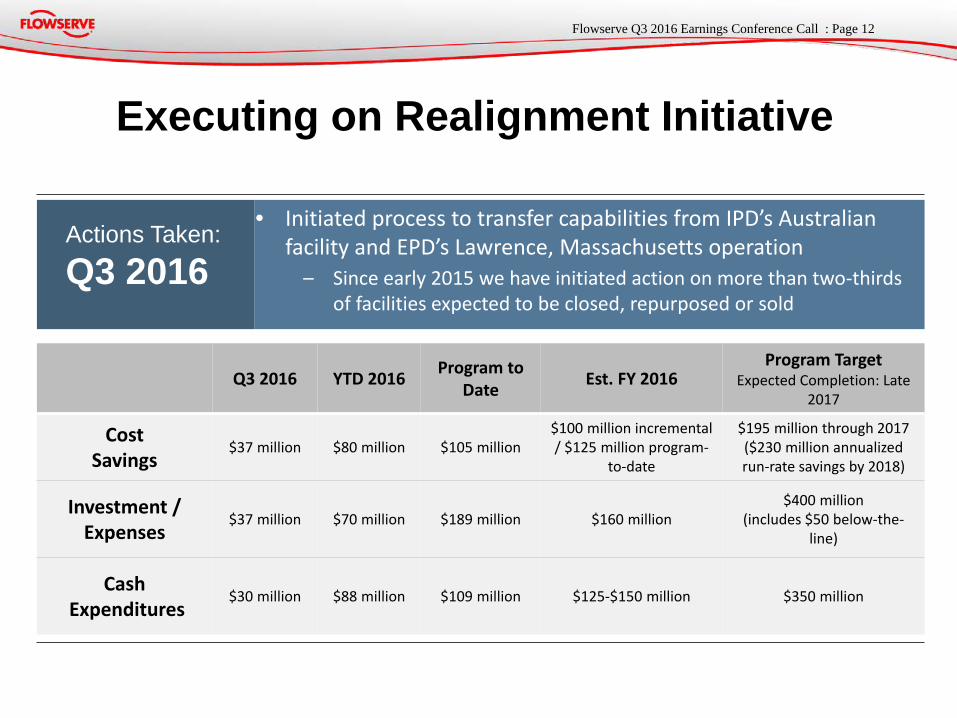
Executing on Realignment Initiative
Q3 2016 YTD 2016 Program to Date Est. FY 2016
Program Target Expected Completion: Late
2017
Cost Savings
$37 million $80 million $105 million $100 million incremental / $125 million program-
to-date
$195 million through 2017 ($230 million annualized run-rate savings by 2018)
Investment / Expenses
$37 million $70 million $189 million $160 million $400 million
(includes $50 below-the-line)
Cash Expenditures
$30 million $88 million $109 million $125-$150 million $350 million
Actions Taken: Q3 2016
• Initiated process to transfer capabilities from IPD’s Australian facility and EPD’s Lawrence, Massachusetts operation
– Since early 2015 we have initiated action on more than two-thirds of facilities expected to be closed, repurposed or sold
13 Flowserve Q3 2016 Earnings Conference Call : Page
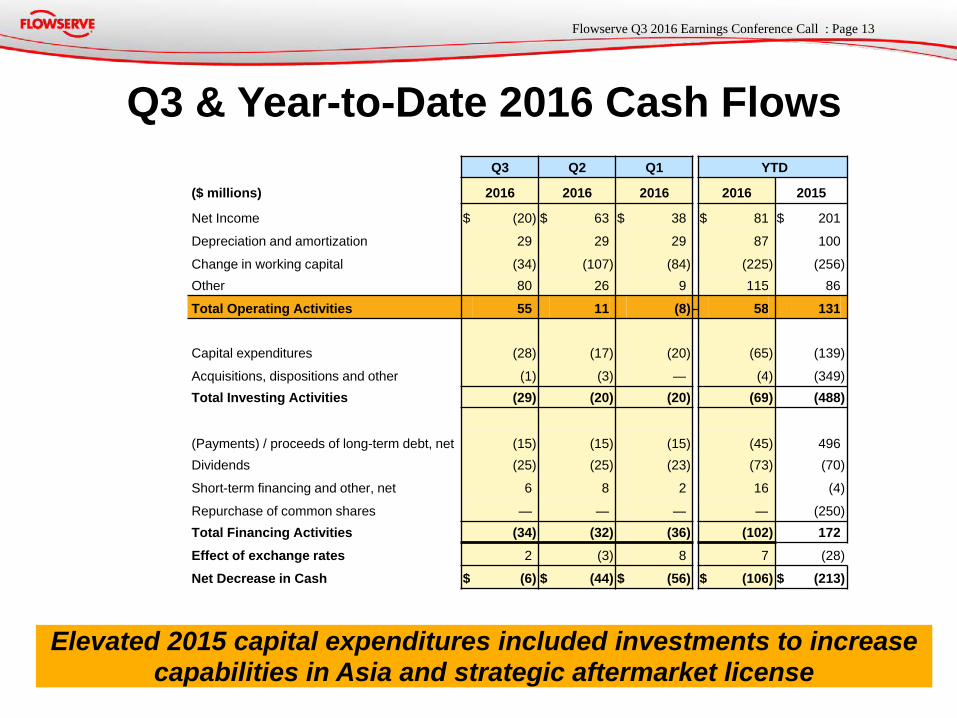
Q3 & Year-to-Date 2016 Cash Flows
Elevated 2015 capital expenditures included investments to increase capabilities in Asia and strategic aftermarket license
Q3 Q2 Q1 YTD
($ millions) 2016 2016 2016 2016 2015
Net Income $ (20 ) $ 63 $ 38 $ 81 $ 201
Depreciation and amortization 29 29 29 87 100
Change in working capital (34 ) (107 ) (84 ) (225 ) (256 ) Other 80 26 9 115 86
Total Operating Activities 55 11 (8 ) — 58 131
Capital expenditures (28 ) (17 ) (20 ) (65 ) (139 )
Acquisitions, dispositions and other (1 ) (3 ) — (4 ) (349 ) Total Investing Activities (29 ) (20 ) (20 ) (69 ) (488 )
(Payments) / proceeds of long-term debt, net (15 ) (15 ) (15 ) (45 ) 496 Dividends (25 ) (25 ) (23 ) (73 ) (70 )
Short-term financing and other, net 6 8 2 16 (4 )
Repurchase of common shares — — — — (250 ) Total Financing Activities (34 ) (32 ) (36 ) (102 ) 172 Effect of exchange rates 2 (3 ) 8 7 (28 )
Net Decrease in Cash $ (6 ) $ (44 ) $ (56 ) $ (106 ) $ (213 )
14 Flowserve Q3 2016 Earnings Conference Call : Page
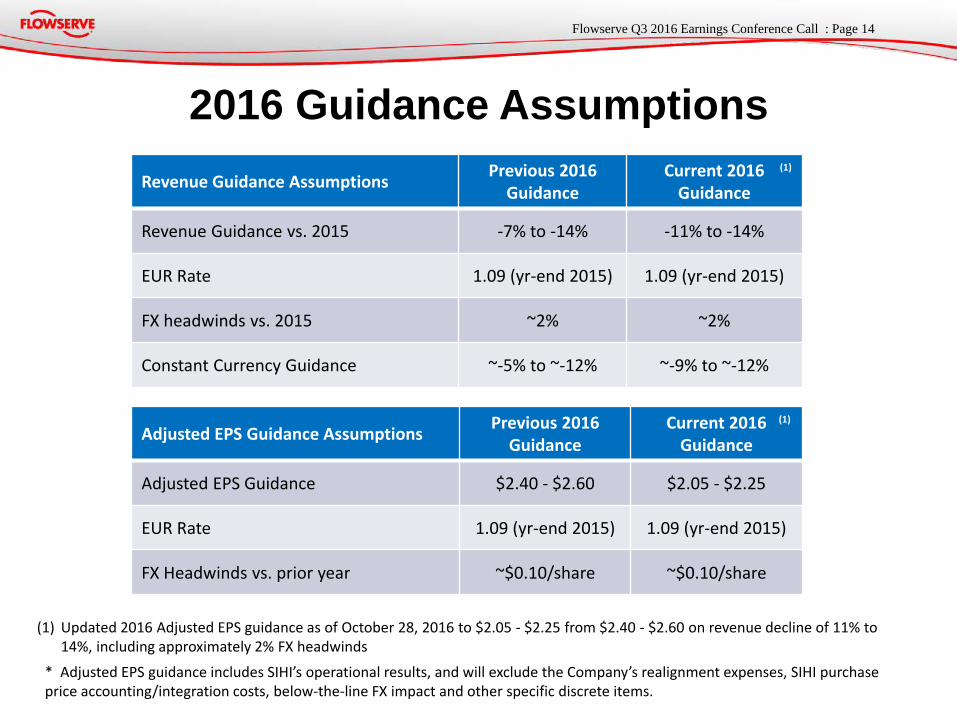
2016 Guidance Assumptions
Adjusted EPS Guidance Assumptions Previous 2016 Guidance
Current 2016 Guidance
Adjusted EPS Guidance $2.40 - $2.60 $2.05 - $2.25
EUR Rate 1.09 (yr-end 2015) 1.09 (yr-end 2015)
FX Headwinds vs. prior year ~$0.10/share ~$0.10/share
Revenue Guidance Assumptions Previous 2016 Guidance
Current 2016 Guidance
Revenue Guidance vs. 2015 -7% to -14% -11% to -14%
EUR Rate 1.09 (yr-end 2015) 1.09 (yr-end 2015)
FX headwinds vs. 2015 ~2% ~2%
Constant Currency Guidance ~-5% to ~-12% ~-9% to ~-12%
(1)
* Adjusted EPS guidance includes SIHI’s operational results, and will exclude the Company’s realignment expenses, SIHI purchase price accounting/integration costs, below-the-line FX impact and other specific discrete items.
(1) Updated 2016 Adjusted EPS guidance as of October 28, 2016 to $2.05 - $2.25 from $2.40 - $2.60 on revenue decline of 11% to 14%, including approximately 2% FX headwinds
(1)
15 Flowserve Q3 2016 Earnings Conference Call : Page
• Strategic investment of approximately $125 to $150 million in cost efficiency and manufacturing optimization initiatives
• Estimate capital expenditures to be $105 – $115 million
• Capital allocation policy of annually returning 40 – 50% of running 2-year average net earnings to shareholders
• Scheduled full year debt principal reduction of $60 million - $15 million in 2016 Q4
• Estimate U.S. and non-U.S. pension fund pre-tax contributions to be approximately $30 – $35 million
• Other strategic opportunities, after disciplined analysis
2016 Cash Use Priorities

16 Flowserve Q3 2016 Earnings Conference Call : Page
Questions and Answers
17 Flowserve Q3 2016 Earnings Conference Call : Page
Appendix
18 Flowserve Q3 2016 Earnings Conference Call : Page
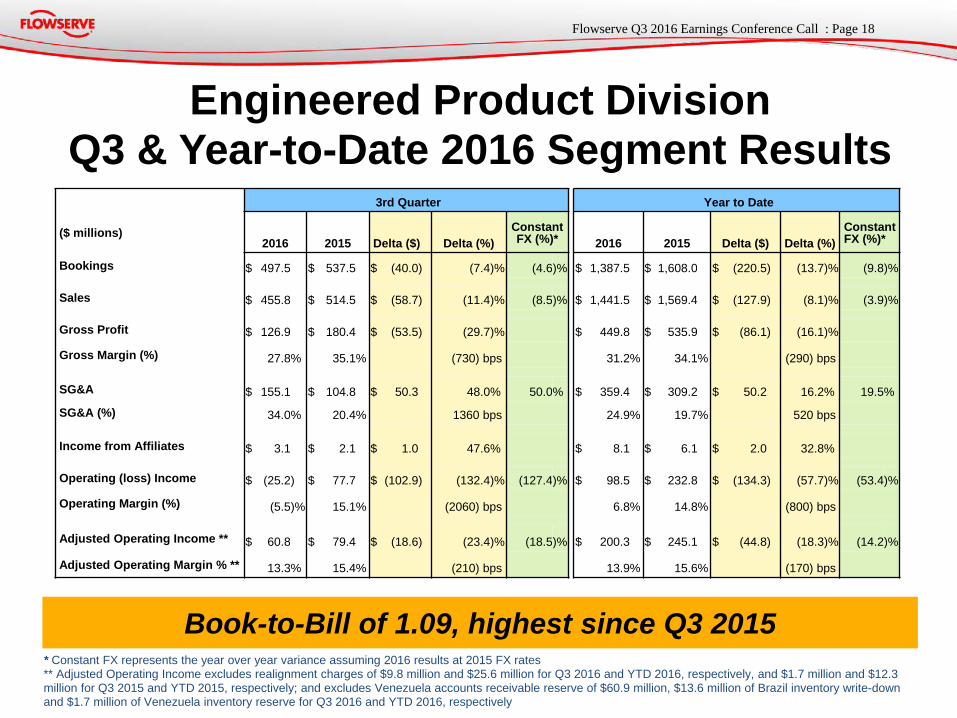
Engineered Product Division Q3 & Year-to-Date 2016 Segment Results
* Constant FX represents the year over year variance assuming 2016 results at 2015 FX rates ** Adjusted Operating Income excludes realignment charges of $9.8 million and $25.6 million for Q3 2016 and YTD 2016, respectively, and $1.7 million and $12.3 million for Q3 2015 and YTD 2015, respectively; and excludes Venezuela accounts receivable reserve of $60.9 million, $13.6 million of Brazil inventory write-down and $1.7 million of Venezuela inventory reserve for Q3 2016 and YTD 2016, respectively
Book-to-Bill of 1.09, highest since Q3 2015
3rd Quarter Year to Date
($ millions) 2016 2015 Delta ($) Delta (%)
Constant FX (%)* 2016 2015 Delta ($) Delta (%)
Constant FX (%)*
Bookings $ 497.5 $ 537.5 $ (40.0 ) (7.4 )% (4.6 )% $ 1,387.5 $ 1,608.0 $ (220.5 ) (13.7 )% (9.8 )%
Sales $ 455.8 $ 514.5 $ (58.7 ) (11.4 )% (8.5 )% $ 1,441.5 $ 1,569.4 $ (127.9 ) (8.1 )% (3.9 )%
Gross Profit $ 126.9 $ 180.4 $ (53.5 ) (29.7 )% $ 449.8 $ 535.9 $ (86.1 ) (16.1 )%
Gross Margin (%) 27.8 % 35.1 % (730) bps 31.2 % 34.1 % (290) bps
SG&A $ 155.1 $ 104.8 $ 50.3 48.0 % 50.0 % $ 359.4 $ 309.2 $ 50.2 16.2 % 19.5 %
SG&A (%) 34.0 % 20.4 % 1360 bps 24.9 % 19.7 % 520 bps
Income from Affiliates $ 3.1 $ 2.1 $ 1.0 47.6 % $ 8.1 $ 6.1 $ 2.0 32.8 %
Operating (loss) Income $ (25.2 ) $ 77.7 $ (102.9 ) (132.4 )% (127.4 )% $ 98.5 $ 232.8 $ (134.3 ) (57.7 )% (53.4 )%
Operating Margin (%) (5.5 )% 15.1 % (2060) bps 6.8 % 14.8 % (800) bps
Adjusted Operating Income ** $ 60.8 $ 79.4 $ (18.6 ) (23.4 )% (18.5 )% $ 200.3 $ 245.1 $ (44.8 ) (18.3 )% (14.2 )%
Adjusted Operating Margin % ** 13.3 % 15.4 % (210) bps 13.9 % 15.6 % (170) bps
19 Flowserve Q3 2016 Earnings Conference Call : Page
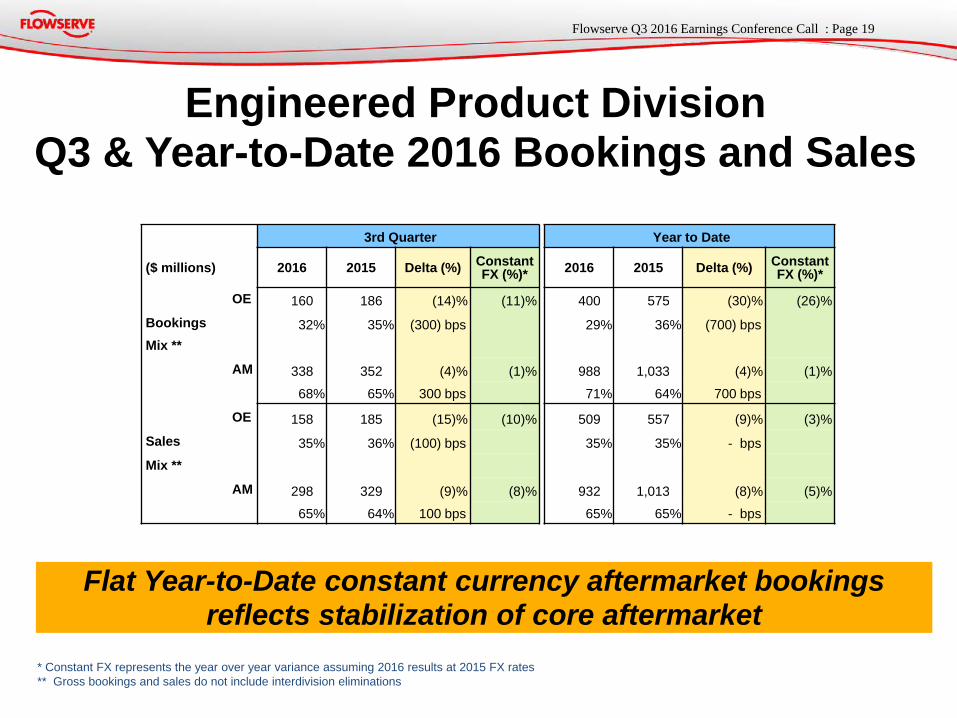
Engineered Product Division Q3 & Year-to-Date 2016 Bookings and Sales
* Constant FX represents the year over year variance assuming 2016 results at 2015 FX rates ** Gross bookings and sales do not include interdivision eliminations
Flat Year-to-Date constant currency aftermarket bookings reflects stabilization of core aftermarket
3rd Quarter Year to Date
($ millions) 2016 2015 Delta (%) Constant FX (%)* 2016 2015 Delta (%) Constant
FX (%)*
OE 160 186 (14 )% (11 )% 400 575 (30 )% (26 )% Bookings 32 % 35 % (300) bps 29 % 36 % (700) bps Mix **
AM 338 352 (4 )% (1 )% 988 1,033 (4 )% (1 )%
68 % 65 % 300 bps 71 % 64 % 700 bps
OE 158 185 (15 )% (10 )% 509 557 (9 )% (3 )% Sales 35 % 36 % (100) bps 35 % 35 % - bps Mix **
AM 298 329 (9 )% (8 )% 932 1,013 (8 )% (5 )%
65 % 64 % 100 bps 65 % 65 % - bps

20 Flowserve Q3 2016 Earnings Conference Call : Page
Engineered Product Division Q3 Overview • Bookings decreased 7.4%, or 4.6% on a constant currency
basis • Decrease driven primarily by chemical and power, partially offset by
increased oil and gas bookings • Bookings decreases into Asia Pacific and North America, partially offset
by increased bookings into Europe
• Sales decreased 11.4%, or 8.5% on a constant currency basis • Sales decline driven primary by decreased sales into Latin America and
Asia Pacific
• Gross margin decreased 730 basis points to 27.8% • Excluding realignment and Latin American charges, adjusted gross
margin declined 210 basis points to 33.0%, primarily due to under-absorption of fixed manufacturing costs
• Operating margin decreased 2,060 basis points to -5.5% • Excluding realignment and Latin American charges, adjusted operating
margin declined 210 basis points to 13.3%
21 Flowserve Q3 2016 Earnings Conference Call : Page
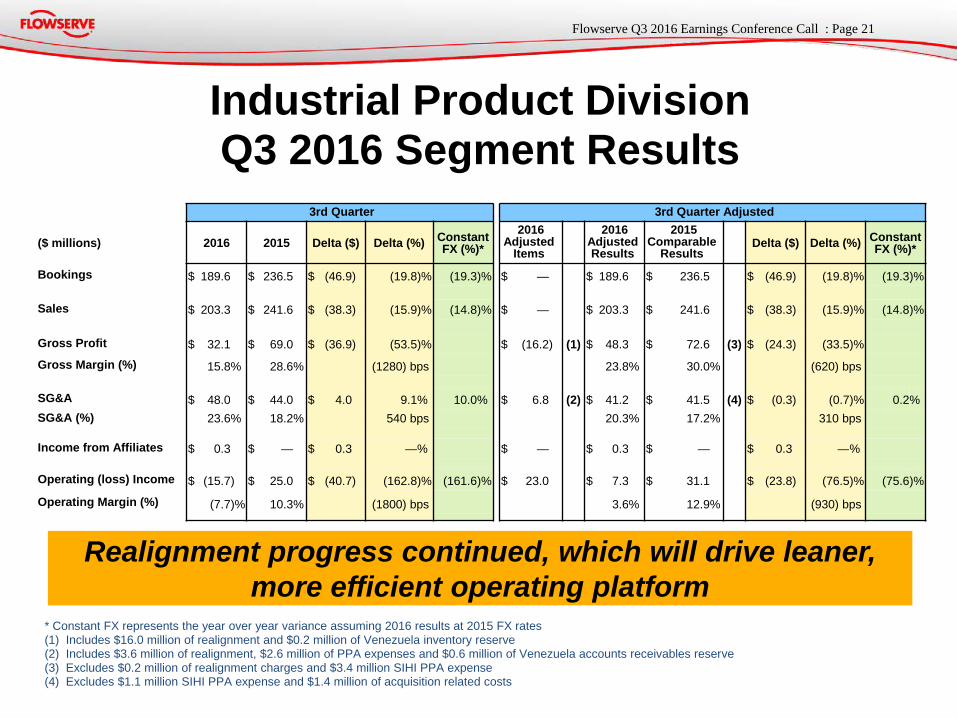
Industrial Product Division Q3 2016 Segment Results
* Constant FX represents the year over year variance assuming 2016 results at 2015 FX rates (1) Includes $16.0 million of realignment and $0.2 million of Venezuela inventory reserve (2) Includes $3.6 million of realignment, $2.6 million of PPA expenses and $0.6 million of Venezuela accounts receivables reserve (3) Excludes $0.2 million of realignment charges and $3.4 million SIHI PPA expense (4) Excludes $1.1 million SIHI PPA expense and $1.4 million of acquisition related costs
Realignment progress continued, which will drive leaner, more efficient operating platform
3rd Quarter 3rd Quarter Adjusted
($ millions) 2016 2015 Delta ($) Delta (%) Constant FX (%)*
2016 Adjusted
Items
2016 Adjusted Results
2015 Comparable
Results Delta ($) Delta (%) Constant
FX (%)*
Bookings $ 189.6 $ 236.5 $ (46.9 ) (19.8 )% (19.3 )% $ — $ 189.6 $ 236.5 $ (46.9 ) (19.8 )% (19.3 )%
Sales $ 203.3 $ 241.6 $ (38.3 ) (15.9 )% (14.8 )% $ — $ 203.3 $ 241.6 $ (38.3 ) (15.9 )% (14.8 )%
Gross Profit $ 32.1 $ 69.0 $ (36.9 ) (53.5 )% $ (16.2 ) (1) $ 48.3 $ 72.6 (3) $ (24.3 ) (33.5 )%
Gross Margin (%) 15.8 % 28.6 % (1280) bps 23.8 % 30.0 % (620) bps
SG&A $ 48.0 $ 44.0 $ 4.0 9.1 % 10.0 % $ 6.8 (2) $ 41.2 $ 41.5 (4) $ (0.3 ) (0.7 )% 0.2 % SG&A (%) 23.6 % 18.2 % 540 bps 20.3 % 17.2 % 310 bps
Income from Affiliates $ 0.3 $ — $ 0.3 — % $ — $ 0.3 $ — $ 0.3 — %
Operating (loss) Income $ (15.7 ) $ 25.0 $ (40.7 ) (162.8 )% (161.6 )% $ 23.0 $ 7.3 $ 31.1 $ (23.8 ) (76.5 )% (75.6 )%
Operating Margin (%) (7.7 )% 10.3 % (1800) bps 3.6 % 12.9 % (930) bps

22 Flowserve Q3 2016 Earnings Conference Call : Page
Industrial Product Division Year-to-Date 2016 Segment Results
* Constant FX represents the year over year variance assuming 2016 results at 2015 FX rates (1) Includes $22.5 million of realignment and $0.2 million of Venezuela inventory reserve (2) Includes $5.8 million of realignment, $6.0 million of PPA expenses and $0.6 million of Venezuela accounts receivable reserve (3) Excludes $19.6 million of realignment charges, $18.1 million SIHI PPA expenses and $0.3 write-down (4) Excludes $11.6 million of realignment charges, $3.4 million SIHI PPA expense and $8.7 million of acquisition related costs
Year to Date Year to Date Adjusted
($ millions) 2016 2015 Delta ($) Delta (%)
Constant FX (%)*
2016 Adjusted
Items
2016 Adjusted Results
2015 Comparable
Results Delta ($) Delta (%) Constant FX (%)*
Bookings $ 609.5 $ 689.9 $ (80.4 ) (11.7 )% (10.6 )% $ — $ 609.5 $ 689.9 $ (80.4 ) (11.7 )% (10.6 )%
Sales $ 615.8 $ 725.8 $ (110.0 ) (15.2 )% (13.7 )% $ — $ 615.8 $ 725.8 $ (110.0 ) (15.2 )% (13.7 )%
Gross Profit $ 132.8 $ 170.7 $ (37.9 ) (22.2 )% $ (22.7 ) (1) $ 155.5 $ 208.7 (3) $ (53.2 ) (25.5 )%
Gross Margin (%) 21.6 % 23.5 % (190) bps 25.3 % 28.8 % (350) bps
SG&A $ 139.8 $ 151.9 $ (12.1 ) (8.0 )% (6.5 )% $ 12.4 (2) $ 127.4 $ 128.2 (4) $ (0.8 ) (0.6 )% 1.1 % SG&A (%) 22.7 % 20.9 % 180 bps 20.7 % 17.7 % 300 bps
Income from Affiliates $ 0.8 $ — $ 0.8 - % $ — $ 0.8 $ — $ 0.8 - %
Operating (Loss) Income $ (6.2 ) $ 18.7 $ (24.9 ) (133.2 )% (125.7 )% $ 35.1 $ 28.9 $ 80.5 $ (51.6 ) (64.1 )% (62.4 )% Operating Margin (%) (1.0 )% 2.6 % (360) bps 4.7 % 11.1 % (640) bps
23 Flowserve Q3 2016 Earnings Conference Call : Page
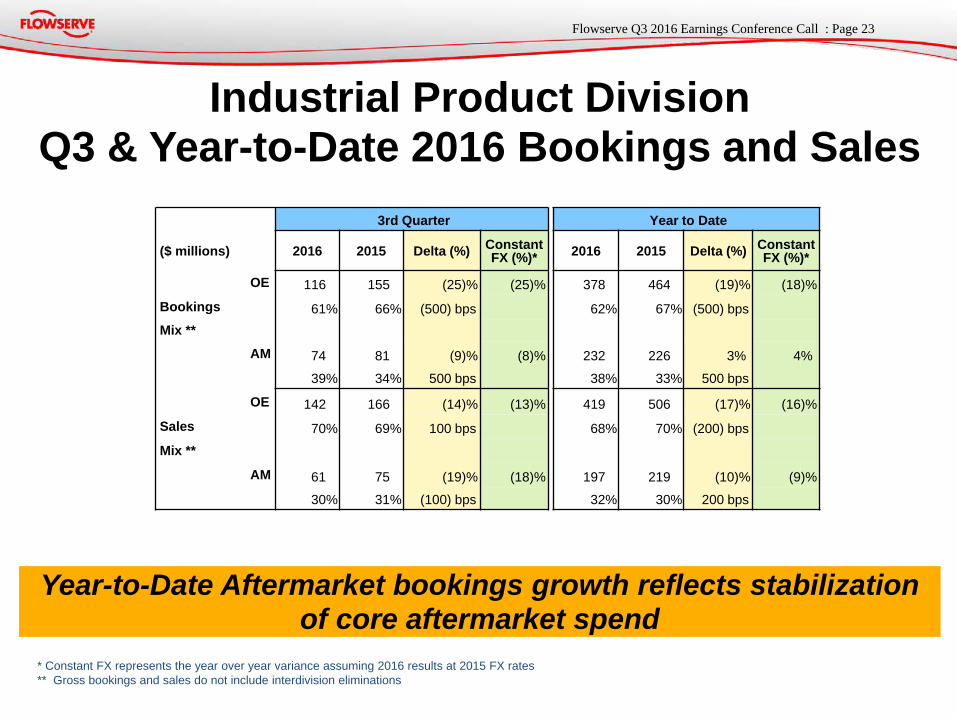
Industrial Product Division Q3 & Year-to-Date 2016 Bookings and Sales
* Constant FX represents the year over year variance assuming 2016 results at 2015 FX rates ** Gross bookings and sales do not include interdivision eliminations
Year-to-Date Aftermarket bookings growth reflects stabilization of core aftermarket spend
3rd Quarter Year to Date
($ millions) 2016 2015 Delta (%) Constant FX (%)* 2016 2015 Delta (%) Constant
FX (%)*
OE 116 155 (25 )% (25 )% 378 464 (19 )% (18 )% Bookings 61 % 66 % (500) bps 62 % 67 % (500) bps Mix **
AM 74 81 (9 )% (8 )% 232 226 3 % 4 %
39 % 34 % 500 bps 38 % 33 % 500 bps
OE 142 166 (14 )% (13 )% 419 506 (17 )% (16 )% Sales 70 % 69 % 100 bps 68 % 70 % (200) bps Mix **
AM 61 75 (19 )% (18 )% 197 219 (10 )% (9 )%
30 % 31 % (100) bps 32 % 30 % 200 bps
24 Flowserve Q3 2016 Earnings Conference Call : Page
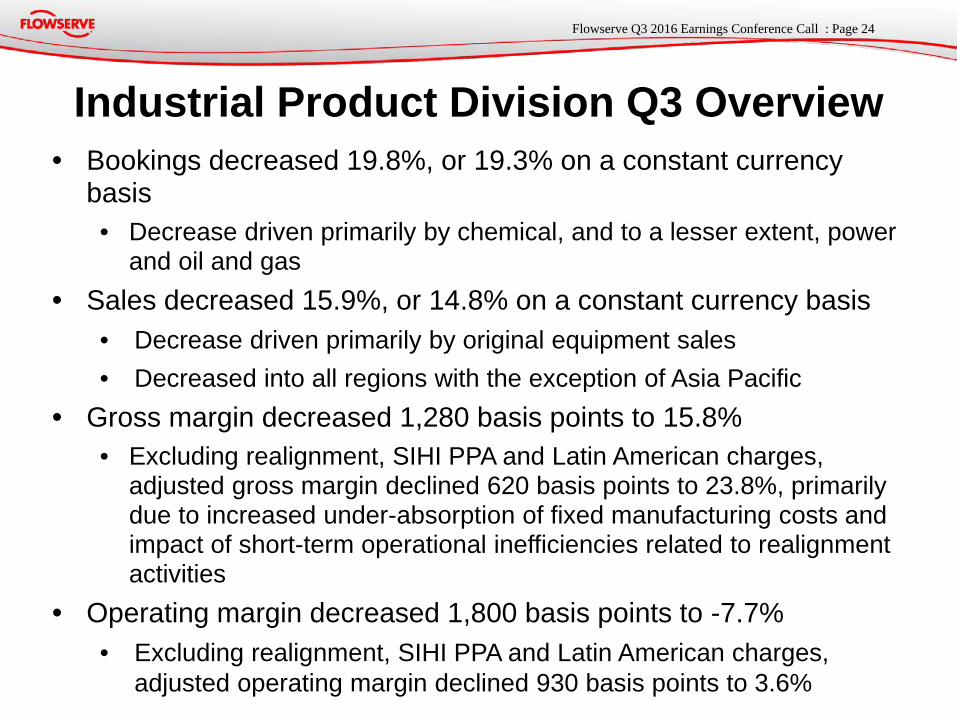
Industrial Product Division Q3 Overview • Bookings decreased 19.8%, or 19.3% on a constant currency
basis • Decrease driven primarily by chemical, and to a lesser extent, power
and oil and gas • Sales decreased 15.9%, or 14.8% on a constant currency basis
• Decrease driven primarily by original equipment sales • Decreased into all regions with the exception of Asia Pacific
• Gross margin decreased 1,280 basis points to 15.8% • Excluding realignment, SIHI PPA and Latin American charges,
adjusted gross margin declined 620 basis points to 23.8%, primarily due to increased under-absorption of fixed manufacturing costs and impact of short-term operational inefficiencies related to realignment activities
• Operating margin decreased 1,800 basis points to -7.7% • Excluding realignment, SIHI PPA and Latin American charges,
adjusted operating margin declined 930 basis points to 3.6%
25 Flowserve Q3 2016 Earnings Conference Call : Page
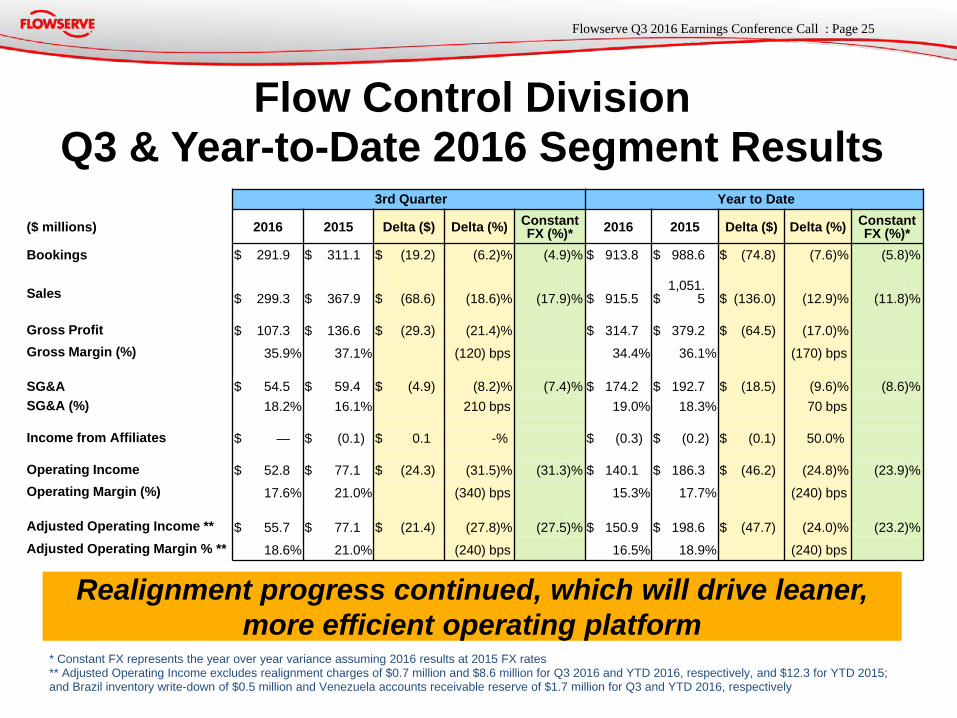
Flow Control Division Q3 & Year-to-Date 2016 Segment Results
* Constant FX represents the year over year variance assuming 2016 results at 2015 FX rates ** Adjusted Operating Income excludes realignment charges of $0.7 million and $8.6 million for Q3 2016 and YTD 2016, respectively, and $12.3 for YTD 2015; and Brazil inventory write-down of $0.5 million and Venezuela accounts receivable reserve of $1.7 million for Q3 and YTD 2016, respectively
Realignment progress continued, which will drive leaner, more efficient operating platform
3rd Quarter Year to Date
($ millions) 2016 2015 Delta ($) Delta (%) Constant FX (%)* 2016 2015 Delta ($) Delta (%) Constant
FX (%)* Bookings $ 291.9 $ 311.1 $ (19.2 ) (6.2 )% (4.9 )% $ 913.8 $ 988.6 $ (74.8 ) (7.6 )% (5.8 )%
Sales $ 299.3 $ 367.9 $ (68.6 ) (18.6 )% (17.9 )% $ 915.5 $ 1,051.
5 $ (136.0 ) (12.9 )% (11.8 )%
Gross Profit $ 107.3 $ 136.6 $ (29.3 ) (21.4 )% $ 314.7 $ 379.2 $ (64.5 ) (17.0 )% Gross Margin (%) 35.9 % 37.1 % (120) bps 34.4 % 36.1 % (170) bps
SG&A $ 54.5 $ 59.4 $ (4.9 ) (8.2 )% (7.4 )% $ 174.2 $ 192.7 $ (18.5 ) (9.6 )% (8.6 )% SG&A (%) 18.2 % 16.1 % 210 bps 19.0 % 18.3 % 70 bps
Income from Affiliates $ — $ (0.1 ) $ 0.1 - % $ (0.3 ) $ (0.2 ) $ (0.1 ) 50.0 %
Operating Income $ 52.8 $ 77.1 $ (24.3 ) (31.5 )% (31.3 )% $ 140.1 $ 186.3 $ (46.2 ) (24.8 )% (23.9 )% Operating Margin (%) 17.6 % 21.0 % (340) bps 15.3 % 17.7 % (240) bps
Adjusted Operating Income ** $ 55.7 $ 77.1 $ (21.4 ) (27.8 )% (27.5 )% $ 150.9 $ 198.6 $ (47.7 ) (24.0 )% (23.2 )% Adjusted Operating Margin % ** 18.6 % 21.0 % (240) bps 16.5 % 18.9 % (240) bps

26 Flowserve Q3 2016 Earnings Conference Call : Page
Flow Control Division Q3 & Year-to-Date 2016 Bookings and Sales
* Constant FX represents the year over year variance assuming 2016 results at 2015 FX rates ** Gross bookings and sales do not include interdivision eliminations
3rd Quarter Year to Date
($ millions) 2016 2015 Delta (%) Constant FX (%)* 2016 2015 Delta (%) Constant
FX (%)*
OE 241 249 (3 )% (2 )% 725 786 (8 )% (6 )% Bookings 83 % 80 % 300 bps 79 % 80 % (100) bps Mix **
AM 50 62 (19 )% (19 )% 188 202 (7 )% (6 )% 17 % 20 % (300) bps 21 % 20 % 100 bps
OE 240 302 (21 )% (20 )% 730 854 (15 )% (14 )% Sales 80 % 82 % (200) bps 80 % 81 % (100) bps Mix **
AM 59 67 (12 )% (12 )% 185 197 (6 )% (5 )% 20 % 18 % 200 bps 20 % 19 % 100 bps

27 Flowserve Q3 2016 Earnings Conference Call : Page
Flow Control Division Q3 Overview • Bookings decreased 6.2%, or 4.9% on a constant currency basis
• Decreased bookings driven primarily by general industries, partially offset by oil and gas and chemical
• Decreased bookings into the Middle East and Africa, North America and Latin America, partially offset by increased bookings into Asia Pacific and Europe
• Sales decreased 18.6%, or 17.9% on a constant currency basis • Driven primarily by decreased original equipment sales • Sales decreased into all regions
• Gross margin decreased 120 basis points to 35.9%, primarily due to under-absorption of fixed manufacturing costs and lower margin projects shipped from backlog, partially offset by realignment savings
• Operating margin decreased 340 basis points to 17.6% • Excluding realignment and Latin American charges, adjusted
operating margin declined 240 basis points to 18.6%

28 Flowserve Q3 2016 Earnings Conference Call : Page
* Advance cash commitments from customers to fund working capital
Balances for All Periods as a % of Trailing Twelve Months Sales
Primary Working Capital
Accounts Receivable Accounts Receivable DSO at 86 days for both Q3 2016 and 2015
Inventory Inventory turns were 2.6 times in Q3 2016, versus 2.5 times in 2015
Q3 2016 Q3 2015
($ millions) $ % $ %
Receivables 897 21.3 % 1,000 21.5 % Inventory 1,039 24.7 % 1,116 24.0 %
Payables (395 ) (9.4 )% (459 ) (9.9 )%
Primary Working Capital 1,541 36.6 % 1,657 35.6 %
Advance Cash* (306 ) (7.3 )% (376 ) (8.1 )%
Total 1,235 29.3 % 1,281 27.5 %
Backlog 2,138 2,560
29 Flowserve Q3 2016 Earnings Conference Call : Page


