
2011 Annual Childhood Lead Poisoning Surveillance Report
Florida Department of Health Healthy Homes and Lead Poisoning
Prevention Program
Published: August 2012
2
Section Page Number Introduction………………………………………………………………………………..3 Florida’s Healthy Homes & Lead Poisoning Prevention Program ……….. ….. 4 Potential Sources of Lead Exposure………………………………………………… 5 Florida Blood Lead Screening Guidelines………………………………………….. 6 Blood Lead Surveillance in Florida………………………………………………... .. 7 Statewide and County Trends Screenings and Reported New Cases...……….…..…………………………..8 Reported New and Persistent Cases Combined..….………………. ….…….9 Sources of Lead Exposure…………………………………….….……………..10 Rate of Reported New Cases Per 1,000 Children Screened………….……..11
Number of Reported New Cases by Blood Lead Category…………. ….…..12 Reported New Cases by Age and Blood Lead Level………………………....13 Reported New Cases by Gender ……………………………………………….14
Reported Screenings by County ………..………………………………………15 Screening Rates by County…..……………….. …...…………………….…….16 Reported New Cases by County…..……………….. ………………………….17 Case Rates by County…..……………….. ……………………………….…….18 Reported New and Persistent Cases Combined by County………………….19 References and Resources……………………………………………………………..20 Glossary and Acknowledgements..…………………………………………………...21 Current FHHLPPP Contacts …………………………………………………………....22
Content F
L L
ead
Po
iso
nin
g P
reventio
n &
He
althy H
om
es P
rog
ram
2
011
An
nu
al C
hild
ho
od
Surv
eill
ance
Rep
ort
3
INTRODUCTION The surveillance findings presented in the 2011 Childhood Lead Poisoning Surveillance Annual Report are based on reported blood lead test data for children less than six years old in Florida. Statewide analyses were conducted over a five year period (2007-2011) to determine trends in screening and case rates among children tested for lead poisoning. For the last five years (2007 to 2011), the screening rate increased by 7 percent. Although the number of new cases declined consistently from 2007 to 2009, there was an increase (34%) in the number of newly identified lead poisoned cases from 2009 to 2010 (190 and 254 respectively). This may be due to an increase in the identification of cases in high-risk zip codes and among high-risk populations. However, in 2011 a 22 percent decrease was found in the number of newly identified lead poisoned cases in compari-son to 2010. This decline in cases may be due to enhanced primary prevention activities in identify-ing and recommending services for the elimination of lead poisonings amongst high-risk children. Current lead poisoning research state that children under the age of six years are considered to be at high-risk because they tend to put their hands or other objects into their mouths, they absorb a greater percentage of lead, and their developing bodies are more vulnerable to lead’s effects. Our findings are consistent with this research. In 2011, the 12-23 months of age group category was not-ed to have the highest risk for lead poisoning. Specifically, it was found that this age group category represented the largest percent (32 percent) of new cases. Over the past five years, most reported new cases have BLLs ranging from 10 to14 μg/dL. In 2011, 71 percent (45 cases) of reported new cases (63 cases), 12-23 months of age, had BLLs within the 10 to14 μg/dL range. This age group also had the highest proportion of those cases testing > 20ug/dl. Therefore, this age group is highly recommended for blood lead testing by the Centers for Disease Control and Prevention (CDC) and the Florida Medicaid. We know early identification through blood lead screening, testing and treat-ment of lead poisoning reduces the risk that children will suffer permanent damage. We will continue to promote these practices and reduce the burden of childhood lead poisoning in Florida.
Florida’s Healthy Homes Lead Poisoning Prevention and Program
FL H
ea
lth
y H
om
es &
Lea
d P
ois
on
ing
Pre
ve
ntio
n P
rog
ram
2
011
An
nu
al C
hild
ho
od
Surv
eill
ance
Rep
ort
4
HEALTH EFFECTS OF CHILDHOOD LEAD EXPOSURE There is no safe level of lead in the blood. Research suggests that even blood lead levels below the current level of concern, 10 µg/dL, can have harmful effects (Canfield et al., 2003).The higher the blood lead level the greater the impact on the health and cognitive development of a child. Very high levels of blood lead concentrations may result in seizures, coma, and death. MISSION The mission of Florida’s Healthy Homes & Lead Poisoning Prevention Program (FHHLPPP) is to protect the health and cognitive development of all children living in Florida by eliminating childhood exposure to all lead hazards. ELIMINATING CHILDHOOD LEAD POISONING IN FLORIDA The United States Department of Health and Human Services’ Healthy People 2010 strategy for improving the Nation’s health includes an objective to eliminate elevated blood lead levels in children less than 72 months of age. The FHHLPPP formed an advisory committee and created a strategic “elimination plan” to meet this objective in Florida. The committee, now called the Partnership for Lead Poisoning Prevention and Healthy Homes, meets annually. ABOUT THE FL HHLPP FHHLPP was established in 1992. The program currently undertakes the activities described below with support from the CDC, the Environmental Protection Agency (EPA), and the Florida Legislature. Program activities are implemented in partnership with the 67 counties in Florida.
Surveillance: The FHHLPPP works closely with laboratories and health care providers to collect the results of all blood lead tests. Data are used for statewide surveillance of lead screening and poisoning. Surveillance data are also used to evaluate the impact of lead screening promotion and lead poisoning prevention initiatives at the state and local levels.
Screening & Case Management: The FHHLPPP establishes blood lead screening guidelines and standard of care for lead poisoned children. The program provides education to health care providers across the state to ensure all children receive a blood lead test. The FHHLPPP is also establishing monitoring systems to ensure children diagnosed with lead poisoning receive timely and comprehensive case management including proper medical monitoring and services that
effectively protect the child from repeated lead exposure.
Primary Prevention / Community Outreach and Education: The FHHLPPP works to ensure families, communities, and professionals have the knowledge and tools needed to protect children from lead poisoning. The Lead Alert Network is one important primary prevention initiative. The FHHLPPP uses the network to distribute e-mail alerts to families when consumer products are
recalled due to lead content. Individuals can sign up by visiting: http://www.doh.state.fl.us/environment/community/lead/The_Lead_Alert_Network.htm. The Healthy Homes Project is another important primary prevention activity. Families with identified lead poisoning risk factors are offered enrollment into the project. Participants receive a comprehensive visual assessment of their homes by trained environmental health specialists. Lead and other environmental health hazards are identified and participants receive one-on-one coaching on how to minimize these hazards to create a healthy home.
Protective Policy: The FHHLPPP receives funding from the EPA and the CDC to explore the options for local oversight of federal regulations and policies at the state and local levels to support the primary prevention of lead poisoning and to prioritize and ensure care for children identified as lead poisoned.
Florida’s Healthy Homes & Lead Poisoning Prevention Program
FL H
ea
lth
y H
om
es &
Lea
d P
ois
on
ing
Pre
ve
ntio
n P
rog
ram
2
011
An
nu
al C
hild
ho
od
Surv
eill
ance
Rep
ort
5
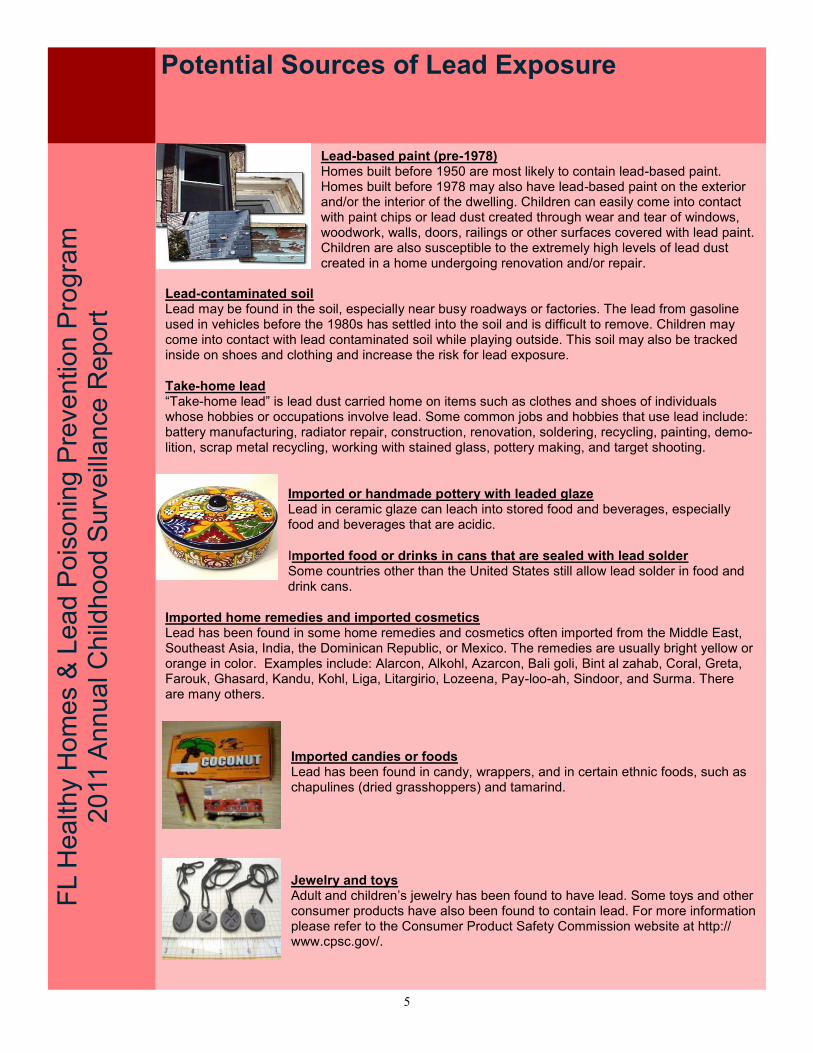
Lead-based paint (pre-1978) Homes built before 1950 are most likely to contain lead-based paint. Homes built before 1978 may also have lead-based paint on the exterior and/or the interior of the dwelling. Children can easily come into contact with paint chips or lead dust created through wear and tear of windows, woodwork, walls, doors, railings or other surfaces covered with lead paint. Children are also susceptible to the extremely high levels of lead dust created in a home undergoing renovation and/or repair.
Lead-contaminated soil Lead may be found in the soil, especially near busy roadways or factories. The lead from gasoline used in vehicles before the 1980s has settled into the soil and is difficult to remove. Children may come into contact with lead contaminated soil while playing outside. This soil may also be tracked inside on shoes and clothing and increase the risk for lead exposure.
Take-home lead “Take-home lead” is lead dust carried home on items such as clothes and shoes of individuals whose hobbies or occupations involve lead. Some common jobs and hobbies that use lead include: battery manufacturing, radiator repair, construction, renovation, soldering, recycling, painting, demo-lition, scrap metal recycling, working with stained glass, pottery making, and target shooting.
Imported or handmade pottery with leaded glaze Lead in ceramic glaze can leach into stored food and beverages, especially food and beverages that are acidic.
Imported food or drinks in cans that are sealed with lead solder Some countries other than the United States still allow lead solder in food and drink cans.
Imported home remedies and imported cosmetics Lead has been found in some home remedies and cosmetics often imported from the Middle East, Southeast Asia, India, the Dominican Republic, or Mexico. The remedies are usually bright yellow or orange in color. Examples include: Alarcon, Alkohl, Azarcon, Bali goli, Bint al zahab, Coral, Greta, Farouk, Ghasard, Kandu, Kohl, Liga, Litargirio, Lozeena, Pay-loo-ah, Sindoor, and Surma. There are many others.
Imported candies or foods Lead has been found in candy, wrappers, and in certain ethnic foods, such as chapulines (dried grasshoppers) and tamarind.
Jewelry and toys Adult and children’s jewelry has been found to have lead. Some toys and other consumer products have also been found to contain lead. For more information please refer to the Consumer Product Safety Commission website at http://www.cpsc.gov/.
Potential Sources of Lead Exposure F
L H
ea
lth
y H
om
es &
Lea
d P
ois
on
ing
Pre
ve
ntio
n P
rog
ram
2
011
An
nu
al C
hild
ho
od
Surv
eill
ance
Rep
ort

6
FLORIDA’S BLOOD LEAD SCREENING GUIDELINES 2006: The FHHLPPP recommends that the children falling into certain categories receive a blood lead test:
Children living in high-risk zip codes (defined as a census block-group with greater than or equal to 27 percent pre-1950 housing, or greater than or equal to 74 percent pre-1978 housing). (http://www.myfloridaeh.com/medicine/lead/CountyMap.html)
Children less than 72 months of age who do not have a documented blood lead screening by age two and live in high-risk zip codes.
Children who are Medicaid eligible.
Immigrant and refugee children.
Children adopted from outside the U.S.
Children in foster care.
Children with risk factors listed on the Florida Department of Health Lead Poisoning Risk Assessment Questionnaire (Screening & Case Management Guide, 2008: http://www.myfloridaeh.com/medicine/lead/education.htm)
Florida Medicaid guidelines, in accordance with federal requirements, stipulate that all children enrolled in Medicaid must receive a blood lead screening test at 12 and 24 months of age. The guidelines also specify that a blood test must be done for children 36 to 72 months of age if they have not been previously screened for lead poisoning (Florida Medicaid Child Health Check-Up Coverage and Limitations Handbook). FLORIDA’S CASE DEFINITION OF CHILDHOOD LEAD POISONING Florida defines lead poisoning as a blood lead level of 10 µg/dL or greater of whole blood measured from a venous specimen or blood lead levels of 10 µg/dL or greater measured from two capillary draws taken within 12 weeks of one another. The population of greatest concern for lead poisoning is children less than 72 months of age. A confirmed case is considered a “new case” if it was never previously reported. A persistent case is a case confirmed during a previous year and whose blood lead level (BLL) remains elevated (≥10 µg/dL) in subsequent years.
Florida Blood Lead Screening Guidelines F
L H
ea
lth
y H
om
es &
Lea
d P
ois
on
ing
Pre
ve
ntio
n P
rog
ram
2
011
An
nu
al C
hild
ho
od
Surv
eill
ance
Rep
ort
7
HISTORY OF BLOOD LEAD SURVEILLANCE IN FLORIDA Blood lead data collection in Florida dates back to 1992 when lead poisoning became a notifiable disease. Only blood lead levels greater than or equal to 10µg/dL were required to be reported by laboratories and physicians for 1992 up to 2005. During this time period, some laboratories volun-tarily provided results less than 10 µg/dL. On November 20, 2006 laboratory reporting requirements were expanded. State regulations (shown below) now require laboratories to report blood lead levels (BLLs) of ALL blood lead tests. This includes users of portable blood lead testing devices.
LABORATORY REPORTING REQUIREMENTS The Florida Statutes, Chapter 381, stipulates that practitioners and laboratory personnel should report diseases of Public Health Significance to the Department of Health. Chapter 64D-3 of the Florida Administrative Code states that laboratories are responsible for providing all of the following information with each blood lead record:
(a) The Patient’s: 1. first and last name, including middle initial 2. address, including city, state and zip code 3. phone number, including area code 4. date of birth 5. sex 6. race 7. ethnicity (specify if of Hispanic descent or not of Hispanic descent) 8. pregnancy status 9. Social Security number
(b) The Laboratory/Entity Using Portable Lead Testing Devices: 1. name 2. address 3. telephone number of laboratory performing blood lead test 4. type of specimen (for example, venous vs. capillary specimen) 5. date of specimen collection 6. date of report 7. type of test (s) performed 8. all available results
(c) The Submitting Provider’s: 1. name
2. address 3. telephone number, including area code
A NOTE ON DATA LIMITATIONS There are several limitations inherent in population-based surveillance data. The data collected by the FHHLPPP are no exception. Several caveats are bulleted below.
In late 2006, the FHHLPPP conducted active outreach to laboratories to educate them about the new reporting regulations. Laboratories that had not previously reported lead test results began reporting at this time. This enhanced reporting may have increased the screening and case numbers reported when compared to previous years.
Generally, race and ethnicity are underreported. The information reported on race may not reflect the true racial composition of lead poisoned children in Florida.
Data presented in this report may vary from data reported for lead by other agencies or from other sources due to variation in the data sources, methods of analysis, and/or data linkage.
It is important to note that not all children receive a blood lead test in Florida. FL DOH recommends that all at-risk children are screened for lead poisoning, however many of these children are not cared for by traditional health care systems and may not receive an initial blood lead test. As a result, some cases of lead poisoning may never be identified or reported.
FL H
ea
lth
y H
om
es &
Lea
d P
ois
on
ing
Pre
ve
ntio
n P
rog
ram
2
011
An
nu
al C
hild
ho
od
Surv
eill
ance
Rep
ort
Blood Lead Surveillance in Florida: Understanding Lead Surveillance Data
8
5-Year Statewide Trends: Number of Children Screened and Reported New Cases
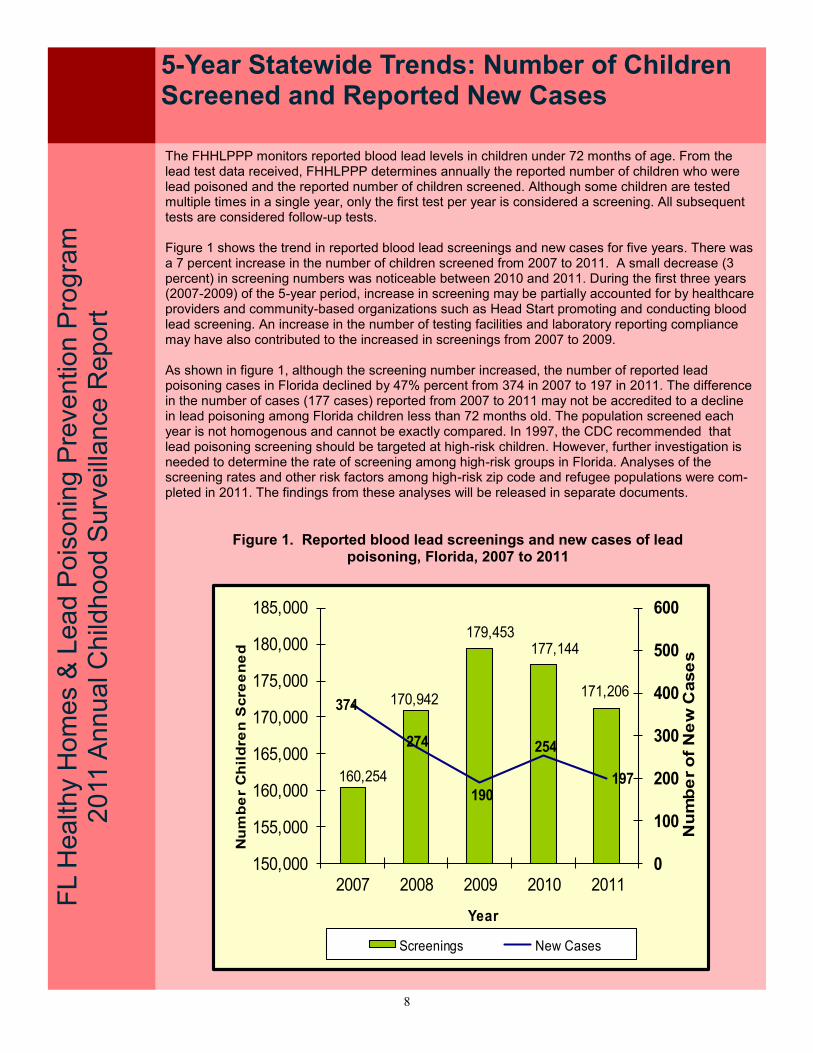
The FHHLPPP monitors reported blood lead levels in children under 72 months of age. From the lead test data received, FHHLPPP determines annually the reported number of children who were lead poisoned and the reported number of children screened. Although some children are tested multiple times in a single year, only the first test per year is considered a screening. All subsequent tests are considered follow-up tests. Figure 1 shows the trend in reported blood lead screenings and new cases for five years. There was a 7 percent increase in the number of children screened from 2007 to 2011. A small decrease (3 percent) in screening numbers was noticeable between 2010 and 2011. During the first three years (2007-2009) of the 5-year period, increase in screening may be partially accounted for by healthcare providers and community-based organizations such as Head Start promoting and conducting blood lead screening. An increase in the number of testing facilities and laboratory reporting compliance may have also contributed to the increased in screenings from 2007 to 2009. As shown in figure 1, although the screening number increased, the number of reported lead poisoning cases in Florida declined by 47% percent from 374 in 2007 to 197 in 2011. The difference in the number of cases (177 cases) reported from 2007 to 2011 may not be accredited to a decline in lead poisoning among Florida children less than 72 months old. The population screened each year is not homogenous and cannot be exactly compared. In 1997, the CDC recommended that lead poisoning screening should be targeted at high-risk children. However, further investigation is needed to determine the rate of screening among high-risk groups in Florida. Analyses of the screening rates and other risk factors among high-risk zip code and refugee populations were com-pleted in 2011. The findings from these analyses will be released in separate documents.
FL H
ea
lth
y H
om
es &
Lea
d P
ois
on
ing
Pre
ve
ntio
n P
rog
ram
2
011
An
nu
al C
hild
ho
od
Surv
eill
ance
Rep
ort
Figure 1. Reported blood lead screenings and new cases of lead poisoning, Florida, 2007 to 2011
160,254
170,942
179,453177,144
171,206374
274
190
254
197
0
100
200
300
400
500
600
150,000
155,000
160,000
165,000
170,000
175,000
180,000
185,000
2007 2008 2009 2010 2011
Nu
mb
er
of
Ne
w C
ase
s
Nu
mb
er
Ch
ild
ren
Scre
en
ed
Year
Screenings New Cases

9
5-Year Statewide Trends: Reported New and Persistent Cases
LEAD POISONING CASE MANAGEMENT The FHHLPPP recommends that all children (less than 72 months of age) that are identified as lead poisoned receive case management. The child’s BLL determines the follow-up testing schedule and the type of case management needed. For instance, children with confirmed BLLs of 10-14μg/dL should receive follow-up testing within three months of the confirmatory test but an environmental health investigation of the home is optional. Children with BLLs 20-44μg/dL should be re-tested with-in a month of the confirmatory test and an environmental health investigation of the home should be conducted. The goal of case management is to reduce the child’s BLL to below the level of concern (10μg/dL) by preventing continued exposure and improving nutrition. The child should be monitored by the physician and the case manager until the BLLs returns to below 10μg/dL. Figure 2 shows the number of reported new and persistent cases per year over a 5-year period. The total number of reported lead poisoning cases decreased by 45 percent from 400 in 2007 to 221 in 2011. For 2010 to 2011, the number of all reported new cases decreased by 22 percent. This de-cline in new cases may be due to enhanced case management activities in identifying and recom-mending services for the elimination of lead hazards. Another possible reason for a decrease in new cases could be that some children were “lost to follow up” and did not receive a confirmatory blood lead tests. Tracking cases over time, through the Department’s statewide reportable disease surveil-lance system (Merlin), will allow disease investigators at county health departments to identify cases that did not receive follow-up tests. Coordinating care through the health care providers is essential for assuring re-testing of at-risk children.
FL H
ea
lth
y H
om
es &
Lea
d P
ois
on
ing
Pre
ve
ntio
n P
rog
ram
2
011
An
nu
al C
hild
ho
od
Surv
eill
ance
Rep
ort
Figure 2. Reported new and persistent cases of lead poisoning by year, Florida, 2007 to 2011
2007 2008 2009 2010 2011
New Cases 374 274 190 254 197
Persistent Cases 26 25 10 27 24
0%
10%
20%
30%
40%
50%
60%
70%
80%
90%
100%
Pe
rce
nta
ge
of C
ase
s

10
Sources of Lead Exposure F
L C
hild
ho
od L
ea
d P
ois
on
ing
Pre
ve
ntion
& H
ea
lth
y H
om
es P
rog
ram
2
011
An
nu
al C
hild
ho
od
Surv
eill
ance
Rep
ort
The FLHHLPP obtained disease investigation information from 168 of the 197 newly reported lead poisoning cases. In 2011, figure 3 reflects the top five self-reported sources of lead exposure. Please note that a variety of sources may contribute to a child becoming lead poisoned. Due to this fact, more than one source of exposure may be reported by a case. Of the top five reported sources of exposure, tile flooring or counter tops was found to be the highest reported source of exposure (45 of the 168 cases). Occupation of household member was found to be the least reported source of the top five (20 of the 168 cases). The information on potential lead sources is valuable in that it can help FLHHLPP effectively target primary prevention activities, that can reduce the burden of childhood lead poisoning in Florida.
Figure 3. Sources of Lead Exposure, Florida, 2011. Top Five Self-Reported Sources
Figure 3. Shows sources of lead exposures for newly identified cases in 2011. Please note that sources of lead exposure were not collected for 29 of the 197 newly identified cases. Therefore, these cases were excluded from this analysis. The Information reflected in this figure was obtained from Merlin (Florida Department of Health reportable disease surveillance system).
Tile Flooring or Counter
Tops
27%
Vinyl Mini-Blinds
25%
Toys or Jewelry
18%
Lead-based Paint Hazard in the Home
16%
Occupation of
Household
Member 12%
11
5-Year Statewide Trends: Rate of Reported New Cases per 1,000 Children Screened
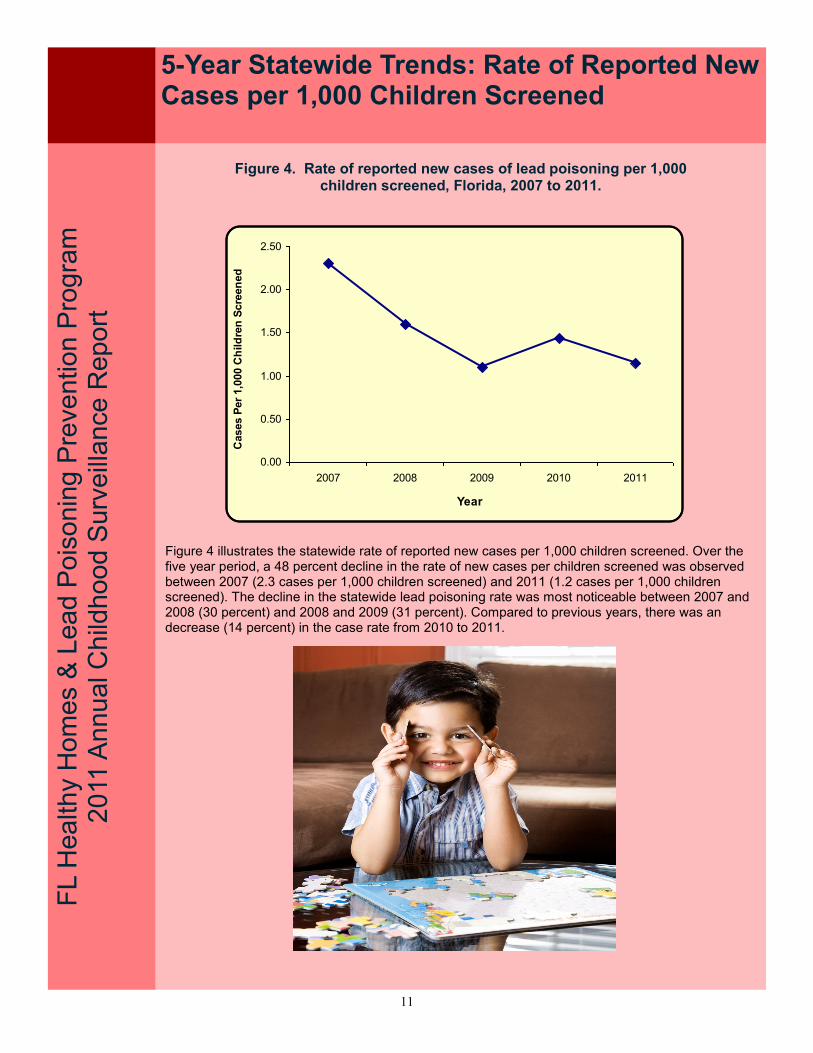
Figure 4 illustrates the statewide rate of reported new cases per 1,000 children screened. Over the five year period, a 48 percent decline in the rate of new cases per children screened was observed between 2007 (2.3 cases per 1,000 children screened) and 2011 (1.2 cases per 1,000 children screened). The decline in the statewide lead poisoning rate was most noticeable between 2007 and 2008 (30 percent) and 2008 and 2009 (31 percent). Compared to previous years, there was an decrease (14 percent) in the case rate from 2010 to 2011.
FL H
ea
lth
y H
om
es &
Lea
d P
ois
on
ing
Pre
ve
ntio
n P
rog
ram
2
011
An
nu
al C
hild
ho
od
Surv
eill
ance
Rep
ort
Figure 4. Rate of reported new cases of lead poisoning per 1,000 children screened, Florida, 2007 to 2011.
0.00
0.50
1.00
1.50
2.00
2.50
2007 2008 2009 2010 2011
Year
Cases P
er
1,0
00 C
hild
ren
Scre
en
ed

12
5-Year Statewide Trends: Rate of Reported New Cases per 1,000 Children Screened
FL C
hild
ho
od L
ea
d P
ois
on
ing
Pre
ve
ntion
& H
ea
lth
y H
om
es P
rog
ram
2
01
0 A
nn
ua
l S
urv
eill
ance
Re
po
rt
The effect of lead on the human body is dependent on the level and duration of lead exposure. Higher lead levels have a greater impact on the health and cognitive development of a child. Lead poisoning can result in lowered IQ, behavior problems, hearing loss, and neurological impairments. For this reason, one of the objectives of the FHHLPPP is to reduce the BLLs of children to levels where its effect is minimal. Figures 5 illustrates the number of reported new cases categorized by confirmed BLL from 2007 through 2011. Compared to 2007, there was a significant decline in the number of reported new cases for most BLL categories in 2011. For the BLL category 10-14 μg/dL this reduction was 44 per-cent. The downward trend in the number of reported new cases with BLLs 10-14 μg/dL begin in 2006 (not shown). The largest decline in the number of reported new cases with BLLs 10-14 μg/dL occurred between the following years: 2007 and 2008, 2008 and 2009. In 2011, the number of reported new cases for BLLs 10-14 μg/dL decreased by 22 percent in comparison to 2010. There has been little change in the number of cases identified at the 25 - > 44 μg/dL BLL category.
Figure 5. Reported new cases by confirmation blood lead level categories, Florida, 2007 to 2011.
FL L
ead
Po
iso
nin
g P
reventio
n &
He
althy H
om
es P
rog
ram
2
011
An
nu
al C
hild
ho
od
Surv
eill
ance
Rep
ort
5-Year Statewide Trends: Number of Reported New Cases by Blood Lead Level
2007 2008 2009 2010 2011
10-14 µg/dL 261 184 124 189 147
15-19 µg/dL 66 53 35 34 31
20-24 µg/dL 33 16 23 15 7
25-44 µg/dL 10 19 17 14 11
>44 µg/dL 4 2 1 2 1
0
50
100
150
200
250
300
Number of New Cases
13
Statewide: Number of Reported New Cases by Age and Blood Lead Level
FL H
ea
lth
y H
om
es &
Lea
d P
ois
on
ing
Pre
ve
ntio
n P
rog
ram
2
011
An
nu
al C
hild
ho
od
Surv
eill
ance
Rep
ort
Figure 6. Number of reported new cases by age and blood lead level Florida, 2011
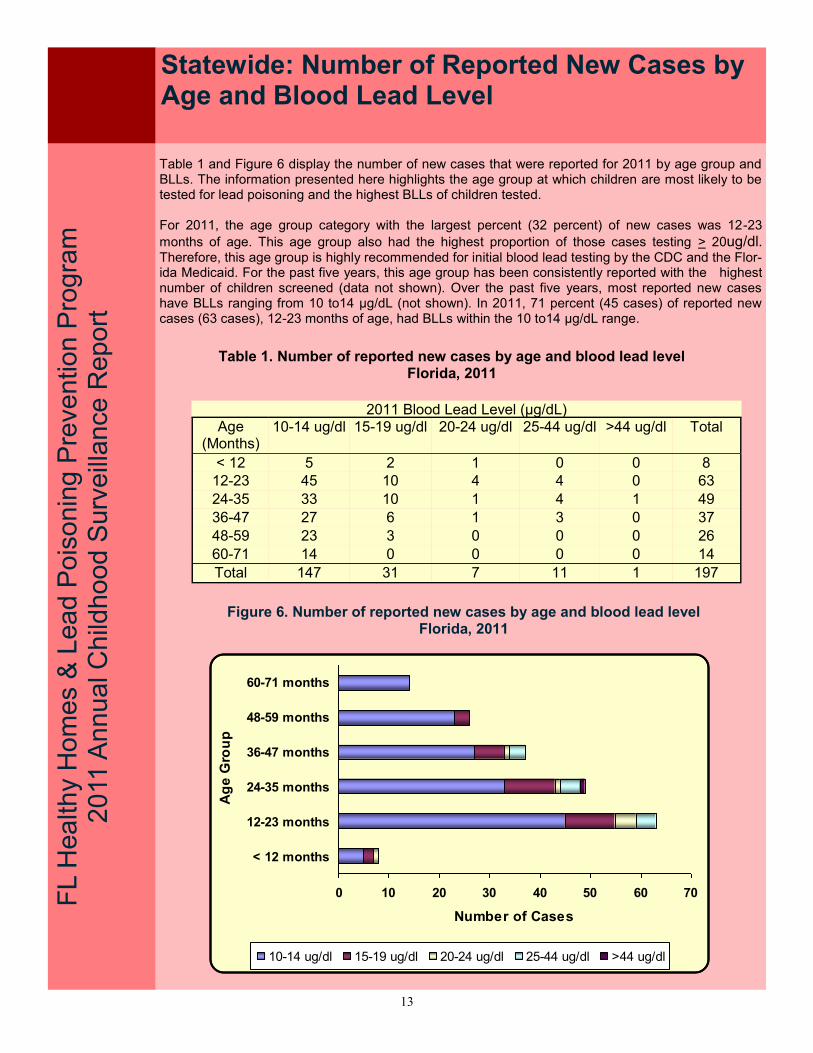
Table 1 and Figure 6 display the number of new cases that were reported for 2011 by age group and BLLs. The information presented here highlights the age group at which children are most likely to be tested for lead poisoning and the highest BLLs of children tested. For 2011, the age group category with the largest percent (32 percent) of new cases was 12-23
months of age. This age group also had the highest proportion of those cases testing > 20ug/dl. Therefore, this age group is highly recommended for initial blood lead testing by the CDC and the Flor-ida Medicaid. For the past five years, this age group has been consistently reported with the highest number of children screened (data not shown). Over the past five years, most reported new cases have BLLs ranging from 10 to14 μg/dL (not shown). In 2011, 71 percent (45 cases) of reported new cases (63 cases), 12-23 months of age, had BLLs within the 10 to14 μg/dL range.
Table 1. Number of reported new cases by age and blood lead level Florida, 2011
2011 Blood Lead Level (µg/dL) Age
(Months) 10-14 ug/dl 15-19 ug/dl 20-24 ug/dl 25-44 ug/dl >44 ug/dl Total
< 12 5 2 1 0 0 8
12-23 45 10 4 4 0 63
24-35 33 10 1 4 1 49
36-47 27 6 1 3 0 37
48-59 23 3 0 0 0 26
60-71 14 0 0 0 0 14
Total 147 31 7 11 1 197
0 10 20 30 40 50 60 70
< 12 months
12-23 months
24-35 months
36-47 months
48-59 months
60-71 months
Ag
e G
rou
p
Number of Cases
10-14 ug/dl 15-19 ug/dl 20-24 ug/dl 25-44 ug/dl >44 ug/dl
14
Statewide Trends: Number of Reported New Cases by Gender
FL H
ea
lth
y H
om
es &
Lea
d P
ois
on
ing
Pre
ve
ntio
n P
rog
ram
2
011
An
nu
al C
hild
ho
od
Surv
eill
ance
Rep
ort
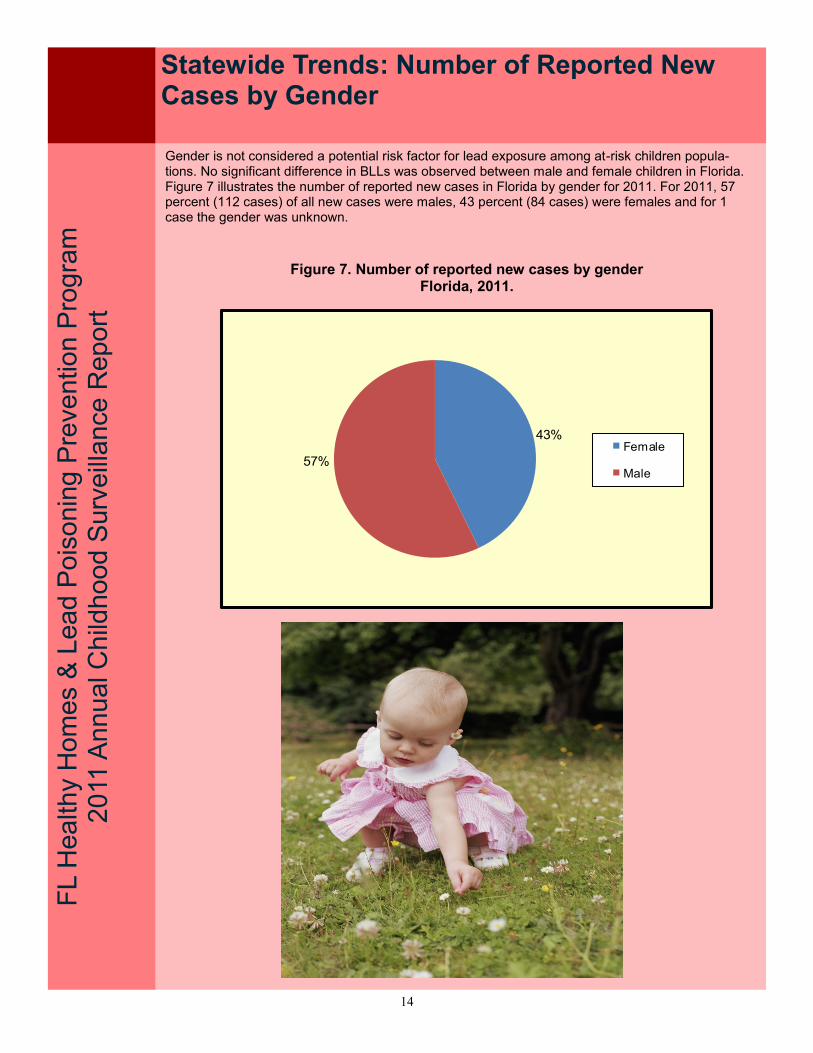
Gender is not considered a potential risk factor for lead exposure among at-risk children popula-tions. No significant difference in BLLs was observed between male and female children in Florida. Figure 7 illustrates the number of reported new cases in Florida by gender for 2011. For 2011, 57 percent (112 cases) of all new cases were males, 43 percent (84 cases) were females and for 1 case the gender was unknown.
Figure 7. Number of reported new cases by gender Florida, 2011.
43%
57%Female
Male

15
F
L H
ea
lth
y H
om
es &
Lea
d P
ois
on
ing
Pre
ve
ntio
n P
rog
ram
2
011
An
nu
al C
hild
ho
od
Surv
eill
ance
Rep
ort
Reported Screenings by County
Table 2. Number of reported screenings among children under 72 months of age by year and county of residence, Florida 2007 to 2011
Overall, the number of screenings for children less than 72 months increased from 2007. The highest yearly increase (7 percent) was ob-served between 2007 and 2008. With the highest number of screen-ings completed in 2009. However, small decreases in report-ed screenings were observed be-tween 2009 and 2010 (1 percent) and 2010 and 2011 (3 percent). There are no clear explanations for these slight decreases in screening rates.
County 2007 2008 2009 2010 2011 Alachua 2,297 2,175 1,705 2,569 2,507 Baker 199 130 126 176 124 Bay 728 700 1,033 983 728 Bradford 248 360 440 338 268 Brevard 1,569 2,049 2,460 2,183 1,716 Broward 23,394 23,481 25,479 24,293 24,445 Calhoun 42 49 67 70 42 Charlotte 552 696 645 694 490 Citrus 258 399 484 552 694 Clay 1,017 953 762 781 764 Collier 1,975 1,609 1,797 1,470 1,268 Columbia 487 592 532 470 456 Miami-Dade 37,599 40,918 41,518 41,354 39,226 Desoto 210 277 384 291 287 Dixie 270 258 208 185 161 Duval 7,496 6,940 5,745 6,210 7,192 Escambia 1,676 1,962 2,152 2,239 1,452 Flagler 584 526 421 354 388 Franklin 166 132 135 184 127 Gadsden 292 270 232 315 615 Gilchrist 190 206 188 191 140 Glades 38 53 30 32 42 Gulf 119 151 237 155 126 Hamilton 107 99 83 85 58 Hardee 286 674 798 740 643 Hendry 638 846 742 713 614 Hernando 539 768 883 738 826 Highlands 998 1,226 1,452 1,550 1,633 Hillsborough 11,586 11,989 13,797 13,871 14,507 Holmes 262 252 198 174 124 Indian River 1,403 1,552 1,745 1,412 1,403 Jackson 254 29 235 58 78 Jefferson 66 71 72 69 78 Lafayette 13 17 31 19 51 Lake 2,056 2,160 2,041 2,116 1,978 Lee 3,122 4,012 5,440 5,140 5,018 Leon 1,570 1,303 1,068 798 936 Levy 353 444 397 410 380 Liberty 20 27 45 27 12 Madison 36 58 95 124 164 Manatee 2,882 2,830 2,605 2,630 2,995 Marion 1,410 1,845 1,905 1,856 1,782 Martin 1,420 1,294 1,306 1,376 1,317 Monroe 161 141 92 242 164 Nassau 116 141 164 200 146 Okaloosa 664 732 910 847 823 Okeechobee 481 509 416 452 580 Orange 7,688 8,813 9,697 8,987 8,318 Osceola 2,482 2,452 2,135 1,877 1,850 Palm Beach 13,633 14,738 17,006 16,802 15,950 Pasco 2,848 3,493 3,163 3,010 2,739 Pinellas 3,789 4,658 4,752 5,194 3,694 Polk 7,065 7,389 7,015 7,207 6,924 Putnam 509 679 454 986 860 Saint Johns 624 325 360 490 545 Saint Lucie 2,786 3,375 3,653 3,204 3,493 Santa Rosa 603 330 748 635 426 Sarasota 1,584 1,966 2,104 2,008 1,897 Seminole 998 842 945 846 830 Sumter 643 440 400 409 437 Suwannee 224 226 203 254 242 Taylor 105 227 365 352 465 Union 111 95 114 83 85 Volusia 1,396 1,874 1,653 1,841 2,259 Wakulla 105 111 66 112 89 Walton 186 216 241 357 237 Washington 113 165 129 97 63 Unknown 913 623 950 657 235 Total 160,254 170,942 179,453 177,144 171,206

16
F
L C
hild
ho
od L
ea
d P
ois
on
ing
Pre
ve
ntion
& H
ea
lth
y H
om
es P
rog
ram
2
01
0 A
nn
ua
l S
urv
eill
ance
Re
po
rt
Reported Screenings by County
Lead Poisoning Screening Rate by County
FL H
ea
lth
y H
om
es &
Lea
d P
ois
on
ing
Pre
ve
ntio
n P
rog
ram
2
011
An
nu
al C
hild
ho
od
Surv
eill
ance
Rep
ort
Figure 8: Screening rate per 1,000 children screened by county, Florida 2011
Figure 8 shows the 2011 screening rate by county for children less than six years old. The screening rate for each county was determined by dividing the number of children less than 72 months of age who received a blood lead test with the total number of children less than 72 months of age expressed per 1000 population of children (< 72 months old). The population estimates were obtained from the Florida Legislature's Office of Economic Demographic Research data. There are limitations when using population estimates to calculate the screening rates by county. The estimated population includes the at-risk groups for lead poisoning in addition to the general popula-tion and therefore does not accurately characterize lead screening rates in the targeted population. The FHHLPPP has assessed screening rates among high-risk populations such as Refugees and Medicaid-eligible children among all children screened for blood lead (data not shown) in order to tar-get educational outreach and prevention activities to the most vulnerable individuals.
17
FL H
ea
lth
y H
om
es &
Lea
d P
ois
on
ing
Pre
ve
ntio
n P
rog
ram
2
011
An
nu
al C
hild
ho
od
Surv
eill
ance
Rep
ort
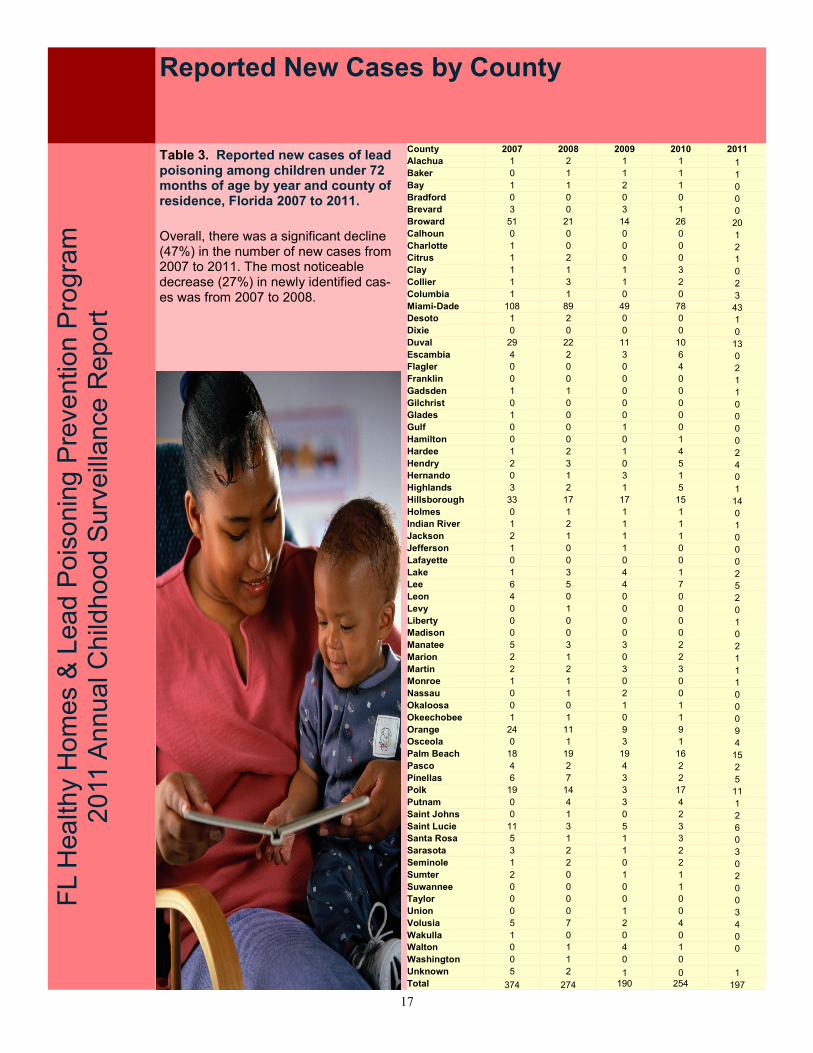
Table 3. Reported new cases of lead poisoning among children under 72 months of age by year and county of residence, Florida 2007 to 2011.
Reported New Cases by County
Overall, there was a significant decline (47%) in the number of new cases from 2007 to 2011. The most noticeable decrease (27%) in newly identified cas-es was from 2007 to 2008.
County 2007 2008 2009 2010 2011
Alachua 1 2 1 1 1 Baker 0 1 1 1 1 Bay 1 1 2 1 0 Bradford 0 0 0 0 0 Brevard 3 0 3 1 0 Broward 51 21 14 26 20 Calhoun 0 0 0 0 1 Charlotte 1 0 0 0 2 Citrus 1 2 0 0 1 Clay 1 1 1 3 0 Collier 1 3 1 2 2 Columbia 1 1 0 0 3 Miami-Dade 108 89 49 78 43 Desoto 1 2 0 0 1 Dixie 0 0 0 0 0 Duval 29 22 11 10 13 Escambia 4 2 3 6 0 Flagler 0 0 0 4 2 Franklin 0 0 0 0 1 Gadsden 1 1 0 0 1 Gilchrist 0 0 0 0 0 Glades 1 0 0 0 0 Gulf 0 0 1 0 0 Hamilton 0 0 0 1 0 Hardee 1 2 1 4 2 Hendry 2 3 0 5 4 Hernando 0 1 3 1 0 Highlands 3 2 1 5 1 Hillsborough 33 17 17 15 14 Holmes 0 1 1 1 0 Indian River 1 2 1 1 1 Jackson 2 1 1 1 0 Jefferson 1 0 1 0 0 Lafayette 0 0 0 0 0 Lake 1 3 4 1 2 Lee 6 5 4 7 5 Leon 4 0 0 0 2 Levy 0 1 0 0 0 Liberty 0 0 0 0 1 Madison 0 0 0 0 0 Manatee 5 3 3 2 2 Marion 2 1 0 2 1 Martin 2 2 3 3 1 Monroe 1 1 0 0 1 Nassau 0 1 2 0 0 Okaloosa 0 0 1 1 0 Okeechobee 1 1 0 1 0 Orange 24 11 9 9 9 Osceola 0 1 3 1 4 Palm Beach 18 19 19 16 15 Pasco 4 2 4 2 2 Pinellas 6 7 3 2 5 Polk 19 14 3 17 11 Putnam 0 4 3 4 1 Saint Johns 0 1 0 2 2 Saint Lucie 11 3 5 3 6 Santa Rosa 5 1 1 3 0 Sarasota 3 2 1 2 3 Seminole 1 2 0 2 0 Sumter 2 0 1 1 2 Suwannee 0 0 0 1 0 Taylor 0 0 0 0 0 Union 0 0 1 0 3 Volusia 5 7 2 4 4 Wakulla 1 0 0 0 0 Walton 0 1 4 1 0 Washington 0 1 0 0 Unknown 5 2 1 0 1 Total 374 274 190 254 197
18
FL C
hild
ho
od L
ea
d P
ois
on
ing
Pre
ve
ntion
& H
ea
lth
y H
om
es P
rog
ram
2
01
0 A
nn
ua
l S
urv
eill
ance
Re
po
rt
Reported New Cases by County
Case Rate per 1,000 Children Screened by County
FL H
ea
lth
y H
om
es &
Lea
d P
ois
on
ing
Pre
ve
ntio
n P
rog
ram
2
011
An
nu
al C
hild
ho
od
Surv
eill
ance
Rep
ort
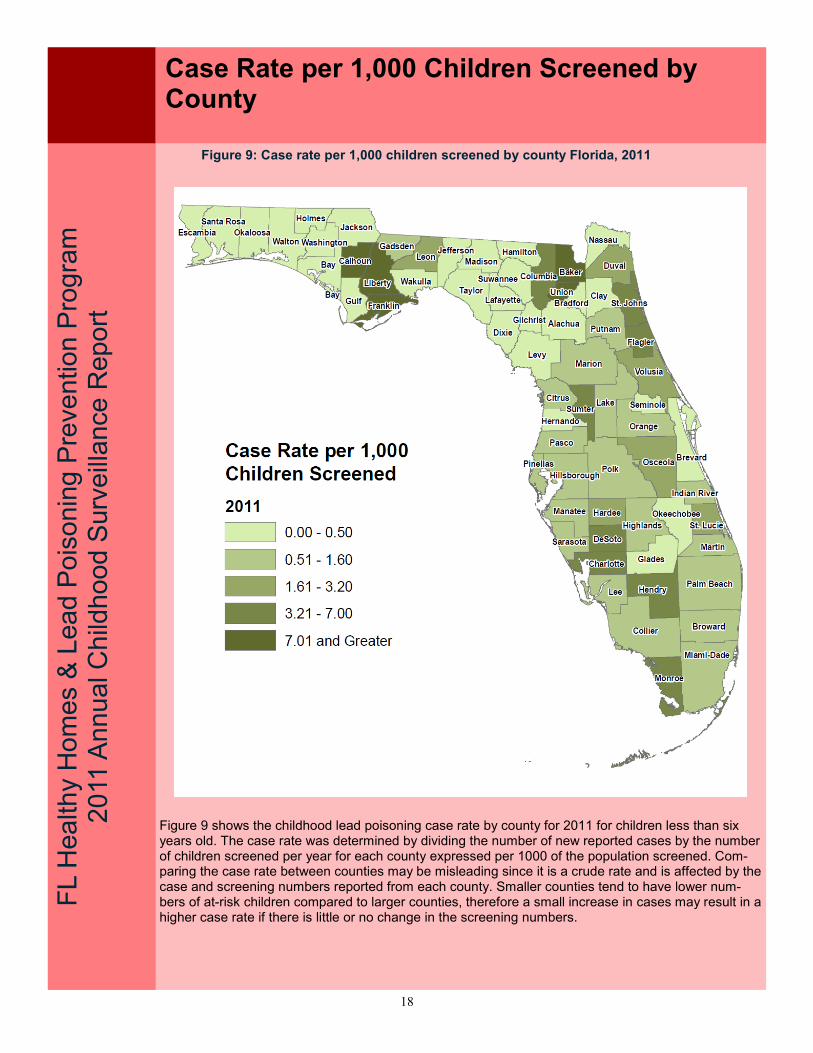
Figure 9 shows the childhood lead poisoning case rate by county for 2011 for children less than six years old. The case rate was determined by dividing the number of new reported cases by the number of children screened per year for each county expressed per 1000 of the population screened. Com-paring the case rate between counties may be misleading since it is a crude rate and is affected by the case and screening numbers reported from each county. Smaller counties tend to have lower num-bers of at-risk children compared to larger counties, therefore a small increase in cases may result in a higher case rate if there is little or no change in the screening numbers.
Figure 9: Case rate per 1,000 children screened by county Florida, 2011
19
FL H
ea
lth
y H
om
es&
Le
ad
Po
iso
nin
g P
reve
ntio
n P
rog
ram
2
011
An
nu
al C
hild
ho
od
Surv
eill
ance
Rep
ort
Reported New and Persistent Cases by County
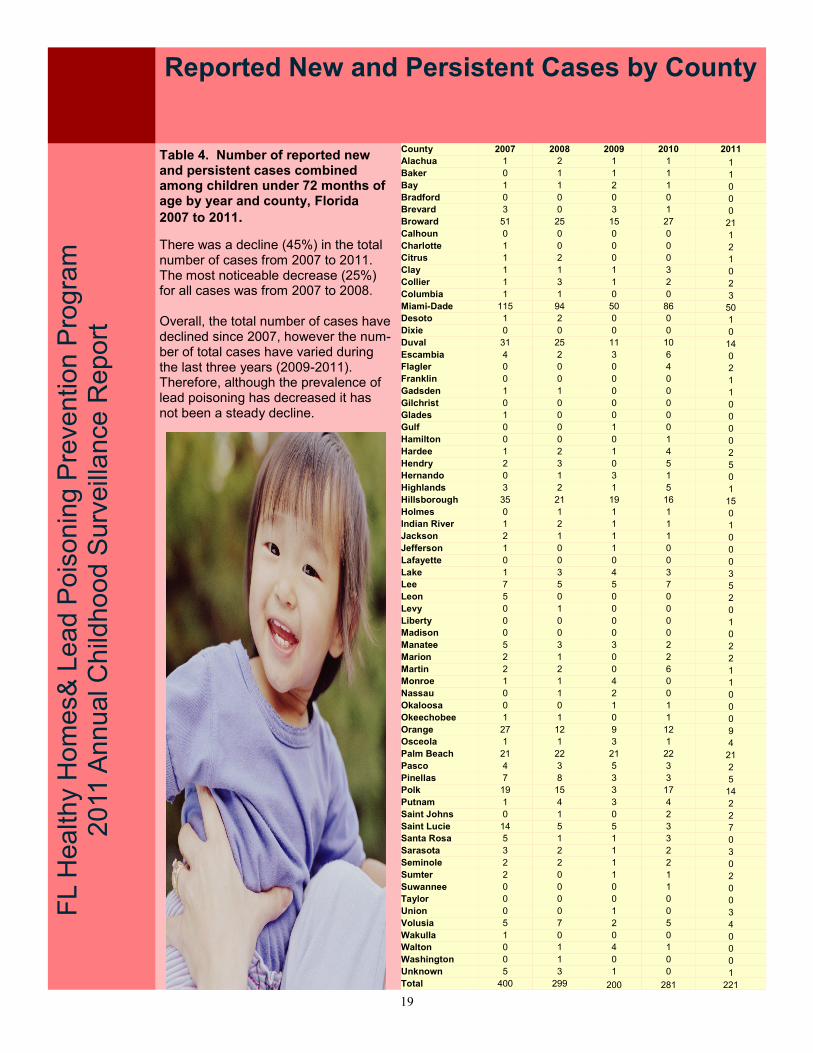
Table 4. Number of reported new and persistent cases combined among children under 72 months of age by year and county, Florida
2007 to 2011.
There was a decline (45%) in the total number of cases from 2007 to 2011. The most noticeable decrease (25%) for all cases was from 2007 to 2008. Overall, the total number of cases have declined since 2007, however the num-ber of total cases have varied during the last three years (2009-2011). Therefore, although the prevalence of lead poisoning has decreased it has not been a steady decline.
County 2007 2008 2009 2010 2011
Alachua 1 2 1 1 1 Baker 0 1 1 1 1 Bay 1 1 2 1 0 Bradford 0 0 0 0 0 Brevard 3 0 3 1 0 Broward 51 25 15 27 21 Calhoun 0 0 0 0 1 Charlotte 1 0 0 0 2 Citrus 1 2 0 0 1 Clay 1 1 1 3 0 Collier 1 3 1 2 2 Columbia 1 1 0 0 3 Miami-Dade 115 94 50 86 50 Desoto 1 2 0 0 1 Dixie 0 0 0 0 0 Duval 31 25 11 10 14 Escambia 4 2 3 6 0 Flagler 0 0 0 4 2 Franklin 0 0 0 0 1 Gadsden 1 1 0 0 1 Gilchrist 0 0 0 0 0 Glades 1 0 0 0 0 Gulf 0 0 1 0 0 Hamilton 0 0 0 1 0 Hardee 1 2 1 4 2 Hendry 2 3 0 5 5 Hernando 0 1 3 1 0 Highlands 3 2 1 5 1 Hillsborough 35 21 19 16 15 Holmes 0 1 1 1 0 Indian River 1 2 1 1 1 Jackson 2 1 1 1 0 Jefferson 1 0 1 0 0 Lafayette 0 0 0 0 0 Lake 1 3 4 3 3 Lee 7 5 5 7 5 Leon 5 0 0 0 2 Levy 0 1 0 0 0 Liberty 0 0 0 0 1 Madison 0 0 0 0 0 Manatee 5 3 3 2 2 Marion 2 1 0 2 2 Martin 2 2 0 6 1 Monroe 1 1 4 0 1 Nassau 0 1 2 0 0 Okaloosa 0 0 1 1 0 Okeechobee 1 1 0 1 0 Orange 27 12 9 12 9 Osceola 1 1 3 1 4 Palm Beach 21 22 21 22 21 Pasco 4 3 5 3 2 Pinellas 7 8 3 3 5 Polk 19 15 3 17 14 Putnam 1 4 3 4 2 Saint Johns 0 1 0 2 2 Saint Lucie 14 5 5 3 7 Santa Rosa 5 1 1 3 0 Sarasota 3 2 1 2 3 Seminole 2 2 1 2 0 Sumter 2 0 1 1 2 Suwannee 0 0 0 1 0 Taylor 0 0 0 0 0 Union 0 0 1 0 3 Volusia 5 7 2 5 4 Wakulla 1 0 0 0 0 Walton 0 1 4 1 0 Washington 0 1 0 0 0 Unknown 5 3 1 0 1 Total 400 299 200 281 221

20
REFERENCES Canfield RL, Henderson CR, Cory-Slechta DA, Cox C, Jusko TA, Lanphear BP. Intellectual impair-ment in children with blood lead concentration below 10 μg per deciliter. New England Journal of Medicine 2003; 348:1517-1526. Florida Department of Health Childhood Lead Poisoning Screening & Case Management Guide. Adopted January 2008. http://www.doh.state.fl.us/environment/medicine/lead/education.htm Florida Medicaid Child Health Check-Up Coverage and Limitations Handbook. http://mymedicaid-florida.com/ RESOURCES American Academy of Pediatrics. http://www.aap.org/ Centers for Disease Control and Prevention. Managing Elevated Blood Lead Levels Among Young Children: Recommendations from the Advisory Committee on Childhood Lead Poisoning Prevention. Atlanta: CDC, March 2002. http://www.cdc.gov/nceh/lead/CaseManagement/caseManage_main.htm Centers for Disease Control and Prevention. Screening Young Children for Lead Poisoning: Guidance for State and Local Public Health Officials. Atlanta: CDC, 1997. http://www.cdc.gov/nceh/lead/guide/guide97.htm Centers for Disease Control and Prevention. Interpreting and Managing Blood Lead Levels <10 μg/dL in Children and Reducing Childhood Exposures to Lead: Recommendations of CDC’s Advisory Committee on Childhood Lead Poisoning Prevention. MMWR 2007;56:(No. RR-8) Consumer Product Safety Commission website at http://www.cpsc.gov/. Florida Childhood Lead Poisoning Prevention Program http://www.doh.state.fl.us/environment/medicine/lead/index.html Florida Chapter of the American Academy of Pediatrics http://www.medicalhomeinfo.org/states/state/florida.html The United States Centers for Disease Control and Prevention. http://www.cdc.gov/lead/
FL H
ea
lth
y H
om
es &
Lea
d P
ois
on
ing
Pre
ve
ntio
n P
rog
ram
2
011
An
nu
al C
hild
ho
od
Surv
eill
ance
Rep
ort
References & Resources
21
ACKNOWLEDGEMENTS The FHHLPPP extends a special thanks to the dedicated laboratory personnel, health care provid-ers, and public health professionals who conduct lead screenings and provide care to children ex-posed to lead. GLOSSARY Children: For the purposes of this report, children are defined as those less than 72 months of age. CHD: County Health Department. Reported: For the purposes of this report, reported refers to all blood lead test results received by the FHHLPPP. LeadCare II Analyzer: A portable device that is waived under the Clinical Laboratory Improvement Amendment (CLIA) to perform blood lead testing based on a capillary blood draw. µg/dL: Micrograms per deciliter, the standard unit of measure for blood lead levels. Test: Any blood lead sample type (i.e. capillary, venous, or unknown) that produces a quantifiable result and is analyzed by a Clinical Laboratory Improvement Amendments (CLIA) certified facility or an approved portable device. Blood for a lead test can be collected for a screening, confirmation, or follow up. Screening: The initial blood lead test occurring within one year. Any subsequent blood lead draws are defined as follow-up tests. Follow-up Test: Any blood lead test that occurs subsequent to a confirmation test and any test that occurs subsequent to a screening in a calendar year. Confirmed Case: A case with a blood lead concentration greater than or equal to 10µg/dL that was drawn from a single venous specimen or from two capillary specimens drawn within 12 weeks (84 days) of each other. New Case: A confirmed case (see “confirmed case” above) that has never been previously identi-fied as a confirmed case. Persistent Case: A case confirmed during a previous year and whose blood lead level remains at 10 µg/dL or greater in a subsequent year. Case Rate: The number of children less than 72 months old with a confirmed BLL ≥ 10μg/dL divided by the number of children less than 72 months old screened for lead poisoning in a particular year. Screening Rate: The number of children less than 72 months old without a previous confirmed BLL who were screened for blood lead level in a particular year divided by the number of children less than 72 months old in Florida for that year (based on Florida Legislature’s Office of Economic Demo-graphic Research). FL H
ea
lth
y H
om
es &
Lea
d P
ois
on
ing
Pre
ve
ntio
n P
rog
ram
2
011
An
nu
al C
hild
ho
od
Surv
eill
ance
Rep
ort
Glossary and Acknowledgements
22
2011 Childhood Lead Poisoning Prevention & Healthy Homes Program Contacts
Program Headquarters, Tallahassee FL Rosanna Barrett, DrPH, MPH* FHHLPPP Manager Phone: (850) 245-4444 Ext. 2828 E-mail: [email protected] Juanita Jones, MPH FHHLPPP Epidemiologist Phone: (850) 245-4444 Ext. 2694 E-mail: [email protected] Xiaohong Li, MPH FHHLPPP Data Analyst/Epidemiologist Phone: (850) 245-4444 Ext. 2222 E-mail: [email protected] Jackie Lurry, AA* FL Adult Blood Lead Epidemiology Surveillance Program Coordinator Phone: (850) 245-4444 Ext. 2196 E-mail: [email protected] Brian Fox, MA FHHLPPP Policy Analyst/Lead Safety Project Manager Phone: (850) 245-4444 Ext. 2819 E-mail: [email protected] Cheryl Urbas, MS* FHHLPPP Healthy Homes Program Coordinator Phone: (850) 245-4444 Ext. 2959 E-mail: [email protected]
* No longer with the Program
FL H
ea
lth
y H
om
es &
Lea
d P
ois
on
ing
Pre
ve
ntio
n P
rog
ram
2
011
An
nu
al C
hild
ho
od
Surv
eill
ance
Rep
ort
23
This information was supported by the FL Lead Poisoning Prevention Program Cooperative Agreement #H64 000133-02 with the Centers for Disease Control and Prevention.


