
Finding Your Best Customer:A Guide to Best Current B2B Customer Segmentation

Table of ContentsChapter 1: What is Customer Segmentation and Why is It Important ............................................. 2
Why Establishing Segmentation Hypotheses and Variables is Important ........................................ 4
Exploring Typical Customer Segmentation Schemes for B2B Software Companies .......................... 5
The Business Benefits of Current Customer Segmentation ........................................................... 6
Chapter 2: The Best Current Customer Segmentation Process ...................................................... 8
Step 1: Setting up the Project ................................................................................................... 9
Creating a Work Plan .................................................................................................. 10
Getting Buy-in from the Executive Team ....................................................................... 11
Additional Best Current Customer Segmentation Prerequisites ....................................... 11
Step 2: Analyzing Customer Data ............................................................................................ 15
Identifying Segmentation Hypotheses: What Characteristics Make a Company a Good Customer? ...................................................................................................... 15
Identifying the Data Fields and Internal or External Sources Required to Test and Prioritize the Hypotheses ........................................................................... 17
Step 3: Data Collection .......................................................................................................... 19
Managing the Data Collection Process .......................................................................... 19
Step 4: Analysis & Prioritization .............................................................................................. 20
Executing Data Analysis to Identify Relevant Variables and Validate Your Hypotheses ....... 21
Evaluating Composite Segmentation ........................................................................... 24
Synthesizing Validated Segmentation Hypotheses to Form Distinct, Homogeneous Segments of High-value Customers ........................................................ 26
Evaluating Segment Value, Targetability, and Size to Prioritize Your Best Segment(s) ........ 27
Step 5: Presenting and Incorporating Feedback ........................................................................ 28
Building Your Final Presentation .................................................................................. 28
Gathering Feedback ................................................................................................... 31
Translating Information into Action .............................................................................. 31
End Note .............................................................................................................................. 32
Appendix .............................................................................................................................. 33
Typical Segmentation Variables and Sources ............................................................................. 33
Additional Resources ............................................................................................................. 35

Finding Your Best Customer: A Guide to Best Current B2B Customer Segmentation | 1
Foreword Foreward
Startup B2B technology companies face a variety of signifi-cant challenges. They have to gain traction and establish a reasonable market presence among a sea of more established players. They have to do more with less, as founders and early employees are often expected to be jacks-of-all-trades, managing everything from sales and marketing initiatives, to product development and customer onboarding. Furthermore, they have to do all of that under an allegorical cloud of uncer-tainty. Will their business ever really establish roots and begin to grow? Or is all of this work being done in vain?
As those companies transition into the expansion stage, those challenges and questions unfortunately do not dissipate. They simply become more acute. One challenge in particular — replicating prior success in a scalable and predictable man-ner — can be especially troublesome. The reason is simple: Startup and expansion-stage companies tend to generate a disproportionate amount of their sales and/or profits from a relatively small number of customers. That creates a scalabil-ity problem that can be difficult to overcome. Thankfully, it is not impossible.
As OpenView’s newest eBook, “Finding Your Best Customer: A Guide to Best Current B2B Customer Segmentation,” shows, scaling efficiently and effectively at the expansion stage has a lot to do with identifying your best current cus-tomer segments and selling to them more often and more efficiently. To do that, however, your company needs to focus its efforts not on a broad universe of potential customers (a mentality that is particularly common among early stage
businesses), but rather on a specific subset of customers who are most similar to your best current customers. That can be done through customer segmentation.
The following pages will outline a research process that expan-sion-stage technology companies can use to find their best current customer segment, identifying and verifying hypoth-eses about the characteristics of your company’s best cus-tomers using a variety of data. Those verified hypotheses can then be synthesized into specific customer segments based on those characteristics, and the best customer segments are then identified and detailed.
After reading this eBook, your business should be better prepared to take on the myriad challenges that it will con-tinue to face as it scales. Of course, that does not mean that building a great big business will all of a sudden be an easy task. It does mean that you can move forward with increased confidence that your entire operation will be more focused on the customers and prospects that are most valuable to your business. Ultimately, that will make the sometimes-uncertain process of growing a business a bit more of an exact science.
Chris Herbert Founder/CMO, Mi6

Finding Your Best Customer: A Guide to Best Current B2B Customer Segmentation | 2
chapter one What is Customer Segmentation and Why is It Important?
Customer segmentation — also known as market segmentation — is the division of potential customers in a given market into
discrete groups. That division is based on customers having similar enough:
1. Needs, so that a single whole product can satisfy them.
2. Buying characteristics, responses to messaging, marketing channels, and sales channels, so that a single go-to-market approach can be used to sell to them competitively and economically.
This distinction is important because needs-based segmentation research, by definition, requires considerable primary research
and data collection to fully discover and correlate customer needs with their characteristics. Such research is particularly dif-
ficult for B2B software or technology-enabled services, since the buyers are typically complex, multi-tiered organizations that
cannot easily be modeled or predicted like consumers. As a result, the information needed to analyze potential markets requires
significant resources that many growth-stage B2B companies do not have.
It is important to note that the customer segmentation process outlined in this eBook is exclusively focused on a company’s
current customer base. It is a predictive segmentation analysis that is focused on helping identify homogenous groups of pros-
pects that are most likely to become great customers. It is not a process that will help a company identify and prioritize previ-
ously unknown market segments, nor is it a descriptive segmentation of the market that helps a company fully divide its market
into distinct needs-based, homogenous segments.
Chapter 1: What is Customer Segmentation and Why is It Important

Finding Your Best Customer: A Guide to Best Current B2B Customer Segmentation | 3
A priori segmentation, the simplest approach, uses a classification
scheme based on publicly available characteristics — such as indus-
try and company size — to create distinct groups of customers within
a market. However, a priori market segmentation may not always be
valid, since companies in the same industry and of the same size may
have very different needs.
Needs-based segmentation is based on differentiated, validated drivers
(needs) that customers express for a specific product or service being offered. The needs are discovered and verified through primary market research, and segments are demarcated based on those different needs rather than characteristics such as industry or company size.
Value-based segmentation differentiates customers by their economic value, grouping customers with the same value level into individual segments that can be distinctly targeted.
123
“Finding Your Best Customer: A Guide to Best Current B2B Customer Segmentation” is intended
for CEOs and senior marketing executives at expansion-stage companies. It focuses on the
value-based approach to segmentation, which allows companies to clearly define and target
their best prospects and satisfy most of their segmentation needs without consuming the
time and resources that a traditional, descriptive segmentation research process would.
There are three main approaches to market segmentation:
A priori NEEDS-basedVALUE-
based

Finding Your Best Customer: A Guide to Best Current B2B Customer Segmentation | 4
Why Establishing Segmentation Hypotheses and Variables is Important
While most companies possess enough market knowledge to predict or anticipate which customer segments are their most
profitable, the leaders of those businesses also know that scaling a business is best not left to guesswork or instinct. That’s why,
in a customer segmentation process like the one described in this eBook, it is critical to develop customer segment hypotheses
and variables, and validate them with a well-developed, scientific research process.
That is particularly true in needs-based and value-based segmentation schemes, where it is impossible to utilize a customer
segmentation process without first establishing clear hypotheses that will serve as the foundation of your research. Ultimately,
hypotheses should be formed around customer characteristics or factors that allow you to clearly separate your current custom-
ers into distinct needs-based or value-based segments. While your hypotheses do not need to be complicated mathematical or
statistical statements, they should be clear and logical enough to be testable and useful.
A typical hypothesis might look like this:
› Customers with revenues of $1 million tend to be in segment A
› Customers with revenues of less than $1 million will be in a different segment from customers with more than $1 million in revenues
› Customers with more than $1 million in revenues tend to be of higher value (or are part of a higher-value segment)
Using that example, the segmentation variables can be defined as the objective measures, factors, or characteristics that help
you differentiate segments, whether they are needs- or value-based. In the above scenario, those variables focus on financial
information, but they could just as well pertain to the customer’s reputation, online presence, or business model, depending on
what is most relevant to the segment.
Developing variables and hypotheses is important for a variety of reasons, but its primary purpose is to provide a framework for
the customer segmentation research process. Once you have established a clear hypothesis and the variables that you need to
test, you can begin executing the intricate process that will help you identify your best current customer segments.
EXAMPLE

Finding Your Best Customer: A Guide to Best Current B2B Customer Segmentation | 5
Exploring Typical Customer Segmentation Schemes for B2B Software Companies
As with most business initiatives, the goals and outputs of customer segmentation research will likely depend on your com-
pany’s stage, market conditions, and myriad other variables. However, there are some relatively standard schemes that coincide
— or at least overlap — with most needs-based or value-based segmentation initiatives.
Here are six standard segmentation schemes that could be applied to your customer segmentation research:
› Segmentation by geographic base / reach
› Segmentation by industry / sub-industry / industry served / customer served
› Segmentation by product class / product usage
› Segmentation by organization size (measured by revenue, number of employees, etc.)
› Segmentation by product delivery model / product format / packaging format / special technology / process methodology
› Segmentation by special use / needs
It is important to note that even if a market is divided into one of the schemes above, it is not a valid segmentation of the
market unless it results in meaningful differences in customers’ values and needs, the company’s value proposition, or the
go-to-market strategy associated with each scheme. In such cases, it is merely a convenient organization of the market that
has no strategic or operational value.
“ By adopting a customer segmentation strategy, businesses will see a great increase in the
value of their marketing. Knowing your customer is the starting point for any successful
demand strategy and marketers who do not take the time to develop a segmentation strat-
egy put their success at great risk. In these days of modern marketing, marketers cannot
afford to blast their messages — they must be targeted and relevant to their
customers. With that being the case, customer segmentation is a must.”
Carlos Hidalgo CEO, The Annuitas Group

Finding Your Best Customer: A Guide to Best Current B2B Customer Segmentation | 6
The Business Benefits of Current Customer Segmentation
At the expansion stage, executing a marketing strategy without any knowledge of how your target market is segmented is akin
to firing shots at a target 100 feet away — while blindfolded. The likelihood of hitting the target is a matter of luck more than
anything else.
Without a deep understanding of how a company’s best current customers are segmented, a business often lacks the market
focus needed to efficiently allocate and spend its precious human and capital resources. Furthermore, a lack of best current
customer segment focus can cause diffused go-to-market and product development strategies that hamper a company’s ability
to fully engage with its target segments. Together, all of those factors can ultimately impede growth.
If best current customer segmentation is done right, however, the business benefits are numerous. For example, a best current
customer segmentation exercise can tangibly impact your operating results by:
Improving your whole product
Having a clear idea of who
wants to buy your product
and what they need it for
will help you differentiate
your company as the best
solution for their particular
needs. The result will be
increased customer satisfac-
tion and better performance
against competitors.
Focusing your marketing message
In parallel with improve-
ments to the product,
conducting a customer seg-
mentation project can help
you develop more focused
marketing messages that are
customized to each of your
best segments, resulting in
higher quality inbound inter-
est in your product.
By spending less time on
less lucrative opportuni-
ties and more on your most
successful segments, your
sales team will be able to
increase its win rate, cover
more ground, and ultimately
increase revenues.
Getting higher quality revenues
Not all revenue dollars are
created equal. Sales into
the wrong segment can be
more expensive to execute
and maintain, and may have
a higher churn rate or lower
upsell potential. Avoiding
these types of customers
and focusing on better ones
will increase your margins
and promote the stability of
your customer base.
Allowing your sales organization to pursue higher percentage opportunities

Finding Your Best Customer: A Guide to Best Current B2B Customer Segmentation | 7
Conducting best current customer segmentation research can have numerous other ancillary benefits, of course, but this eBook
will focus mostly on how it can impact the four cited above. The bottom line is that if you are able to sell more of your product
to your most profitable customers, then you will be able to scale the business more efficiently and ensure that everything you do
— from lead generation to new product development — revolves around the right things.
Creating Change Your Company Can Believe In
This first step toward creating meaningful change in an organization is acknowledging that change is needed. For a technology
company moving from the startup stage to the expansion stage, that often means abandoning a non-discriminatory, “take every
customer we can get” approach, and replacing it with a far more targeted, best current customer segment strategy.
Executing a customer segmentation research process is the first step toward helping a growing company make that transition.
Ultimately, best current customer segmentation can help your business better define its ideal customers, identify the segments
that those customers belong to, and improve overall organizational focus.
The rest of this eBook outlines a step-by-step process that will provide everything you need to set up your project, perform cus-
tomer data analysis, execute data collection, conduct customer segment analysis and prioritization, and implement the results
into your organizational strategy.
“If your company is at the expansion stage and you want to scale effectively, you need to
focus on selling to your best current customer segments as frequently and efficiently as
possible. To do so, instead of aiming at a broad universe of potential customers, focus on
a subset of customers who are most similar to your best customer segments. That’s where
customer segmentation — and the research process outlined in this eBook
— comes in.”
Tien Anh Nguyen Senior Associate, OpenView Labs

Finding Your Best Customer: A Guide to Best Current B2B Customer Segmentation | 8
Chapter TWO The Best Current Customer Segmentation Process
To be effective, a best current customer segmentation process must be driven by a
clearly defined set of objectives and outputs, and be backed by all of the company’s
relevant stakeholders. This chapter will help you accomplish those tasks.
The following pages explore a five-step process that will help you identify your best
current customer segments, organize them by value to your business, and prioritize
them in a way that will foster stronger organizational focus over both the short and
long term.
The systematic and scientific data collection and analysis processes laid out in this
chapter might seem complicated, but they are not impossible to manage. Like almost
any initiative, you simply need to ensure that key players and stakeholders remain
focused on their specific roles and responsibilities, and work collectively to achieve
a clearly defined set of goals and objectives.
Chapter 2: The Best Current Customer Segmentation Process

Finding Your Best Customer: A Guide to Best Current B2B Customer Segmentation | 9
Step 1: Setting up the ProjectAs with any project, preparation is essential. Without it, your initiative will lack focus and direction, which can ultimately take
you off course.
To determine your best current customer segment, begin by defining the project and planning for it appropriately. To do that,
you need to have a crisp understanding of its:
Objective: The ultimate business goals that completing the project will address or contribute to. Ideally, these goals will
overlap or align with your company’s strategic goals.
Stakeholders: The senior staff from the various departments and teams (e.g., product management, marketing, sales,
customer support, professional services, operations, etc.) whose goals will be directly affected by the outcome
of the project, and who will therefore be invested in the project’s success.
Scope: The project’s parameters, which can be built around its inputs (e.g., the percentage of customer accounts
to be analyzed or the number of segmentation hypotheses to be tested) or its outputs (e.g., the maximum
number of segments to be identified or the maximum number of segments or the percentage of segments to
be analyzed). Other examples of scope parameters include the amount of resources and/or time spent on the
whole project or each stage of it.
Deliverables: The project’s outputs, whose format and organization need to be clearly specified at the beginning. While all
of the project’s stakeholders will be looking for high-quality, rigorous analysis, the format that the deliverables
take can significantly affect the output’s acceptance and effectiveness. The project sponsor is responsible for
thinking of the most suitable format for the deliverables and to plan ahead about how they can be used on an
ongoing basis.
Step 1: Setting up the Project

Finding Your Best Customer: A Guide to Best Current B2B Customer Segmentation | 10
Typical Customer Segmentation Deliverables
The deliverables for most customer segmentation projects should include the following:
› A presentation highlighting key findings, including, but not limited to:
- A list of the top customer segments identified and verified through the analysis
- Additional insights into these segments
- A representative list of customers within those selected segments
- A list of recommended next steps
› A file containing the data and analysis that support the main conclusions in the presentation
› Data file(s) containing the original inputs and intermediate files, as well as auxiliary output files (for record keeping purposes)
Creating a Work Plan
Before executing the project, it is also important to have two sets of plans: a high-level outline and a work plan. The outline
should detail the basic steps, methodology, and timeline of the project. The project’s stakeholders should review and approve
this document.
The work plan is a much more detailed document that elaborates significantly upon the outline, typically breaking down steps
into specific tasks that clearly indicate what needs to be done and what the related inputs and outputs are. The work plan also
has to incorporate various internal touch points between everyone involved in the project.
The work plan should reflect inputs on key tasks as well as suggestions and specifications for outputs at key internal review
steps. It should also ensure that the methodology behind the main analytical tasks is consistent with the project’s overall meth-
odology. The detailed work plan should then be used to estimate the time required for each task (in hours or days), project step
(in days or weeks), and the whole project (in weeks). Expect some discrepancies between the estimated length of the project
and the actual time it takes to complete it.
During the course of the project, there will invariably be unplanned diversions and other changes that need to be reflected in
the work plan. Major changes to steps in the project or the project’s methodology should always be vetted by the stakeholders
and fully documented in the updated work plan.

Finding Your Best Customer: A Guide to Best Current B2B Customer Segmentation | 11
Getting Buy-in from the Executive Team
To have true impact, a customer segmentation exercise — and specifically its outputs — must be incorporated into your com-
pany’s go-to-market strategy. This is because, in many cases, selecting a top segment can actually kick-start the execution of a
companywide go-to-market strategy. However, you will only achieve that level of impact if your company’s executive team is a
true stakeholder in the project.
Buy-in can be achieved by getting them to understand that:
› Selecting and focusing on a segment is a strategic imperative
› Conducting a best current customer segmentation exercise — which is distinct from other types of segmentation analysis — is the best way to meet that imperative
› The methodology being used, and the planned inputs and outputs of the project, are appropriate
To ensure the executive team’s buy-in across these areas, it is important to actively articulate the benefits of best current customer
segmentation. Be extremely transparent about the methodology and process steps involved in the project so that your stakeholders
are always aware of any changes in the process that might make them reconsider their commitment to the overall project.
Additional Best Current Customer Segmentation Prerequisites
Developing a customer list
The project scoping and definition exercise continues by developing an account list to use as your data set. Built from a cus-
tomer relationship management or billing database, the list needs to be comprehensive and include all of your customers with
the exception of test and proof of concept (POC) accounts.
Note that any company’s customer base will contain outliers — customers with very special characteristics, deal structures, or
conditions — which must be carefully considered before deciding whether or not to keep them in your analysis. Keeping the
outliers in the analysis can be a disadvantage, skewing average values and expanding the variance of the data under analysis,
thus reducing the precision of the results, and highlighting one-offs while disguising underlying trends.

Finding Your Best Customer: A Guide to Best Current B2B Customer Segmentation | 12
Consider the following points as you seek to reduce your full customer list to one that is more conducive to statistical analysis:
At the same time, avoid the temptation to over-represent current or “good” accounts. The best analysis is done on customer accounts
data that realistically represents the customer base that your company has built and expects to acquire in the near future.
Defining customer quality or value
The purpose of your analysis is to identify common characteristics that define good customers. To do that well, you need to clearly
and objectively define what good means by developing a quality score that you can use to objectively rank your customer base.
In the purest sense, customer value is the total net present value of the cumulative profits generated by a customer over its life-
time. Naturally, you won’t have data on the future behavior of your current accounts, so you will have to make certain assump-
tions about the future, and fill in missing data with averages based on the data you do have. Practically speaking, it is very hard
to calculate or even approximate this, especially with the demographics of young, rapidly growing companies.
Another complication is that it is almost impossible to precisely identify all of the non-negligible costs associated with a cus-
tomer over its lifetime, especially for software as a service (SaaS) companies whose service costs stem from a blend of hosting,
Example
Remove customers that are isolated at the extremes of the
customer base by either revenue or deal structure/terms/
characteristics. It is unlikely that they represent replicable
segments of the market.
Exclude a single account that represents four times
the monthly recurring revenue of the next largest
account.
Remove newer accounts that may not have had a chance to
establish patterns that determine their longer-term value,
such as renewal, growth, or account maintenance.
Exclude accounts won after a specific date.
Do not analyze new accounts, or consider analyzing them
separately due to a lack of proper and consistent data.
Exclude accounts won before a specific date.
Do not analyze accounts that are too small to be consequen-
tial in your analysis, particularly if they will require significant
research to analyze.
Exclude accounts with less than $250,000
in monthly recurring revenue (MRR).

Finding Your Best Customer: A Guide to Best Current B2B Customer Segmentation | 13
bandwidth, customer support, and account management costs. You should not
expect the score to include all of these factors completely or to be a precise mea-
sure of the value/cost/profits. Nevertheless, the quality score will serve your purposes
as long as it captures enough of the differences between what your organization
considers poor, average, and great customers, and allows you to rank customers
based on those measurements.
The following example illustrates an approach to establishing a quality score for a
software as a service (SaaS) or license-based software vendor:
1. Begin with the client’s annualized contract value, taking both current
and former customers into consideration.
2. Subtract an estimate of the costs directly associated with the account.
For a technology company, the gross expenses will be fairly minimal,
but should incorporate subtler costs such as:
› Maintenance costs: Support tickets, client service payroll expenses, etc.
› Acquisition costs: Payroll expenses and costs incurred during sales cycles associated with acquiring that account
3. Adjust this score with bonuses and penalties for customer characteristics
that hint at the future behavior of the account. Some examples of bonuses
and penalties include:
› A bonus for license/revenue growth, which can be represented as a percentage of growth over the last period, or as a scaled score representing the magnitude of growth
› A penalty for cancellation (a fixed reduction of the total score)
› A bonus for marquee customers (to represent their value as a marketing asset)
Such bonuses and penalties are necessary to compensate for less concrete costs and income associated with the
account. For example, as noted above, we are not sure how long a current account will remain a customer or at what
rate it will renew. However, we can assume that growing accounts are happy and are more likely to renew at a higher
rate. As a result, we can reward their score accordingly for that expected future behavior. Likewise, marquee accounts
will have an impact beyond their own MRR, so their scores should reflect that.
EXAMPLE
“ Business success in
entrepreneurial and
technology markets is
built on a solid foun-
dation of customer
centricity and micro-targeting. While
innovative market segmentation has
become a management priority, most
firms struggle in designing and imple-
menting practical initiatives. Systematic
segmentation processes can provide
your company with a roadmap for profit-
able strategic direction, growth, and long-
term marketing effectiveness.”
Art Weinstein, Ph.D., Chair and Professor of Marketing, Nova Southeastern University, and author of Superior Customer Value — Strategies for Winning and Retaining Customers and Handbook of Market Segmentation

Finding Your Best Customer: A Guide to Best Current B2B Customer Segmentation | 14
Below are sample calculations of the quality score formula described on the previous page:
Quality score for ABC Company, which grew by 50 percent this year:
Annualized contract value for 2011: ......... $100,000
20 percent bonus for year
on year contract growth over 2010: ........... $20,000
Cost of support ($300 per ticket,
times 20 support tickets in 2011): ............. -$6,000
Cost of sales process ($20 per day during
sales process, times 160 days): .................. -$3,200
Final quality score: ................................ $110,800
Once you have developed a quality score that sufficiently captures these nuances, the next step is to present it to the project
stakeholders for their feedback. This is essential because the quality score is the foundation for the rest of the project and
everyone needs to generally accept it as an accurate and reliable representation of customer “goodness.”
In the feedback process, you might uncover additional factors that need to be incorporated into the scoring formula (for exam-
ple, additional usage or acquisition costs). Reviewing the quality score may also raise concerns about systematic errors in the
formula that are obvious to certain stakeholders but not to others. This could mean anything from eliminating costs deemed not
relevant, to increasing the weighting of a particular bonus or penalty.
Always remember, no matter how thoroughly defined and logical your methodology, the ultimate
results of the analysis will not be credible unless all of your stakeholders agree with your proposed
ranking of the accounts. Reaching that agreement may be difficult, and will likely require flexibility
in your formula and some consensus building so that all of your stakeholders can agree and commit
to the methodology.
Quality score for XYZ Company, which canceled this year:
Annualized contract value for 2011: .......... $60,000
50 percent penalty for canceling in 2011: -$30,000
Cost of support ($300 per ticket,
times 3 support tickets in 2011): .................. -$900
Cost of sales process ($20 per day
during sales process, times 100 days): ........ -$2,000
Final quality score: .................................. $27,100
EXAMPLE

Finding Your Best Customer: A Guide to Best Current B2B Customer Segmentation | 15
Step 2: Analyzing Customer DataThe next step in the best current customer segmentation process is to develop a formula or set of criteria to measure the
attractiveness or value of each customer in your customer base. This formula is determined by the actual economic benefits or
net profits/loss that customer has generated over its lifetime. It creates an objective measure that can consistently be used to
compare customers in different segments.
Identifying Segmentation Hypotheses: What Characteristics Make a Company a Good Customer?
Once your list of accounts is objectively ranked, start identifying hypotheses for the observable characteristics that could pre-
dict their quality.
The hypotheses should represent proposed relationships between customer characteristics and the “goodness” of the customer,
as measured by the quality score. If the company you are analyzing has more of a particular characteristic, it will likely have a
higher quality score.
To generate an initial list of such segmentation hypotheses, you will need to analyze:
› The structure of the market: Identify the buyers, sellers, providers, and beneficiaries in the company’s value chain. Are distinct markets or use cases prevalent? The alignment of the participants along product lines, use case, packaging format, or special offerings might suggest a similar division of your company’s customer base along the same lines.
› Market information residing within the company: Interview your customer-facing staff (sales, marketing, and customer support) to understand the following:
- What are the key selling points that win an account?
- Why do customers generally cancel?
- Who is our marketing directed at and why?
If their answers can be framed as observable characteristics of a company, they can be used as a segmentation hypothesis.
› Market experts and their publications: How do they segment the market? How do they define your market and your competitors?
Step 2: Analyzing Customer Data

Finding Your Best Customer: A Guide to Best Current B2B Customer Segmentation | 16
› Competitive information: Review competitor websites for their marketing messaging, promotions, sales content, and prod-uct features. Who are they targeting? Do they segment their website content, messaging, and product lines? If so, why?
› Structurally similar industries: Review industries with similar organizational characteristics to your market. This can provide clues that reveal special structural characteristics that define their market segmentation.
› Standard, a priori segmentation schemes: Consider customer size, customer industry, customer geography, etc. See page 33 in the Appendix for a more exhaustive list of the typical segmentation variables used in B2B industries.
Remember, the ultimate goal of your research and data collection is to determine what makes a good customer for your com-
pany or product. At this stage, no segmentation idea is too far-fetched, as long as there is some economic or logical rationale
for why it could be true and it is a meaningful prediction that can be validated. You want to capture every angle that might help
you segment your customer base.
When conducting interviews within your company, speak with a cross-section of team members from marketing, product devel-
opment, and sales. Each function within the organization should have some ideas about who they are designing their marketing
message, sales tactics, or product features for, and why those targets would make an attractive customer.
In many early stage companies, these ideas may differ substantially from person to person and function to function. Collect
each of their viewpoints and ask a lot of follow-up questions to uncover any hypotheses they might have about customer seg-
mentation.
Your list of ideas will typically include segmentation hypotheses like the following:
Larger companies make better clients
B2B companies make better clients
Multinational companies make worse clients
Companies with large advertising budgets make better clients
Companies that are more active in social media make worse clients
Companies with a small IT team make better clients
Hospitals typically make worse clients
Finding Your Best Customer: A Guide to Best Current B2B Customer Segmentation | 17
Identifying the Data Fields and Internal or External Sources Required to Test and Prioritize the Hypotheses
Once you have built a comprehensive list of segmentation hypotheses and have standardized them in the format illustrated
above (“companies with more of characteristic X make better/worse clients”), the next step is to devise the appropriate data-
driven processes to validate them. This requires you to identify the right data points to support the hypothesis.
You can do so for each hypothesis you have identified by:
1. Evaluating the best numerical measure for evaluating the hypothesized characteristic X.
2. Identifying public data sources that can provide the value of the measure for the companies in your list of customers.
If there is no publicly available data source for the particular measure, you have three options to consider:
› Use paid sources (if available and affordable), such as subscriptions to corporate and financial information databases (e.g., D&B/Hoover’s, InsideView, or S&P Capital IQ.
› Devise or define a proxy measure that is available through a public source, such as number of online visitors or rankings in Fortune 500 or Inc. 5,000 lists.
Consider dropping the hypothesis altogether if there is no available source — paid or unpaid — for the data.
3. For each data source identified, estimate the cost of collecting the data by considering the cost of the subscriptions as
well as the cost in time and effort of collecting the data for the companies in your customer list. You can roughly esti-
mate the time costs by carrying out the data collection steps for a few companies and establishing a benchmark.
4. Considering the quality and accuracy of the data sources.
5. Weighing the total cost of using a data source and the quality, accuracy, and coverage of the sources to decide on the
most practical data source and data collection process to use when testing a particular hypothesis. A data source should
also be preferred if it provides sufficiently accurate data for multiple hypotheses at the same time.
Finding Your Best Customer: A Guide to Best Current B2B Customer Segmentation | 18
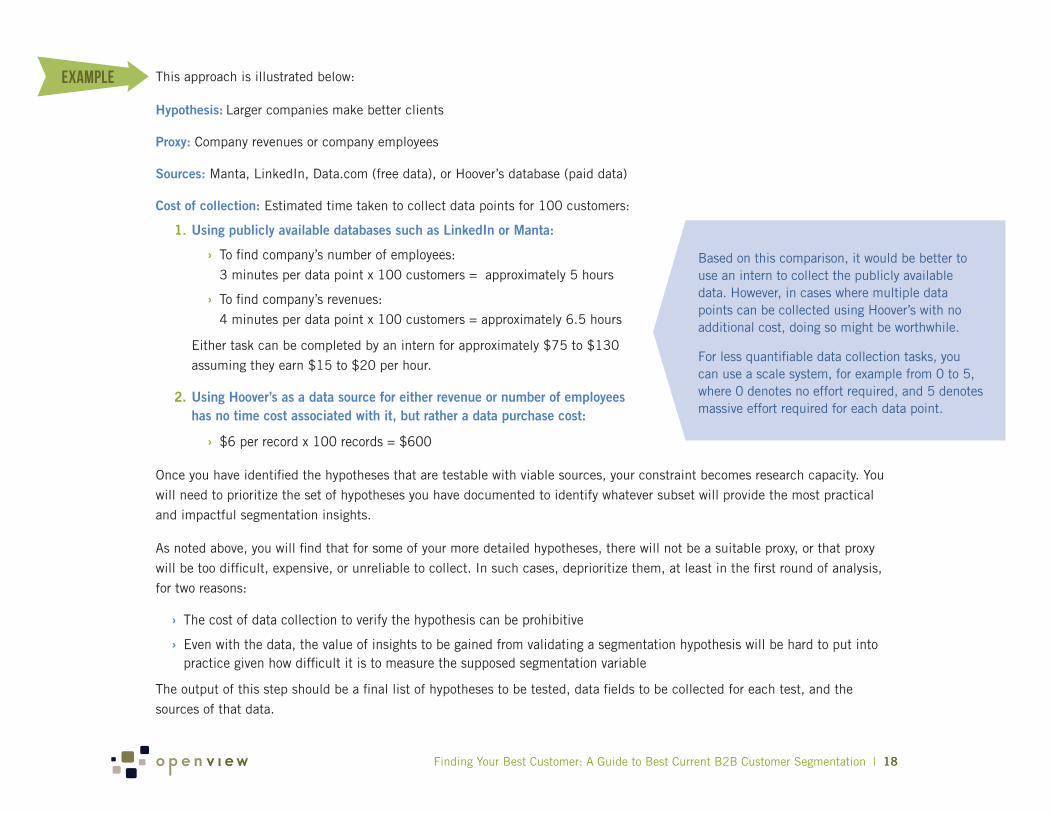
This approach is illustrated below:
Hypothesis: Larger companies make better clients
Proxy: Company revenues or company employees
Sources: Manta, LinkedIn, Data.com (free data), or Hoover’s database (paid data)
Cost of collection: Estimated time taken to collect data points for 100 customers:
1. Using publicly available databases such as LinkedIn or Manta:
› To find company’s number of employees: 3 minutes per data point x 100 customers = approximately 5 hours
› To find company’s revenues: 4 minutes per data point x 100 customers = approximately 6.5 hours
Either task can be completed by an intern for approximately $75 to $130
assuming they earn $15 to $20 per hour.
2. Using Hoover’s as a data source for either revenue or number of employees has no time cost associated with it, but rather a data purchase cost:
› $6 per record x 100 records = $600
Once you have identified the hypotheses that are testable with viable sources, your constraint becomes research capacity. You
will need to prioritize the set of hypotheses you have documented to identify whatever subset will provide the most practical
and impactful segmentation insights.
As noted above, you will find that for some of your more detailed hypotheses, there will not be a suitable proxy, or that proxy
will be too difficult, expensive, or unreliable to collect. In such cases, deprioritize them, at least in the first round of analysis,
for two reasons:
› The cost of data collection to verify the hypothesis can be prohibitive
› Even with the data, the value of insights to be gained from validating a segmentation hypothesis will be hard to put into practice given how difficult it is to measure the supposed segmentation variable
The output of this step should be a final list of hypotheses to be tested, data fields to be collected for each test, and the
sources of that data.
EXAMPLE
Based on this comparison, it would be better to use an intern to collect the publicly available data. However, in cases where multiple data points can be collected using Hoover’s with no additional cost, doing so might be worthwhile.
For less quantifiable data collection tasks, you can use a scale system, for example from 0 to 5, where 0 denotes no effort required, and 5 denotes massive effort required for each data point.

Finding Your Best Customer: A Guide to Best Current B2B Customer Segmentation | 19
Step 3: Data CollectionThe next step is to build a comprehensive list of ways of using the customer characteristics you have identified to distinctly
classify your current customer base by attractiveness. This is done using inputs and recommendations informed by the com-
pany’s staff, experts, and customers, as well as research on competitors. It is important to be as comprehensive as possible
because effective differentiating factors can go beyond typical schemes such as company industry, size, or geographic region.
Managing the Data Collection Process
To collect the data, you need to develop a plan detailing where each variable will be found, and which resource and method will
be used to find it. Doing so assumes that you have access to a team of data collectors who will carry out the research, or access
to an external data provider that will provide the data you need in the required format.
The research manager will need to work closely with your data collection team throughout this potentially complex research pro-
cess. Therefore, sharing the research plan with team members to get their feedback and support is very important. Their input
will make the plan more accurate and realistic, while their support will make the project more efficient.
BEST PRACTICES FOR MANAGING A RESEARCH TEAM
› Ensure proper and consistent documentation of the input and output specifications for each research task
› Leverage overlapping data collection needs for different segmentation hypotheses: the same data field can be used in testing multiple hypotheses
› Document research tasks — even the most minute details — as each one has a tremendous impact on the quality of the data
› Establish a regular working rhythm with the team that includes reviewing the outputs, allocating new research tasks, and resolving any impediments
› Consider establishing a separate sub-team of research-ers to focus on data quality assurance and require that all research outputs be vetted by the team
› Use a collaboration and document sharing tool with ver-sioning functionality to better manage the vast number of data fields typically associated with this process
Step 3: Data Collection

Finding Your Best Customer: A Guide to Best Current B2B Customer Segmentation | 20
The data collection work plan and the best practices described on the previous page are still relevant even if you do not have
access to any additional resources for data collection. When setting up your plan, identify potential weaknesses in the data set
and pay special attention to them as the data is collected. These weaknesses might include:
› Incomplete or hard-to-reach data (e.g., revenues for private companies)
› Outdated data
› Data that is not easily standardized or has multiple definitions (e.g., profits are sometimes given as gross profits, EBITDA, or operating profits)
› Data that requires qualitative judgment (e.g., industry or business model)
To ensure the quality of the data, conduct quality assurance before, during, and after the data collection process. Problematic data
will create issues not only during your segmentation analysis, but also when it is time to generate outbound prospecting lists.
If you have any doubt about the quality of the data source, based on your review of the preliminary data outputs, consider
another proxy or data source. In cases where there is no suitable alternative, go back to the previous step and consider the
hypothesis among the full list of prioritized hypotheses.
Step 4: Analysis & PrioritizationThe next step is to analyze and validate the segmentation hypotheses you have identified. This analysis will require significant
data about your current customer base, so you will need to develop a data collection plan and a research process.
Once the necessary data have been collected, you can analyze and validate each of the hypotheses, helping to identify whether
a segmentation idea is right or wrong. Having done so, it is also important to analyze the relationships between validated
hypotheses. The synthesis of these segmentation schemes is an overall segmentation of the best customers that incorporates
each of the validated segmentation hypotheses. That results in segments that are not only analytically proven to be attractive,
but also intuitive and targetable for the purpose of developing and executing a segment-focused strategy against them.
Step 4: Analysis & Prioritization

Finding Your Best Customer: A Guide to Best Current B2B Customer Segmentation | 21
Executing Data Analysis to Identify Relevant Variables and Validate Your Hypotheses
Now it is time to analyze the data to validate or reject each segmentation hypothesis, and uncover the relationship between
them. There are several different ways to do so.
LIGHTWEIGHT CLUSTERING ANALYSIS
If you have a small customer base, and/or a small list of segmentation hypotheses, one approach you can take is to conduct a
lightweight clustering analysis by systematically reviewing the customer ranking relative to the hypothesized factors as follows:
› Create a table that lists all of the customer accounts you are analyzing together with their quality scores, as well as each account’s data fields that correspond to the segmentation hypotheses you have selected for testing.
› Sort the table by quality score and systematically go through the list of segmentation hypotheses to check if there is a cor-relation between the values in a segmentation hypothesis data field and the quality score. The relationship does not have to be one-to-one or even a linear correlation, but rather as simple as the following:
All customers with more than $5 million in annual revenues are in the top 10 percent of the customer base, while all customers with less than $5 million in revenues are in the bottom 20 percent of the customer base.
Often, that observation is enough to put some confidence behind the fact that characteristic X might be a good predictor of a customer’s quality.
› Once a segmentation hypothesis appears to be validated using the steps above, sort the whole table according to the vari-able associated with that hypothesis. Doing so turns the analysis around to see if the segmentation variable in question is truly effective in separating great customers from the rest. This sorting process should lead to a clear segmentation of the customer base, where one segment is disproportionately represented by “good” customers.
By following the steps described above, you will have validated your segmentation hypotheses and provisionally reviewed the
distinct segments formed by one or more of your hypotheses.
The second approach, listed below, can be used when you have more resources and time to spend on your analysis, or when
there are many customer accounts to analyze.

Finding Your Best Customer: A Guide to Best Current B2B Customer Segmentation | 22
Now, evaluating each of these branches of the tree individually, look at the data again to see if there is another variable that splits the data in ways that clearly differentiate the good customers from the lower-value ones.
Company sells to Businesses? YES = 40 50% A’s
YES = 10 80% A’s
NO = 60 8% A’s
NO = 30 40% A’s
This, together with the conclusion from the top branch, indicates that larger B2B companies
might be a very attractive segment for your company. By further diving into this segment, and
repeating the process with the “No” sides of the previous two trees, you might find additional
attractive nodes within the data. (See the next page for an example of a full tree.)
TREE-BASED CLUSTERING ANALYSIS
Begin by slicing your data into quartiles by account quality score, such that your best quartile of customers is labeled “A” custom-
ers, and your bottom quartile is labeled “D.” If you are dealing with a large number of customers (i.e., hundreds) you can divide
them into deciles instead.
Now look at the characteristics of each quartile (or decile), using averages for each proxy variable that you collected. In which
variables do the A’s appear significantly different from the D’s? Are there any patterns that immediately jump out at you?
Taking the most obvious pattern in the data, the next step will be to create a branch in the data to illustrate this.
OVERALL SAMPLE
Total number of customers:
100 Number of customers
classified as A’s:
25%Over 500 Employees?
EXAMPLE
The end result will be a list of attractive segments for further analysis, which provides several advantages:
› It will serve as the basis for narrowing your regression analysis down to a few relevant variables.
› The tree is a visually appealing and logical way to look at the data, which will help you communicate your conclusions to stakeholders during the presentation phase of the project.
› It will help you determine cut-off points that regression analysis would not be able to properly capture.
Å B2B companies appear to be better customers overall than non-B2B companies.

Finding Your Best Customer: A Guide to Best Current B2B Customer Segmentation | 23
There are some additional points to keep in mind during this stage of the analysis:
› The field you use as your first decision point (in the example above, “Company sells to Businesses?”) is very important and can dramatically shape the rest of your decision tree. Try experimenting with different segmentation schemes to see if you can generate greater divisions at each decision point.
› In general, stop adding additional branches when the difference between the nodes stops being relevant or when the number of companies within each node becomes too low. For example, if you have segmented your list of 100 companies into a list of 50 different industries, a sample size of two for each industry will not be very convincing. You should either combine industries to create larger buckets, or consider segmenting based on another variable.
Below is an example of the full segmentation tree, after multiple iterations of the process described above.
ALL CUSTOMERS Average Customer Score: 50 Range of Score: 20-90
Is Industry = Retail?
YES NORetail Industry: 17% of total customer base % of customers in 25% overall: 40% Average Customer Score: 65
National Retailer: % of customers in 25% overall: 60% Average Customer Score: 72
Ecommerce Retailer: % of customers in 25% overall: 50% Average Customer Score: 66
Local Retailers: % of customers in 25% overall: 20% Average Customer Score: 45
Manufacturing: 23% of total customer base % of customers in 25% overall: 35% Average Customer Score: 59
Major Manufacturers (>$1B in revenue): % of customers in 25% overall: 30% Average Customer Score: 54
Small to Medium Manufacturers (<1$B in revenue): % of customers in 25% overall: 40% Average Customer Score: 63
Other Industry: 60% of customer base % of customers in 25% overall: 20% Average Customer Score: 41
Other Industry with Ecommerce Portal: % of customers in 25% overall: 37% Average Customer Score: 59
Other Industry without Ecommerce Portal: % of customers in 25% overall: 15% Average Customer Score: 35
Is Industry = Manufacturing?
YES NO
Potential segments of good
customers
Potential segment of low-quality customers

Finding Your Best Customer: A Guide to Best Current B2B Customer Segmentation | 24
STRENGTHENING HYPOTHESIS VALIDATION WITH REGRESSION ANALYSIS
Once you find your segmentation variables using either of the methods described above, you can take the process one step
further by numerically validating those hypotheses using regression analysis.
Start with a large set of variables — perhaps all of the ones that appeared relevant in the initial quartering of the data set. Run
a multivariate regression against those variables with the account quality score as the dependent variable. The result of the
regressions will allow you to identify variables that are insignificant (variables that do not correlate with the quality score in any
way), as well as variables that might be too closely correlated to each other to both be included in the analysis. Eliminate those
variables and rerun the analysis until you have reached a set of variables that are all significant, and yet substantially indepen-
dent of each other. These are the ultimate segmentation variables for the purposes of this project.
It may also be advantageous to run separate regressions for different segments that you identified in the previous data. For
example, the previous tree illustrated that B2B companies segment nicely based on employees. However, it’s possible that B2C
companies segment better based on another variable. Therefore, running separate regressions for B2B and B2C companies may
produce better results than including them all in a single model.
Evaluating Composite Segmentation
Because value-based segmentation is a predictive process, any resulting segmentation scheme can be evaluated as if it is a
predictive model of the customer’s quality. In order to come to the most appropriate segmentation scheme, we can compare the
different composite segmentation schemes discovered using a technique called “lift charting.”
A lift chart shows the predictive power of a scoring model by comparing the likelihood that a customer with a high score on that
model is also a good customer based on historical data. Lift refers to the increase in probability that a customer that is scored
highly by that model is actually a good customer, per historical data. If the model had no predictive power at all, the likelihood
would essentially be that of a randomly chosen prospect, and its lift would be zero.
For example, using our segmentation scheme, we are effectively predicting whether a prospect will fall within the top 25 per-
cent of our customer base, based on our recently established quality score. The way to measure this predictive power is to apply
the predictive model to the existing customer base and see what percentage of the actual top 25 percent of customers falls
within the top 25 percent of customers in that model.
Finding Your Best Customer: A Guide to Best Current B2B Customer Segmentation | 25
Because the actual quality score incorporates information that is only available after a prospect becomes a customer, it is unlikely
that we will be able to predict this perfectly, but the closer we get to correctly predicting the top 25 percent of customers, the better.
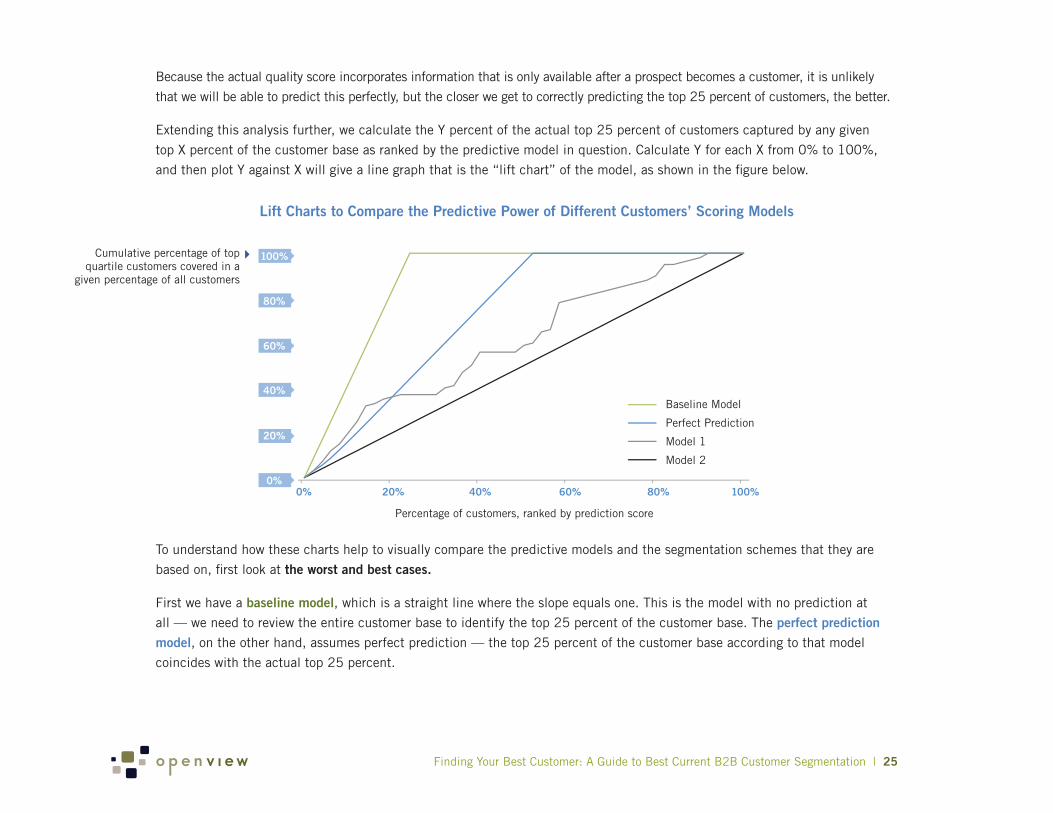
Extending this analysis further, we calculate the Y percent of the actual top 25 percent of customers captured by any given
top X percent of the customer base as ranked by the predictive model in question. Calculate Y for each X from 0% to 100%,
and then plot Y against X will give a line graph that is the “lift chart” of the model, as shown in the figure below.
Lift Charts to Compare the Predictive Power of Different Customers’ Scoring Models
To understand how these charts help to visually compare the predictive models and the segmentation schemes that they are
based on, first look at the worst and best cases.
First we have a baseline model, which is a straight line where the slope equals one. This is the model with no prediction at
all — we need to review the entire customer base to identify the top 25 percent of the customer base. The perfect prediction model, on the other hand, assumes perfect prediction — the top 25 percent of the customer base according to that model
coincides with the actual top 25 percent.
0% 20% 40% 60% 80% 100%0%
20%
40%
60%
80%
100%Cumulative percentage of top quartile customers covered in a
given percentage of all customers
Percentage of customers, ranked by prediction score
Baseline Model
Perfect Prediction
Model 1
Model 2
Finding Your Best Customer: A Guide to Best Current B2B Customer Segmentation | 26
Model 1 and model 2 are imperfect models with slightly different lifts. Model 1 has better lift because it is higher above the
baseline model, and is closer to the perfect prediction model. The top 50 percent of the customer base according to model 1
captures the actual top 25 percent. In contrast, the top 90 percent of the customer base according to model 2 captures the
same actual top 25 percent. Model 1 clearly has more predictive power than model 2.
Ultimately, the results of your regression and lift chart analysis will likely be too technical and detailed to be included in your
final presentation to your stakeholders. However, it is still important to perform this analysis to verify that the results of your
decision tree are rigorously supported by quantifiable measures, to choose between alternative segmentation schemes, and to
retain it as an appendix for anyone looking for additional insight into your methods.
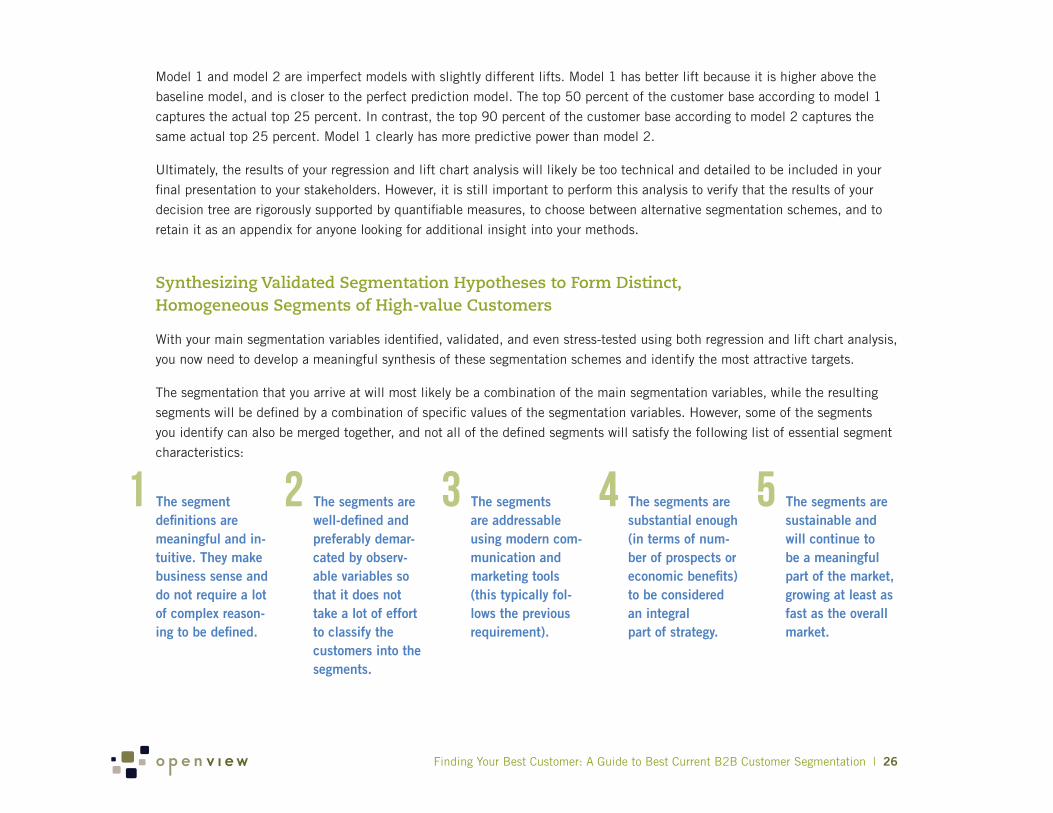
Synthesizing Validated Segmentation Hypotheses to Form Distinct, Homogeneous Segments of High-value Customers
With your main segmentation variables identified, validated, and even stress-tested using both regression and lift chart analysis,
you now need to develop a meaningful synthesis of these segmentation schemes and identify the most attractive targets.
The segmentation that you arrive at will most likely be a combination of the main segmentation variables, while the resulting
segments will be defined by a combination of specific values of the segmentation variables. However, some of the segments
you identify can also be merged together, and not all of the defined segments will satisfy the following list of essential segment
characteristics:
1 The segment definitions are meaningful and in-tuitive. They make business sense and do not require a lot of complex reason-ing to be defined.
2 The segments are well-defined and preferably demar-cated by observ-able variables so that it does not take a lot of effort to classify the customers into the segments.
3 The segments are addressable using modern com-munication and marketing tools (this typically fol-lows the previous requirement).
4 The segments are substantial enough (in terms of num-ber of prospects or economic benefits) to be considered an integral part of strategy.
5 The segments are sustainable and will continue to be a meaningful part of the market, growing at least as fast as the overall market.

Finding Your Best Customer: A Guide to Best Current B2B Customer Segmentation | 27
The reason for listing the characteristics above is that they are what ultimately define actionable segments, as opposed to the
analytically defined and validated segments that you might have developed through the previous analysis.
The main tradeoff in your selection and/or definition of segments based on the validated segmentation hypotheses is thorough-
ness versus practicality. For example, during the analysis stage, you may have identified half a dozen important characteristics
that predict a customer’s success, all of which may interact in a complex way (for instance, B2B companies generally need to
have more than 500 employees to be “good customers,” whereas B2C companies can be “good customers” with just over 100
employees). Incorporating that complexity fully into your segmentation plan can result in overly complicated, fragmented seg-
ments that are impossible to target and not scalable enough to be worth investing in the segmentation focus strategy.
To reduce some of this complexity, you should concentrate on fewer segments that more fully satisfy the list of criteria above.
While you will lose some accuracy by ignoring less important variables, your best insights will be much more powerful and use-
ful to the organization. Thus, even though you might have validated many different hypotheses, you should work to synthesize
them so that your final segmentation scheme depends on just a few segmentation variables. Having more variables will unnec-
essarily complicate the delivery of your results, and the subsequent efforts to target the identified segments.
Evaluating Segment Value, Targetability, and Size to Prioritize Your Best Segment(s)
Once you have reached a satisfactory overarching segmentation scheme, the last analysis to be done is to evaluate the resulting
segments and prioritize the few that are most promising in terms of:
Customer quality: Measured by the average customer score, this is the spread of the scores within all customers in that segment, as well the lowest and highest scores of customers in that segment.
Segment size: A rough estimate of the total economic value of all the prospects that have characteristics as defined by the segment. A true segment-sizing analysis is beyond the scope of the present document and is often unneces-sary. Typically, you only need to find an approximation of the number of prospects in the segment, or the prevalence of prospects in the segment, to come to a reasonable understanding of the size of the segment.
Segment growth: A rough indication of future trends relative to the size and attractiveness of the segment.
Finding Your Best Customer: A Guide to Best Current B2B Customer Segmentation | 28
Typically, given the limited number of segments analyzed, and the distinction you have identified and sharpened in your analy-
sis and synthesis of the segmentation scheme, the choice of the best segment is quite obvious. However, the feedback process
might result in slight prioritization changes, as new factors are uncovered or incorporated into the prioritization process.
Furthermore, given that you should be primarily concerned with the most important segments, you should also focus your
synthesis on defining the few segments that form a big part of your best customer groups. The number of segments depends
entirely on the scope of the project and the way the results pan out. However, the segments you target probably should not rep-
resent more than 25 to 50 percent of the total customer base, so as to help you meaningfully narrow your sights on the more
attractive targets. Typically this means really focusing on just two or three top segments in your final recommendations.
Step 5: Presenting and Incorporating FeedbackThe last step in the best current customer segmentation process is to apply the customer quality measurement discussed in the
first step to the aggregate customer set in each of the identified segments. Doing so will allow you to ensure that the customer
segment(s) with the best overall customer quality is/are identified.
You are then ready to present your findings to your stakeholders.
Building Your Final Presentation
Creating a final presentation is a significant undertaking, but it is important for a couple of reasons:
› It facilitates the delivery of the insights — paired with the analysis results that support them — to the stakeholders and encourages them to rally behind its recommendations.
› It is a reference document to be used in the propagation of the segmentation insights in other teams/departments, particularly in the implementation of the segment focus strategy throughout the company.
Step 5: Presenting and Incorporating Feedback

Finding Your Best Customer: A Guide to Best Current B2B Customer Segmentation | 29
An effective presentation typically has the following sections:
Agenda One slide to frame the content of the presentation
Executive summary No more than two to three slides that summarize the key findings and recommendations
Additional summary for stakeholders A recap of the original project goals, the agreed-upon methodology, and the main milestones that have been achieved in the
project; this will help stakeholders quickly catch up and be comfortable with the next sections of the presentation. If possible,
limit the time spent explaining the intricacies of the methodology, as this level of detail is not necessary for your stakeholders.
Key insights This should constitute the meat of the presenta-
tion. First, review the segments you selected in
order of prioritization. Then, show how much bet-
ter they are in aggregate than the general popu-
lation of customers. Finally, show that focusing
on these segments will generate fewer misses,
but that the benefits of not targeting lower-value
customers far outweigh any meaningful lost
opportunities. You can use two sets of charts to
illustrate this point:
› A chart showing how the top 25 percent (or any suitable percentage) of custom-ers are dominated by the customers in the identified and prioritized segments (see the example to the right).
Others
LastQuartile
ThirdQuartile
SecondQuartile
TopQuartile
Small to mediummanufacturers
National and Ecommerce retailers
0%
20%
40%
60%
80%
100% Breakdown of Top Customers by Selected Segments

Finding Your Best Customer: A Guide to Best Current B2B Customer Segmentation | 30
› A chart showing how each of the segments comprises a dis-proportionately high percentage of high-quality customers. For example, more than 40 percent of the customers in seg-ment X are in the top 25 percent of all customers by quality score (see the example to the right).
To further illustrate the segment definition, provide examples
and give the segment a catchy, easy-to-remember name.
Methodology After your message is clear, explain how you arrived at your
results. Discuss the account score and show the top 10 and
bottom 10 accounts, explaining why they are scored that way.
Additionally, cover the hypotheses you tested, and discuss the
ones that you found out were not relevant. Very briefly, talk about
gaps in the data or possible biases, and the results of
your regression analysis.
Top Quartile
2nd Quartile
3rd Quartile
Last Quartile
0%
20%
40%
60%
80%
100%
National &Ecommerce
Retailers
Smallto Medium
Manufacturers
Others
Breakdown of Selected Segments by Customer Ranking
Next Steps List key next steps that will help ensure the impact of the project.
You need to first highlight the immediate next step, which is for stakeholders to give feedback to segmentation recommenda-
tions and approve/adopt the recommendations after the feedback has been satisfactorily addressed.
The steps that follow should be actions your organization can take to implement the segmentation recommendations delivered
here. You may want to explain how each of the stakeholders can use the conclusions of your analysis. This may include aspects
of whole product strategy, go-to-market strategy, sales, marketing, and even customer service. The object is to get all facets of
your organization aligned to the target segments, and to make absolutely sure that existing customers in the segments are well
served and there is good coverage of prospective companies in the space on the part of your marketing and sales teams.
Finding Your Best Customer: A Guide to Best Current B2B Customer Segmentation | 31
Gathering Feedback
After giving your presentation, the stakeholders will likely have questions and feed-
back concerning the segments that you examined. Some of them will have had cer-
tain preconceptions about the business that may conflict with your conclusions, so
anticipate the weaknesses in your argument and be ready to address them honestly
and thoroughly. Too many unresolved concerns about your methods can undermine
the entire project.
If these concerns require adjustments to your data set in order to win the support of
your stakeholders, it may be worth adjusting your methodology slightly to ease these
reservations. Keeping track of your data files and strictly following the best practices
in data versioning and management will allow you to go back to your files and make
adjustments to respond to the feedback and questions without redoing a lot of work.
Ultimately, the project will only succeed if it gets broad-based support from the stake-
holders, so the project may require several iterations before receiving such support.
Translating Information into Action
After completing the five steps laid out in this chapter, your business should have
the critical best current customer segmentation data it needs to begin focusing on
more productive — and profitable — segments. That data is only helpful if you put it
into action immediately, however.
Like almost anything in business, the information you cull from this process has a
shelf life, largely because any number of factors — both within your company and
your target market segment — can impact which companies constitute your “best”
customers. As a result, it is important to implement the results of your best current
customer segmentation research as quickly as possible, and measure their impact
over time. As things change, it is a good idea to reconsider your best current cus-
tomer segments and, if necessary, re-execute the process outlined above to adapt to
those changes.
“Many start-
ups fall into the
trap of taking
a scattershot
approach to
gaining market share. Though
it may seem counterintuitive,
the narrower your focus, the
greater your chances of success.
Customer segmentation can
help you precisely define and
pinpoint the optimal prospects
— and create the content and
information that will resonate
most with them — to increase
the likelihood of selling your
products and services. In other
words, it paves the way for
making meaningful inroads with
the market segment most likely
to purchase your offering.”
Stephanie Tilton Principal, Ten Ton Marketing

Finding Your Best Customer: A Guide to Best Current B2B Customer Segmentation | 32
End NoteWhile this eBook provides a step-by-step process for identifying, prioritizing, and targeting your best current customer seg-
ments, simply following it does not guarantee success. To be effective, you must prepare and plan for the various challenges
and hurdles that each step may present, and always make sure to adapt your process to any new information or feedback that
might change its output. Additionally, you cannot force-feed this process on your business. If the key stakeholders that will be
impacted by the best current customer segmentation process do not fully buy in to it, then the outputs produced from it will be
relatively meaningless.
If you properly manage the best current customer segmentation process, however, the impact it can have on every part of your
organization — sales, marketing, product development, customer service, etc. — is immense. Your business will possess stron-
ger customer focus and market clarity, allowing it to scale in a far more predictable and efficient manner.
Ultimately, that means no longer needing to take on every customer that is willing to pay for your product or service, which will
allow you to instead hone in on a specific subset of customers that present the most profitable opportunities and efficient use
of resources. That is critical for every business, of course, but at the expansion stage, it can often be the difference between
incredible success and certain failure.
End Note
Finding Your Best Customer: A Guide to Best Current B2B Customer Segmentation | 33
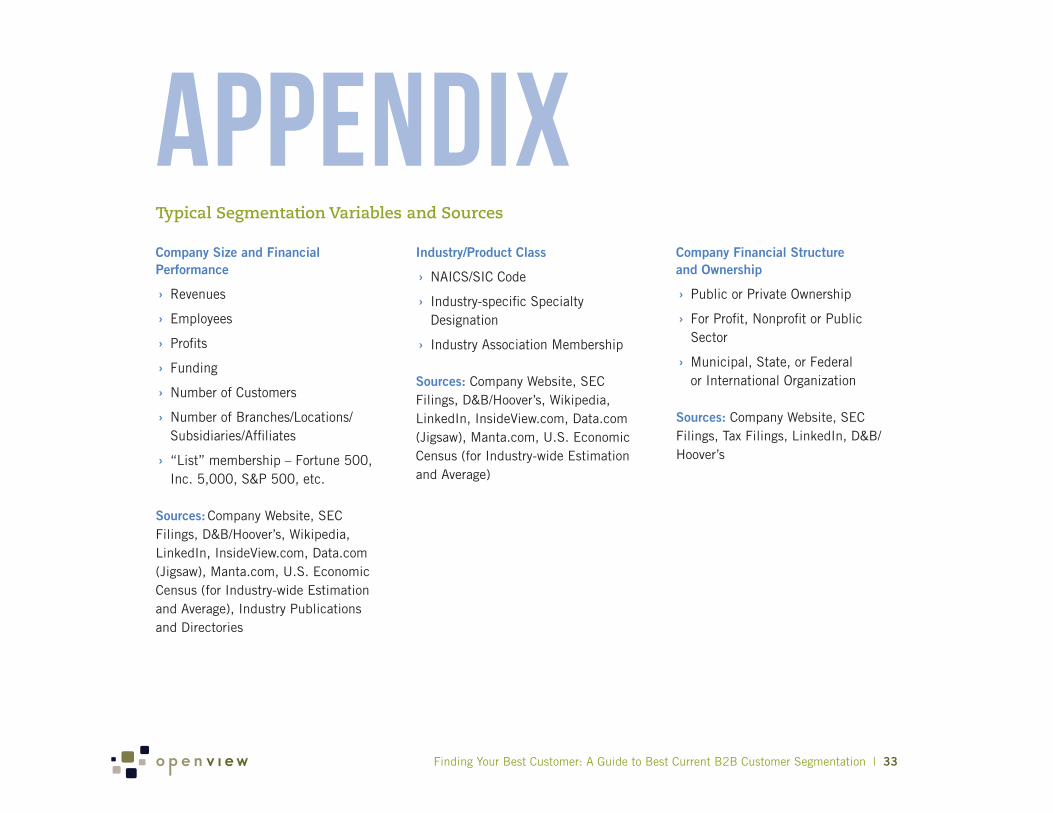
AppendixTypical Segmentation Variables and Sources
Appendix
Company Size and Financial Performance
› Revenues
› Employees
› Profits
› Funding
› Number of Customers
› Number of Branches/Locations/Subsidiaries/Affiliates
› “List” membership – Fortune 500, Inc. 5,000, S&P 500, etc.
Sources: Company Website, SEC Filings, D&B/Hoover’s, Wikipedia, LinkedIn, InsideView.com, Data.com (Jigsaw), Manta.com, U.S. Economic Census (for Industry-wide Estimation and Average), Industry Publications and Directories
Industry/Product Class
› NAICS/SIC Code
› Industry-specific Specialty Designation
› Industry Association Membership
Sources: Company Website, SEC Filings, D&B/Hoover’s, Wikipedia, LinkedIn, InsideView.com, Data.com (Jigsaw), Manta.com, U.S. Economic Census (for Industry-wide Estimation and Average)
Company Financial Structure and Ownership
› Public or Private Ownership
› For Profit, Nonprofit or Public Sector
› Municipal, State, or Federal or International Organization
Sources: Company Website, SEC Filings, Tax Filings, LinkedIn, D&B/Hoover’s
Appendix

Finding Your Best Customer: A Guide to Best Current B2B Customer Segmentation | 34
Company Business Model
› Customer Type: Businesses (with sub-designation), Government, Specific Industry, Consumers, Businesses that Sell to Consumers
› Revenue Model: Perpetual License Product Sales, SaaS License Sales, Advertisements, Freemium, Main-tenance Services
› Distribution Model: Vertically Integrated, Franchise/Exclusive Distribution Networks, Pureplay Manufacturer/Distributor/Retailer, Aggregator, Marketplace, Platform
Sources: Company Website, SEC Filings, Tax Filings, Court Filings, Franchise/Distribution Contract Documents
Company’s Reputation
› Industry Awards/Listings
› Mentions of company in media
› Individual awards for company’s key employees
› Mentions of company’s key employees in media
› Membership/Leadership of Industry Association/Umbrella Organizations
Sources: Industry Association, Industry Publication, Business Publication, Company’s Website, news search engine and archives (Google News)
Company’s Online Presence
› Website Traffic/Traffic Rank
› Social Media Followership (Twitter Followers, LinkedIn Followers, Foursquare Check-in, Facebook Likes, Google Pluses)
› Social Review Data (Yelp, TripAdvisor, etc.)
› Klout Score
› Company’s generated online marketing activities (number of blog posts, number of tweets)
› Mention of company’s name on various online media
Sources: Social Media Sites, Web Traffic Measurements: Alexa.com, Compete.com, Quantcast.com; Klout.com; News and Blog search engines, Social Mention search engines
Typical Segmentation Variables and Sources, cont.

Finding Your Best Customer: A Guide to Best Current B2B Customer Segmentation | 35
Additional Resources
The resources below contain valuable additional information about customer segmentation:
A Guide to the Design and Execution of Segmentation Studies
http://www.terry.uga.edu/~rgrover/chapter_25.pdf
Four Principal Methods of SegmentationSegmentation
http://www.dobney.com/Research/segmentation.htm
CS1 What is Customer Segmentation?: Guide
http://www.emmgroup.net/cs1-what-consumer-segmentation-guide
Target Market Selection Segmentation and Positioning
http://blog.demandmetric.com/2010/01/27/target-market-segmentation-and-positioning/
Marketing Segmentations That Matter
http://www.winettassociates.com/wa_memo_dec06.html
Best Current Customer Segment ResearchMarket Segmentation and Best Customers
http://www.information-management.com/news/5659-1.html
Segmentation TechniquesHierarchical Cluster Analysis
http://www.clustan.com/hierarchical_cluster_analysis.html
Business-to-Business Segmentation
http://www.greenbook.org/marketing-research.cfm/business-to-business-segmentation
The Smallest Slice
http://www.destinationcrm.com/Articles/Editorial/Magazine-Features/The-Smallest-Slice-47140.aspx

Finding Your Best Customer: A Guide to Best Current B2B Customer Segmentation | 36
Segmenting Customers: How to Do It Efficiently to Improve Enterprise Products
http://www.pragmaticmarketing.com/publications/topics/10/segmenting-customers-how-to-do-it-efficiently-to-improve-enter-
prise-products
Analytics and Market Segmentation
http://www.b2bmarketing.com/index-1.html
Customer Segmentation: Principles of Effective Differentation
http://www.slideshare.net/vdimitroff/customer-segmentation-principles
Data SourcesWhat Are the Top Seven Sales Analysis Sources of B2B Lists?
http://www.salesbenchmarkindex.com/bid/72487/What-are-the-top-Seven-7-Sales-Analysis-Sources-of-B2B-Lists
Case StudiesNarrowing the Focus: Market Segmentation Workshop
http://openviewpartners.com/case-study/market-segmentation-workshop
Blog Posts and ArticlesMarket Segmentation — The Means to More Probable Growth
http://blog.openviewpartners.com/market-segmentation-the-means-to-more-profitable-growth
Making Market Segmentation Work: Planning your Segment Focus Go-to-Market Strategy
http://blog.openviewpartners.com/making-market-segmentation-work-planning-your-segment-focus-go-to-market-strategy
Thoughts on Target Segmentation
http://blog.openviewpartners.com/thoughts-on-target-segmentation
Operationalizing Your Segmentation Strategy at the Business Unit Level
http://labs.openviewpartners.com/operationalizing-your-segmentation-strategy-at-the-business-unit-level/

About OpenView LabsOpenView Labs is the strategic and operational consulting arm of OpenView Venture Partners, a global Venture Capital fund that invests in expansion-stage technology companies.
More InformationVisit the OpenView Labs website for more ideas and inspiration for senior managers of technology companies.
To learn more about OpenView Labs or OpenView Venture Partners, contact us directly at (617) 478-7500 or [email protected].
You are welcome to republish excerpts from this eBook, as long as you link back to OpenView for attribution. Please also share this eBook in its entirety with anyone you think would be interested.
This work is licensed under the Creative Commons Attribution-NonCommercial-ShareAlike 3.0 Unported License. To view a copy of this license, visit http://creativecommons.org/licenses/by-nc-sa/3.0/ or send a letter to Creative Commons, 171 Second Street, Suite 300, San Francisco, California, 94105, USA.


