Download - FINANCIAL INDICATORS REPORT for hospitals
A Primer on Ratio Analysis and the CAH Financial Indicators Report
CAH Financial Indicators Report Team
North Carolina Rural Health Research and Policy Analysis Center
Cecil G. Sheps Center for Health Services Research
725 Martin Luther King, Jr. Boulevard
Chapel Hill, NC 27514
CAH Financial Indicators Report Team
University of North Carolina at Chapel Hill
George H. Pink, PhD
G. Mark Holmes, PhD
Technical Advisor
Roger Thompson, Seim, Johnson, Sestak & Quist LLP
2
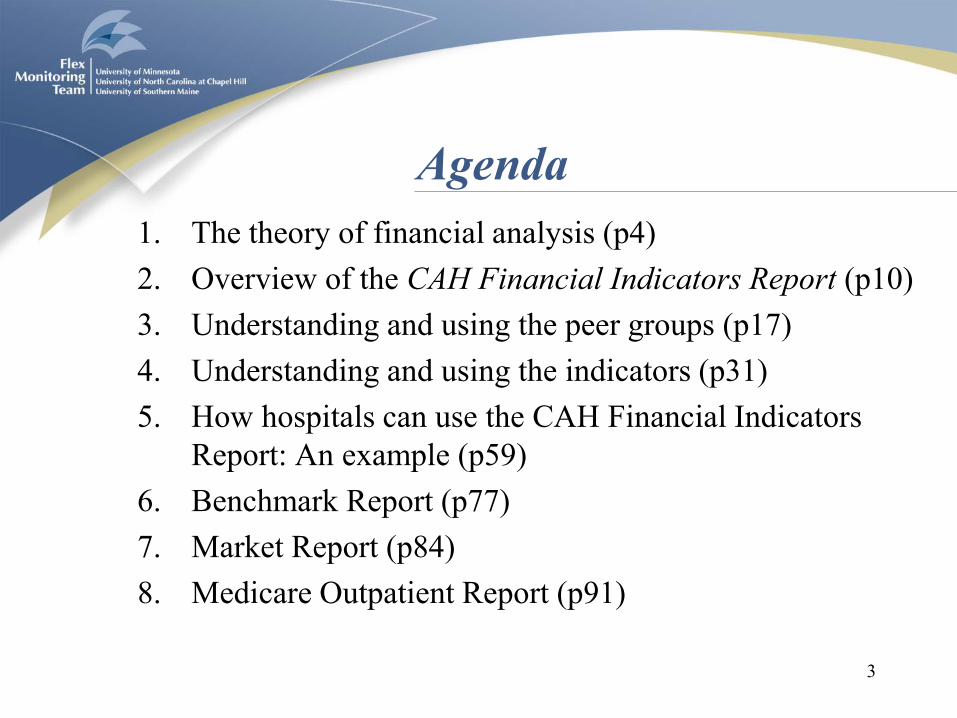
Agenda
1. The theory of financial analysis (p4)
2. Overview of the CAH Financial Indicators Report (p10)
3. Understanding and using the peer groups (p17)
4. Understanding and using the indicators (p31)
5. How hospitals can use the CAH Financial Indicators
Report: An example (p59)
6. Benchmark Report (p77)
7. Market Report (p84)
8. Medicare Outpatient Report (p91)
3

4
1. The theory of financial analysis

Purpose
• One of the most important characteristics of a business is its financial performance and condition
• Financial analysis assesses a business’s financial performance and condition: Does it have the financial capacity to meet its mission?
• Results sometimes focus on financial strengths and weaknesses
5
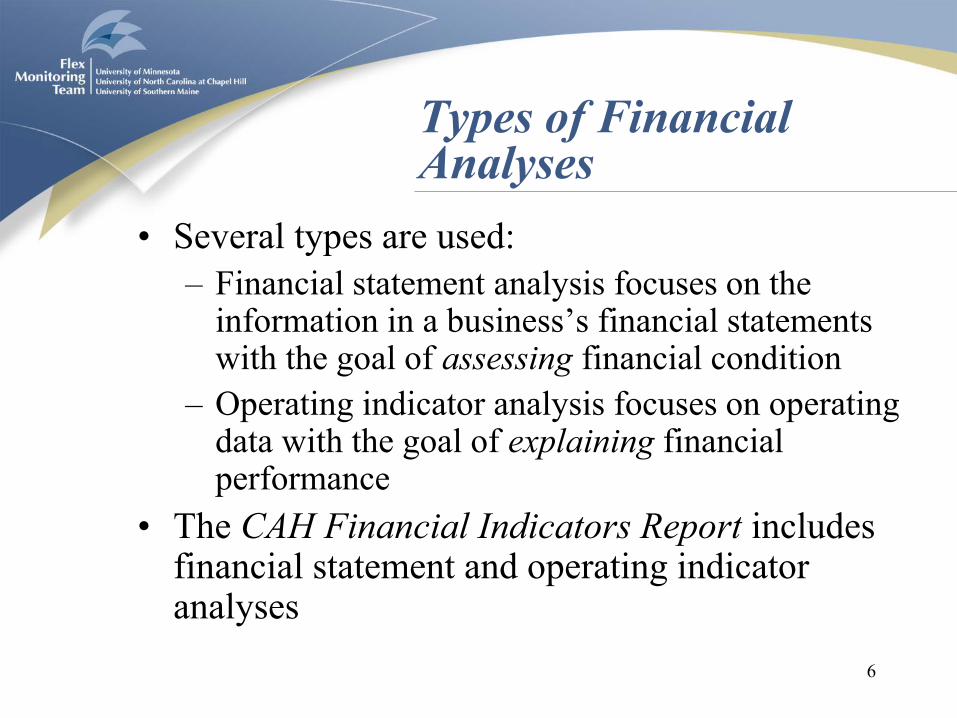
Types of Financial Analyses
• Several types are used:
– Financial statement analysis focuses on the information in a business’s financial statements with the goal of assessing financial condition
– Operating indicator analysis focuses on operating data with the goal of explaining financial performance
• The CAH Financial Indicators Report includes financial statement and operating indicator analyses
6

Ratio Analysis
• Ratio analysis is a technique used in both
financial statement and operating indicator
analyses
• It combines values from the financial statements
(and elsewhere) to create single numbers that: – have easily interpretable financial significance
– facilitate comparisons
7

Interpreting Ratios
• A single ratio value has little meaning:
– One point in time that may not be representative
– Can’t tell if it is better or worse than other hospitals
• Therefore, two techniques are commonly used to help interpret “the numbers”: – Trend (time series) analysis
– Comparative (cross-sectional) analysis
• Both techniques are used in the CAH Financial Indicators Report
8

Using Ratios
• Ratios help to identify:
– Questions to ask
– Issues to address
– Problems to solve
• Ratios do not necessarily provide
– Answers
– Explanations
– Solutions
9

10
2. Overview of the
CAH Financial Indicators Report

Objectives of the CAH Financial Indicators Report
• To select and construct a set of financial
performance measures that are relevant to Critical
Access Hospitals (CAHs)
• To provide comparative information that CAH
boards and managements can use to improve
financial performance
• To improve the quality of Medicare Cost Report
data reported by CAHs (our goal)
11

12

13

Ratios in the CAH Financial Indicators Report
• Profitability indicators measure the ability to
generate the financial return required to replace
assets, meet increases in service demands, and
compensate investors
– Total margin, cash flow margin, return on equity,
operating margin
• Liquidity indicators measure the ability to meet
cash obligations in a timely manner
– Current ratio, days cash on hand, net days revenue
in accounts receivable 14

Ratios in the CAH Financial Indicators Report
• Capital structure indicators measure the extent of debt and equity financing
– Equity financing, debt service coverage, long-term debt to capitalization
• Revenue indicators measure the amount and mix of different sources of revenue
– Outpatient revenues to total revenues, patient deductions, Medicare inpatient payer mix, hospital Medicare outpatient payer mix, hospital Medicare outpatient cost to charge, Medicare acute inpatient cost per day
15
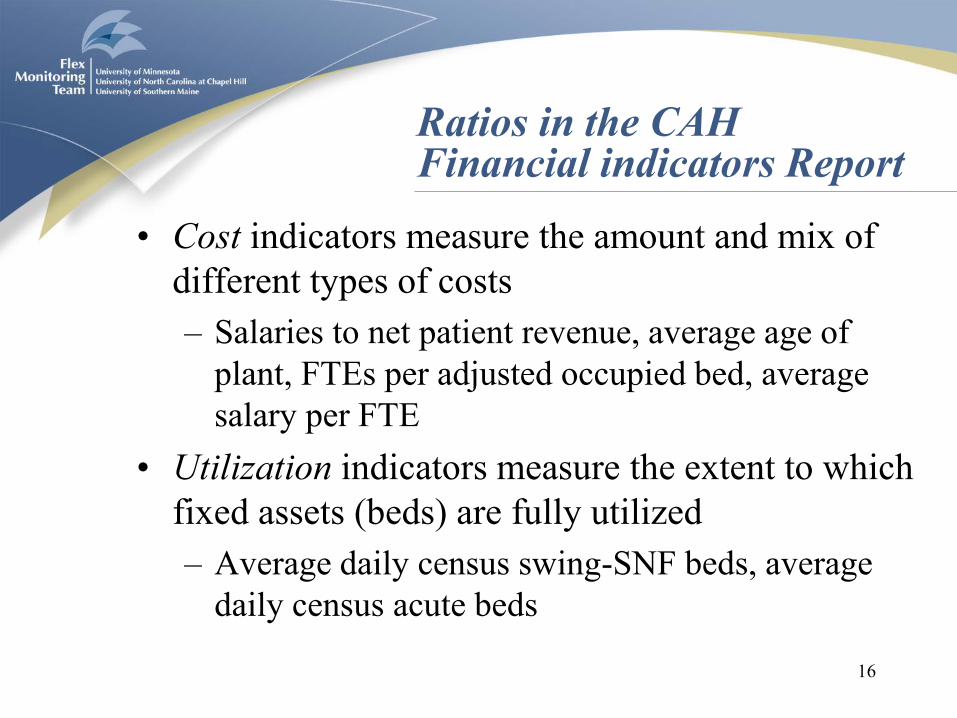
Ratios in the CAH Financial indicators Report
• Cost indicators measure the amount and mix of
different types of costs
– Salaries to net patient revenue, average age of
plant, FTEs per adjusted occupied bed, average
salary per FTE
• Utilization indicators measure the extent to which
fixed assets (beds) are fully utilized
– Average daily census swing-SNF beds, average
daily census acute beds
16

17
3. Understanding and using the peer groups

First Issue of the CAH Financial Indicators Report
• In Summer 2004, hospital-specific reports
were sent to 853 administrators
• An evaluation form was included
• Many respondents requested comparison of
their performance to similar CAHs
18

Selection of CAH Peer Groups
• Suggestions from respondents
• Literature review to identify important peer groups in other studies
• Advice of Technical Advisory Group
• Potential peer groups evaluated using statistical analysis
• Selected peer groups:
– Important influences on indicator values
– Could be validly defined from Cost Reports
19

Creation of CAH Peer Groups
• From Medicare Cost Report data, we
identified factors important to CAH financial
performance:
– Had <$10 million, $10-20 million, or >$20
million in net patient revenue
– Provided long-term care
– Was owned by a government entity
– Operated a Rural Health Clinic
20

# of Indicators that Varied for Each Factor
• Financial performance and condition varied
significantly among the peer groups:
# of
Indicators
Net patient revenue 16 / 20
Provided long-term care 10 / 20
Owned by government 10 / 20
Operated a Rural Health Clinic 7 / 20
21

Creation of CAH Peer Groups
• All combinations of the four factors were used
to create 24 peer groups
• Every CAH is assigned to one of the 24 peer
groups
• Indicator medians are calculated for each peer
group
22

Second Issue of the CAH Financial Indicators Report
• In Summer 2005, hospital-specific reports were sent to 1,029 administrators
• Peer group, state, and national medians
• Summary graph of performance relative to peer group
• An evaluation form was included and most respondents affirmed the selected peer groups
• Many wanted peer group comparisons for CAHs in their state
23

Net Patient Revenues
• Larger CAHs were more profitable and could
carry more debt, possibly because:
– More diagnostic and outpatient services
– Higher charges, lower costs, or both
– Lower proportion of Medicare patients
– Higher patient volume generates higher total
revenue and lower fixed costs per patient
– Other reasons?
24

Net Patient Revenues
• Larger CAHs also had:
– Higher Medicare revenue per day (greater
patient acuity, ICU/specialty service, higher
wages in larger communities?)
– Lower salaries to total expenses (more
equipment, higher drug costs?)
– Newer average age of plant (greater debt
capacity?)
25

Provided Long-Term Care
• CAHs that provided long-term care were less
profitable, possibly because:
– Higher proportion of Medicaid patients
– Medicare Cost Report accounting methods
– Lower patient volume
– Other reasons?
26

Provided Long-Term Care
• CAHs that provided long-term care also had:
– Lower days revenue in accounts receivable
(LTC bills submitted prior to service?)
– Lower outpatient revenue to total revenue
(LTC revenue is in the denominator)
– Higher salaries to total expenses (high touch /
low tech nature of long-term care?)
27

Owned by Government
• CAHs that were owned by the government were less profitable but more liquid, possibly because:
– Higher charges, lower costs, or both
– Lower patient volume
– Other reasons?
• CAHs that were owned by the government also had:
– Higher current ratio (lower use of debt)
– Older average age of plant (lower use of debt?)
28
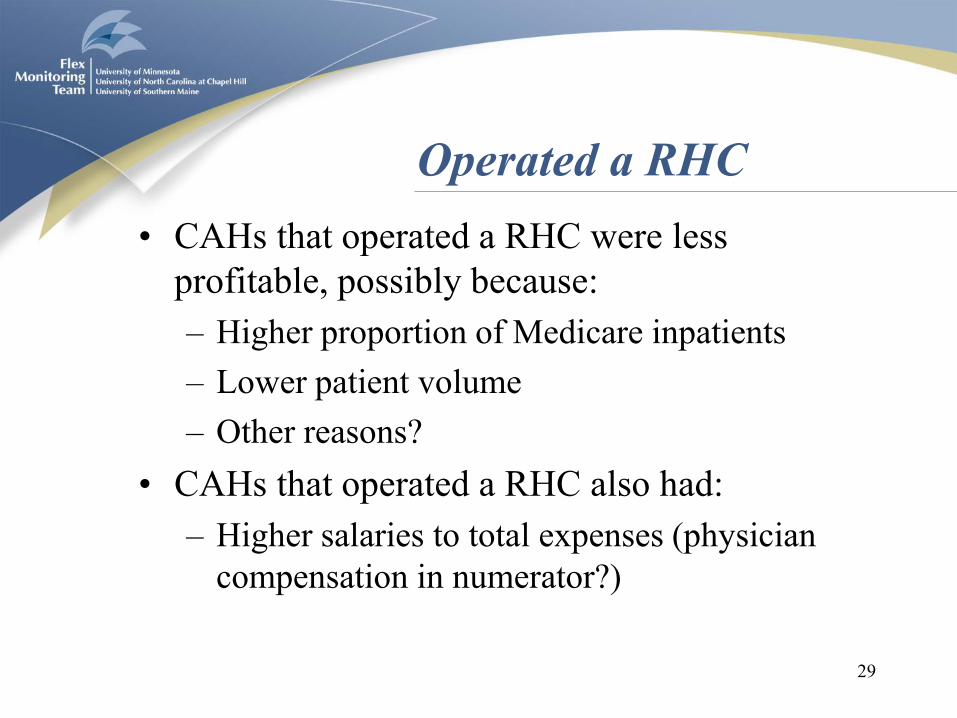
Operated a RHC
• CAHs that operated a RHC were less
profitable, possibly because:
– Higher proportion of Medicare inpatients
– Lower patient volume
– Other reasons?
• CAHs that operated a RHC also had:
– Higher salaries to total expenses (physician
compensation in numerator?)
29

Conclusion
• CAHs are not all the same - significant differences in financial performance and condition exist among CAH peer groups
• May be misleading or unfair to compare the financial performance of a smaller CAH to a larger CAH, a CAH that does not provide LTC to a CAH that provides LTC, and so on
• Compare CAH financial performance:
– First to peer group median
– Second to state median
– Third to U.S. median
30

31
4. Understanding and using the indicators

An Example: Our Hospital
• Let’s look at indicator values for Our Hospital
• For all of the indicators:
– Our Hospital is best performer
– Peer group median is second best
– State median is third best
– U.S. median is fourth best
• All of the numbers are contrived except for the
U.S median
32

Profitability: Total Margin
2012
Our Hospital
2012 Peer Group
Median CAH
2012 State
Median CAH
2012 U.S.
Median CAH
6% 5% 4% 2.61%
33
Net income
Total revenue
Measures the control of expenses relative to revenues
Definition
Interpretation
Is a higher total margin always good?

Profitability: Cash Flow Margin
2012
Our Hospital
2012 Peer Group
Median CAH
2012 State
Median CAH
2012 U.S.
Median CAH
8% 7% 6% 7.11%
34
Net income – (Contributions, investments, and appropriations +
Depreciation expense + Interest expense)
Net patient revenue + Other income –
Contributions, investments, and appropriations
Measures the ability to generate cash flow
from providing patient care services
Definition
Interpretation
Why might total margin be negative and cash flow margin be positive?

Profitability: Return on Equity
2012
Our Hospital
2012 Peer Group
Median CAH
2012 State
Median CAH
2012 U.S.
Median CAH
10% 9% 8% 5.36%
35
Net income
Net assets
Measures the net income generated
by equity investment (net assets)
Definition
Interpretation
What is net assets?

Profitability: Operating Margin
2012
Our Hospital
2012 Peer Group
Median CAH
2012 State
Median CAH
2012 U.S.
Median CAH
3% 2% 1% 1.13%
36
Net patient revenue + operating income – total operating expenses
Net patient revenue + other revenue
Measures the control of operating expenses relative to
operating revenues
Definition
Interpretation
Is a higher operating margin always good?
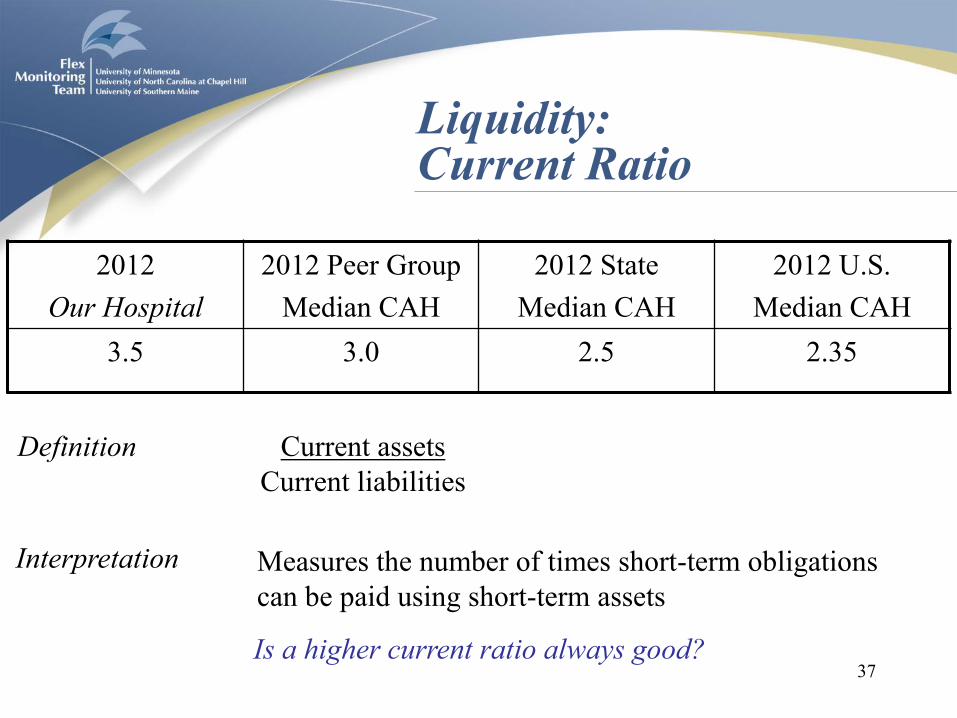
Liquidity: Current Ratio
2012
Our Hospital
2012 Peer Group
Median CAH
2012 State
Median CAH
2012 U.S.
Median CAH
3.5 3.0 2.5 2.35
37
Current assets
Current liabilities
Measures the number of times short-term obligations
can be paid using short-term assets
Definition
Interpretation
Is a higher current ratio always good?
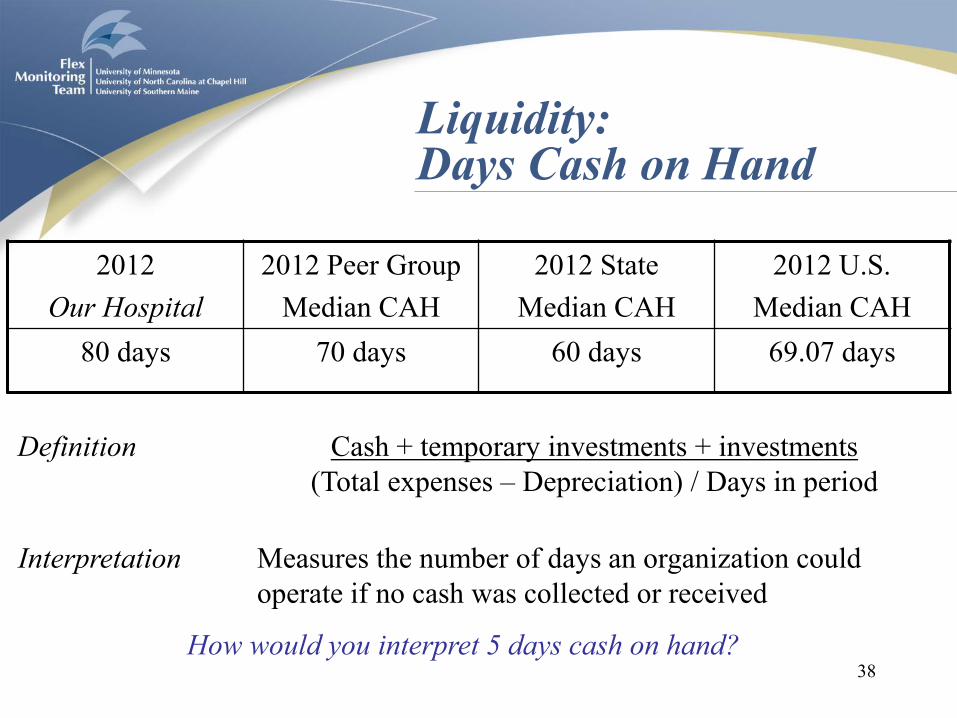
Liquidity: Days Cash on Hand
2012
Our Hospital
2012 Peer Group
Median CAH
2012 State
Median CAH
2012 U.S.
Median CAH
80 days 70 days 60 days 69.07 days
38
Cash + temporary investments + investments
(Total expenses – Depreciation) / Days in period
Measures the number of days an organization could
operate if no cash was collected or received
Definition
Interpretation
How would you interpret 5 days cash on hand?

Liquidity: Days Revenue in Accounts Receivable
2012
Our Hospital
2012 Peer Group
Median CAH
2012 State
Median CAH
2012 U.S.
Median CAH
40 days 45 days 50 days 52.74 days
39
Net patient accounts receivable
(Net patient revenue) / Days in period
Measures the number of days that it takes
an organization to collect its receivables
Definition
Interpretation
Is a higher days revenue in accounts receivable always bad?

Capital Structure: Equity Financing
2012
Our Hospital
2012 Peer Group
Median CAH
2012 State
Median CAH
2012 U.S.
Median CAH
68% 66% 64% 60.71%
40
Net assets
Total assets
Measures the percentage of total
assets financed by equity
Definition
Interpretation
Is a higher equity financing always good?

Capital Structure: Debt Service Coverage
2012
Our Hospital
2012 Peer Group
Median CAH
2012 State
Median CAH
2012 U.S.
Median CAH
6 times 5 times 4 times 2.52 times
41
Net income + Depreciation + Interest expense
Notes and loans payable (short term) * (365/DIP) + Interest expense where DIP means days in period
Measures the ability to pay obligations related to long-
term debt, principal payments and interest expense
Definition
Interpretation
What happens if a hospital has no debt?

Capital Structure: Long-Term Debt to Capitalization
2012
Our Hospital
2012 Peer Group
Median CAH
2012 State
Median CAH
2012 U.S.
Median CAH
18% 19% 20% 17.26%
42
Long-term debt
Long-term debt + Net assets
Measures the percentage of total capital that is debt
Definition
Interpretation
Is a lower long-term debt to capitalization always good?

Revenue: Outpatient Revenues to Total Revenues
2012
Our Hospital
2012 Peer Group
Median CAH
2012 State
Median CAH
2012 U.S.
Median CAH
80% 75% 70% 74.14%
43
Total outpatient revenue
Total patient revenue
Measures the percentage of total revenues that are for
outpatient revenues (including, for example, Rural
Health Clinics, free-standing clinics, and home health
clinics)
Definition
Interpretation
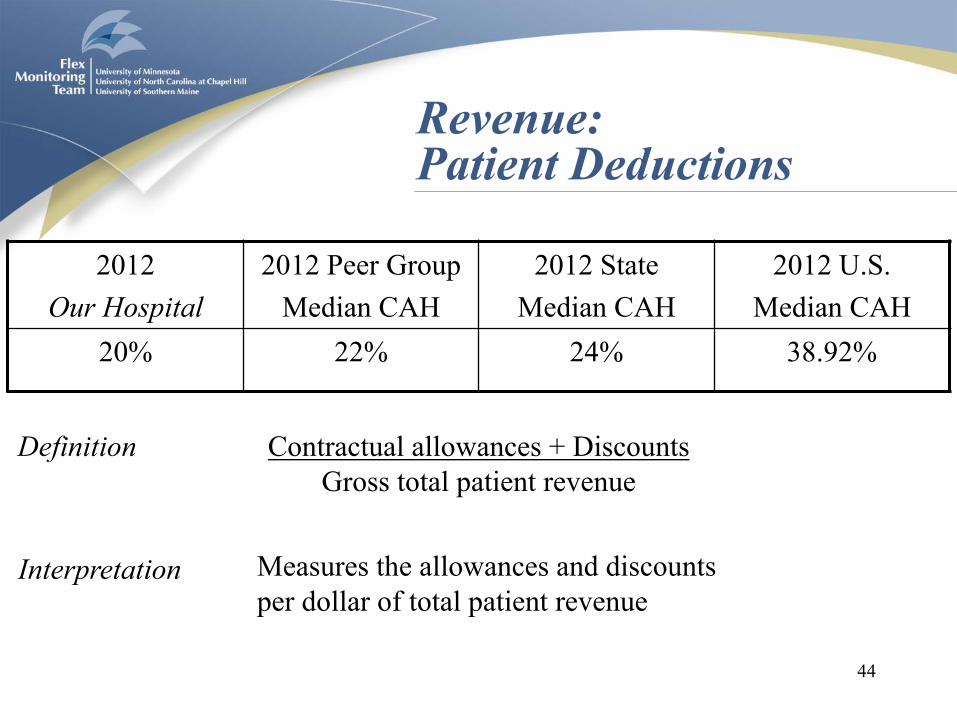
Revenue: Patient Deductions
2012
Our Hospital
2012 Peer Group
Median CAH
2012 State
Median CAH
2012 U.S.
Median CAH
20% 22% 24% 38.92%
44
Contractual allowances + Discounts
Gross total patient revenue
Measures the allowances and discounts
per dollar of total patient revenue
Definition
Interpretation

Revenue: Medicare Inpatient Payer Mix
2012
Our Hospital
2012 Peer Group
Median CAH
2012 State
Median CAH
2012 U.S.
Median CAH
60% 65% 70% 73.59%
45
Medicare inpatient days
Total inpatient days – Nursery bed days – NF Swing bed days
Measures the percentage of total inpatient days
that are provided to Medicare patients
Definition
Interpretation

Revenue: Hospital Medicare Outpatient Payer Mix
2012
Our Hospital
2012 Peer Group
Median CAH
2012 State
Median CAH
2012 U.S.
Median CAH
20% 25% 30% 37.59%
46
Hospital Outpatient Medicare charges
Hospital Total Outpatient Charges
Measures the percentage of total outpatient
charges that are for Medicare patients
Definition
Interpretation
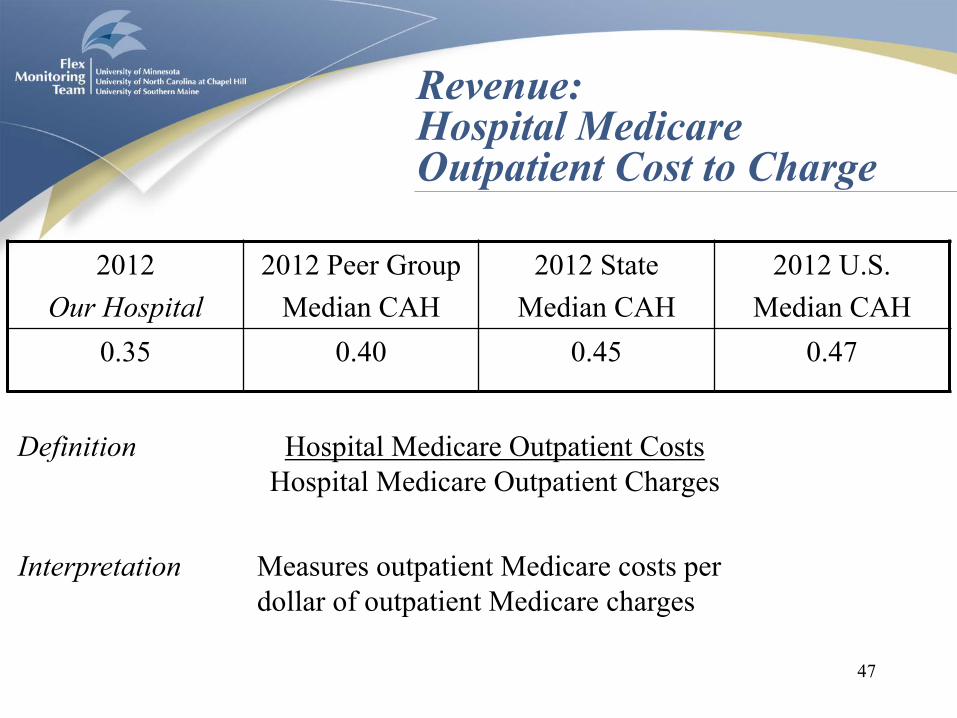
Revenue: Hospital Medicare Outpatient Cost to Charge
2012
Our Hospital
2012 Peer Group
Median CAH
2012 State
Median CAH
2012 U.S.
Median CAH
0.35 0.40 0.45 0.47
47
Hospital Medicare Outpatient Costs
Hospital Medicare Outpatient Charges
Measures outpatient Medicare costs per
dollar of outpatient Medicare charges
Definition
Interpretation

Revenue: Medicare Acute Inpatient Cost per Day
2012
Our Hospital
2012 Peer Group
Median CAH
2012 State
Median CAH
2012 U.S.
Median CAH
$1,800 $1,700 $1,600 $2,193
48
Medicare acute inpatient cost
(Medicare Inpatient Days (excl. HMO))
Measures the amount of Medicare
revenue earned per Medicare day
Definition
Interpretation

Cost: Salaries to Net Patient Revenue
2012
Our Hospital
2012 Peer Group
Median CAH
2012 State
Median CAH
2012 U.S.
Median CAH
40% 42% 44% 44.87%
49
Salary expense
Net patient revenue
Measures the percentage of net patient
revenue that are labor costs
Definition
Interpretation

Cost: Average Age of Plant
2012
Our Hospital
2012 Peer Group
Median CAH
2012 State
Median CAH
2012 U.S.
Median CAH
8 years 9 years 10 years 9.83 years
50
Accumulated depreciation
Depreciation expense * (365 / Days in Period)
Measures the average accounting age in years
of the fixed assets of an organization
Definition
Interpretation

Cost: FTEs per Adjusted Occupied Bed
2012
Our Hospital
2012 Peer Group
Median CAH
2012 State
Median CAH
2012 U.S.
Median CAH
4.5 FTEs 5.0 FTEs 5.5 FTEs 5.79 FTEs
51
Number of FTEs
Adjusted occupied beds**
Measures the number of full-time
employees per each occupied bed
Definition
Interpretation
** (Inpatient days – NF Swing days – Nursery days) *
(Total patient revenue / (Total inpatient revenue – Inpatient NF revenue – Other LTC Revenue)) / Days in period

Cost: Average Salary per FTE
2012
Our Hospital
2012 Peer Group
Median CAH
2012 State
Median CAH
2012 U.S.
Median CAH
$44,000 $46,000 $48,000 $49,316
52
Salary Expense
Number of FTEs
Measures the price and mix of labor.
Definition
Interpretation

Utilization: Average Daily Census Swing-SNF Beds
2012
Our Hospital
2012 Peer Group
Median CAH
2012 State
Median CAH
2012 U.S.
Median CAH
4 beds 3 beds 2 beds 1.51 beds
53
Inpatient swing bed SNF days
Days in period
Measures the average number of
swing-SNF beds occupied per day
Definition
Interpretation
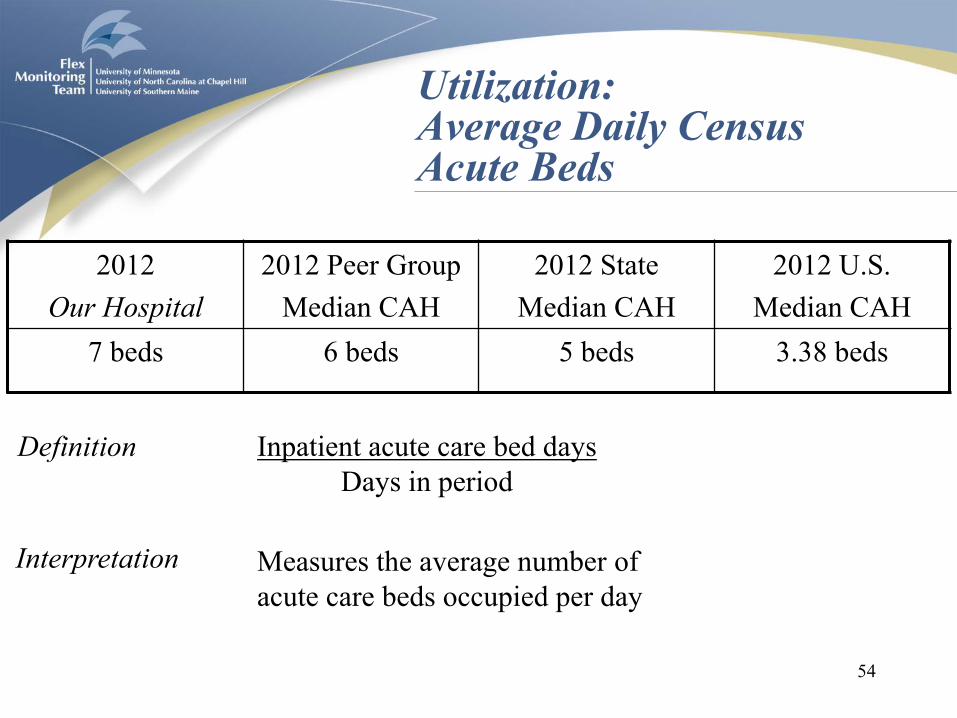
Utilization: Average Daily Census Acute Beds
2012
Our Hospital
2012 Peer Group
Median CAH
2012 State
Median CAH
2012 U.S.
Median CAH
7 beds 6 beds 5 beds 3.38 beds
54
Inpatient acute care bed days
Days in period
Measures the average number of
acute care beds occupied per day
Definition
Interpretation

Report Limitations
• Changing medians due to changing number of
hospitals per year (although equilibrium is near)
• Timeliness of data (although recent numbers can
be produced using the Calculator from our
website)
• Explanations for differential performance are
not identified
• CAH mission, service mix and operating
environment are not considered
55
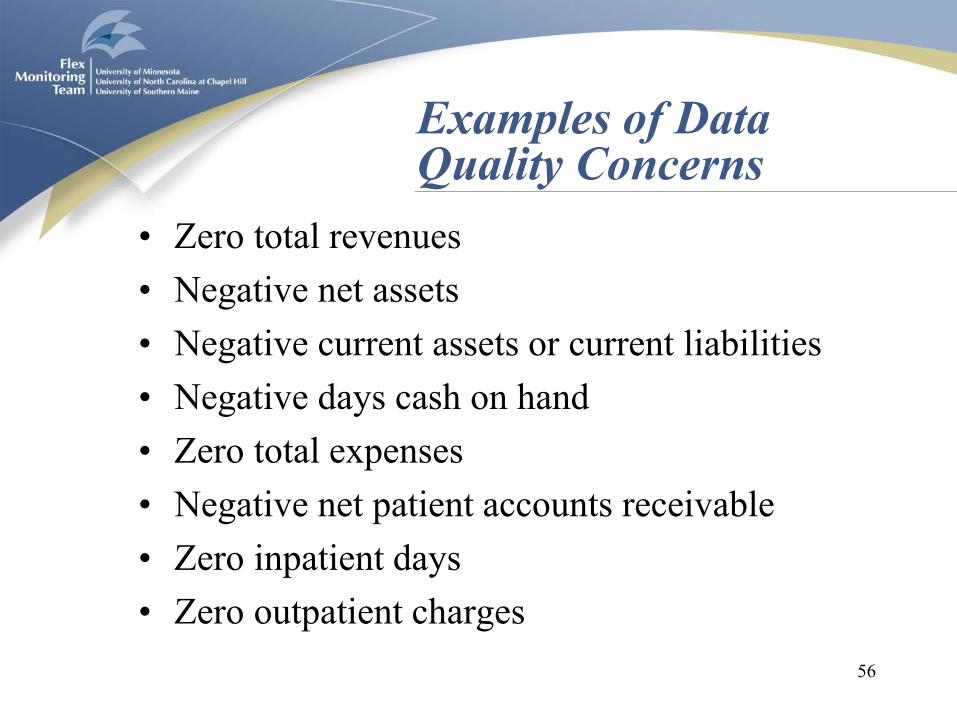
Examples of Data Quality Concerns
• Zero total revenues
• Negative net assets
• Negative current assets or current liabilities
• Negative days cash on hand
• Zero total expenses
• Negative net patient accounts receivable
• Zero inpatient days
• Zero outpatient charges
56

Conclusion
• Higher indicator values are not always good. Most indicators have a middle range of “good” values and extremes are “bad” values
• Each CAH has some indicators that look “good” and some that look “bad” relative to other CAHs, which may make overall financial position difficult to determine
• For this reason, significant judgment is required when analyzing financial and operating performance
57

Conclusion
• Investigate indicator values that are:
– Far above or below peer group, state, and U.S.
medians
– Trending in the wrong direction
– Highly erratic (data quality?)
• Understand the indicators as a group of measures
58

59
5. How hospitals can use the
CAH Financial Indicators Report:
An example

Their Hospital
• Let’s look at indicator values for Their Hospital
• What do you think about the financial
performance and condition of Their Hospital?
60
- Profitability
- Liquidity
- Capital structure

Profitability Indicators
61
Year 1 Year 2 Year 3
Total margin Their Hospital 3.9% -4.6% 0.6%
Peer Group Median CAH 5.5% 5.6% 5.0%
State Median CAH 5.6% 5.7% 5.1%
U.S. Median CAH 3.6% 3.6% 3.0%
Cash flow
margin
Their Hospital 10.0% 2.7% 7.8%
Benchmark 5% 5% 5%
Peer Group Median CAH 9.2% 9.3% 8.7%
State Median CAH 10.3% 10.4% 9.8%
U.S. Median CAH 6.0% 6.0% 5.0%
Return on
equity
Their Hospital 8.0% -10.2% 1.5%
Peer Group Median CAH 11.5% 11.6% 11.0%
State Median CAH 10.2% 10.3% 9.7%
U.S. Median CAH 7.9% 8.0% 7.4%
Operating
margin
Their Hospital 1.3% 0.9% 0.4%
Peer Group Median CAH 2.0% 2.0% 1.4%
State Median CAH 1.4% 1.0% 0.5%
U.S. Median CAH 1.2% 0.8% 0.2%

Profitability – Indicator Findings
• Profitability declined and then increased. Could be
an extraordinary one-time expense.
• Better than cash flow margin benchmark in most
recent year
• Worse than peer group and state
• Negative total margin but positive cash flow margin
can occur because cash flow margin includes
depreciation and interest expense in numerator
• Conclusion: profitability is a concern.
62
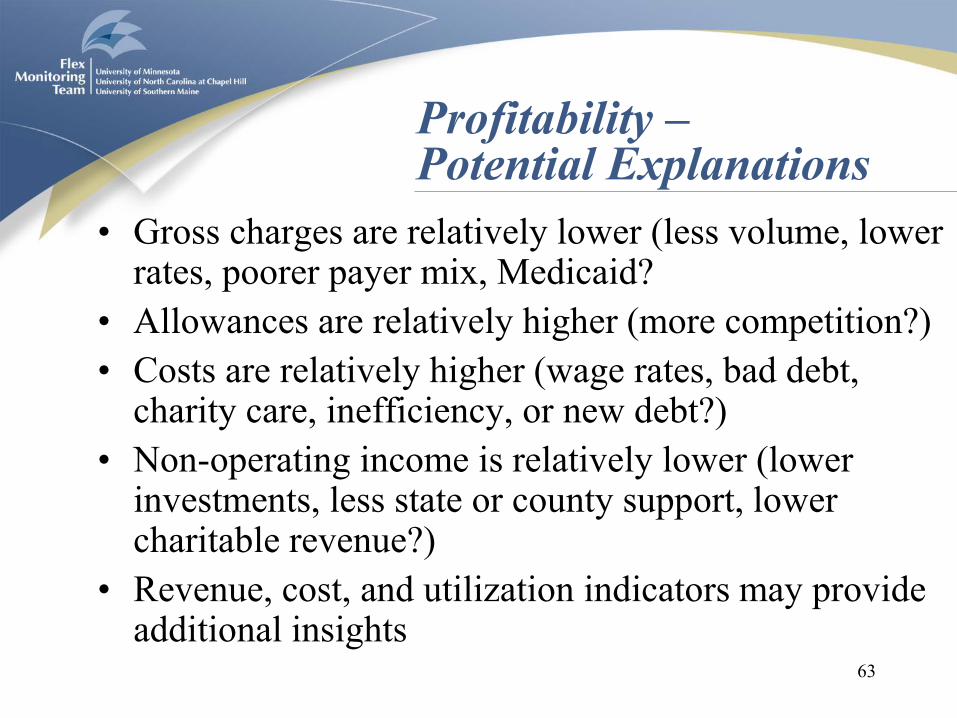
Profitability – Potential Explanations
• Gross charges are relatively lower (less volume, lower rates, poorer payer mix, Medicaid?
• Allowances are relatively higher (more competition?)
• Costs are relatively higher (wage rates, bad debt, charity care, inefficiency, or new debt?)
• Non-operating income is relatively lower (lower investments, less state or county support, lower charitable revenue?)
• Revenue, cost, and utilization indicators may provide additional insights
63

Profitability – Hospital Actions
– Increase revenues (better data capture, fewer
referrals, fewer denials, new services, new
markets, more physicians?)
– Control expenses (wage rates, staffing patterns,
group purchasing, 340B, equipment
management, information technology?)
– Improve negotiation policy with third party payers
– Increase investment returns
– Reduce charity care and bad debt
64
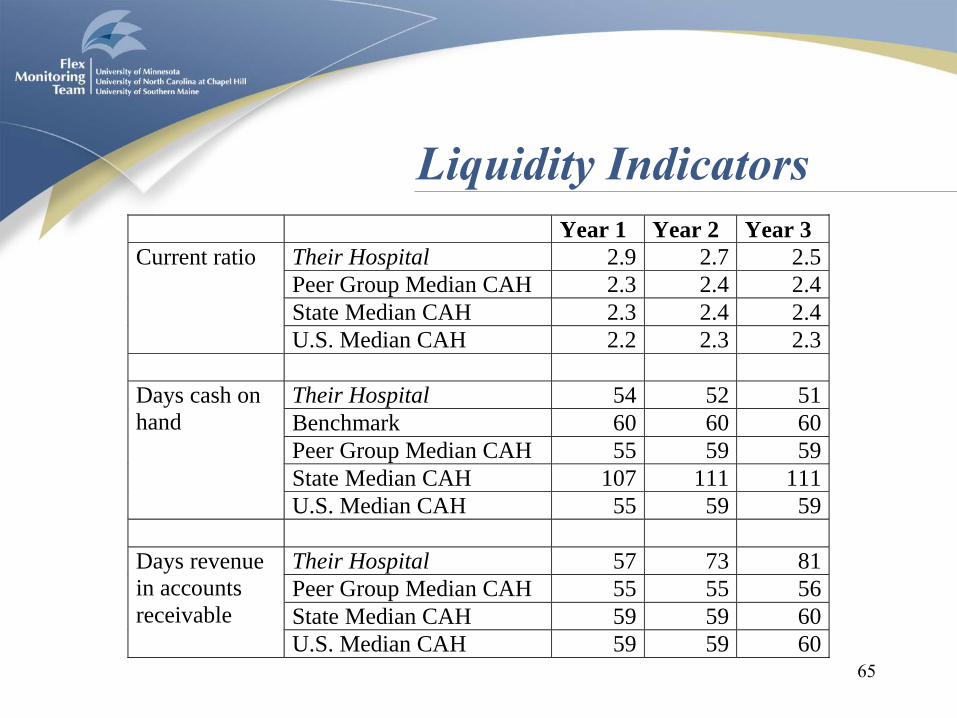
Liquidity Indicators
65
Year 1 Year 2 Year 3
Current ratio Their Hospital 2.9 2.7 2.5
Peer Group Median CAH 2.3 2.4 2.4
State Median CAH 2.3 2.4 2.4
U.S. Median CAH 2.2 2.3 2.3
Days cash on
hand
Their Hospital 54 52 51
Benchmark 60 60 60
Peer Group Median CAH 55 59 59
State Median CAH 107 111 111
U.S. Median CAH 55 59 59
Days revenue
in accounts
receivable
Their Hospital 57 73 81
Peer Group Median CAH 55 55 56
State Median CAH 59 59 60
U.S. Median CAH 59 59 60

Liquidity – Indicator Findings
• Conflicting results.
• Current ratio declined over the past three years, but still better than industry. Days cash on hand declined but worse than industry
• Days revenue in accounts receivable increasing and worse than industry. If credit policy has not changed, third party payers are taking longer to pay
66

Liquidity – Potential Explanations
• Current ratio and days cash on hand – assets are relatively lower (greater draw on cash or
smaller inventory?)
– Current liabilities are relatively higher (longer payment periods or new debt?)
– Operating costs are relatively higher (inefficiency or new debt?)
• Days revenue in accounts receivable – Change in payer mix, increasing length of stay, clerical
staffing problems, a nursing strike, change in Medicaid policies, higher denial rate, etc.
• Revenue, cost, and utilization indicators may provide additional insights
67

Liquidity – Hospital Actions
– Identify reasons for the decline in cash and
improve cash management strategies
– Improve payables management to maintain
good relations with suppliers
– Implement changes to the revenue cycle for
faster collection, lower collection expenses and
fewer denials
68
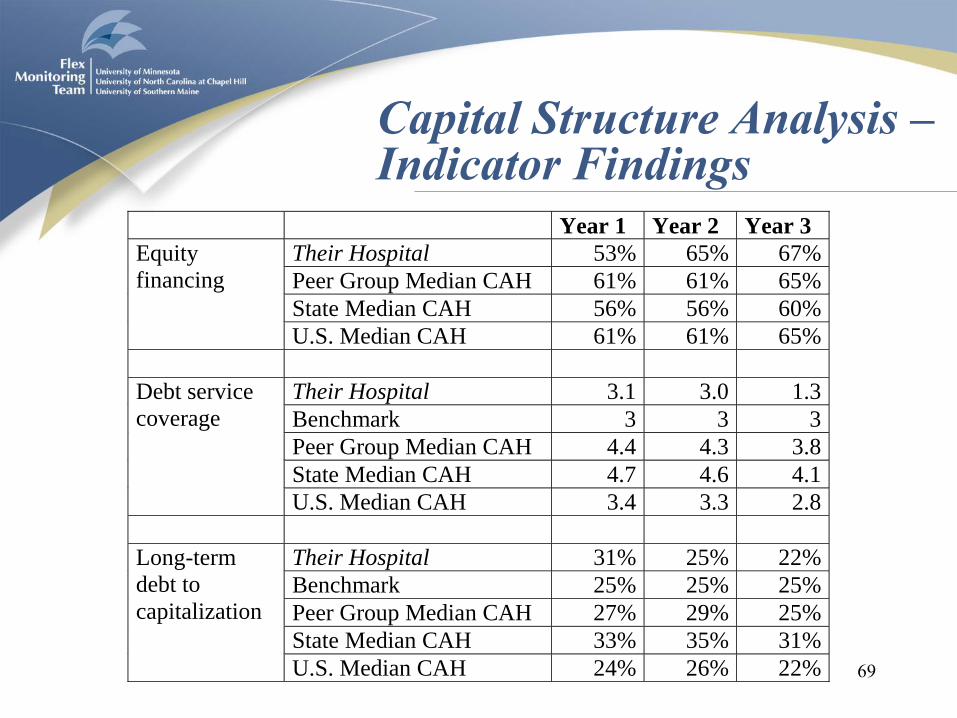
Capital Structure Analysis – Indicator Findings
69
Year 1 Year 2 Year 3
Equity
financing
Their Hospital 53% 65% 67%
Peer Group Median CAH 61% 61% 65%
State Median CAH 56% 56% 60%
U.S. Median CAH 61% 61% 65%
Debt service
coverage
Their Hospital 3.1 3.0 1.3
Benchmark 3 3 3
Peer Group Median CAH 4.4 4.3 3.8
State Median CAH 4.7 4.6 4.1
U.S. Median CAH 3.4 3.3 2.8
Long-term
debt to
capitalization
Their Hospital 31% 25% 22%
Benchmark 25% 25% 25%
Peer Group Median CAH 27% 29% 25%
State Median CAH 33% 35% 31%
U.S. Median CAH 24% 26% 22%
• Conflicting results.
• Equity financing increased over the past three
years and better than industry.
• Long-term debt to capitalization declined and
better than industry.
• Debt service coverage declined and worse than
industry
70
Capital Structure – Indicator Findings
• Hospital may have retired debt in year 3
• Large principal repayments temporarily reduce
debt service coverage
• Revenue, cost, and utilization indicators may
provide additional insights
71
Capital Structure – Potential Explanations
Capital Structure – Hospital Actions
– Assess ability to carry additional long-term
debt and other types of capital
– Investigate sources of capital available to
CAHs
72

Implications
• Higher indicator values are not always good. Most indicators have a middle range of “good” values and extremes are “bad” values
• Each CAH has some indicators that look “good” and some that look “bad” relative to other CAHs, which may make overall financial position difficult to determine
73

Rules of Thumb
• Compare relative financial performance of a CAH:
– First to benchmark (for 5 indicators)
– Second to peer group median
– Third to state median
– Fourth to U.S. median
• Assign greater weight to recent indicator values
74
Rules of Thumb
• Investigate indicator values that are:
– Far above or below peer group, state, and U.S.
medians
– Trending in the wrong direction
– Highly erratic (data quality?)
• Understand the indicators as a group of measures
75

Conclusion
• “Firms that have high profits, lots of cash,
little debt, and new plants have great financial
strength. Firms with losses, little cash, lots of
debt, and old physical facilities will not be in
business long.” (Cleverley and Cameron)
76

77
6. Benchmark Report

Benchmark Report: Purpose
• Benchmarks identify good financial performance and provide specific targets for improvement.
• The intent of the benchmarks is to provide a relevant and useful basis to assess the financial performance and condition of CAHs.
• Medians change over time but benchmarks provide a constant basis on which to judge financial performance and condition.
78

Benchmark Report: Development
• Established by survey of informed practitioners
versus academic black box or arbitrary rankings
• Based on a large sample of practitioners
• Results showed strong support for benchmarks
being “about right”
• Peer group, state and national performance
against benchmarks also reported
79

Benchmark Report: Interpretation
• There is year-to-year variation in indicator values.
• Capital projects, medical staff changes, and other
circumstances may affect your hospital’s value.
• Errors or other data quality problems may be
present in the Medicare Cost Report submitted by
your hospital.
• Few hospitals perform better than benchmark on
all twelve indicators.
80

81
Benchmark Report: Sample Report

82
Total margin Met all 4 benchmarks, but half of CAHs in peer
group and 2/3 in the same state also met
benchmarks. Cash flow margin
Return on equity
Operating margin
Current ratio Met 2 benchmarks but well short of days revenue in
A/R benchmark. Most CAHs in peer group and
same state also failed to meet benchmark. Perhaps
a need for revenue cycle analysis.
Days cash on hand
Days revenue in A/R
Benchmark Report: Profitability & Liquidity

83
Equity financing Met 2 benchmarks but most CAHs in peer group
and same state also met benchmarks. No value
for debt service coverage because the CAH has
no debt (LT debt to capitalization = 0).
Debt service coverage
LT debt to capitalization
Medicare O/P cost to
charge
Well short of Medicare O/P cost to charge
benchmark. Most CAHs in same state also failed
to meet benchmark. Perhaps costs are too high,
charges are too low, or both. Average age of plant
Benchmark Report: Capital Structure & Other

84
7. Market Report

Market Report: Purpose
• Provides CAHs with basic market information
necessary for:
– assessment of market position,
– identification of Medicare beneficiaries
bypassing the hospital, and
– strategic and operational planning.
• Through understanding their markets, CAHs can
identify opportunities to allocate resources and
to improve hospital financial and operational
performance. 85
Market Report: Development
• Where did Medicare beneficiaries who reside in my
market go for inpatient care?
– The number of Medicare discharges for each residence
ZIP code - hospital dyad was created from the Market
Service Area files.
– Dyads with a distance of more than 150 miles between
the residence and the hospital were eliminated
– Residence ZIPs were aggregated in descending order of
number of discharges to the hospital until 75% of the
hospital discharges was achieved.
86

Market Report: Development
• What are the socio-demographic characteristics of
people who reside in my market compared to the
average CAH market in my peer groups?
– Data from Neilsen Site Reports is weighted by the
population in each ZIP code to produce an array of
sociodemographic measures of the population in the
market area of the CAH.
87
Market Report: Interpretation
88
• There is year-to-year variation in Medicare admissions.
• Capital projects, medical staff changes, and other
circumstances may affect Medicare admissions.
• Errors or other data quality problems may be present in
the Market Service Area files.
• Market is defined by Medicare inpatient admissions
only.
89
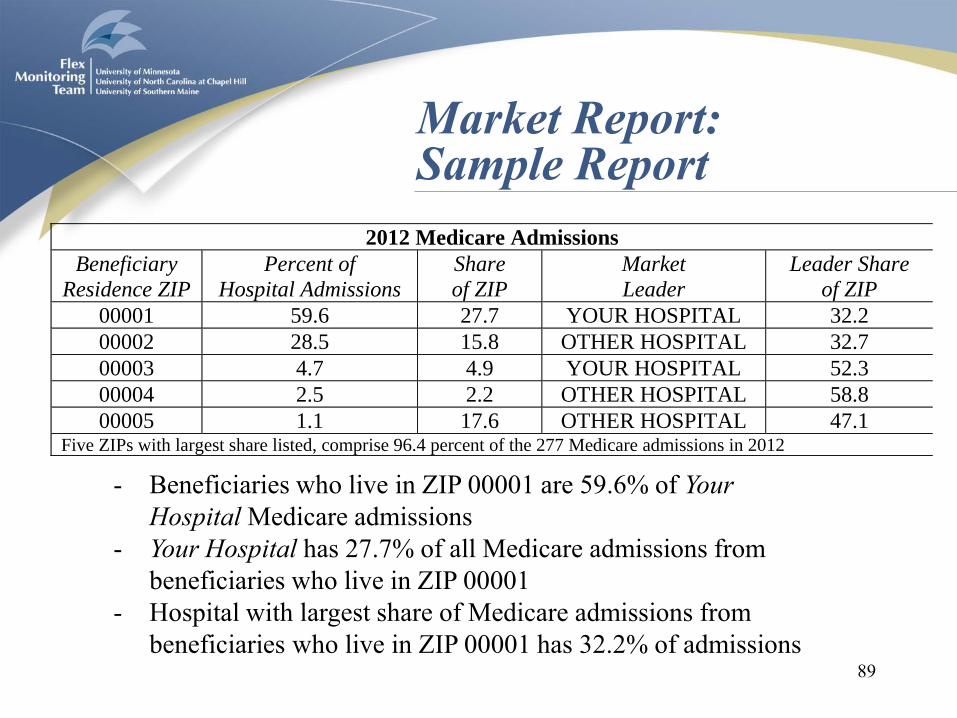
Market Report: Sample Report
2012 Medicare Admissions
Beneficiary
Residence ZIP
Percent of
Hospital Admissions
Share
of ZIP
Market
Leader
Leader Share
of ZIP
00001 59.6 27.7 YOUR HOSPITAL 32.2
00002 28.5 15.8 OTHER HOSPITAL 32.7
00003 4.7 4.9 YOUR HOSPITAL 52.3
00004 2.5 2.2 OTHER HOSPITAL 58.8
00005 1.1 17.6 OTHER HOSPITAL 47.1 Five ZIPs with largest share listed, comprise 96.4 percent of the 277 Medicare admissions in 2012
- Beneficiaries who live in ZIP 00001 are 59.6% of Your
Hospital Medicare admissions
- Your Hospital has 27.7% of all Medicare admissions from
beneficiaries who live in ZIP 00001
- Hospital with largest share of Medicare admissions from
beneficiaries who live in ZIP 00001 has 32.2% of admissions

90
Market Report: Sample Report
2012 Market Characteristics
Variable Your Hospital Peer Group
Percent Elderly 19.5 18.4
Percent Unemployed 9.1 8.4
Per Capita Income (dollars) 19,558 21,161
Percent in Poverty 14.8 10.7
Population in Market 24,888 25,989
Population per Square Mile 33.7 47.4
Average Distance to Hospital (miles) 14.5 11.2
Compared to its peer group, Your Hospital has a market that has:
- A higher percent of elderly and unemployed
- Lower per capita income and higher percent in poverty
- Smaller total population, fewer population per square mile, and
greater average distance to the hospital

91
8. Medicare Outpatient Report

Medicare Outpatient Report: Purpose
• CAHs are primarily outpatient facilities – on
average, 70% of CAH revenue is for outpatients
• Medicare beneficiaries represent 36% of total
outpatient revenue, on average
• The purpose of this report is to provide CAHs
with management information about their
Medicare outpatient business
92
Medicare Outpatient Report: Development
• All outpatient services, including those provided
in an emergency department setting, provided to
Medicare beneficiaries by a CAH are included
• Outpatient claims are grouped by primary
diagnosis using the Clinical Classifications
Software (CCS) for ICD-9-CM
• The top 20 primary diagnoses ranked by the
number of claims are included in the report.
93
Medicare Outpatient Report: Interpretation
94
• Average charges and provider payment per
claim provide hospitals with information about
their pricing and contractual allowances /
discounts for outpatient services.
• Average charges and provider payment per
patient per year provide hospitals with
information that may be helpful to CAHs
considering participation in an accountable
care organization (ACO) or bundled payment.

95
Medicare Outpatient Report: Sample Report
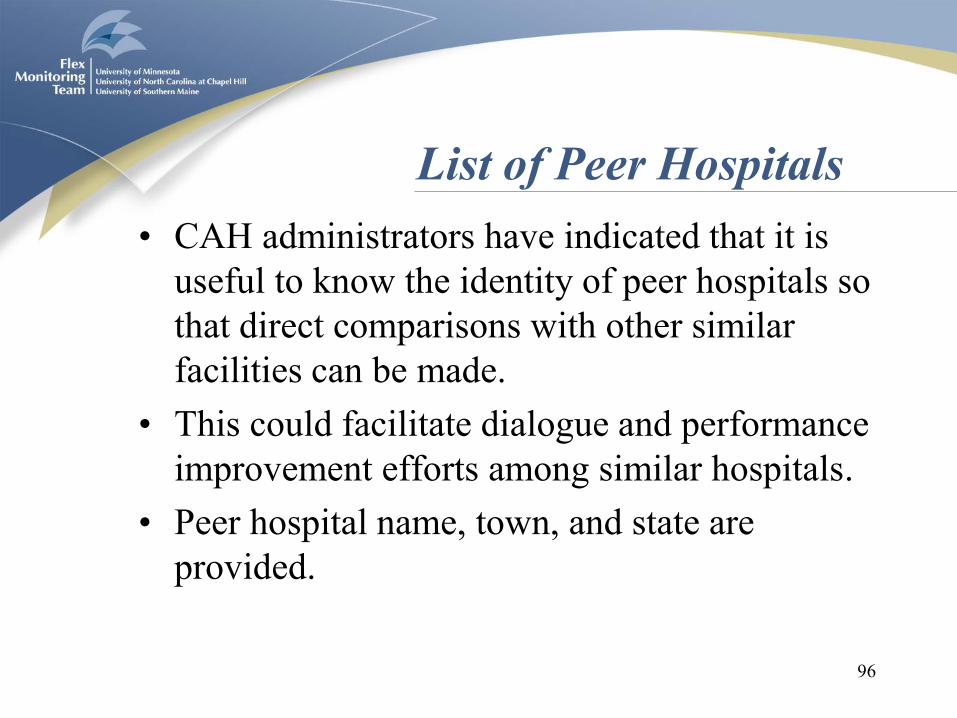
List of Peer Hospitals
• CAH administrators have indicated that it is
useful to know the identity of peer hospitals so
that direct comparisons with other similar
facilities can be made.
• This could facilitate dialogue and performance
improvement efforts among similar hospitals.
• Peer hospital name, town, and state are
provided.
96
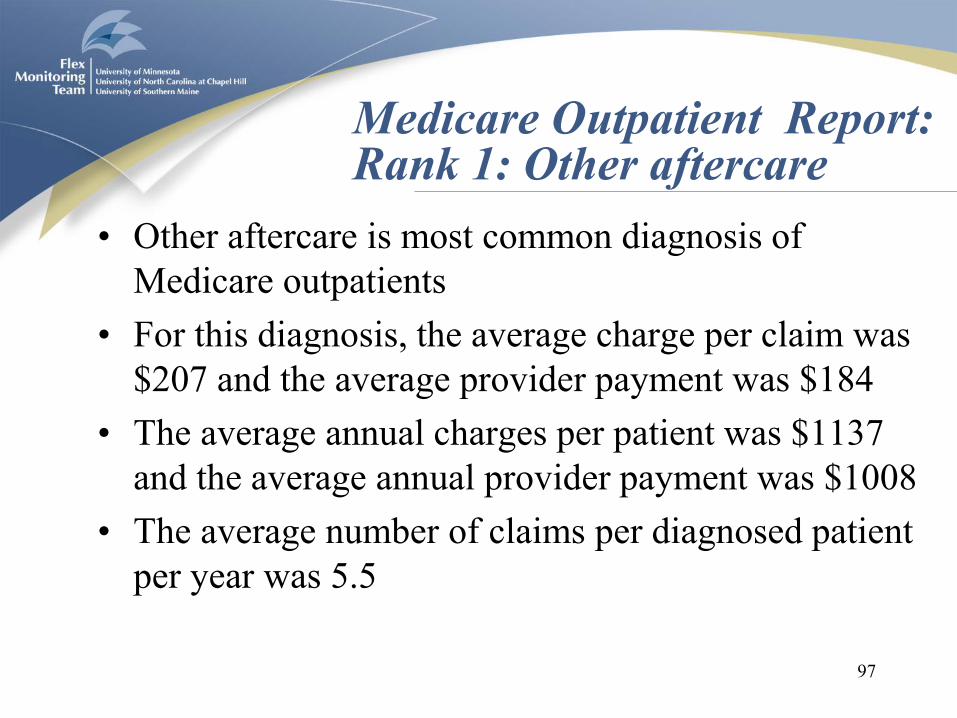
• Other aftercare is most common diagnosis of
Medicare outpatients
• For this diagnosis, the average charge per claim was
$207 and the average provider payment was $184
• The average annual charges per patient was $1137
and the average annual provider payment was $1008
• The average number of claims per diagnosed patient
per year was 5.5
97
Medicare Outpatient Report: Rank 1: Other aftercare
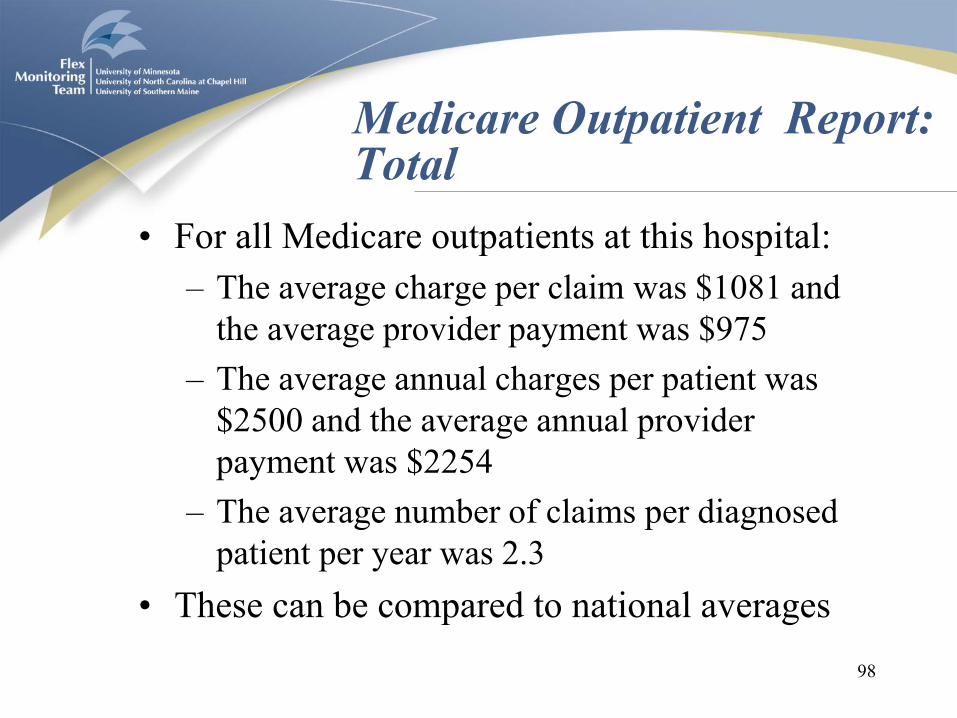
• For all Medicare outpatients at this hospital:
– The average charge per claim was $1081 and
the average provider payment was $975
– The average annual charges per patient was
$2500 and the average annual provider
payment was $2254
– The average number of claims per diagnosed
patient per year was 2.3
• These can be compared to national averages
98
Medicare Outpatient Report: Total


