2010

Introduction
The Statistical Digest provides a range of statistics and performance measures related to school education in Samoa. The information included in the digest is the latest information that is available as of May 2010. Historical data has also been included to reflect changes over time. The Digest is divided into two parts:
• Part 1 – Data from School Census Information System
• Part 2 – Data from sources other than the School Census Information System
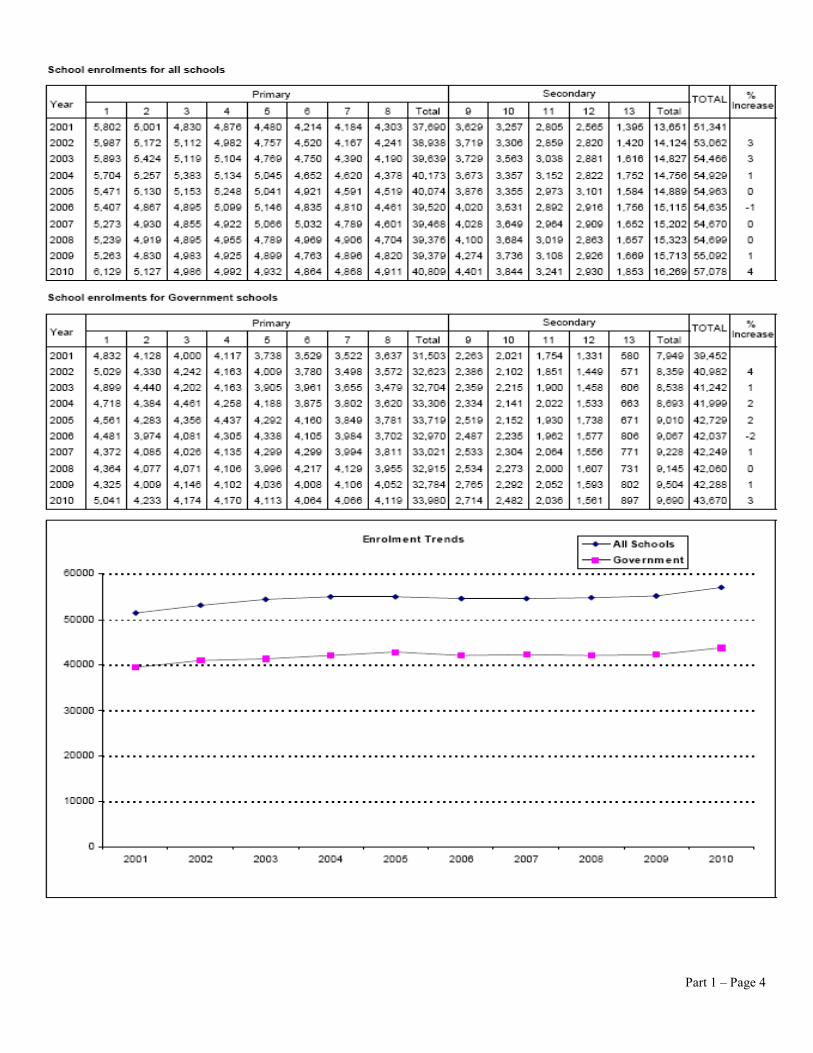
Part 1 Data from School Census Information System The Annual School Census data collection held on 3rd March 2010, is a major source of statistical information. The census data is stored in the Ministry’s school census information system called Manumea. The school census information system includes a series of reports, which can be automatically produced. These reports are contained in Part 1 of the Statistical Digest.
Part 2 Data from sources other than the School Census Information System The Ministry of Education, Sports and Culture’s performance measure framework includes a range of indicators that are not automatically produced from the School Census Information System. Data has been assembled from a range of sources such as examination results and personnel information. This information is contained in Part 2 of the Statistical Digest.
Statistical Digest produced by: Policy, Planning and Research Division Ministry of Education Sports & Culture
Samoa Phone: 21911 Fax: 21917
Email: [email protected]
July 2010

Table of Contents for Part 1 – Data from School Census Information System
Number of schools by school type and district, 20104444444444444444. 1 Size of government schools by district, 20104444444444444444444.. 2 School enrolments by level, gender and status, 2010444444444444444... 3 School enrolments for all schools, 2001 – 201044444444444444444..... 4 School enrolment for government schools, 2001 – 201044444444444444.. 4 Percentage enrolments in government schools, 2001 – 2010444444...................... 5 Male school enrolments, all schools, 2001 – 20104444444444444..444.. 6 Percentage male enrolments, all schools, 2001 – 2010444444444444..44.. 6 School enrolments by district and maximum level provided, 201044444444..44 7 Number of repeaters by level in 201044444444444444444444..44 8 Repeaters in all schools by level, 2001 – 20104444444444444444..44 8 Percentage of repeaters in all schools by level, 2001 – 2010444444444444.. 9 Transition rates by year level, 2001 – 2010444.44444444444444.44410 Drop out rates (percentage) by year level, 1995 – 2010444444444444444. 11 Number of teachers by school type and district, 201044444444444..4444.. 12 Student-Teacher ratio by school type and district, 20104444..44444..44444 13 Student-Teacher ratio by level, government schools, 2001 - 2010.444444..4444 14 Number of student absent on Census day (3
rd March 2010)444444.444.4.......... 15
Number of government secondary schools teaching curriculum subjects by level..444.. 16 Primary school facilities by Controlling Authority, 20104444444444.44.444 17 Secondary school facilities by Controlling Authority, 201044444444444444..17 Table of Contents for Part 2 – Data from sources other than School Census Information System
Average raw score at National Year 8 Examinations4444444444444444.. 1 Number of students sitting Year 8 Examinations444444444444444444. 1 Percentage of Year 8 students that sat the Year 8 Examinations44444444.44... 1 Average raw score at National Year 12 Examinations4444444444444444 2 Number of students sitting National Year 12 Examinations4444444444444... 2 Primary students identified as at Risk, Year 4, All Schools (Government and Non-Government)44444444444444444444444..3 Primary students identified as at Risk, Year 6, Government Schools444444444.. 4 National Age Participation Rates4444444444444444444444444 5 No. of Government schools that are meeting the national standards for primary student-teacher ratio of 1 teacher to 30 students (1:30)..4444444444444...... 6 No. of Government schools that are meeting the national standards for secondary student-teacher ratio of 1 teacher to 20 students (1:20)444444444444444. 6 Apparent Retention Rate for all schools4444444444444444444.4...... 7 Students commencing first year of tertiary studies44444444444444444.. 7 Transition Rate from Year 13 to identified tertiary education4444444444444. 7

Definitions
Apparent Retention Rate compares the number of students in a given year with the size of the cohort. For example, the apparent retention rate of Years 9-12 for 2010 is calculated as the number of students in year 12 in 2010 divided by the number of students in year 9 in 2007.
Completion Rates the percentage of students sitting the national exams is a measure of completion rates, e.g. percentage of students sitting year 8 exam is a measure of how many students starting year 8 actually complete year 8.
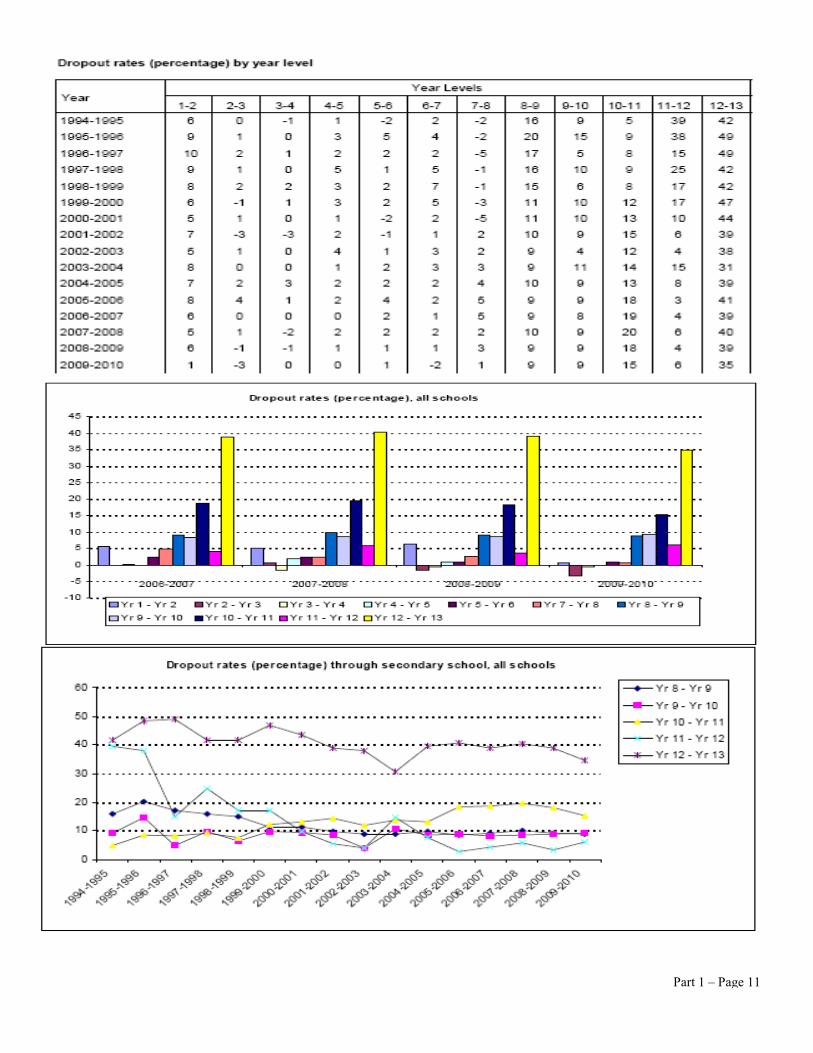
Drop-out Rate The percentage of students who neither progressed from one level to the next or repeat the level.
Pri-Sec (Primary-Secondary) A school that provides both primary and secondary
levels, e.g. Paul V1 College has Year 7 & 8 levels. It should be noted that Robert Louis Stevenson School is counted as two schools because of their physical locations.
SPELL Test A test taken by all year 4 and year 6 students in
Government schools. Most Non-Government schools also participate, but it is not compulsory. It provides an indication of the students whose learning outcomes are identified as being at risk so that they receive attention from teachers in their reading and numeracy programmes.
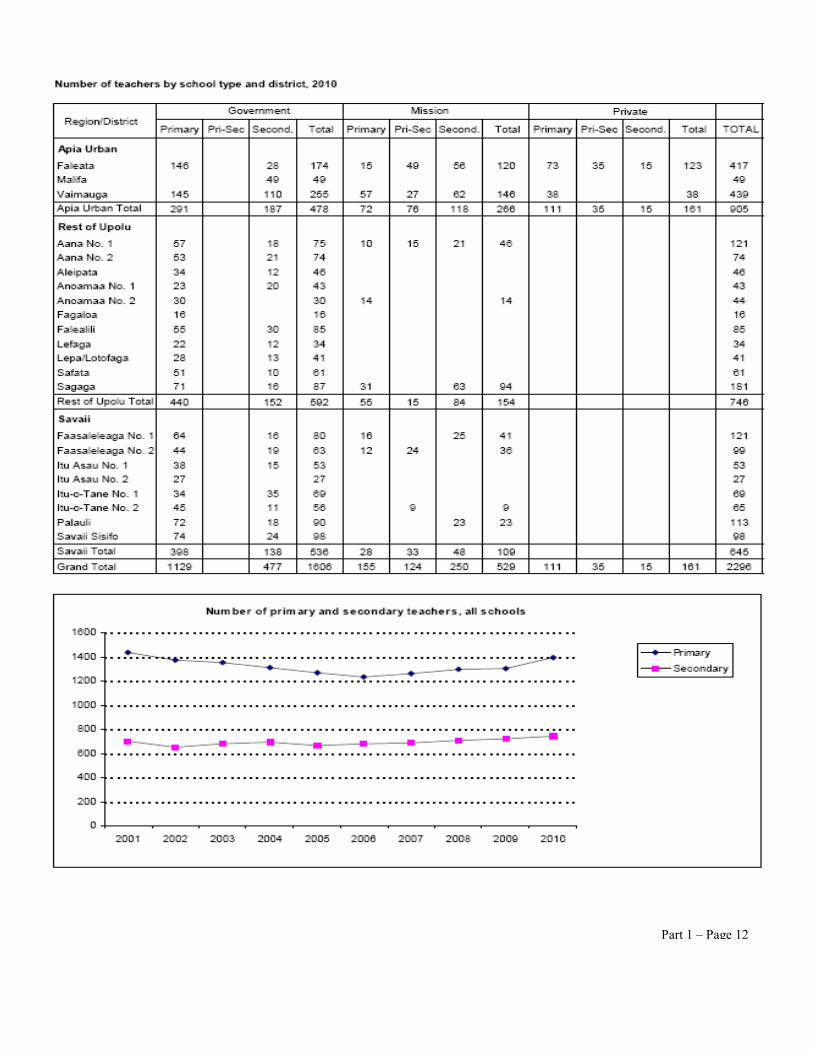
Student Teacher Ratio is calculated as the number of students at a school
divided by the total number of teachers (including Principals) at the school. Data is from Annual School Census.
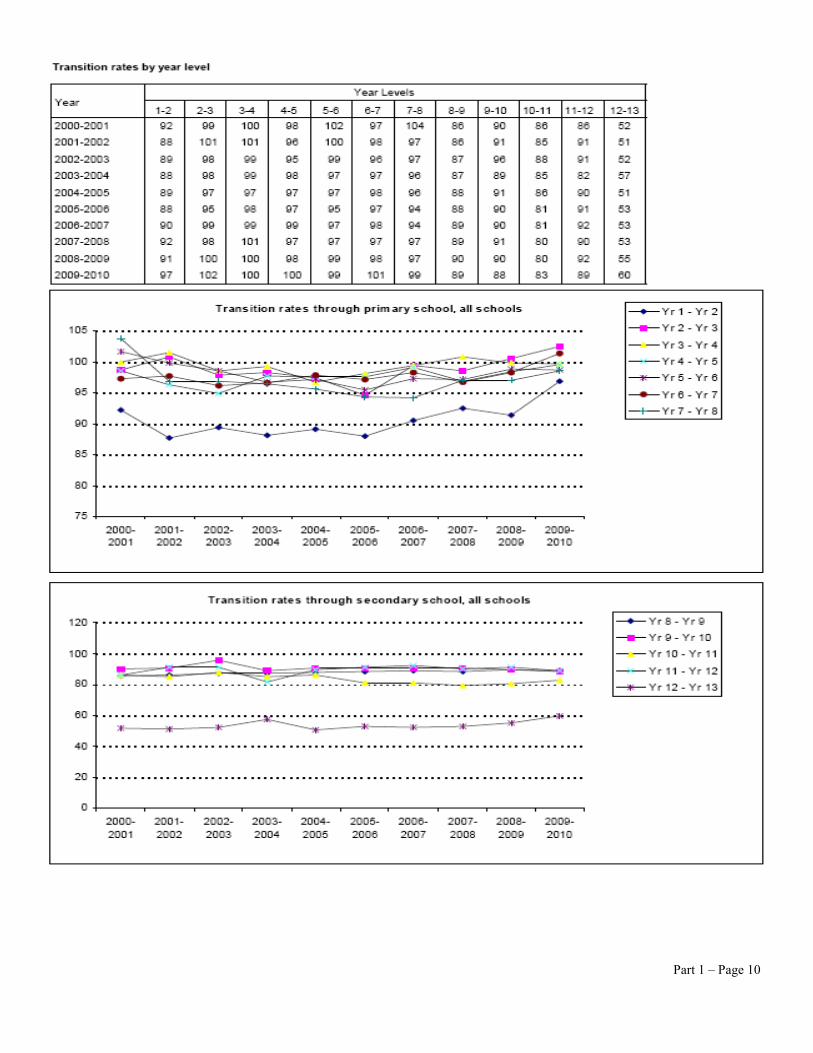
Transitional Rate is the percentage of students who complete one level
and move on to the immediate level. For example, the transitional rate into Post-Secondary studies is the number of students who commenced post-secondary education in 2010 (Institute of Higher Education, Institute of Technology) as a percentage of the students who were in Year 13 in 2009.
Part 1 – Data from School Census
Produced using Manumea, the School Census Information System

Part 1 – Page 1

Part 1 – Page 2

Part 1 – Page 3
Part 1 – Page 4

Part 1 – Page 5
Part 1 – Page 6

Part 1 – Page 7

Part 1 – Page 8

Part 1 – Page 9
Part 1 – Page 10
Part 1 – Page 11
Part 1 – Page 12

Part 1 – Page 13

Part 1 – Page 14
Part 1 – Page 15

Part 1 – Page 16

Part 1 – Page 17

Part 2 – Data from Sources other than School Census Information System

1Average raw score at National Yr. 8 Examinations All (Government and Non Government) for Core Subjects
Year 8 National Examination Subject Raw Mean Scores
0
10
20
30
40
50
60
English Samoan Mathematics Basic Science Social Science
2003 2004 2005 2006 2007 2008 2009
Number of Students sitting Yr. 8 National Examinations
Percentage of Yr.8 Students
2 that sat the Yr.8 National Examination
All Students (Government and Non-Government)
Percentage of Year 8 Students sat the Year 8 Exam
86
87
88
89
90
91
92
93
94
95
English Samoan M athematics Basic Science Social Science
2003 2004 2005 2006 2007 2008 2009
1 Data at this stage is not available disaggregated by gender, location etc. (This is required to calculate performance
measures 1.2, 1.4 of the Performance Framework) 2 The percentage of year 8 students sitting year 8 exams is a measure of year 8 completion rate.
Part 2 – Page 1

Average Raw Score at National Year 12 Examinations All (Government and Non Government) for Core Subjects
3
Number of Students
4 sitting National Year12 Examination
All (Government and Non Government)
3 Data at this stage is not available disaggregated by gender, location (1.2, 1.4 of the Performance Framework). 4 Total number of students who sat any one of the year 12 exams. Note that no subjects are compulsory at year 12,
however most students undertake English, Samoan and Mathematics. However, individual schools may have a policy of some subjects being compulsory.
Part 2 – Page 2
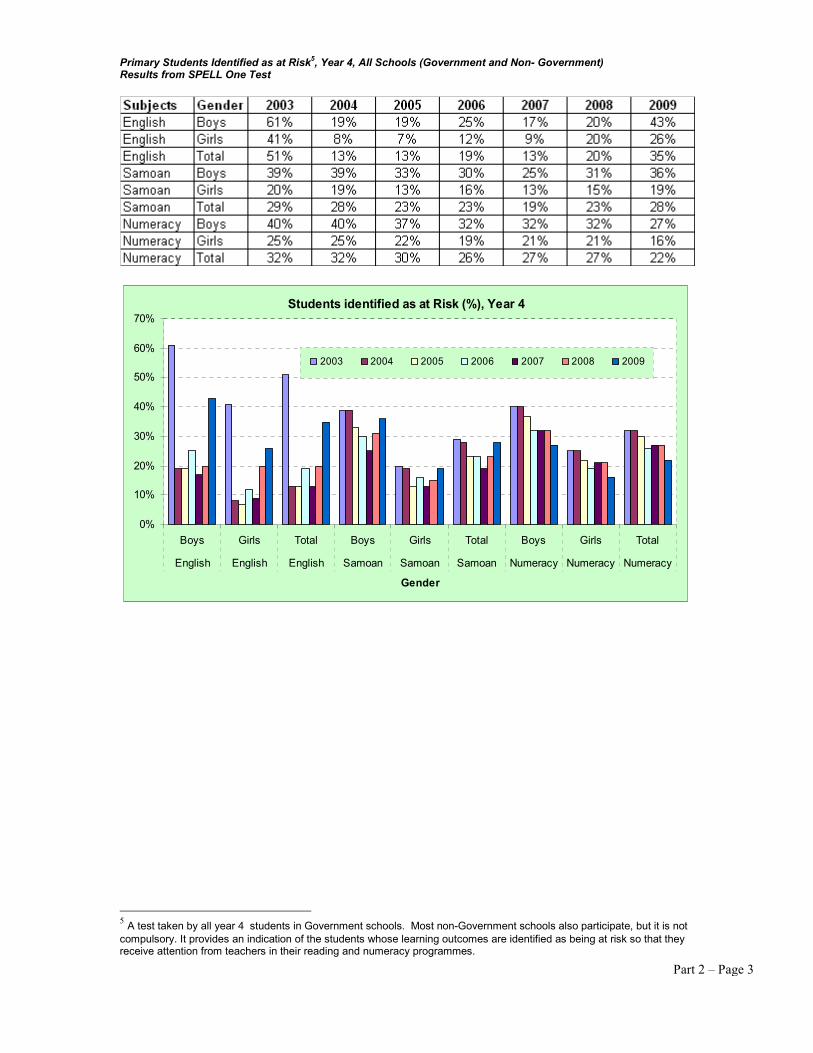
Primary Students Identified as at Risk5, Year 4, All Schools (Government and Non- Government)
Results from SPELL One Test
Students identified as at Risk (%), Year 4
0%
10%
20%
30%
40%
50%
60%
70%
Boys Girls Total Boys Girls Total Boys Girls Total
English English English Samoan Samoan Samoan Numeracy Numeracy Numeracy
Gender
2003 2004 2005 2006 2007 2008 2009
5 A test taken by all year 4 students in Government schools. Most non-Government schools also participate, but it is not
compulsory. It provides an indication of the students whose learning outcomes are identified as being at risk so that they receive attention from teachers in their reading and numeracy programmes.
Part 2 – Page 3
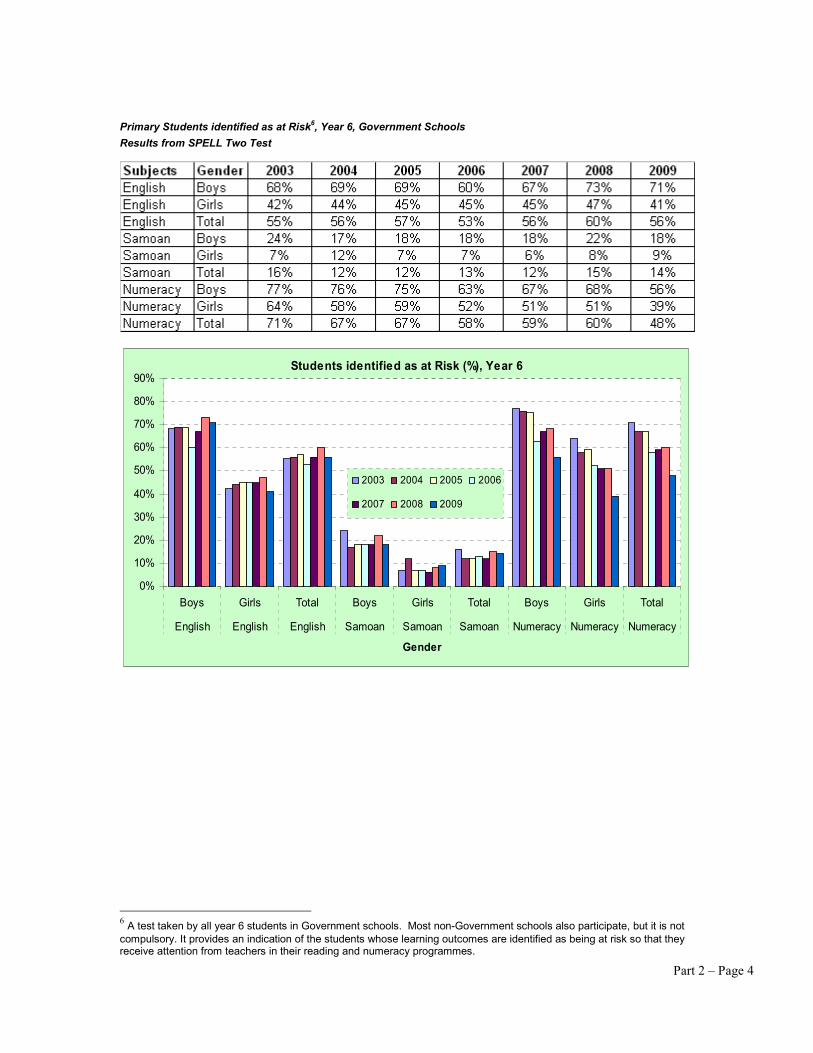
Primary Students identified as at Risk6, Year 6, Government Schools
Results from SPELL Two Test
Students identified as at Risk (%), Year 6
0%
10%
20%
30%
40%
50%
60%
70%
80%
90%
Boys Girls Total Boys Girls Total Boys Girls Total
English English English Samoan Samoan Samoan Numeracy Numeracy Numeracy
Gender
2003 2004 2005 2006
2007 2008 2009
6 A test taken by all year 6 students in Government schools. Most non-Government schools also participate, but it is not
compulsory. It provides an indication of the students whose learning outcomes are identified as being at risk so that they receive attention from teachers in their reading and numeracy programmes.
Part 2 – Page 4

�ational Participation Rate
Source: Population estimates were provided by the Statistical Services Division of the Ministry of Finance and UNESCO
Part 2 – Page
Part 2 – Page 5

Number of Government Schools that are meeting the National Standards for Primary Students – Teacher Ratio of 1 Teacher to 30 Students (1:30)
Number of Government Schools that are meeting the National Standards for Secondary Students – Teacher Ratio of 1 Teacher to 20 Students (1:20)
Part 2 – Page 6
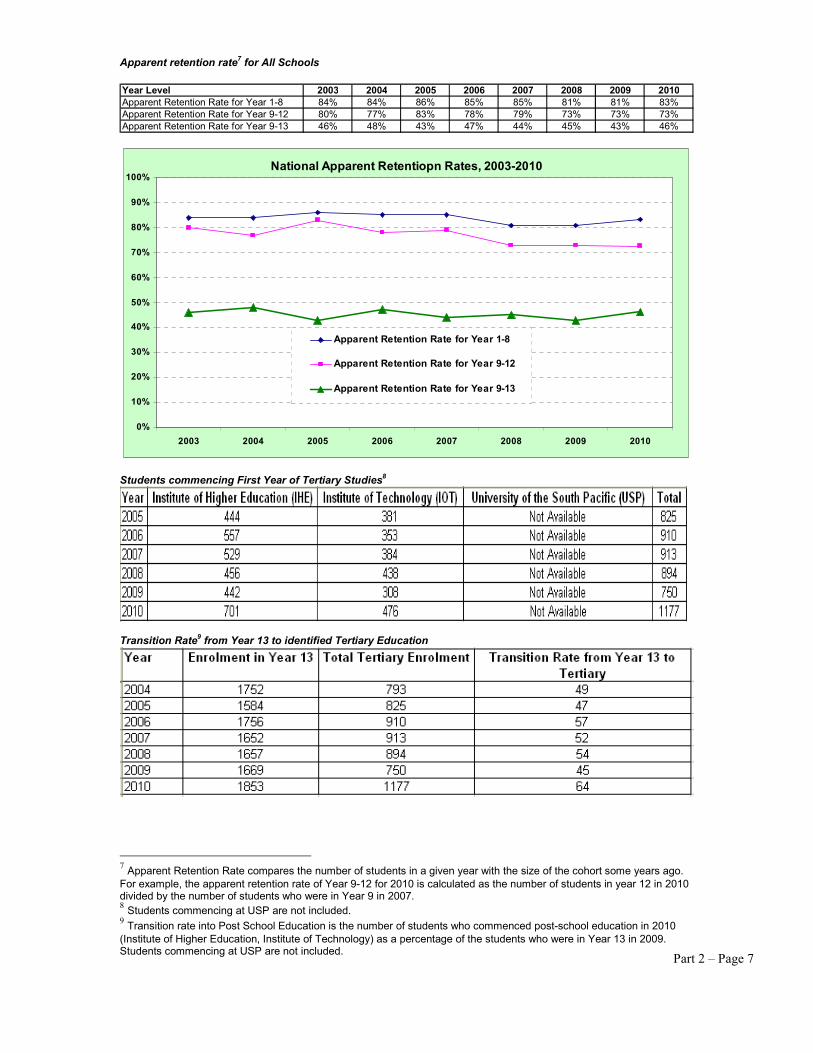
Apparent retention rate7 for All Schools
Year Level 2003 2004 2005 2006 2007 2008 2009 2010
Apparent Retention Rate for Year 1-8 84% 84% 86% 85% 85% 81% 81% 83%
Apparent Retention Rate for Year 9-12 80% 77% 83% 78% 79% 73% 73% 73%
Apparent Retention Rate for Year 9-13 46% 48% 43% 47% 44% 45% 43% 46%
National Apparent Retentiopn Rates, 2003-2010
0%
10%
20%
30%
40%
50%
60%
70%
80%
90%
100%
2003 2004 2005 2006 2007 2008 2009 2010
Apparent Retention Rate for Year 1-8
Apparent Retention Rate for Year 9-12
Apparent Retention Rate for Year 9-13
Students commencing First Year of Tertiary Studies8
Transition Rate
9 from Year 13 to identified Tertiary Education
7 Apparent Retention Rate compares the number of students in a given year with the size of the cohort some years ago.
For example, the apparent retention rate of Year 9-12 for 2010 is calculated as the number of students in year 12 in 2010 divided by the number of students who were in Year 9 in 2007. 8 Students commencing at USP are not included. 9 Transition rate into Post School Education is the number of students who commenced post-school education in 2010
(Institute of Higher Education, Institute of Technology) as a percentage of the students who were in Year 13 in 2009. Students commencing at USP are not included.
Part 2 – Page 7