
FEDERAL SOCIAL MEDIA USAGE AND CITIZEN SATISFACTION UPDATE
FORESEE ACSI E-GOVERNMENTSATISFACTION INDEX(Q3) 2011
October 25, 2011
Commentary and Analysis By: Larry Freed, President and CEO, ForeSee
Research By: Rhonda Berg, Kamaria Campbell and Kathy Totz
© 2011 ForeSee
FORESEE ACSI E-GOVERNMENT SATISFACTION INDEX (Q3) 2011 2
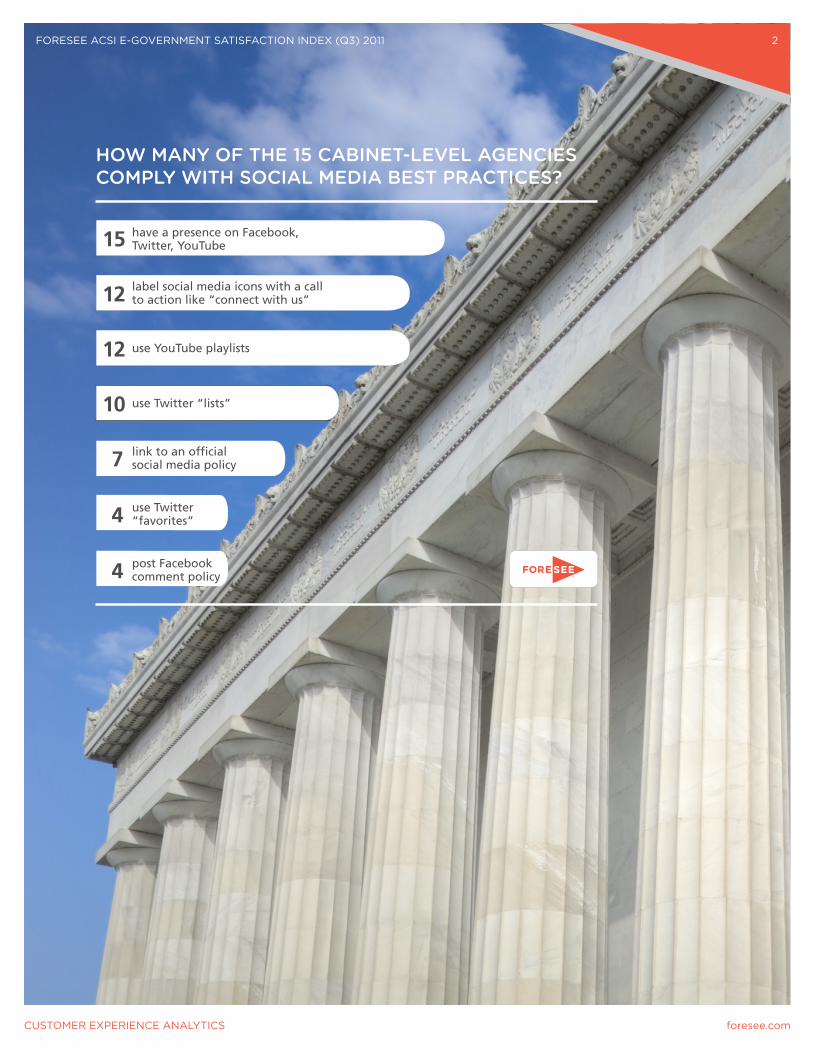
HOW MANY OF THE 15 CABINET-LEVEL AGENCIES COMPLY WITH SOCIAL MEDIA BEST PRACTICES?
12 label social media icons with a call to action like “connect with us”
15 have a presence on Facebook, Twitter, YouTube
12 use YouTube playlists
10 use Twitter “lists”
7 link to an official social media policy
4 use Twitter “favorites”
4 post Facebook comment policy
FORESEE ACSI E-GOVERNMENT SATISFACTION INDEX (Q3) 2011 3
EXECUTIVE SUMMARY
This quarter’s report on the ACSI E-Government Satisfaction Index has three parts:
> Part 1 (page 3): A special report on social media in the e-government world including an audit of
what the 15 executive-level departments are doing and best practices for agencies and departments of
all sizes and levels of government.
> Part 2 (page 14): A quarterly update on citizen satisfaction with e-government at the aggregate level,
including individual satisfaction scores for the 100 federal government sites participating in the Index.
> Part 3 (page 21): A quarterly update on how citizens rate the transparency of 36 federal sites
participating in the Online Transparency Index.
PART ONE: THE STATE OF SOCIAL MEDIA IN THE FEDERAL GOVERNMENT
Social media continues its exponential growth as people find new ways to connect with each other
online, on mobile phones, and on tablets. The private sector has led the way in social media
innovation, but the public sector has also embraced it as a critical channel with which to
communicate with constituents. Citizen participation in government was one of the key goals of
President Obama’s Open Government Initiative, and social media provides an excellent, informal
way for citizens and their government to share back and forth.
ForeSee conducts research and analysis on social media platforms and marketing campaigns for organizations
in both the public and private sector. It is possible to measure and analyze citizen satisfaction with an agency’s
Facebook or Twitter presence; it’s also possible to analyze the quality of traffic that social media sites drive
to the website in order to determine where further investments should be made. Usability analysts at
ForeSee have also spent the past few months looking at how 15 of the cabinet-level executive departments
(see chart on previous page) are using social media to connect with citizens and how they are promoting their
involvement in social media on their main departmental websites.

FORESEE ACSI E-GOVERNMENT SATISFACTION INDEX (Q3) 2011 4
In order to develop best practices that can be used across all government sites, regardless of size, ForeSee
conducted an expert usability review of the 15 executive department websites in order to:
> Gauge how many participate in social media and how they do so;
> Uncover any trends in how they promote social media interaction from their main department
home pages;
> Examine their profiles on social platforms to see how they are making use of them.
Several clear themes and best practices emerged from the research that should serve as useful guidance for
federal, state, and local government websites.
SOCIAL MEDIA PARTICIPATION
All 15 executive departments are participating in the three most popular social platforms (Facebook,
Twitter, and YouTube). Many are using other new media and communication tools, as well, and often group
all subscription, new media and social media links together in one place. For example, links to Flickr, email
newsletters or alerts, blogs, RSS feeds, podcasts, videos, webcasts, widgets, and mobile platforms often
appear with Facebook, Twitter, and YouTube links, all in the same area of the website. These links provide
citizens with easy access to useful and often cost-effective interactive resources located in a convenient
central starting point.
Best Practice: Group the same set of social media links and/or links to new media and communication tools
together on every page of the site. Presenting these links together consistently will help visitors identify them
more easily as alternate ways to interact with the agency or department (11 of 15 agencies do this).

FORESEE ACSI E-GOVERNMENT SATISFACTION INDEX (Q3) 2011 5
LABELING AND MESSAGING
All executive agencies except for the Department of Energy have links to social media platforms on their
websites with icons (for example, the blue and white, square “f” for Facebook). Some sites also provide a
supplementary text label to clarify which platform is identified by the icon. All but three departments
(Homeland Security, Treasury, and Interior) label their social media
links with a call to action like Stay Connected or Connect with Us.
Best Practices:
> Use conventional icons for common social platform is critical so visitors can easily recognize them
(14 of 15 agencies do this).
> Label social media links with a clear call to action such as (Stay Connected, Connect with Us, etc.)
helps visitors understand that clicking on these links is a way to interact with the organization
(12 of 15 agencies do this).
LINK APPEARANCE AND BEHAVIOR
Approximately one-half of the sites provide some sort of disclaimer indicating visitors will be visiting a site
outside of the domain of the department when
they click on a social media icon or widget. In
addition, only one-third of e-government websites
open social media sites in a new browser window
when visitors click on these links; the others simply redirect the user to the social platform in the same tab,
ending the experience with the federal website itself.
FORESEE ACSI E-GOVERNMENT SATISFACTION INDEX (Q3) 2011 6
Best Practices:
> Organizations with an official privacy policy or policy governing their use of social media should
provide a disclaimer letting visitors know they are moving offsite once they click on a social network
link; alternatively, links to these policies can appear on the organization’s profile page on the social
network (8 agencies do this).
> Opening social media sites in a new browser window ensures visitors maintain access to the main
organization website while browsing content on social networks. This also eliminates their need to use
the back button to return to the organization’s website (5 agencies do this).
AGGREGATE SOCIAL MEDIA PAGE
Almost half of the 15 departments have more than one presence on a single social media platform.
These presences might reflect specific campaigns, related officials, or serve as information sources for
special segments such as job seekers or those interested in a specific topic addressed by that department.
As a result, many have created an aggregate social media page listing all of their presences or accounts on
each platform. The presentation style of these pages varies; some merely list all of the associated accounts,
while others include the conventional platform icon as well as a description of the information provided
through each presence.
Another common departmental use for these pages is to let visitors know why and how they are using social
media and set expectations around visitor privacy or appropriate interaction on these platforms.
Best Practices:
> Organizations that have a number of presences on one or more social platforms should create an ag-
gregate social media page that lists all of the options with which citizens can interact with them via
social media (9 agencies do this).

FORESEE ACSI E-GOVERNMENT SATISFACTION INDEX (Q3) 2011 7
> A link to this page should be
available in the global navigation
(the highest-level, persistent
navigation available on every
page, usually at the top or on
the left) and/or linked with social
media links on each page of
the department’s site (4 agencies
do this).
> Aggregate social media pages
should list the name of each
profile or presence, the
conventional icon for the
platform, and provide a brief
description of the type of
information visitors can expect from
the source (2 agencies do this).
> Organizations with social media policies should link to these policies from the aggregate
social media page, in order to ensure transparency while providing opportunities for participation
(7 agencies do this).

FORESEE ACSI E-GOVERNMENT SATISFACTION INDEX (Q3) 2011 8
SOCIAL NETWORK BOOKMARKING FUNCTIONALITY, PLUGINS, WIDGETS, AND INTEGRATED SOCIAL MEDIA CONTENT
For the most part, social network bookmarking functionality, social plugins, and widgets have yet to
penetrate these department sites. One-third of the 15 executive department sites provide some form of social
network bookmarking functionality which allows visitors to easily share content from the site with their own
social networks. In addition, one-third of the studied websites are using some form of platform-provided
social plugin, widget, or have otherwise integrated social media content such as Tweets or Facebook posts
into their website.
Best Practices:
> It may not make sense for every organization to provide social networking bookmarking functionality
or other plugins and widgets; however, those who choose to use these tools should make sure they
reflect the social networks that are the most popular with their visitors. For example, if visitors to the
site are mostly on Facebook and not Twitter, it is best to provide functionality reflecting your work on
that platform (6 agencies do this).
> There are many widgets and buttons that claim to work “out of the box”. Reading all provided
documentation and configuring both the functionality and format of messages to meet the needs of
your organization is key to implementing these tools effectively (3 agencies do this).

FORESEE ACSI E-GOVERNMENT SATISFACTION INDEX (Q3) 2011 9
TWITTER PROFILES
All 15 departments have customized their Twitter profiles. This might include changing the color of the
standard Twitter background or adding images and text to the background. Only one profile lacks the Verified
Account trustmark provided by Twitter to let visitors know that they are legitimate accounts belonging to the
entity they claim to represent. Two-thirds of the profiles use the word “official” in their Bio and about half
use some form of their official name or acronym in their handle to make them easier to identify. Interestingly,
while creating Twitter lists is fairly common, with about two-thirds of departments with profiles participating,
only four have Favorited a Tweet which shows that a lot more can be done with federal Twitter presences.
Best Practices:
> Organizations should use their official logos and customize their profiles to reflect the departmental
color scheme, where applicable (all 15 agencies do this).
> Organizations and official personnel should seek a Verified Account trustmark so visitors can be certain
that these Twitter accounts are legitimate (14 of 15 agencies do this).
> Using the “Bio” field in Twitter to describe the organization’s mission or goals in using the platform
can also help to reassure visitors that accounts are legitimate (all 15 agencies do this).
> Organizations should use “Twitter Lists” to create a collection of all related agencies or entities.
This step helps visitors to identify other accounts of interest (10 agencies do this).
> Using the “Favorites” feature to highlight content can help visitors connect with popular or important
content. It can also serve as a repository of commonly-accessed information, such as tweets with links
to news or other regular pieces published by the organization (4 agencies do this).

FORESEE ACSI E-GOVERNMENT SATISFACTION INDEX (Q3) 2011 10
YOUTUBE PROFILES
All 15 departments have presences on YouTube and have customized their YouTube Channels through the
use of a departmental color scheme and/or custom images displayed in the background. All but three of the
departments have used the standard Playlists feature on YouTube to organize videos thematically. Channel
names range from acronyms to formal names and derivations of formal names.
Best Practices:
> Organizations should use their official logos and customize their profiles to reflect the appropriate
color scheme whenever possible (all 15 agencies do this).
> Using playlists to organize videos thematically will help visitors to locate content of interest more easily.
For example, all videos of the same type of content such as official speeches or press briefings can be
grouped together so that visitors seeking this content do not have to search for these videos manually
(12 agencies do this).
> Organizations should use some form of their official department names in their channel names
(all 15 agencies do this).
FACEBOOK PROFILES
All 15 departments have a Facebook presence and are using at least one standard Facebook Application
such as Notes, Discussions, Photos, Links, Events, or Videos. All but four presences have custom pages or
third-party tools such as integrated YouTube or Flickr applications. The custom pages are devoted to topics
such as Comments, Policies, and Welcome Statements, as well as content to which departments want to
draw visitors’ attention. In terms of the naming conventions for this platform, all pages have a vanity URL.
In addition, the official name for each presence reflects the proper name of each department or the elected
official leading the department.

FORESEE ACSI E-GOVERNMENT SATISFACTION INDEX (Q3) 2011 11
Best Practices:
> Organizations should only use applications on their Facebook presences if they will be maintained on
an ongoing basis. Standard applications should be turned off if they do not have content associated
with them in order to avoid frustrating visitors and providing an unsatisfying experience (11 of 15
agencies do this).
> Organizations should use a separate tab on the profile page for comment policies (policies
governing the use, editing, deletion, etc. of comments on federal Facebook pages) if they are too long
to fit within a standard field or are more than two paragraphs in length, so that only those who are
interested in the information need to view it (4 agencies do this).
> Vanity URLs should reflect the official name of each department or the official leading it
(all 15 agencies do this).
KEY TAKEAWAYS
In any industry, we can learn a lot from what the largest players are doing. In the case of
e-government, a thorough audit of the social media practices of the 15 executive departments’
usage of social media provides guidance when combined with best practices learned from
the private sector.

FORESEE ACSI E-GOVERNMENT SATISFACTION INDEX (Q3) 2011 12
1. It is critical to understand social media preferences among site visitors. Visitors to one agency’s
site may prefer to interact with that agency on Facebook and appreciate extensive Flickr albums;
visitors to another site may not. Not every agency needs a strong presence on every social media
channel. Government agencies should also take pains to evaluate how successful their social media
activities are by two measures: 1) how satisfied citizens are with social media content and options and
2) how much social media is influencing citizen behaviors (i.e. is it driving them to the website,
making them more likely to comment on a rulemaking or write their congressperson, making them
more or less likely to visit a regional office, etc.)
2. Next, agencies should create an inventory of all of their presences on each platform. This will
help all website stakeholders to understand which platforms need to be promoted on the website and
determine what opportunities exist (if any) to integrate content from these platforms into the site.
3. Once a complete listing of all presences has been created, agencies should include a link to
each platform in which they participate on each page of the site. This is critical as visitors can
arrive at site pages from many sources. While some will travel linearly through the homepage, others
will find site pages through search engines, links on other sites, or links within emails and social media
messages. In addition, organizations with multiple accounts on one or more social networks should
also create an aggregate social media page and link to it through the global navigation and/or
alongside social media links.
4. Next, agencies should consider providing social network bookmarking functionality so
visitors can easily share site content with their social networks. This practice includes providing
widgets such as the Facebook “Like” and the Twitter “Tweet This.” New widgets are released all the
time, so it is best to monitor which sites are most often used by website visitors in order to provide
sharing options that cater to the most popular social platforms.
FORESEE ACSI E-GOVERNMENT SATISFACTION INDEX (Q3) 2011 13
5. Agencies should also evaluate their profile pages on each platform to ensure each page
looks credible to visitors. For example, the official logo of the organization should be used on all
platforms and the official name should be used for all user names or handles. In addition, the correct
use of profile fields and functionalities can bolster the credibility of government profile pages. For
example, all platforms have standard fields such as an “About” field that can be used to state the
organization’s mission. In terms of functionalities, Facebook applications that are not being used
should be turned off so that visitors know there is no content in these areas. On Twitter, organizations
can group related entities in lists so followers can see all official personnel or officials affiliated with
them. These are just a few examples of how platforms can be modified to meet the needs of the
government. Reading platform documentation to learn more about profile fields and functionalities is
critical to ensuring social media work is done correctly.

FORESEE ACSI E-GOVERNMENT SATISFACTION INDEX (Q3) 2011 14
PART TWO: SATISFACTION WITH E-GOVERNMENT REMAINS STRONG
The ACSI E-Government Satisfaction Index is one of the most
comprehensive and representative reflections of the citizen experience
with federal government websites and serves a critical checkpoint for
evaluating the success of government’s online initiatives. More than
270,000 surveys were collected for the Index in the third quarter of
2011 alone, and ForeSee has collected more than 880,000 citizen
surveys about experiences on federal websites so far this year. Citizens
are willing and able to provide feedback to government websites,
and many agencies and departments are using that feedback and the
methodology of the American Customer Satisfaction Index to deter-
mine which site improvements will have the greatest impact on usage,
recommendations, and channel loyalty.
Citizen satisfaction, at 75 or higher since late 2009 (with only one
exception in the second quarter of 2010, when satisfaction fell briefly
to 74.7), shows no sign of waning and maintains an aggregate score of
75.5 in the third quarter of 2011.
Federal websites that are successfully meeting their users’ needs should
be proud of their achievements, while simultaneously looking for new
ways to improve. Unlike the corporate sector, government agencies
need to maintain the highest online standards not because their bottom
line is at stake (though there are definite cost-savings associated with
having a website with high satisfaction scores), but also because they
have an obligation and a responsibility to the citizenry.
E-Government Satisfaction
Aggregate Scores Satisfaction
Q3 2011 75.5
Q2 2011 75.5
Q1 2011 75.0
Q4 2010 75.0
Q3 2010 75.3
Q2 2010 74.7
Q1 2010 75.1
Q4 2009 75.2
Q3 2009 75.2
Q2 2009 73.6
Q1 2009 73.6
Q4 2008 74.1
Q3 2008 73.9
Q2 2008 72.9
Q1 2008 72.4
Q4 2007 72.9
Q3 2007 73.3
Q2 2007 73.7
Q1 2007 73.4
Q4 2006 73.9
Q3 2006 73.7
Q2 2006 74.0
Q1 2006 73.5
Q4 2005 73.9
Q3 2005 73.5
Q2 2005 72.6
Q1 2005 71.9
Q4 2004 72.1
Q3 2004 71.2
Q2 2004 70.3
Q1 2004 70.9
Q4 2003 69.1
Q3 2003 70.9

FORESEE ACSI E-GOVERNMENT SATISFACTION INDEX (Q3) 2011 15
INDIVIDUAL AGENCY/DEPARTMENT/PROGRAM SATISFACTION SCORES
Q3 ACSI E-Government Satisfaction Index: Scores by Category
E-Commerce/Transaction Federal Websites
Dept. Website Satisfaction: Q3, 2011
SSA SSA iClaim -- socialsecurity.gov/applyonline 90
SSA SSA Retirement Estimator -- ssa.gov/estimator 90
SSA Help with Medicare Prescription Drug Plan Costs -- socialsecurity.gov/i1020 89
SSA Social Security Business Services Online -- ssa.gov/bso/bsowelcome.htm 84
SSA Social Security Internet Disability Report -- ssa.gov/applyfordisability 83
PBGC MyPBA -- https://egov.pbgc.gov/mypba 83
Treasury Online Catalog -- catalog.usmint.gov 82
HHS SAMHSA Store -- store.samhsa.gov 81
PBGC MyPAA -- https://egov.pbgc.gov/mypaa 76
USDA Recreation One-Stop -- recreation.gov 75
GSA GSA Auctions -- gsaauctions.gov 71
GSA Official Site to Buy U.S. Government Property -- govsales.gov 71
GSA General Services Administration GSAXcess -- gsaxcess.gov 63
Treasury TreasuryDirect -- treasurydirect.gov 63
Information/News Federal Websites
Dept. Website Satisfaction: Q3, 2011
HHS National Women’s Health Information Center (NWHIC) main website -- 4woman.gov 89
DHS U.S. Citizenship and Immigration Services Resource Center -- uscis.gov/portal/site/uscis/citizenship 87
HHS MedlinePlus en español -- medlineplus.gov/esp 87
HHS MedlinePlus -- medlineplus.gov 86
DHS Federal Emergency Management Agency Ready Campaign -- ready.gov 85
HHS HHS Healthy People -- healthypeople.gov 84
HHS National Cancer Institute Site en Español -- cancer.gov/espanol 83
HHS AHRQ Health Care Innovations Exchange -- innovations.ahrq.gov 82
DOJ NIJ main website -- ojp.gov/nij 82
DOC National Geodetic Society, National Oceanic and Atmospheric Administration website -- ngs.noaa.gov 82
DOD DoD Navy -- navy.mil 82
DOC National Ocean Service website -- oceanservice.noaa.gov 81
HHS NIDDK -- www2.niddk.nih.gov 81

FORESEE ACSI E-GOVERNMENT SATISFACTION INDEX (Q3) 2011 16
Information/News Federal Websites (continued)
Dept. Website Satisfaction: Q3, 2011
FTC FTC OnGuardOnline -- onguardonline.gov 80
HHS Girls Health -- girlshealth.gov 80
DHS U.S. Citizenship and Immigration Services -- uscis.gov/e-verify 80
HHS National Institute of Child Health and Human Development -- nichd.nih.gov 80
DOD Pentagon Channel -- pentagonchannel.mil 80
HHS AHRQ Effective Health Care Program -- effectivehealthcare.ahrq.gov 79
DOD DoD Air Force -- af.mil 79
HHS National Institute of Allergy and Infectious Diseases -- www3.niaid.nih.gov 78
DOS U.S. Department of State Bureau of Educational and Cultural Affairs alumni website -- https://alumni.state.gov 78
DOS Bureau of Consular Affairs -- travel.state.gov 77
HHS Agency for Healthcare Research and Quality -- ahrq.gov 77
DOS Department of State blog website -- blogs.state.gov 76
HHS Health Resources and Services Administration main website -- hrsa.gov 75
DOT Federal Aviation Administration -- faa.gov 75
DOL Bureau of Labor Statistics -- bls.gov 75
DOJ Office of Community Oriented Policing Services -- cops.usdoj.gov 74
NRC U.S. Nuclear Regulatory Commission website -- nrc.gov 74
HHS HHS National Health Information Center -- healthfinder.gov 74
DOD DoD Marine Corps -- marines.mil 74
HHS AHRQ CAHPS -- cahps.ahrq.gov 73
HHS National Library of Medicine Clinical Trials website -- nlm.nih.gov/medlineplus/clinicaltrials.html 73
HHS AHRQ HealthIT -- healthit.ahrq.gov 72
USDA ERS main website -- ers.usda.gov 72
USDA FSIS main website -- fsis.usda.gov 70
USDA FAS main website -- fas.usda.gov 70
FDIC FDIC Applications -- www2.fdic.gov 70
DOC BEA main website -- bea.gov 69
DOT DOT Research and Innovative Technology Administration website -- rita.dot.gov 68
DOD Military Health System main website -- health.mil 67
SSA Social Security Online: Frequently Asked Questions -- ssa-custhelp.ssa.gov 67
DOD TRICARE -- tricare.mil 66
Treasury USTTB website -- ttb.gov 66
DOI U.S. Geological Survey -- usgs.gov 66

FORESEE ACSI E-GOVERNMENT SATISFACTION INDEX (Q3) 2011 17
Information/News Federal Websites (continued)
Dept. Website Satisfaction: Q3, 2011
USDA Forest Service Website -- fs.usda.gov 61
HHS HHS -- grants.gov 59
NARA NARA AAD - Access to Archival Databases -- archives.gov/aad/index.html 57
USDA NRCS website -- nrcs.usda.gov 53
Portal/Department Main Websites
Dept. Website Satisfaction: Q3, 2011
DHS U.S. Citizenship and Immigration Services Español -- uscis.gov/portal/site/uscis-es 85
GSA GobiernoUSA.gov website -- gobiernousa.gov 84
NASA NASA main website -- nasa.gov 83
HHS NIAMS public website -- niams.nih.gov 82
HHS CDC main website -- cdc.gov 82
HHS National Institute of Dental and Craniofacial Research -- nidcr.nih.gov 82
HHS National Cancer Institute main website -- cancer.gov 82
DHS U.S. Citizenship and Immigration Services -- uscis.gov/portal/site/uscis 81
DOI National Park Service main website -- nps.gov 81
DOJ FBI main website -- fbi.gov 80
DOD Department of Defense portal -- defense.gov 78
HHS National Library of Medicine main website -- nlm.nih.gov 77
GAO GAO main public website -- gao.gov 75
FDIC FDIC main website -- fdic.gov 74
DOS Department of State main website -- state.gov 74
NIST National Institute for Standards and Technology main website -- nist.gov 74
GSA GSA main website -- gsa.gov 74
PBGC U.S. PBGC main website -- pbgc.gov 72
NARA NARA main public website -- archives.gov 72
SBA SBA main website -- sba.gov 72
DHS Department of Homeland Security main website -- dhs.gov 71
SSA Social Security Online (main website) -- socialsecurity.gov 71
VA VA Main website -- va.gov and myhealthva.gov 70
GSA USAGov website -- usa.gov 70
HHS SAMHSA website -- samhsa.gov 70
ITC U.S. International Trade Commission main website -- usitc.gov 69
Treasury IRS main website -- irs.gov 69

FORESEE ACSI E-GOVERNMENT SATISFACTION INDEX (Q3) 2011 18
Portal/Department Main Websites (continued)
Dept. Website Satisfaction: Q3, 2011
EPA U.S. Environmental Protection Agency -- epa.gov 68
HHS U.S. Food and Drug Administration main website -- fda.gov 66
DOL Disability -- Disability.gov 64
Treasury Treasury main website -- treasury.gov 62
Recruitment/Career Websites
Dept. Website Satisfaction: Q3, 2011
DOS Recruitment website -- careers.state.gov 81
CIA Recruitment website -- cia.gov/careers 81
DOL Department of Labor Job Listings -- doors.dol.gov 79
OPM Recruitment website -- usajobs.opm.gov 74
OPM OPM Veterans Employment website -- fedshirevets.gov 69
WHY SATISFACTION MATTERS
What good is high satisfaction unless it has a proven impact on citizens’ loyalty and future actions? User
satisfaction, as measured using the ACSI methodology, is proven to have a direct impact on behavior. If
federal government agencies focus on improving their websites’ priority areas, citizen satisfaction with the
sites will also improve. Citizens who are highly satisfied with a federal government website rate their
trust in the agency 59% higher and report being 51% more likely to participate in government by
expressing their thoughts to the agency than citizens who are less satisfied.
Highly satisfied citizens (scores of 80+) report being… Direct Benefit
51% more likely to participate with the government entity in the future.
Citizens are more likely to participate with and express their thoughts to their government, which strengthens the democratic process. (A few sites also measure likelihood to participate with the government entity online. Highly satisfied citizens rate their likelihood to do so 68% higher for these sites).
59% higher ratings of trust in the government entity being measured.
Citizens believe the agency is trustworthy and acting in their best interests, which fosters faith in the democratic process.

FORESEE ACSI E-GOVERNMENT SATISFACTION INDEX (Q3) 2011 19
Satisfaction also increases the likelihood that the citizen will return to the website again (by 51%), use
it as a primary resource (79%) as opposed to utilizing more costly channels, or recommend the site to
others (81%).
Highly satisfied citizens (scores of 80+) report being… Direct Benefit
81%> more likely to use the federal website as a
primary channel for interaction with the government
> more likely to recommend the site to a friend, family member, or colleague.
When citizens use a website to get information or services instead of using an office, call center, or postal mail, it saves the government money on personnel, printed materials, and postage. Estimates indicate that hundreds of millions of dollars could be saved on postage alone.
For these very important reasons, citizen satisfaction is crucial even though it is the means to the
end rather than the end itself. The numbers produced by the ACSI methodology are more than just
satisfaction scores for each of these agencies. They can be used to predict specific future behaviors
of site visitors, and their data can guide them to improvements that will increase these behaviors.
But even if we believe that high citizen satisfaction is important on e-gov websites, how do we increase it?
The federal websites that are using the ACSI to measure citizen satisfaction and guide improvements are
tracking citizen attitudes about a number of website elements. Each site tracks a slightly different list, but
the most common elements across all 100 federal websites are:
> Functionality: The usefulness, convenience, and variety of online features and tools available on
the website.
> Online Transparency: How thoroughly, quickly, and accessibly the website discloses information
about what the agency is doing.
> Search: The relevance, organization, and quality of search results available on the site.
FORESEE ACSI E-GOVERNMENT SATISFACTION INDEX (Q3) 2011 20
> Navigation: The organization of the site and options for navigation.
> Look and Feel: The visual appeal of the site and its consistency throughout the site.
> Content: The accuracy, quality, and freshness of news, information, and content on the website.
> Site Performance: The speed, consistency, and reliability of loading pages on the website.
Without the critical information found only by surveying citizens and scientifically analyzing the results,
federal websites will have a hard time making the sorts of improvements that will enhance their value and
usefulness to citizens in a cost-effective manner.

FORESEE ACSI E-GOVERNMENT SATISFACTION INDEX (Q3) 2011 21
PART THREE: THE FORESEE ONLINE TRANSPARENCY INDEX
The Online Transparency Index serves as a consistent measure of online transparency and quantifies its impact
on citizens’ attitudes and behaviors. The Index has grown into a vital tool for measuring the success, failure,
or progress of government departments and agencies online, providing a clear direction for improvement.
Research has defined the link between online transparency, satisfaction, and trust, giving
government agencies the tools they require to measure their success in meeting the open
government directives, identify where and how to improve citizens’ views of transparency, and drive
citizen satisfaction higher. Improved citizen satisfaction is a key result. It is also a critical component
in judging whether or not a website should be consolidated or eliminated—satisfaction speaks
directly to users’ needs being met.
Not all agencies and departments are currently measuring online
transparency as part of their ForeSee satisfaction models. A total
of 36 sites are reported in the Online Transparency Index as a
component of their participation in this e-government report. The
agencies and departments listed here measure and report this
metric as part of an effort to meet the Obama administration’s
open-government objectives.
The aggregate Q3 2011 online transparency score for the 36
federal sites included is 77.3 on the study’s 100-point scale, which
has increased from last quarter and is the highest aggregate
transparency score measured so far.
Online Transparency Index Over Time
Time Period Online Transparency
Q4 2009 75.4
Q1 2010 76.2
Q2 2010 75.0
Q3 2010 75.8
Q4 2010 76.2
Q1 2011 76.1
Q2 2011 76.7
Q3 2011 77.3

THE FORESEE 2011 E-GOVERNMENT ONLINE TRANSPARENCY INDEX: SCORES OVER TIME
It is important to remember that all agencies on this list have voluntarily submitted their scores.
These results measure only 36 federal websites among thousands, although most of the federal government’s
department sites and many large agency sites are represented. Sites that find themselves at the bottom of
this Index would certainly score higher than many others in a comprehensive index. As such, each of the
listed entities should be commended for their efforts. Looking at these scores over time, we can see that
progress is being made.
The table below provides a breakdown of online transparency scores by website over time.
Dept. Website Q3 2010 Online Transparency
Q3 2011 Online Transparency
Score change Year Over
Year
DHSFederal Emergency Management Agency Ready Campaign -- ready.gov nm 86 n/a
DHSU.S. Citizenship and Immigration Services Español -- uscis.gov/portal/site/uscis-es 85 86 1
HHS CDC main website -- cdc.gov nm 84 n/a
DOJ NIJ main website -- ojp.gov/nij nm 84 n/a
HHS SAMHSA Store -- store.samhsa.gov 80 84 4
DHSU.S. Citizenship and Immigration Services -- uscis.gov/portal/site/uscis 82 83 1
DOCNational Geodetic Society, National Oceanic and Atmospheric Administration website -- ngs.noaa.gov nm 82 n/a
HHSNational Institute of Child Health and Human Development -- nichd.nih.gov nm 81 n/a
DOD Department of Defense Navy -- navy.mil nm 80 n/a
DOS Bureau of Consular Affairs -- http://travel.state.gov 81 80 -1
HHS Agency for Healthcare Research and Quality -- ahrq.gov 78 79 1
DOD Department of Defense Air Force -- af.mil 80 79 -1
DOD Department of Defense portal -- defense.gov 76 79 3
DODPentagon Channel -- pentagonchannel.mil nm 79 n/a
DOS Department of State blog website -- blogs.state.gov 76 78 2
NRC U.S. Nuclear Regulatory Commission website -- nrc.gov 76 78 2
DOD Department of Defense Marine Corps -- marines.mil nm 77 n/a
FORESEE ACSI E-GOVERNMENT SATISFACTION INDEX (Q3) 2011 22

Dept. Website Q3 2010 Online Transparency
Q3 2011 Online Transparency
Score change Year Over
Year
DOJOffice of Community Oriented Policing Services -- cops.usdoj.gov 75 77 2
DOTDOT Research and Innovative Technology Administration website -- rita.dot.gov 73 77 4
GSA GSA main website -- gsa.gov 73 77 4
DOS Department of State main website -- state.gov 75 76 1
DHSDepartment of Homeland Security main website -- dhs.gov 73 75 2
FDIC FDIC main website -- fdic.gov nm 75 n/a
NISTNational Institute for Standards and Technology main website -- nist.gov nm 75 n/a
PBGC U.S. PBGC main website -- pbgc.gov 71 75 4
HHS SAMHSA website -- samhsa.gov 76 75 -1
DOC BEA main website -- bea.gov 75 74 -1
EPA U.S. Environmental Protection Agency -- epa.gov 72 73 1
FDIC FDIC Applications -- www2.fdic.gov nm 73 n/a
Treasury IRS main website --irs.gov nm 73 n/a
DOD Military Health System main website -- health.mil 73 72 -1
USDA FAS main website -- fas.usda.gov 72 72 0
NARANARA main public website -- archives.gov 75 72 -3
DOI U.S. Geological Survey -- usgs.gov 73 72 -1
Treasury USTTB website -- ttb.gov nm 72 n/a
HHSU.S. Food and Drug Administration main website -- fda.gov 72 70 -2
ABOUT THE AUTHOR
As President and CEO of ForeSee, Larry Freed is an expert on customer satisfaction and authors
dozens of research papers and reports on the subject every year. Larry speaks extensively on the
topic at private- and public-sector industry events and has been quoted in numerous publications
and media, including CNN, the Wall Street Journal, the Washington Post, the New York Times,
Investor’s Business Daily, Internet Retailer, Internet Retailing, Multichannel Merchant, DM News,
Computerworld, Federal Computer Week and Government Executive, among many others.
FORESEE ACSI E-GOVERNMENT SATISFACTION INDEX (Q3) 2011 23

ABOUT THE RESEARCH TEAM
Rhonda Berg, Research Manager at ForeSee, leads the research team that produces the quarterly
E-Government Satisfaction Indices and the quarterly E-Government Transparency Indices. She also
serves as an internal consultant regarding statistics, methodology, and survey design. Rhonda has
been a research professional for 20 years in a number of industries and holds advanced degrees in
business and sociology.
Kamaria Campbell, Usability Auditor at ForeSee, conducts expert usability audit reviews of websites
across the public and private sector. She also plays an active role in the team’s ongoing research into
website usability best practices, leading research on emerging trends in the social media space. Kamaria
holds a Bachelor’s degree from Duke University where she majored in Computer Science and History
and a Master’s degree from the University of Michigan’s School of Information with a specialization in
Human-Computer Interaction.
Kathy Totz, Usability Auditor at ForeSee, uses her experience from conducting basic research and academic
training to conduct expert usability audits in industries such as financial services, retail, health care,
technology, telecommunications, and government. Kathy received her Master of Science in Information
degree from the University of Michigan, specializing in Human-Computer Interaction. She also holds a
Bachelor’s degree in Psychology and Cognitive Science from Illinois Wesleyan University.
ABOUT THE ACSI E-GOVERNMENT SATISFACTION INDEX
The ACSI E-Government Satisfaction Index is a special quarterly report of the American Customer Satisfaction
Index (ACSI) in partnership with customer experience analytics firm, ForeSee.
The ACSI, created at the University of Michigan, is the only uniform, national, cross-industry measure of
satisfaction with the quality of goods and services available in the United States, both in the private and
public sectors. In 1999, the federal government selected the ACSI to be a standard metric for measuring
FORESEE ACSI E-GOVERNMENT SATISFACTION INDEX (Q3) 2011 24

citizen satisfaction. More than 100 federal government agencies have used the ACSI to measure citizen
satisfaction with more than 200 services and programs and more than 100 websites. The report on offline
federal government services is released annually in December. The E-Government Index is released quarterly.
ForeSee collects and analyzes the data for the e-government websites included in the report. The ACSI
e-government scores were calculated based on data gathered from voluntary online surveys of randomly
selected site visitors. Each government website was rated by its visitors on various components of overall
satisfaction. The ratings were converted to a score on a 100-point scale using the ACSI methodology.
The ACSI methodology identifies key drivers of online satisfaction (such as navigation, look and feel, search,
site functionality, etc.) and quantifies their relationship to overall citizen satisfaction. This cause-and-effect
methodology demonstrates the impact of website enhancements in these areas on overall customer
satisfaction. In turn, customer satisfaction, as measured by the ACSI, has been proven to predict how citizens
will behave in the future. Improvements to customer satisfaction will make citizens more likely to choose
to interact with an agency online (the more cost-effective channel), return to the site, and recommend it to
others. Monitoring and improving customer satisfaction has a tangible impact on citizen usage of the web
channel and on the bottom line.
ABOUT THE ACSI
The American Customer Satisfaction Index (ACSI) is a national economic indicator of customer
satisfaction with the quality of products and services available to U.S. consumers. It is updated quarterly
with new measures for differing sectors of the economy, building on the previous year’s data. The overall
ACSI score for a given quarter factors in scores from more than 200 companies in 44 industries, and from
government agencies over the previous four quarters. The Index was founded at the University of
Michigan’s Ross School of Business and is produced by ACSI, LLC.
FORESEE ACSI E-GOVERNMENT SATISFACTION INDEX (Q3) 2011 25

FORESEE ACSI E-GOVERNMENT SATISFACTION INDEX (Q3) 2011 26
ABOUT FORESEE
As a pioneer in customer experience analytics, ForeSee continuously measures satisfaction across customer
touch points and delivers critical insights on where to prioritize improvements for maximum impact. Because
ForeSee’s superior technology and proven methodology connect the customer experience to the bottom
line, executives and managers are able to drive future success by confidently optimizing the efforts that will
achieve business and brand objectives. The result is better business for companies and a better experience for
consumers. Visit www.foresee.com for customer experience solutions and original research.


