Download - Fair Trade in the Fashion Industry

1
Fair-trade in the Fashion Industry
The Effect of Fair-trade on Customer
Loyalty
Deborah Duijndam
Faculty of Economics
Master in Marketing
Student number: 317167
Email: [email protected]
Supervisor: Drs. M.N.G. van Ginkel
Second reader:

2
Acknowledgement
This thesis would not have been possible without the help of some people with both content and mental
support in stressful times. Therefore I would like to thank a number of people.
First I am heartily thankful to my supervisor, Mirjam N.G. van Ginkel, whose encouragement, guidance and
support from the initial to the final level enabled me to develop this report. I really appreciate that she gave me
the chance and the confidence to investigate a subject that had my personal interest.
Furthermore I am very grateful to Carlos J.S. Lourenco for the help that he offered me to understand the
necessary statistical methods and for the special support of Eilien Monsma. She helped me not only by
discussing the data, but also by giving moral support. Without her support I would not have managed to write
this thesis like I have done.
Subsequently I want to thank Yvonne Beyer for her support with writing in English.
Lastly, I offer my regards and blessings to all of those who supported me in any respect during the completion
of the project. In special I want to thank my parents Ans en Bart, my sisters Corina and Joyce, my friends
Marscha, Liset, Rianne, Marion, Sanne and my boyfriend Denis and last but not least all my roommates of the
Koornmarkt.
Deborah Duijndam
10 December 2010

3
Table of Contents
Chapter 1 Introduction 5 Chapter 2 Loyalty 7
2.1 Introduction to loyalty 7 2.2 Behavioral and attitudinal loyalty 7 2.3 How loyalty arises 9 2.4 Non-attitudinal sources 10 2.5 How to measure loyalty 12 2.6 Conclusion 15
Chapter 3 Fair-trade & Fashion Industry 17
3.1 Introduction 17 3.2 Fair-trade in general 17 3.3 Distribution channels 18 3.4 Made-By 18 3.5 Quality mark 19 3.6 Scorecard 19 3.7 Brands 20 3.8 Recent facts & figures 21 3.9 Conclusion 22
Chapter 4 Hypotheses and Methodology 23
4.1 Introduction 23 4.2 Part 1: Behavioral loyalty 23
4.2.1 Hypotheses 23 4.2.2 Methodology 25
4.2.2.1 Retailer 25 4.2.2.2 Brands 25 4.2.2.3 Variables 25 4.2.2.4 Statistical tests 27
4.3 Part 2: Attitudinal loyalty 28 4.3.1 Hypotheses 28 4.3.2 Methodology 30
4.3.2.1 Respondents 30 4.3.2.2 Variables 30 4.3.2.3 Statistical tests 32
4.4 Conclusion 32 Chapter 5 Investigation part 1 33
5.1 Introduction 33 5.2 Part (a) Repurchases 33
5.2.1 Repurchases continuously 33 5.2.1.1 General findings 33 5.2.1.2 Chi Square test 34
4
5.2.1.3 Distribution of repurchases discontinuously 36 5.2.2 Repurchases discontinuously 37
5.2.2.1 General findings 37 5.2.2.2 T-Test within one group 38 5.2.2.3 Distribution of repurchases discontinuously 39
5.3 Part (b) Retention rate 40 5.3.1 General findings 41 5.3.2 Chi Square test 41 5.3.3 Distribution of switches 42 5.3.4 Limitation variable switch 43 5.3.5 Single purchases 43
5.4 Conclusion behavioral loyalty 44 Chapter 6 Investigation part 2 46
6.1 Introduction 46 6.2 Brand knowledge 46
6.2.1 Level of passive knowledge 46 6.2.2 Level of active knowledge 47 6.2.3 Conclusion 49
6.3 Brand attitude 49 6.3.1 Attitude strength 49 6.3.2 Attitudinal differentiation 51 6.3.3 Relative attitude 54
6.4 Word of mouth intensity 56 6.4.1 Number of recommendations 57 6.4.2 Net-promoter rate 57
6.5 Conclusion attitudinal loyalty 58
Chapter 7 61 7.1 Introduction 61 7.2 Important findings 62 7.3 Managerial implications 63
7.3.1 Managerial implications fair-trade in fashion industry 63 7.3.2 Managerial implications Kuyichi 64
7.4 Further research 67 7.5 Conclusion 69
Chapter 8 Limitations 70 Chapter 9 References 73 Chapter 10 Exhibits 78

5
Chapter 1 Introduction
The literature of today has mostly considered loyalty as a notion of consumers being exclusively loyal to one
single brand. However, with the disproportionate growth in the number of competing product alternatives in
the last decade, a clear decrease is observed in the number of loyal customer who purchase one brand only
(Yim, Kannan, 1998). Many consumers have more than one favorite brand, which results in a division of loyalty
among a few brands. Still, even when loyalty is more difficult, and therefore also more expensive to achieve,
loyal customers ensure the existence of the company1. The Pareto principle, which it is still not proved untrue,
states that 80% of sales is generated by 20% of the customers. This shows how important loyal customers are.
Companies need to find out who are those 20% of loyal customers? But even more important, what drives this
20% to be loyal to my brand?
Fair-trade has been in existence for more than 40 years and has become a very successful niche market. But in
recent decades, a significant growth in the number of ethically aware consumers has caused a strong demand
for socially and ecologically sustainable products, not only in the niche markets, but also among the masses
(Barrientos, Conroy & Jones, 2007). Therefore you would expect that significant marketing research has been
done on fair-trade products, but unfortunately the opposite is true. The written literature is limited and mainly
focused on the production processes and price sensibility. Subsequently the greater part of the research is based
on the food industry and other products and industries are barely discussed. This is most likely caused by the
fact that limited marketing data is available, which arises from the fact that the mainstream market is buying
fair-trade only since the last decade.
The combination of the difficulty and the importance of retaining customers, with the upcoming fair-trade
market, seems like a big opportunity. Since there is less competition in the fair-trade market it can be easier to
distinguish from other brands. Secondly, because of the fact that it is a ‘social responsible good’ with a
different production process, a higher level of consumer commitment can be formed. Information about the
brand can be provided what leads to higher knowledge levels, hence better-informed and considered choices.
Having said all this, it can be expected that in fashion industry, fair-trade can be the solution to achieve higher
loyalty levels.
The goal of this thesis is to determine whether there is a positive connection between the customer loyalty
level and fair-trade. This will be done in a few steps. First the literature of loyalty will be discussed, what will be
followed up by discussing the fair-trade market in general and later also with regard to the fashion industry.
The combination of both research areas will be the base of this thesis.
1 Loyalty has a positive effect on market share and relative price (A. Chaudhuri & M. B. Holbrook, 2001)

6
When the research framework is composed by means of the previous discussed, the second part of this thesis
will start. To determine whether fair-trade leads to higher loyalty levels, two investigations will be done. This
research structure is derived from the theory earlier discussed. In these investigations two brands will be
compared: a fair-trade brand (Kuyichi) versus a normal produced brand (G-Star).
Having done both investigations, the thesis will end by concluding whether fair-trade can be used to achieve
higher customer value by increasing the customer loyalty level. The conclusion will be based on the results of
both investigations. Subsequently recommendations will be drawn. Those will be directed to the fair-trade
market in general, but also specific to the fair-trade brand itself. Both with the aim to increase the current
loyalty levels by adapting the fair-trade trend. Subsequently suggestions for further research will be given.

7
Chapter 2 Loyalty
This thesis investigates a possible connection between fair-trade and brand loyalty. Therefore, this chapter
extensively discusses the theory of loyalty, which will be the basis for the analysis in the following chapters of
this thesis.
2.1 Introduction to loyalty
The ultimate goal of many corporate initiatives is to maximize profitability. Customer loyalty is one of the
means to achieve that. True loyal customers are customers who feel so strongly that the company can best
meet his or her relevant needs that the competition is virtually excluded from the consideration set: these
customers buy almost exclusively from the company (Shoemaker and Lewis, 1999). This definition implies that
‘true’ customer loyalty is more than just customer behavior. It is difficult to build, and most important, to
sustain without including the underlying attitudinal aspects of the customer that drive customer behavior. This
is why customer loyalty will be divided in two parts: attitudinal and behavioral loyalty (George and Wensley,
1998). Both are important elements of the total loyalty level to a brand. This chapter will further explain the
underlying theory of both attitudinal and behavioral loyalty. Further, it will discuss the process of how to
develop loyalty, the external influences on that process and it will discuss several methods to measure loyalty.
2.2 Behavioral versus attitudinal loyalty
As discussed before the theory of loyalty makes a very important distinction between attitudinal and
behavioral loyalty. Firstly, the definitions of loyalty and its two varieties are given to clarify these terms.
True loyalty is the preferential attitudinal and behavioral response toward one or more brands in a
product category expressed over a period of time by a consumer (Engel and Blackwell, 1982 ).
An attitude is an association between an object and an evaluation. The extremity of the attitude
reflects the position of the object along a continuum of favorability (Ajzen and Fishbein, 1980).
Behavior is the manner in which one behaves, the actions or reactions of a person or animal in
response to external or internal stimuli (http://www.thefreedictionary.com/behavior, Dec 2010).
These definitions show that the two kinds of loyalty are very dissimilar. Whereas attitudinal loyalty represents a
higher-order, or long term, commitment of a customer to the brand, behavioral loyalty of a customer focuses
on the profitability of the customer to the brand, which is translated in purchases behavior. The problem of
behavioral loyalty is the fact that differences in behavior are not necessarily caused by the level of loyalty, but
can also be caused by habits or promotion activities. This is exactly the reason why only measuring and
increasing the level of behavioral loyalty is not comprehensive enough. So in order to achieve ‘true’ loyalty,

8
firms should simultaneously focus on building both behavioral and attitudinal loyalty (Engel And Blackwell,
1982).
The two kinds of loyalty also have different goals. Behavioral loyalty is important to companies for generating
profitability, whereas attitudinal loyalty helps companies to build an invisible exit barrier for their customer.
The invisible exit barrier is especially important for non-contractual situations where switching costs are low.
To measure both levels of loyalty, different indicators are used. Behavioral loyalty is mostly measured in
purchase behavior, which gives direct and tangible returns to the firm. In contrast, attitudinal loyalty is far
more difficult to determine because quantifying the positive attitude strength of a customer is difficult.
Secondly, it needs to be complemented with high attitude differentiation (Ajzen and Fishbein, 1980). This is
necessary because by only determining the attitude strength, it is not possible to conclude anything about
potential loyalty level since the consumer can have this (for example positive) attitude towards all brands. To
combat this, comparisons between brands should be made:
A comparison of brands that are viewed by consumers to be relevant in a given consumption context is
called a relative attitude (Ajzen and Fishbein, 1980).
Incorporate relative attitude in a loyalty-model is a better way to indicate repeat patronages than just the
single brand attitude in isolation. Namely, by doing this the loyalty level will be directly compared to competing
brands, which will lead to better and more realistic understanding of the attitudinal level. To measure this
properly, an attitudinal differentiation matrix is made (Kumar and Shah, 2004), see exhibit 1. This matrix can be
filled in per customer for each product, which will allow for the measurement of the level of relative attitude.
(The matrix is also shown on the next page.)
As is shown in the matrix on the right, the
relative attitude is highest when the target
entity is associated with a strong attitude
and is clearly differentiated in the
consumer’s mind from the other brands
with weak attitude. In other words, the
relative attitude is the highest when both
the attitude strength and the
differentiation are high (red circle).
Furthermore, it is noteworthy that loyalty
may be achieved at both low and high
levels of attitude strengths, especially
when target consumers perceive differences in competing brands. A weak but positively differentiated attitude
may lead to higher loyalty than a very positive but undifferentiated attitude. Therefore, using the relative

9
attitudes of customers will increase the ability to predict their loyalty. This theory forms an important basis in
this thesis for how to determine the attitudinal loyalty.
In exhibit 1 the second figure (1.2) shows the different levels of relative loyalty (Dick and Basu, 1994). The
figure first shows the same distribution as Kumar and Shah used, but is expanded with a matrix that is made to
determine the overall loyalty level. These theories do not conflict and can therefore coexist.
2.3 How loyalty arises
In the previous part, the division of loyalty in behavioral and attitudinal is extensively explained and discussed.
This distinction will be the starting point of how to create sustainable loyalty and hence higher profitability
(Kumar and Shah, 2004). This is an important consequence, since by determining and increasing both levels of
loyalty, companies to accomplish better results.
Kumar and Shah created a conceptual framework that gives some insight in the way sustainable loyalty can be
achieved and measured. They use three steps (see exhibit 2):
1. Building and enhancing behavioral loyalty
2. Cultivating attitudinal loyalty
3. Linking loyalty to profitability
The first part of the model that is shown below (the red square in exhibit 2) will be the base of the analyses
that is included in this thesis. As is shown in the model, two analyses will be used. The behavioral loyalty will be
determined by analyzing purchase behavior and a survey will be done to measure the attitudinal loyalty. Part of
the model is shown below to clarify this.
The outcomes can give us some insight into the loyalty level. To classify the results, the second part of the
model will be used (shown on the next page and in the blue square in exhibit 2). This is done by implementing
the results in both matrices.
10
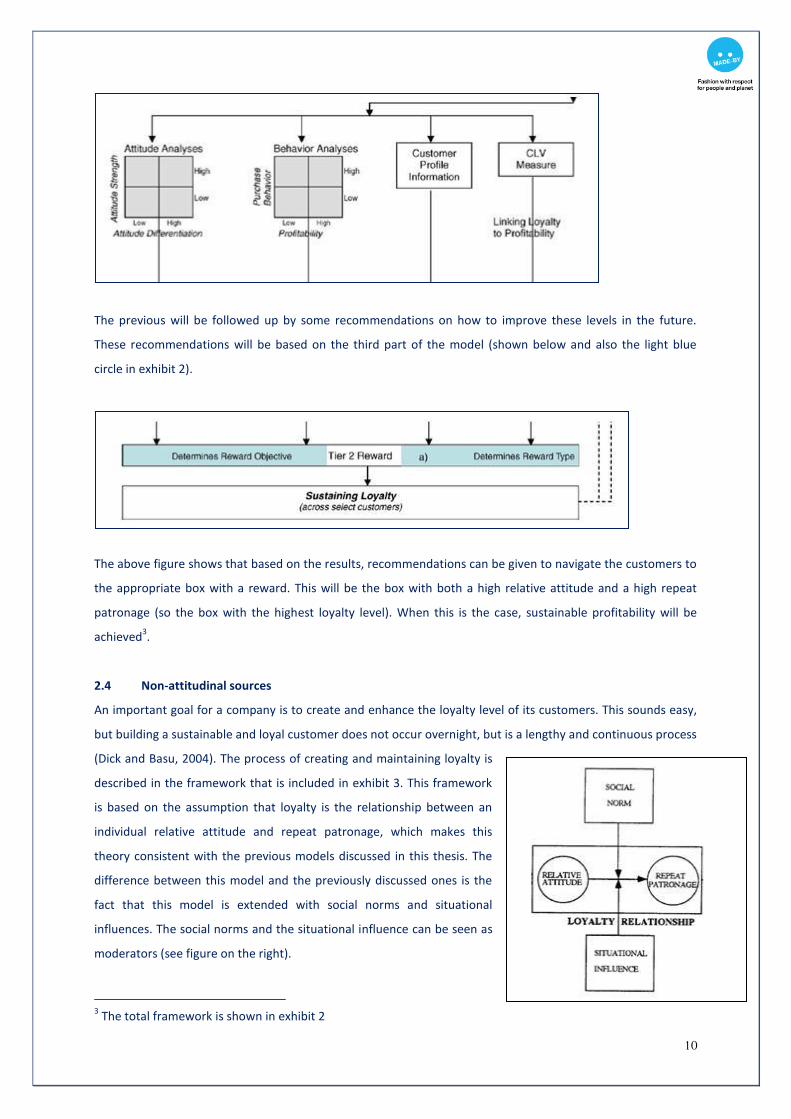
The previous will be followed up by some recommendations on how to improve these levels in the future.
These recommendations will be based on the third part of the model (shown below and also the light blue
circle in exhibit 2).
The above figure shows that based on the results, recommendations can be given to navigate the customers to
the appropriate box with a reward. This will be the box with both a high relative attitude and a high repeat
patronage (so the box with the highest loyalty level). When this is the case, sustainable profitability will be
achieved3.
2.4 Non-attitudinal sources
An important goal for a company is to create and enhance the loyalty level of its customers. This sounds easy,
but building a sustainable and loyal customer does not occur overnight, but is a lengthy and continuous process
(Dick and Basu, 2004). The process of creating and maintaining loyalty is
described in the framework that is included in exhibit 3. This framework
is based on the assumption that loyalty is the relationship between an
individual relative attitude and repeat patronage, which makes this
theory consistent with the previous models discussed in this thesis. The
difference between this model and the previously discussed ones is the
fact that this model is extended with social norms and situational
influences. The social norms and the situational influence can be seen as
moderators (see figure on the right).
3 The total framework is shown in exhibit 2

11
There are two different but related kinds of social norms4:
Behavioral norms (also known as descriptive norms) refer to the most common actions or behaviors
actually exhibited in a social group. Thus, the behavioral norm is what most individuals of a social
group actually do (applicable for behavioral loyalty).
Attitudinal norms (also known as injunctive norms) refer to the most widely shared beliefs or
expectations in a social group about how people in general or members of the group ought to behave
in various circumstances (applicable for attitudinal loyalty).
Situational influences can be described as:
Situational factors consist of temporary environmental factors that form the context within which a
consumer activity occurs at a particular place and time. Think of: physical surroundings, social
surroundings, time, task definition and antecedent states (Belk, 1974).
The previous states that moderators, such as situational factors and social norms, will influence the
relationship between a customer’s attitude and his/her behavior. This is because perceived behavioral norms
or role requirements, if contrary to an attitude, might render it unrelated to behavior (Wicker and Ehrlich,
1969). This means that consumers might behave differently than they wanted because of decisions influentials.
Secondly, several situational factors may impact on loyalty, for example stock outs and price promotions of
competing brands. How large the influence is, depends on the relative attitude. The stronger the relative
attitude towards a brand, the more likely the individual is to overcome countervailing social norms and/or
situational influences. Although this sounds logical, it is important to assess the characteristics of a market in
terms of the influence of relative attitude on one hand and situation/social factors on the other. This insight
allows marketers or managers to determine an appropriate focus for actions.
It can be stated that the one with the lowest influence on non-attitudinal sources (so social norms and
situational influences) is ‘Loyalty6’, and therefore the preferred one. The highest concern for marketers is
‘latent loyalty’. This level has a high relative loyalty but a low level of repeated patronage. It implies that the
situational effects are at least equal if not more influential than attitudes in determining patronage behavior.
This is difficult to control, and therefore in this case the company should focus its marketing efforts on
situational influences (Dick and Basu, 1994). It is assumed that for every market and product different
situations may arise. Dick and Basu (1994) already made such a matrix that shows its own appropriate strategy
for each outcome (Exhibit 4).
4 NSNI, National Social Norms Institute at the University of Virginia
6 Loyalty is the box with a high repeat patronage and high relative attitude, see red circle in exhibit 1.2
12
It can be concluded that the relative attitude as well as the social norms, and the situational influences, have an
impact on the repeat patronage. To get a good insight in the impact of each factor separately, several different
type of analyses can be done. The relative attitude can be determined by means of a survey (this method is
already discussed in exhibit 2). But also the effect of trends can be measured in this way, for example the
emerging sustainable trend. Simultaneously the situational factors and the social norms can also be analyzed
by means of purchase data. It is possible to measure the impact of those factors on purchases, which will be
discussed in more detail in section 2.5.
2.5 How to measure loyalty
The previous sections shed light on how loyalty arises, how it is divided in two varieties and which factors can
influence it. However, the previous sections do not give any concrete measurements. This section will discuss
the methods and questions that can be used to determine both attitudinal and behavioral loyalty.
More than 80% of companies use satisfaction scores to monitor customer loyalty, even though there is no
evidence that this is a good way of measuring the loyalty level (Naravandas, 2005). Naravandas (2005) claims
that this indicator measures scores that are based on past experiences, and loyalty is about future behavior.
Therefore, measuring the satisfaction level will not suffice. In contrast, companies should use recommendation
scores and re-purchase rates to measure the loyalty rate (Naravandas, 2005). This theory partly agrees with the
theories of Dick and Basu (1994) and Kumar & Shah (2004), which were discussed above. Both theories claim
that behavioral loyalty can better be determined by purchase data, but they disagree on how to measure
attitudinal loyalty. The earlier discussed theory of Kumar and Shah (2004) stated that the attitudinal loyalty
should be measured by using the relative attitude. Naravandas (2005) claims it should be measured by means
of the recommendations. Although this seems very different, both methods have large similarities. These will
be further discussed in the next part (attitudinal loyalty), but first how to measure behavioral loyalty will be
discussed.
Behavioral loyalty
It is not only important that customers say that they are loyal, but they should also act loyal. As mentioned
before, to determine the level of behavioral loyalty purchase data should be analyzed. Kumar and Reinartz
(2004) propose several methods to measure the loyalty level, see exhibit 6. Table 1 shows the two most
interesting ways of measuring the behavioral loyalty for this thesis7: (1) purchase frequency acceleration, and
(2) increased retention rate. The method that will be used to determine the attitudinal loyalty is also included.
7The reason for not choosing the other methods is also shown in exhibit 6.

13
Table 1 Methods to measure loyalty (Kumar and Reinartz)8
Methods Part of loyalty
Purchase frequency acceleration Behavioral loyalty
Increased retention rate Behavioral loyalty
Increase in positive word-of Mouth communication (WoM)9 Attitudinal loyalty
Behavioral brand loyalty has mostly considered loyalty as a notion of consumers being exclusively loyal to a
single brand (Yim and Kannan, 1999). With the unprecedented increase in the number of competing product
alternatives in the present decade, there has been a clear decrease in the number of such loyal consumers who
purchase a brand exclusively. Many consumers have started to embrace more than one favorite brand, thus
exhibiting divided loyalties among a few brands. Therefore in this investigation two types of behavior loyalty
will be used:
Repurchases Continuously (without any interruptions) which describes hard-core loyalty, when
consumers exclusively repeat purchase one brand
Repurchases Discontinuously which describes reinforcing loyalty, when consumers may switch among
brands, but predominantly repeat purchase one or more brands to a significant extent (Yim and
Kannan, 1998).
Attitudinal loyalty
The level of attitudinal loyalty can be determined by
means of the attitudinal differentiation matrix (Dick
and Basu, 1994) and the CBBE matrix (Keller, 1993)
see exhibit 5. Before going any further, the theory of
the CBBE matrix will be briefly explained.
CBBE is defined as the differential effect of brand
knowledge on consumer response to the marketing of
the brand.
This model clarifies the steps a consumer makes by
becoming a loyal customer: he/she goes from brand
knowledge (first two levels), to brand response (last
two levels), see figure at the right and exhibit 5.1.
8 These three options are the most appropriate methods to use in this investigation. Exhibit 6 shows all the
other options of Kumar and Reinartz with a brief explanation. The options that are chosen correspond to the literature that is discussed in this chapter. The reason of not choosing the other methods is also explained in exhibit 6. 9 The Word of Mouth (WoM) communication is similar to the discussed recommendation level.
Level 2.
Brand response
Level 1.
Brand knowledge
14
This insight in development of loyalty is important in this investigation because it shows that if there is no
knowledge of a brand, loyalty can never be achieved. Subsequently, the CBBE model uses a matrix with the
different levels of loyalty that can be achieved (exhibit 5.3). Those levels are similar to the ones shown in
exhibit 1.2, so the theories of Keller (2001) and the theory of Dick and Basu (1994) do not conflict with each
other.
As is shown in the CBBE matrix, the attitude arises from knowledge. Therefore the survey will start with
determining the level of knowledge. If there is no knowledge, there can’t be any attitude towards the brand. If
there is knowledge of the brand, the attitude will be simply estimated by asking the attitude strength towards
the brand. Subsequently the attitude differentiation will be measured by asking their preferred brand. In this
way the relative attitude can be determined. By means of this method the level of attitude can be determined
in all the different layers in the ‘CBBE stairs’.
In contrast, the theory of Narvandas (2005) claims that the attitudinal loyalty can be measured by means of the
recommendation level. This method will also be used in this thesis, but in combination with the CBBE matrix.
This is because the recommendation level only measures the highest step of the CBBE matrix. So by only using
that method, there is no insight in how this loyalty level has evolved. Therefore a combination of both theories
will be used (see exhibit 5.2). To determine the level of the different ‘steps’ the CBBE model will be used.
Complementary to measure the overall attitudinal loyalty level, the recommendation level will be used.
The recommendation level is also discussed in the theory of Frederick F. Reichheld (2003). He claims that there
is only one question that should be asked to determine the level of loyalty, namely: Would you recommend this
product to your friends and or colleagues? This method also includes the satisfaction level since if you didn’t
like the product, you would not recommend it. Secondly by recommending a product a person puts his own
image on the line Therefore it should be a highly committed and satisfied customer.
The level of recommendation for a company could be measured by the net-promoter rate (Reichheld, 2003):
Promoters are those who say they are extremely likely to recommend the brand to a friend or
colleague.
The net-promoter is calculated by subtracting the percentage of customers who say they are unlikely to
make a recommendation (detractors) from the percentage who say they are extremely likely to do so:
Promoters – Detractors = Net-promoter rate
The outcome of this formula shows the relative number of loyal customers per brand: the higher the number,
the better. Besides this outcome, the formula also shows that a company should not only strive to the highest
level of promoters, but it should also try to minimize the number of detractors. Namely if the number of
detractors is very high, the loyalty level will also be low, despite what the promoters level will be.

15
Non-attitudinal sources
As exhibit 3 shows, besides the attitudinal loyalty, the non attitudinal sources also have influence on the overall
loyalty level. Therefore measuring the influence of the situational influences in combination with the social
norms, will give marketers some extra insight in which factors influence customer loyalty. This gives them the
opportunity to encourage or distress certain aspects. It is very important to include this non-attitudinal sources
into the research, because in this way unexpected influences can be discovered. (This can be seen as thinking
out of the box.) These factors can also be measured by means of the data that was collected to determine the
attitudinal loyalty and the behavioral loyalty.
2.6 Conclusion
Loyalty can be separated in two parts: attitudinal and behavioral. Attitudinal loyalty represents a higher-order,
or long term, commitment of a customer to the brand. Behavioral loyalty focuses on the value of the customer
to the brand, which is translated in purchase behavior. Therefore it could be stated that to achieve better
results, it is important for a brand or company to manage the level of loyalty.
The behavioral loyalty level can be measured by purchase acceleration and the retention rate. These indicators
will be used during this investigation. However, purchase acceleration will be split up in high committed hard
core loyalty (Repurchases Continuously) and less intensive reinforcing loyalty (Repurchases Discontinuously)
(Yim, Kannan, 1998). By mapping the behavioral loyalty by means of these indicators and comparing the results
of a fair-trade brand versus a normal production, the effect of fair-trade on behavioral loyalty can be
established.
Attitudinal loyalty will be measured by means of the relative-attitude-matrix, which is determined by the
interaction between attitude strength and attitude differentiation. Secondly, the different stages of loyalty will
be determined by means of the CBBE matrix, and the highest level of loyalty will be determined by means of
the recommendation level. The combination of all results gives a good insight into the attitudinal loyalty level
of the investigated brands, and hence whether fair-trade influences the outcome.
When both levels are determined, so both the repeat patronage (behavioral loyalty) and the relative attitude
(attitudinal loyalty), the overall level of loyalty can be determined by combining both results. While doing this it
is important to keep in mind that there are some moderators that can influence this relationship, like the non-
attitudinal-factors as situational influences and social norms. The influence of these factors should also be
determined, with the aim to recommend which external influences the brand should try to encourage or
weaken.
All theories that are used, are incorporated in a new figure, that is shown below. At the end of this thesis this
figure should be completed for both the fair-trade brand and the normal produced brand. By doing this, it will
be very clear where the differences between both types of brands occur.
16
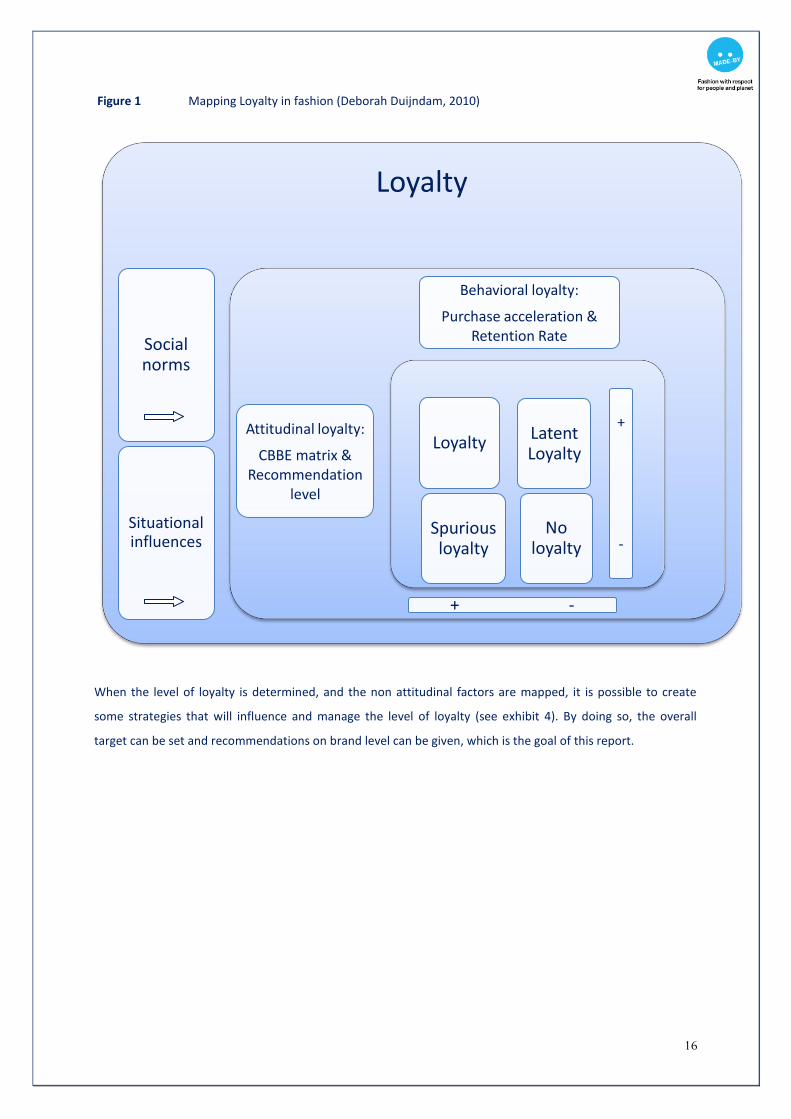
Figure 1 Mapping Loyalty in fashion (Deborah Duijndam, 2010)
When the level of loyalty is determined, and the non attitudinal factors are mapped, it is possible to create
some strategies that will influence and manage the level of loyalty (see exhibit 4). By doing so, the overall
target can be set and recommendations on brand level can be given, which is the goal of this report.
Loyalty
Social norms
Situational influences
Behavioral loyalty:
Purchase acceleration & Retention Rate
Attitudinal loyalty:
CBBE matrix & Recommendation
level
+ -
Spurious loyalty
LoyaltyLatent Loyalty
No loyalty
+
-
17
Chapter 3 Fair-trade and Fashion Industry
In the previous chapter the theory of loyalty is discussed. This chapter gives some background information
about fair-trade in general and fair-trade in the fashion industry. Both chapters will be used as a basis for
further research described later in this thesis.
3.1 Introduction
Fair-trade has been in existence for more than forty years and has become a very successful niche market. But
in recent decades, a significant growth in the number of ethically aware consumers has caused a strong
demand for socially and ecologically sustainable products, not only in the niche markets, but also among the
masses (Barrientos, Conroy & Jones, 2007). Therefore it would be expected that a lot of research is done
concerning fair-trade, but unfortunately the opposite is true. The written literature is limited and mainly
focused on the production processes, its challenges and price sensibility. Secondly the greater part of the
information is based on the food industry and other industries are barely discussed. Moreover, information
about fair-trade-consumer behavior is also lacking. This is most likely caused by the fact that limited data is
available which arises from the fact that the mainstream market has been buying fair-trade only since the last
decade.
In this chapter general information and guidelines about fair-trade and previous findings will be discussed. The
fashion industry and the fair-trade movement within the fashion industry will be described and discussed.
Nowadays it is very difficult to retain customers. Since there is less competition in the fair-trade market,
consumers can get additional information about the production process, which will lead to greater knowledge
and hence better-informed choices. All these reasons will create the feeling that in fashion industry, fair-trade
can lead to higher attitude levels.
3.2 Fair-trade in general
Over the history of fair-trade, several definitions of fair-trade are given. The most general definition is given by
FINE10
and is given below.
Fair-trade is a trading partnership, based on dialogue, transparency and respect, which seeks greater equity in
international trade. It contributes to sustainable development by offering better trading conditions to, and
securing the rights of, marginalized producers and workers especially in the South. Fair-trade organizations
(backed by consumers) are engaged actively in supporting producers, awareness raising and in campaigning for
changes in the rules and practice of conventional international trade. (FINE, 2001)
10
FINE is an informal network that involves the fair-trade Labeling Organization International (FLO), the International Federation for Alternative Trade (IFAT), the Network of European Shops (NEWS!) and the European Fair-trade Association (EFTA). (Sixty years of fair-trade, 2006))
18
3.3 Distribution channels
Fair-trade products are sold through three main channels: the dedicated retail outlets, supermarkets and via
mail orders. In addition to these three main channels there are other retail channels such as solidarity groups,
whole food shops, and independent commercial stores. In Europe there are approximately 2700 ‘world shops’,
and 43,000 supermarkets were fair-trade products are sold. So the number of fair-trade offering supermarkets
in Europe is quite high, which cannot be said about the US market where there are merely 7,000 fair-trade
offering supermarkets. This lead to the conclusion that fair-trade is further developed in Europe compared to
the United States.
The discussed distribution channels can be divided into four main groups:
1. First there are the producer organizations in developing or Southern countries.
2. Second there are the buying organizations in developed or Northern countries, which act as importers,
wholesalers and retailers of the products purchased from the Southern producer organizations.
3. Third there are the umbrella bodies which consist of the following six organizations: IFAT, FLO, NEWS!,
EFTA, fair-trade Federation and Shared Interest. These are mainly focused on the fair-trade process but
there are also a lot of organization that support sustainable production (what is a more broadly approach).
When looking at the fashion industry, there are some umbrella organization that will only focus on the
distribution in fashion, like MADE-BY. Instead of offering a 100% fair-trade production, they offer less strict
alternatives.
4. Fourth there are a wide range of mostly conventional organizations that engage in some way in fair-trade.
Think of supermarkets, retailers or brands that want to communicate a sustainable message.
This research will mainly focus on distribution channels in the fashion industry. The most important (and
discussed later in this chapter) distribution channels are the second and third level. Kuyichi, the second level, is
the brand which imports its clothes from the producer organizations. The umbrella organization MADE-BY (the
third level) helps making connections with the manufacturers hence controls for the fair process. As mentioned
before this is not a fair-trade organization, but it provides information about a sustainable production process.
However the fourth party will not be discussed extensively, it is included in this thesis because the data is
derived from a retail store. All these parties will be discussed in the following paragraphs.
3.4 MADE-BY
MADE-BY is an independent label for brands and retailers in the fashion industry that wants to improve the
social, economic and ecological environmental factors in their production chain while making the process more
transparent. Their mission is: Wouldn’t it be fantastic if the clothes of your favorite brand were made with
respect to people and environment11
.
11
MADE-BY. MADE-BY Missie.

19
MADE-BY has contact with the consumers, the brand as well as the manufacturers. Contact with consumers is
important for giving them the certainty that the brand puts all its effort in making the circumstances as good as
possible in respect to people and environment. Contact with the brand is important for giving them the
assistance in improving their social, economical and ecological circumstances in their whole production
process. Contact with manufactures is important for helping them to obtain social and environmental
certification and the purchase of durable materials such as organic cotton through the MADE-BY network of
farmers, spinners and fabric manufactures.
In practice MADE-BY uses three target points to achieve the above12
: Blue Button, Global Network and
Transparency. These points are extensively described in exhibit 7.
3.5 Quality mark
The quality mark of MADE-BY is the blue button, but considering the above you can imagine the use of a quality
stamps can be confusing. This is partly caused by the fact that for each market different requirements are set.
Secondly it has to do with the fact that these products are produced in different ways, countries and by
different production chains. The longer the chain, the more difficult it is to control all the requirements in every
link. Subsequently it is difficult to set one quality stamp for these different environments and requirements.
Nevertheless FLO and IFAT try to do so. Social, economic and environmental developments are central to the
fair-trade production process. These elements will be the basis of the detailed requirements for each separate
market. The standards are extensively described in exhibit 8.
MADE-BY does not guarantee the discussed standards, because it cannot guarantee that all rules are complied
during the production processes they support. Therefore they do not use the fair-trade quality stamp, but as
already mentioned before they use their own quality stamp: the Blue Button. Companies that have this stamp
have as a goal to produce their clothes in the most sustainable way possible. A large difference between the
fair-Trade quality stamps like Max Havelaar and the Blue button is that the fair-Trade stamps are given for their
past results and the Blue Button is given for past and future results. The Blue Button stands for a long time
commitment and the goal to improve the production process of the brand. A 100% guarantee that the
production process already is totally fair-trade is not addressed. The process of becoming more sustainable is
shown on the website (Scorecard) and therefore very transparent. In this way consumers can see the
improvement of the brand over time.
3.6 Scorecard
As is discussed in the previous part, to show this developments clearly MADE-BY has made an overview that is
called the scorecard. This is made for each brand that participates and is shown on their website13
. In exhibit 10
12
MADE-BY. MADE-BY In het kort 13
MADE-BY. MADE-BY Resultaten

20
the score card of Kuyichi is shown. There you can see that only 5% of the total production is socially certified.
The fact that the fashion industry is made up of so many levels causes that it is almost impossible to achieve a
100% fair-trade proof chain. Although this seems like a small percentage, the total effect that MADE-BY has on
sustainable production is quite large and is growing rapidly, which is shown in exhibit 9.
3.7 Brands
To show the impact of fair-trade on loyalty, two brands will be compared: Kuyichi (fair-trade) and G-Star
(normal produced).
Kuyichi
The brand Kuyichi is the first fashion label that proved that being fair-trade and fashionable can go together14
.
The organization Solidaridad founded Kuyichi in 2002 as a result of an action against the bad image (and reality)
of the fashion industry, specifically that the working environment is bad, while not even speaking about the
damage to the natural environment. It attempted to prove that a brand can become successful because of the
fair-trade production process instead of despite of it. Fortunately they proved to be right, because Kuyichi is
currently a successful and trendy jeans brand. Overtime many other brands have followed Kuyichi by starting a
collaboration with MADE-BY, that was founded as a result of the success of Kuyichi to support other brands to
do the same. This investigation will shed its light on the brand Kuyichi and compare it with another Dutch brand
G-Star.
G-STAR
G-Star is the market leader of The Netherlands concerning jeans and casual clothing. In general, it can be stated
that every Dutch fashion brand that wants to join the real market, compares their sales, product development
and marketing activities with G-Star. This is the reason that in this report G-Star is used to set the bar. The
similarities and differences between G-Star and Kuyichi are shown in table 1 below.
Table 1 G-Star versus Kuyichi
G-Star Kuyichi
Range of products Jeans, shirts, coats, accessories, shoes
Same except for shoes, but fewer products per category
Price A-brand price setting for mass-market
A brand price setting for mass-market (low for FT and organic)
Position in market Market leader in jeans Pioneer in fair-trade jeans
Core Values (short) Trendy, innovative, denim, skilled
Trendy, organic (good quality), pure, denim
14
KUYICHI. Kuyichi Love the World

21
Purchases in
pieces Kuyichi total G-Star total Others
2005 189 1929 3820
2006 393 2435 4118
2007 759 3168 4564
2008 748 2563 3903
2009 726 2380 15212010 400 1424 668
TOTAL 3215 13899 18594
3.8 Recent facts & figures
As mentioned in section 3.1 the information about the fair-trade market is limited. This is caused by the lack of
an overarching trade body and secondly because the subject does not (did not) have the attention of market
intelligence agencies. Fortunately some figures are available.
During the last five years the sales of fair-trade certified products have been growing on an average of almost
40% on yearly base. In 2008, consumers spent 2.9 billion Euros on fair-trade products globally. This means that
despite the global recession, worldwide sales of fair-trade products grew by an impressive 22% in 2008. This
makes the fair-trade certified products one of the most successful products of this decade15
.
Subsequently Hudson and Hudson cited evidence that in 1999 only 50% of the worldwide production of fair-
trade coffee was sold through fair-trade channels and the remaining 50% was sold on the regular market
(Renard, 2003). This shows that the mainstream market has been reached and fair-trade is no longer only sold
to ‘alternative people’.
Retailing & Fashion market
The two tables below show the developments in the retailing of the last 3.5 years (so also non fair-trade). It is
quite evident that the year 2009 was a very difficult year. The positive thing is that the losses decreased in
2010, but unfortunately still occur. Therefore it is expected that the facts and figures of both brands show
disappointing results due to the overall economic decline.
Table 2 Retail in the Netherlands
2.1 Retail 2.2 Non food retail
Table 3 Purchases over time retail store
This investigation will analyze the data of one particular
retail store. In this retail store, the overall sales of G-star
(13899 pieces) was about 5 times higher than Kuyichi
(3215 pieces) during the last five and a half years, see
table 3.
15
Fair-trade. Fair-trade Labelling Organizations International (FLO)
22
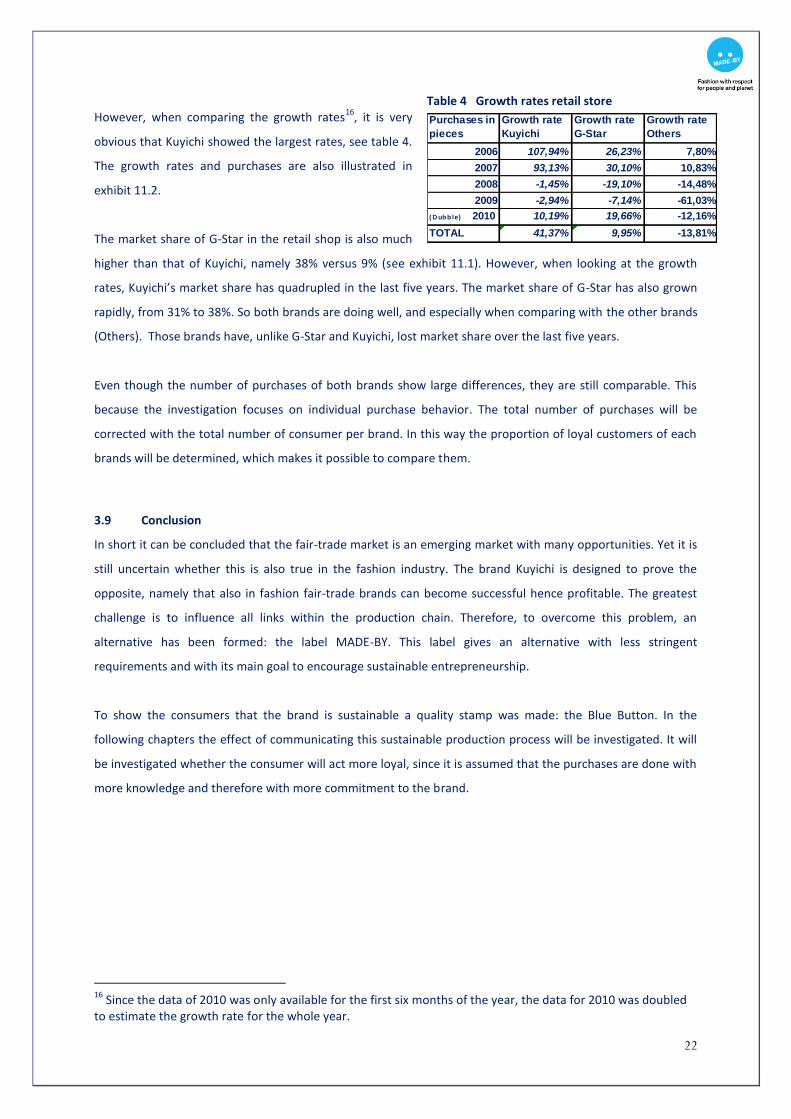
Table 4 Growth rates retail store However, when comparing the growth rates
16, it is very
obvious that Kuyichi showed the largest rates, see table 4.
The growth rates and purchases are also illustrated in
exhibit 11.2.
The market share of G-Star in the retail shop is also much
higher than that of Kuyichi, namely 38% versus 9% (see exhibit 11.1). However, when looking at the growth
rates, Kuyichi’s market share has quadrupled in the last five years. The market share of G-Star has also grown
rapidly, from 31% to 38%. So both brands are doing well, and especially when comparing with the other brands
(Others). Those brands have, unlike G-Star and Kuyichi, lost market share over the last five years.
Even though the number of purchases of both brands show large differences, they are still comparable. This
because the investigation focuses on individual purchase behavior. The total number of purchases will be
corrected with the total number of consumer per brand. In this way the proportion of loyal customers of each
brands will be determined, which makes it possible to compare them.
3.9 Conclusion
In short it can be concluded that the fair-trade market is an emerging market with many opportunities. Yet it is
still uncertain whether this is also true in the fashion industry. The brand Kuyichi is designed to prove the
opposite, namely that also in fashion fair-trade brands can become successful hence profitable. The greatest
challenge is to influence all links within the production chain. Therefore, to overcome this problem, an
alternative has been formed: the label MADE-BY. This label gives an alternative with less stringent
requirements and with its main goal to encourage sustainable entrepreneurship.
To show the consumers that the brand is sustainable a quality stamp was made: the Blue Button. In the
following chapters the effect of communicating this sustainable production process will be investigated. It will
be investigated whether the consumer will act more loyal, since it is assumed that the purchases are done with
more knowledge and therefore with more commitment to the brand.
16
Since the data of 2010 was only available for the first six months of the year, the data for 2010 was doubled to estimate the growth rate for the whole year.
Purchases in
pieces
Growth rate
Kuyichi
Growth rate
G-Star
Growth rate
Others
2006 107,94% 26,23% 7,80%
2007 93,13% 30,10% 10,83%
2008 -1,45% -19,10% -14,48%
2009 -2,94% -7,14% -61,03%
( D ubb le) 2010 10,19% 19,66% -12,16%
TOTAL 41,37% 9,95% -13,81%
23
Chapter 4 Hypotheses and Methodology
The previous chapters (2 and 3) have discussed the research framework that will be used as the base for this
thesis. This chapter will discuss the hypotheses which are derived from the theory. Secondly it will discuss the
methods how these hypotheses should be tested.
4.1 Introduction
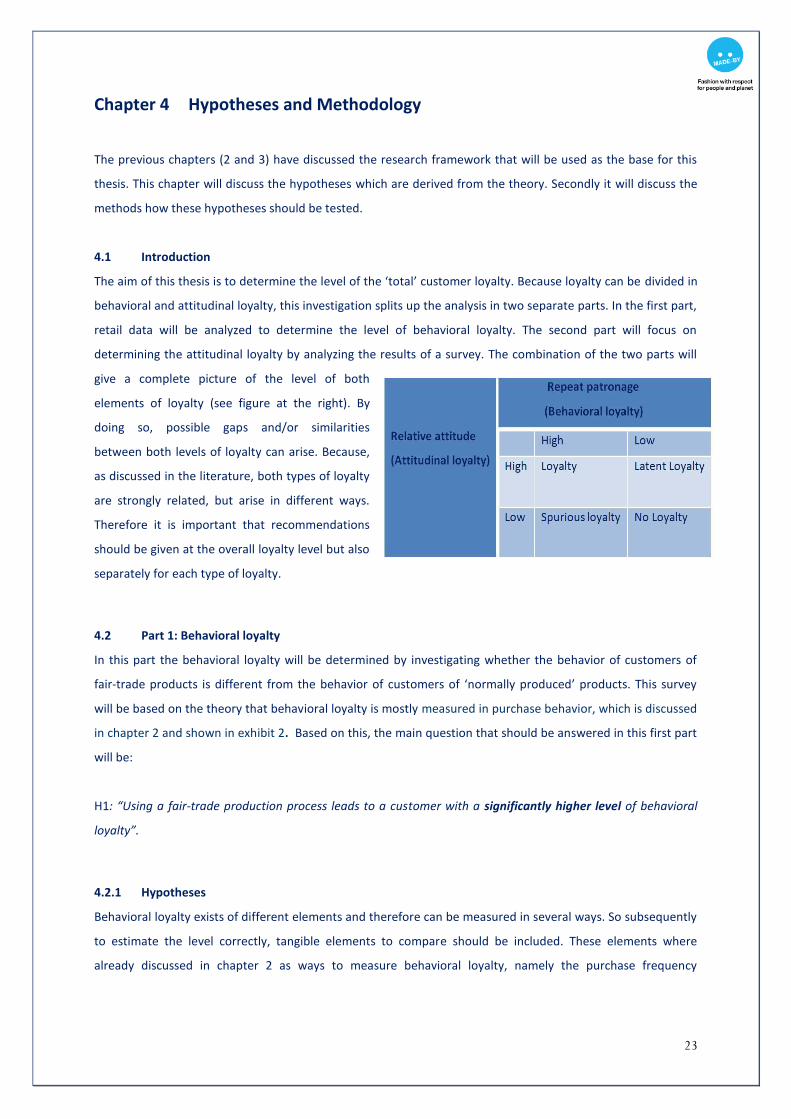
The aim of this thesis is to determine the level of the ‘total’ customer loyalty. Because loyalty can be divided in
behavioral and attitudinal loyalty, this investigation splits up the analysis in two separate parts. In the first part,
retail data will be analyzed to determine the level of behavioral loyalty. The second part will focus on
determining the attitudinal loyalty by analyzing the results of a survey. The combination of the two parts will
give a complete picture of the level of both
elements of loyalty (see figure at the right). By
doing so, possible gaps and/or similarities
between both levels of loyalty can arise. Because,
as discussed in the literature, both types of loyalty
are strongly related, but arise in different ways.
Therefore it is important that recommendations
should be given at the overall loyalty level but also
separately for each type of loyalty.
4.2 Part 1: Behavioral loyalty
In this part the behavioral loyalty will be determined by investigating whether the behavior of customers of
fair-trade products is different from the behavior of customers of ‘normally produced’ products. This survey
will be based on the theory that behavioral loyalty is mostly measured in purchase behavior, which is discussed
in chapter 2 and shown in exhibit 2. Based on this, the main question that should be answered in this first part
will be:
H1: “Using a fair-trade production process leads to a customer with a significantly higher level of behavioral
loyalty”.
4.2.1 Hypotheses
Behavioral loyalty exists of different elements and therefore can be measured in several ways. So subsequently
to estimate the level correctly, tangible elements to compare should be included. These elements where
already discussed in chapter 2 as ways to measure behavioral loyalty, namely the purchase frequency

24
acceleration and the retention rate17
(Mellink, 2005). Based on these methods the following sub hypotheses
arise (see below):
H1.1 “Using a fair-trade production process leads to a customer with a significant higher number of
repurchases”.
H1.1.1 “If a customer buys a fair-trade brand, it is significantly more likely that he/she will
consecutively repurchase the fair-trade brand instead of purchasing another brand”.
H1.1.2 “If a customer buys a fair-trade brand, it is significantly more likely that he/she will not
consecutively repurchase the fair-trade brand instead of purchasing another brand”.
H1.2 “Using a fair-trade production process leads to a customer with a significantly higher ‘retention rate’18
”.
H1.2.1 “If a customer buys a fair-trade brand, it is significantly less likely that he/she will consecutively
switch to another brand”.
A large disadvantage of the variable “number of switches” is that it includes all switches that were made by the
customer. This may sound strange because in fact those switches are made, but it is crucial to realize that in
some situations the switch back is part of the first switch. In this case, the consumer can be said to go back to
the preferred (original) brand after a switch rather than making a switch to another brand (this is illustrated in
figure 2).
Figure 2 Double Switch
17
All possible ways to measure loyalty are described in exhibit X. 18
Total number of purchases (%) – the number of ‘churns’(%) = Retention rate (%) [100% - X% = Retention rate]

25
Having said this, an extra analysis will be included. It will analyze the switches back that will be measured by
means of ‘single purchases’. The single purchase will not be tested but described by means of the descriptives.
The above hypotheses establish the level of behavioral loyalty for both brands, hence possible differences will
be discussed.
4.2.2 Methodology
In this section the retailer, data, variables and testing methods will be discussed to give some insights to this
investigation.
4.2.2.1 Retailer
The data that is used for this investigation is collected from a representative fashion store. This fashion store is
privately-owned, consists of one store on an AA location in Delft, is well known for its high service level and
exists for more than 30 years. The target market are young up to mid-age people, men and women, with an
above average income. It offers on average between six to eight A-brands. G-Star is the most popular brand in
this shop and has been in their portfolio for the last 15 years. They started selling Kuyichi around seven years
ago.
The data is acquired by means of a loyalty card that is used in this retail store. Regular customers can get this
card in exchange for a small discount. The data consist of all the purchases of these cardholders during the last
five years. This period of time is chosen because sales of Kuyichi started to become measureable as of 2005.
The data consists of 35708 purchases of which 3215 were Kuyichi purchases and 13899 were G-Star’s. All of
these purchases were done by a total of 5423 customers.
4.2.2.2 Brands
As mentioned in chapter 3, the analysis will shed its light on two Dutch fashion brands, that operate in the
same segment with similar products of the same price level. The main difference between both brands (besides
fair-trade and normal production) is that Kuyichi is in the growth phase and G-Star is already a mature brand.
It is important to mention that both brands offer the same kind of products, but the availability of different
products is about 50% higher for G-Star compared to Kuyichi. This is a limitation20
to the investigation, however
it is still considered to be a fair comparison as both brands offer enough products to make a conscious choice.
In addition, the purchases of all other brands will also be included because they will give information about the
repurchases and the switching behavior of the customers. These brands will be aggregated in a new variable as
‘OTHERS’. The analysis and recommendations will only be done for the brands G-Star and Kuyichi.
20
LIMITATION 2: The coincidence factor of choosing a G-Star product is higher considering the difference in supply quantity.

26
4.2.2.3 Variables
To determine the loyalty level, it is very important to measure the individual purchase behavior. Analysis of the
overall purchases gives insight into trends and strengths of a brand, but it does not provide insight in the
loyalty level of the individual customer21
. For this purpose the data retrieved from the cardholders will be
analyzed. The information includes: client number, product information such as brand and kind of product,
date of purchase, price and when appropriate the discount. As discussed in chapter 2, the repurchases and the
retention rate will be used to establish the behavioral loyalty level. The quality of these variables is shown in
exhibit 12.
To answer the different hypotheses that were outlined in section 4.2.1, several new dummy variables are
included. These dummy variables are: Purchase Kuyichi, Purchases G-Star, Purchases Others, Repurchases
Kuyichi (continuously and discontinuously), Repurchases G-Star (continuously and discontinuously), Switch
Kuyichi, Switch G-Star, Discount Kuyichi, Discount G-Star, Discount Others. Additional information on how these
variables were made, and how they can be interpreted, can be found in exhibit 13.
Brand loyalty mostly implies being exclusively loyal to a single alternative despite any situational factors. As
discussed in chapter 2 (page 12), many consumers have started to embrace more than one alternative as their
favorite brand. Therefore it can be stated that the meaning of loyalty has changed and consumer loyalty can be
divided among brands. To include this market shift, loyalty will be defined in two ways (Yim and Kannan, 1998):
Hard core loyalty: continuously repurchases,
Reinforcing loyalty: discontinuously repurchases.
Continuously and discontinuously repurchases
Continuous repurchase: if the customer purchases the same brand on two consecutive occasions , it is called a
continuous repurchase. All other cases will be covered under discontinuously repurchases. This variable
provides important customer information and changes over time can be analyzed. This makes it possible to
determine for how long the customer has purchased the brand, if the number of purchases has grown over
time, and whether the customer purchases other brands on occasion. This is important information for the
management of the brand. For example, if a new Kuyichi customers is detected, he/she should be approached
in a certain way. In contrast, an existing Kuyichi customer who switches to a competitor should be regained.
But he/she should be approached in a very different way than in the first scenario. In short this variable shows
the behavior of a customer over time. In other words whether the customer becomes more or less loyal to the
brand.
21
LIMITATION 3: Unfortunately the loyalty card is sometimes used by more than one person. This may skew the research results and therefore this limitation must be considered in the evaluation of the results.

27
Discontinuous repurchase: the variable repurchases discontinuously does not contain all the previous discussed
information. This variable shows the total repurchases that were done by one individual customer and the
effect of time is not included. Therefore the variable does not show if these purchases were made with
interruption or without. This implies that important information is lost as it is impossible to determine whether
a customer is loyal or not. Secondly, this variable cannot show whether a new customer is concerned or an
existing customer that has changed his/her behavior over time. This is a major omission of this variable for the
management of the brand. However, it still has been decided to include this variable, since it gives a high level
view of the intensity of purchases per customer, which is also a good indicator of loyal behavior.
Since it is difficult to achieve high loyal behavior in the fashion industry the combination of both variables
(continuous and discontinuous repurchases) is chosen. The first variable measures behavioral loyalty very
strictly (without interruptions) but it gives only insight into a very small percentage of the total customer group
(very loyal customers). The second variable (discontinuous repurchase) measures loyalty on a more general
level and therefore gives insight into a larger percentage of the customer group. The combination of both
variables gives the most realistic view of the loyalty level.
4.2.2.4 Statistical tests
In order to test the hypotheses in section 4.2.1, the following two variables will be used: continuous and
discontinuous repurchases. The goal of this investigation is to find out whether there are any differences
between customers who purchase Kuyichi and G-Star. To reach this goal, the repurchases and switching scores
of both brands will be compared. The methods used will differ slightly for both of the variables. These
differences are dedicated to the characteristics of each variable. A short summary of these dissimilarities are
shown in the table below.
Table 5 shows that a distinction can be made between the categorical dummy variables (1 or 0) and the ratio
variable. For the categorical dummy variables the Chi Square test should be used. In contrast, the aggregated
purchases ( the ratio variable) should be tested by means of the t-test within one group. The Chi Square test
will show the differences between the two customer groups (Kuyichi- and G-Star customers), whereas the T-
test measures the dissimilarities within the whole customer group. Figure 3 provides a visual outline of the two
methods.
Table 5 Summary of the most important variables
Groups Variable Repurchases
Continuously
Variable Repurchases
Discontinuously
Variable Switch
G-Star = 1
Kuyichi = 2
Others = 0
CATEGORICAL VARIABLE
1 = repurchase
0 = not a repurchase
RATIO VARIABLE
0, < = sum repurchases
CATEGORICAL VARIABLE
1 = switch
0 = no switch

28
Figure 3 Tests visual
Dependent means T-Test: Independent means T-Test and Chi Square
Total customer group Kuyichi- versus G-Star customers
Additional information about these statistical tests can be found in exhibit 14. The outcomes of these tests will
be analyzed in chapter 5.
4.3 Part 2: Attitudinal loyalty
This section will describe the level of attitudinal loyalty and the differences between both brands. The
literature of chapter 2 stated that attitudinal loyalty should be determined by conducting a survey. First this
section describes the hypotheses of this survey, followed by a discussion of the methodology used for testing
these hypotheses.
4.3.1 Hypotheses
The main question that should be determined is whether there is a difference in the overall attitudinal loyalty
between the two customer groups. Therefore the following general hypothesis arises:
H2: “Using a Fair-trade production process to a product, leads to a customer with a significant higher level of
attitudinal loyalty”.
But by only answering this question a narrow version of
reality will be shown, namely only the differences in the
overall loyalty level. By establishing this level, it is not
clear where the differences between both brands arose.
To combat this, the combination of theories that were
discussed in chapter 2, will be used. It will start with the
theory of Dick and Basu (1994) (also used by Kumar and
Kuyichi
Others
G-Star
G-Star
Kuyichi
Differences within total population Differences between groups

29
Shah,2004) that will be combined with the CBBE matrix of Keller (2001). The CBBE matrix shows that attitudinal
loyalty arises from customers’ brand knowledge, - awareness and -attitude. As is discussed in the theory, this is
the base of how attitudinal loyalty arises.
The CBBE matrix will be combined with the theory of the
relative attitude of Dick and Basu and Kumar and Shah (see
figure at the right). This theory shows that the relative
attitude is a more accurate way to measure the attitudinal
level, because it takes into account the attitude
differentiation instead of only the attitude strength.
The combination of the level of knowledge, awareness and attitude will give information on the overall loyalty
level. As mentioned in the literature of chapter 2, the overall loyalty level can also be measured by means of
the Word of Mouth intensity. So if the outcomes are consistent with the theory, the level of knowledge,
awareness and attitude should correspond with the WOM intensity. If this is not the case, other causes, like
moderators, can be important determinants of the attitudinal loyalty22
.
Taking into account all of the above, it was concluded that merely one hypothesis will not suffice. To establish
all different attitudinal loyalty levels, several sub hypotheses have been developed:
H2.1: “Using a fair-trade production process leads to a customer with a significantly higher level of knowledge
of the brand”.
H2.2: “Using a fair-trade production process leads to a customer with a significantly higher level of relative
attitude in favor of the fair-trade brand”.
H2.2.1: “Using a fair-trade production process leads to a customer with a significantly higher attitude
strength in favor of the fair-trade brand”.
H2.2.2: “Using a fair-trade production process leads to a customer with a significantly higher
attitudinal differentiation in favor of the fair-trade brand”.
H2.3: “Using a fair-trade production process leads to a customer with a significantly higher Word of Mouth
(WoM) intensity”.
22 If the results of investigation parts 1 and 2 do not prove that loyalty is caused by the investigated variables, then new research should be done. In this thesis an additional investigation will be done to establish which factors do result in loyalty. However, because these additional factors were not included in this investigation, there is no data available on these variables in this research. Therefore the results from this additional investigation can only be used as guidelines for further research.

30
These hypotheses are based on the two stairs of the CBBE matrix (brand knowledge and brand response) in
combination with the recommendation level, which can determine the overall attitudinal loyalty level.
4.3.2 Methodology
The previous section described the overall hypothesis and its sub hypotheses. This section discusses the
method of how these hypotheses will be tested. The overall structure of how the survey is conducted is based
on the literature of Dick and Basu (1994), Kumar and Shah (2004) and Keller (2001). This is the same
classification as is used for the sub hypotheses. It starts with the knowledge level, followed by determining the
attitude strength and differentiation, and it concludes with establishing the overall attitudinal loyalty level. The
precise method concerning the respondents and variables will be discussed below.
4.3.2.1 Respondents
The survey was conducted among the same group of people as the first part of the investigation, namely the
group of customers with a loyalty card of the same retail shop. Over a period of two months, a total of 220
customers were questioned. The respondents were randomly chosen at different times of day. A short
introduction was given to the customer but without any pre-information about fair-trade in particular. In this
way it was tried to keep the external influences to a minimum. Some additional information about these
respondents is shown in exhibit 15.
4.3.2.2 Variables
The data consists of questions that were based on the four steps of the CBBE model. As is shown in the CBBE
matrix the first level to achieve is the knowledge level. Brand knowledge can be divided in active and passive
knowledge. Active knowledge is whether the correspondent can recall the brand itself, whereas passive
knowledge is already available when the correspondent recognizes the brand.
The survey will start with establishing the passive knowledge by easily questioning if the customer knows the
brand23
. To create some more insight in this knowledge level, the awareness level should also be measured.
The awareness level determines the active knowledge level by means of asking to recall associations.
Associations are attributes or benefits which consumers strongly relate to the brand (Keller and Tybout, 2002).
A brand can communicate points of parity and points of difference.
Points of Parity (PoP): associations that are not necessarily unique to the brand but may in fact be shared
with other brands.
Points of Difference (PoD): attributes or benefits consumers strongly associate with a brand, positively
evaluate, and believe that they could not find to the same extent with a competitive brand. Strong,
23
Do you know the jeans-brand Kuyichi/G-Star? (Yes/No). See exhibit 16

31
favorable, and unique brand associations that make up points of differences may be based on virtually any
type of attribute or benefits24
.
By asking respondents at their associations, it can be established whether both brands have the same PoPs
and/or PoDs. Both brands want to be seen as a trendy jeans brand, those associations can therefore be seen as
PoPs. Having said this, it is to be expected that they have similar PoPs but different PoDs. Fair-trade is an
association that can be seen as an Point of Difference.
The active brand knowledge level is very important to establish. This because if the customer doesn’t know
that the brand Kuyichi is fair-trade, the conclusion that a fair-trade production process can lead to a higher
loyalty level cannot be made (what is the base of this investigation). To measure the awareness level, eight
associations were given. These associations were based on the outcomes of a pre-survey. This pre-survey
consists of only one simple open question, namely What associations do you have if you think of the brand
Kuyichi or G-Star? A selection of the most mentioned associations (eight in total) was used as the base for the
real survey. The respondents could choose with a maximum of four from these associations (Question 3,4,5
and 6 in exhibit 16). By doing this it is very easy to establish whether both brands have the same PoPs and
PoDs. Secondly, by using this method respondents do not get the impression that the investigation will focus
on fair-trade.
The differences in outcomes of this first question can already be very important. It shows the starting point of
how the differences in outcomes in loyalty level between both brands could arise. This can be very important
information for both brands, because investing in the highest level of attitudinal loyalty has no effect if there is
no (or misplaced) knowledge in the first place.
After investigating the knowledge level and its corresponding associations for each brand, the attitude level
should be determined. This should be done by determining the relative attitude level instead of the general
attitude level. To do so, the attitude strength as well as the attitude differentiation will be measured, which will
be done by asking the customer how they feel about the brand. Consequently, this method assumes that
customers are able to express their knowledge and feelings well. To help the customer to do so, guidelines by
means of different answer categories are created. Therefore several multiple choice question were asked,
these questions and the corresponding answer categories are shown in exhibit 16.
24
CiteMan Network (2006)

32
Attitude strength will be measured by extreme attitudes (Wood, 1982). In the survey it is asked they feel about
the brand25
. When the respondent answered very positive or very negative, it is called a extreme attitude (E.M
Pomerantz, S. Chaiken and R. S. Tordesillas, 1995). Attitude differentiation will be established by testing the
differences between the attitudes of both brands. The combination of the outcomes of both questions will give
the level of the relative attitude (questions 7, 8 and 9 in exhibit 16).
Finally the overall attitudinal loyalty will be measured. This level is the highest level that results from the
previously discussed levels. Hence, it is expected that the previous levels are strongly correlated with the
overall attitudinal loyalty level. As described in the theory of chapter 2, the overall attitudinal loyalty can be
determined by means of the Word of Mouth intensity. The only question that should be used to determine this
level is: Will you recommend the product to one of your friends or colleagues? This question is based on the
theory of F.F. Reichheld (2003) that is discussed in the literature of chapter 2 (questions 10 and 11 of exhibit
16).
If the results correspond to the theory, the level of WoM intensity should agree with the previous results of
knowledge, awareness and attitude level.
4.3.2.3 Statistical tests
The questions will be analyzed by means of two statistical tests: the dependent T-test and Chi Square test. The
goal of these tests is to determine the differences in every step of the attitudinal loyalty ladder between both
brands. The additional statistical backgrounds about these tests can be found in exhibit 14. The results of the
tests will be discussed in chapter 6.
4.4 Conclusion chapter 4
This chapter has described the hypotheses and the methodologies to be investigated in this research. The
description was divided into two parts: behavioral loyalty and attitudinal loyalty. To determine the behavioral
loyalty, retail data will be used. The attitudinal loyalty will be investigated and determined by means of a
survey. The results of both of these parts of the investigation will be analyzed in chapters 5 and 6 respectively.
25
William Scott (1968) described nine variable properties of attitudes that might considered dimensions of attitude strength: magnitude, intensity, ambivalence, salience, affective salience, cognitive complexity, overtness, embeddedness and flexibility. In this thesis intensity is used to measure the attitude strength. This is done by asking a respondent how they feel about the brand. A respondents shows a high attitude strength when he/she chose one of the extreme options: Very Positive/Very Negative. It is assumed that in this case the respondent has a very intense feelings.

33
Chapter 5 Investigation Part 1: Behavioral Loyalty
The previous chapter has discussed all hypotheses and corresponding methods that will be tested in this thesis.
As indicated the investigation will be divided in two parts: behavioral – and attitudinal loyalty. This chapter will
discuss the tests that were done for investigation part 1, which was described in section 4.2 and focuses on
behavioral loyalty.
5.1 Introduction
The following hypothesis will be analyzed in this chapter:
H1: “Using a fair-trade production process leads to a customer with a significantly higher level of behavioral
loyalty”.
As discussed in the previous chapter, four sub hypotheses are tested and analyzed to provide the answer to the
main hypothesis. This chapter discusses the tests and corresponding results for each hypothesis. The analysis is
divided in two sections. First the hypotheses that were based on the repurchases will be tested in part (a).
Secondly, the hypotheses that were based on the retention rate will be tested in part (b). The hypotheses will
be answered by means of the statistical tests but will be supported with an analysis of the used variables. The
analysis is structured this way with the aim to provide a realistic answer.
5.2 Part (a) Repurchases
Part (a) will focus on the variables repurchasing continuously and repurchasing discontinuously. In this part the
following hypothesis will be tested:
H1.1 “Using a fair-trade production process leads to a customer with a significantly higher number of
repurchases”.
5.2.1 Repurchases continuously
As is discussed in the theory of chapter 2, two kinds of loyalty can be distinguished. In this section the
Repurchases Continuously (without any interruptions) will be discussed. It describes hard-core loyalty: when
consumers exclusively repeat purchase one brand (Yim and Kannan, 1998). This will be done by analyzing the
repurchases without interruptions.
5.2.1.1 General findings
Before testing the hypotheses, some general information about the tested variables will be discussed. In table
6 the purchases and repurchases over the last six years are shown. It is very obvious that all brands have to
cope with a struggling economy during the years 2008 and 2009 and most likely also in 2010 (this was already
expected since the analysis of the market characteristics in chapter 3 showed the same). Nevertheless Kuyichi
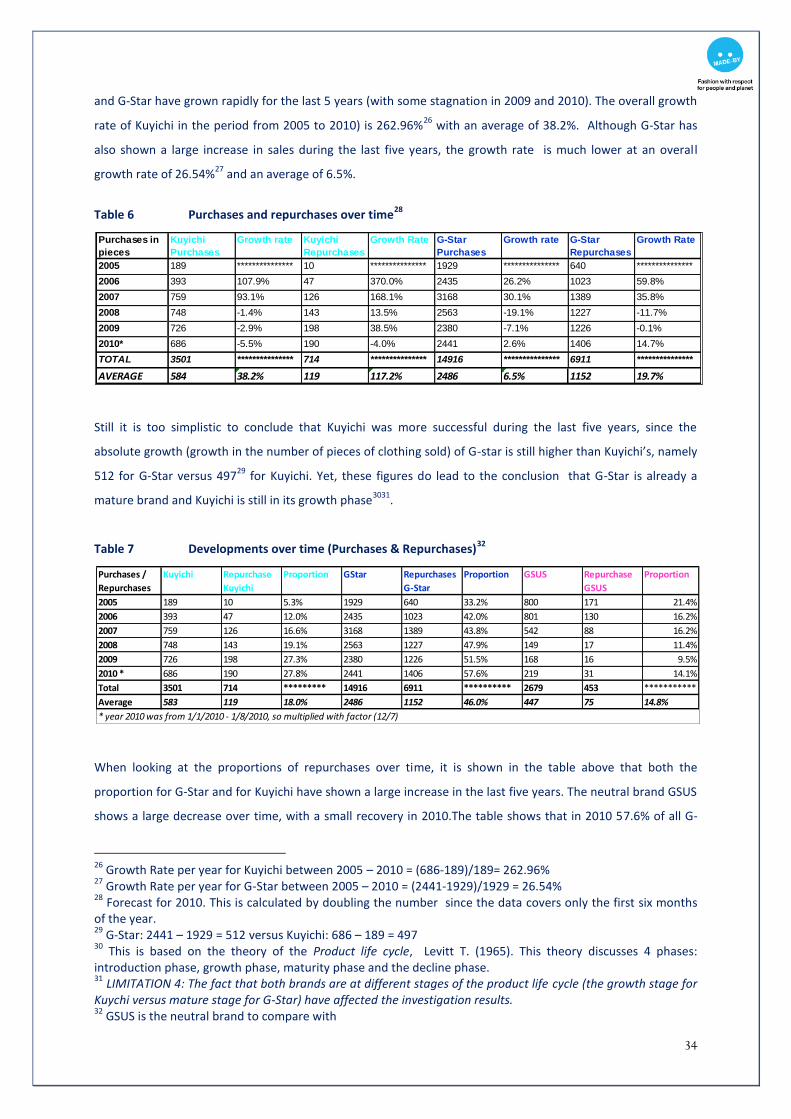
34
and G-Star have grown rapidly for the last 5 years (with some stagnation in 2009 and 2010). The overall growth
rate of Kuyichi in the period from 2005 to 2010) is 262.96%26
with an average of 38.2%. Although G-Star has
also shown a large increase in sales during the last five years, the growth rate is much lower at an overall
growth rate of 26.54%27
and an average of 6.5%.
Table 6 Purchases and repurchases over time
28
Still it is too simplistic to conclude that Kuyichi was more successful during the last five years, since the
absolute growth (growth in the number of pieces of clothing sold) of G-star is still higher than Kuyichi’s, namely
512 for G-Star versus 49729
for Kuyichi. Yet, these figures do lead to the conclusion that G-Star is already a
mature brand and Kuyichi is still in its growth phase3031
.
Table 7 Developments over time (Purchases & Repurchases)32
When looking at the proportions of repurchases over time, it is shown in the table above that both the
proportion for G-Star and for Kuyichi have shown a large increase in the last five years. The neutral brand GSUS
shows a large decrease over time, with a small recovery in 2010.The table shows that in 2010 57.6% of all G-
26
Growth Rate per year for Kuyichi between 2005 – 2010 = (686-189)/189= 262.96% 27
Growth Rate per year for G-Star between 2005 – 2010 = (2441-1929)/1929 = 26.54% 28
Forecast for 2010. This is calculated by doubling the number since the data covers only the first six months of the year. 29
G-Star: 2441 – 1929 = 512 versus Kuyichi: 686 – 189 = 497 30
This is based on the theory of the Product life cycle, Levitt T. (1965). This theory discusses 4 phases: introduction phase, growth phase, maturity phase and the decline phase. 31 LIMITATION 4: The fact that both brands are at different stages of the product life cycle (the growth stage for Kuychi versus mature stage for G-Star) have affected the investigation results. 32
GSUS is the neutral brand to compare with
Purchases in
pieces
Kuyichi
Purchases
Growth rate Kuyichi
Repurchases
Growth Rate G-Star
Purchases
Growth rate G-Star
Repurchases
Growth Rate
2005 189 *************** 10 *************** 1929 *************** 640 ***************
2006 393 107.9% 47 370.0% 2435 26.2% 1023 59.8%
2007 759 93.1% 126 168.1% 3168 30.1% 1389 35.8%
2008 748 -1.4% 143 13.5% 2563 -19.1% 1227 -11.7%
2009 726 -2.9% 198 38.5% 2380 -7.1% 1226 -0.1%
2010* 686 -5.5% 190 -4.0% 2441 2.6% 1406 14.7%
TOTAL 3501 *************** 714 *************** 14916 *************** 6911 ***************
AVERAGE 584 38.2% 119 117.2% 2486 6.5% 1152 19.7%
Purchases /
Repurchases
Kuyichi Repurchase
Kuyichi
Proportion GStar Repurchases
G-Star
Proportion GSUS Repurchase
GSUS
Proportion
2005 189 10 5.3% 1929 640 33.2% 800 171 21.4%
2006 393 47 12.0% 2435 1023 42.0% 801 130 16.2%
2007 759 126 16.6% 3168 1389 43.8% 542 88 16.2%
2008 748 143 19.1% 2563 1227 47.9% 149 17 11.4%
2009 726 198 27.3% 2380 1226 51.5% 168 16 9.5%
2010 * 686 190 27.8% 2441 1406 57.6% 219 31 14.1%
Total 3501 714 ********* 14916 6911 ********** 2679 453 ***********
Average 583 119 18.0% 2486 1152 46.0% 447 75 14.8%
* year 2010 was from 1/1/2010 - 1/8/2010, so multiplied with factor (12/7)
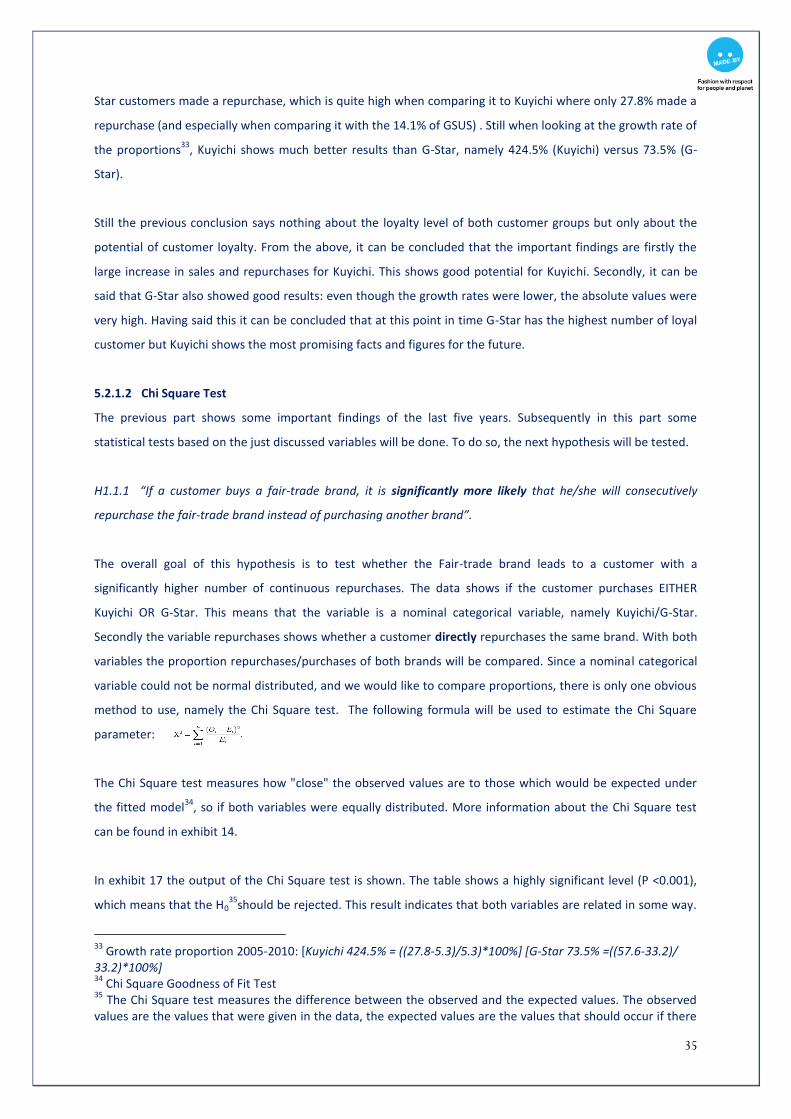
35
Star customers made a repurchase, which is quite high when comparing it to Kuyichi where only 27.8% made a
repurchase (and especially when comparing it with the 14.1% of GSUS) . Still when looking at the growth rate of
the proportions33
, Kuyichi shows much better results than G-Star, namely 424.5% (Kuyichi) versus 73.5% (G-
Star).
Still the previous conclusion says nothing about the loyalty level of both customer groups but only about the
potential of customer loyalty. From the above, it can be concluded that the important findings are firstly the
large increase in sales and repurchases for Kuyichi. This shows good potential for Kuyichi. Secondly, it can be
said that G-Star also showed good results: even though the growth rates were lower, the absolute values were
very high. Having said this it can be concluded that at this point in time G-Star has the highest number of loyal
customer but Kuyichi shows the most promising facts and figures for the future.
5.2.1.2 Chi Square Test
The previous part shows some important findings of the last five years. Subsequently in this part some
statistical tests based on the just discussed variables will be done. To do so, the next hypothesis will be tested.
H1.1.1 “If a customer buys a fair-trade brand, it is significantly more likely that he/she will consecutively
repurchase the fair-trade brand instead of purchasing another brand”.
The overall goal of this hypothesis is to test whether the Fair-trade brand leads to a customer with a
significantly higher number of continuous repurchases. The data shows if the customer purchases EITHER
Kuyichi OR G-Star. This means that the variable is a nominal categorical variable, namely Kuyichi/G-Star.
Secondly the variable repurchases shows whether a customer directly repurchases the same brand. With both
variables the proportion repurchases/purchases of both brands will be compared. Since a nominal categorical
variable could not be normal distributed, and we would like to compare proportions, there is only one obvious
method to use, namely the Chi Square test. The following formula will be used to estimate the Chi Square
parameter:
The Chi Square test measures how "close" the observed values are to those which would be expected under
the fitted model34
, so if both variables were equally distributed. More information about the Chi Square test
can be found in exhibit 14.
In exhibit 17 the output of the Chi Square test is shown. The table shows a highly significant level (P <0.001),
which means that the H035
should be rejected. This result indicates that both variables are related in some way.
33
Growth rate proportion 2005-2010: [Kuyichi 424.5% = ((27.8-5.3)/5.3)*100%] [G-Star 73.5% =((57.6-33.2)/ 33.2)*100%] 34
Chi Square Goodness of Fit Test 35
The Chi Square test measures the difference between the observed and the expected values. The observed values are the values that were given in the data, the expected values are the values that should occur if there

36
In other words this means that the choice of brand by the customer has a significant influence on the number
of repurchases.
When looking at the crosstabs in exhibit 17, it can be concluded that this result is caused by two interesting
findings. First it can be stated that Kuyichi’s purchases are above expectations, unlike the results for G-Star that
scored under the expected value. Secondly the opposite can be said for the repurchases. Customers
repurchased less of the brand Kuyichi than expected. Contrary to that, the G-Star customer made more
repurchases than expected.
5.2.1.3 Distribution of Repurchases Continuously
To create some further insights in the origin of the differences in the number of repurchases, a distinction will
be made for each individual with a low, medium and high number of continuous repurchases. This means that
in this table all continuously repurchases are aggregated and distinguished in three levels with the
corresponding percentage. Low includes 0-2 repurchases per person, medium is 3-4 repurchases and high is 5
and more36
. It is reasonable to assume that a customer in the high repeat patronage group is more loyal than a
customer in the low repeat patronage group. Secondly it can be assumed that if there are more customers in
the higher segmented group, the customer group of that brand is more loyal.
Table 8 Distribution of loyalty per brand
The table shows that of the Kuyichi customers, 96% has done less than three repurchases over the last five
years. So only 3.9% of the total customer group has done more repurchases, which is a very small percentage.
The same can be said about the brand GSUS. In contrast, the outcomes of the brand G-Star are much more
distributed. About 77% of the total G-Star customer group have only repurchased the brand less than three
times, the other 23% is distributed over the other two categories. This distribution confirms the 20/80 rule37
,
were no differences between the two groups. The theory of what is known as the null hypothesis, expects that both means (so observed versus expected) of the sample will be very similar. If not, the null hypothesis will be rejected. As the observed difference between the sample means gets larger, the more confident we become that the second explanation is correct, what means that the null hypothesis should be rejected (Andy Field).Taking this into account, it could be stated that the higher the Chi Square value, the higher the difference between the two groups, hence the more confident we can be to reject the null hypothesis. Consequently this means that in this case the Chi Square is higher than the allowed value, and it could be stated that the variable brand has a significant influence on the amount of purchases and repurchases 36
For the category Low only zero is included when the sum of purchases is bigger than zero. This is important because logically, if there was no purchase, there cannot be a repurchase. 37
Vilfredo Pareto (1848-1923) introduced the 20/80 rule. The rule claims that 20 percent of the total customers is good for 80 % of the total sales. Pinnicle Management. Accelerating Results for Growing Businesses.
Repurchases (Continuously) Kuyichi % of total G-Star % of total GSUS % of total Total % of total
Low repeat patronage (0-2) 1452 96,0% 2698 77,4% 1267 97,1% 5417 86,0%
Medium repeat patronage (3-4) 42 2,8% 395 11,3% 29 2,2% 466 7,4%
High repeat patronage (5, <) 18 1,2% 391 11,2% 9 0,7% 418 6,6%
Total customers 1512 24,0% 3484 55,3% 1305 20,7% 6301 100,0%

37
namely that 20 percent of the total customer group (in this case even a little more) will contribute to 80% of
the total sales. This table confirms that the G-Star customer is a much more loyal customer compared to the
other two brands.
Considering the above, a few conclusions can be drawn: The customers of G-Star show higher numbers of
repurchases, hence more loyal behavior. Subsequently G-Star has a higher percentage of loyal customers (over
20%) contrary to the 4% of Kuyichi. Secondly it can be said that the number of Kuyichi customers is growing.
This is based on the high growth rates but also on the high number of first purchases and the low number of
repurchases, which indicates that many new customers have emerged. Having said this, only one clear
conclusion can be made:
H1.1.1 “If a customer buys a fair-trade brand, it is significantly more likely that he/she will consecutively
repurchase the fair-trade brand instead of purchasing another brand”. REJECTED
5.2.2 Repurchases discontinuously
As is discussed in the theory of chapter 2, two kinds of repurchases will be analyzed. Repurchases
Discontinuously is the second type which describes reinforcing loyalty: when consumers may switch among
brands, but predominantly repeat purchase one or more brands to a significant extent (Yim and Kannan, 1998).
This will be done by analyzing the total number of purchases per customer.
5.2.2.1 General findings
Like in the previous section, some general findings are discussed first. In the next table the average number of
repurchases per consumer is shown.
Table 9 Average number of discontinuous repurchases per consumer
The table shows that the total number of purchases (hence the discontinuous repurchases) is very different for
the three brands. G-Star has an average of four pieces per consumer, which is about twice the number of
Kuyichis’ (2.1 pieces per consumer) and GSUS’ (2.0 pieces per consumer). With this information, it would seem
logical that the number of discontinuous repurchases will differ significantly between the Kuyichi and G-Star
customer groups38
. To confirm this conclusion, the corresponding statistical test will be done in the next
section.
38
GSUS is only a neutral brand, so will not be included in further tests.
Repurchases (Discontinuously) Kuyichi G-Star GSUS
Total Purchases 3215 13899 2588
Total consumers 1512 3484 1305
Average purchases per consumer 2,1 4 2
38
5.2.2.2 T-Test within one group
The previous part shows some general findings considering the total number of repurchases. Subsequently in
this part some statistical tests based on the just discussed variable will be done. To do so, the next hypothesis
will be tested.
H1.1.2 “If a customer buys a fair-trade brand, it is significantly more likely that he/she will not consecutively
repurchase the fair-trade brand instead of purchasing another brand”.
The goal of this hypothesis is to test whether the fair-trade brand leads to a customer with a significantly higher
number of discontinuous repurchases. The hypothesis complements the previous hypothesis, since it will also
give some insight into the overall number of repurchases with interruptions.
The variable Repurchases discontinuously contains of all repurchases per consumer that were done in the last
five years. Because of this it is impossible to classify the customer as a Kuyichi customer or as a G-Star
customer, because he/she will mostly likely have purchased both brands in the last five years (see exhibit 18.1
purchase patterns and distribution of purchases) . When the purchases are aggregated, a ratio variable is
created39
. Because of this and the fact that the customer cannot be defined as a Kuyichi customer or a G-Star
customer, a T-test within one group should be done. The statistical background of this test is extensively
discussed in exhibit 1440
.
Despite the limitations
4142 of the T-test, this test has some additional value with respect to H1.1.1. This
hypothesis made it possible to estimate the differences in brand loyalty per consumer over time. By also
testing hypothesis H1.1.2, it is possible to create some further insight into the number of purchases per
customer. In this way it can be tested whether the Kuyichi or G-Star customer has purchased more products
39
It is important to note that a ratio variable is normal deviated, which is a condition for the t-test. 40
The T-test assumes that the data is normally distributed and that the variables are dependent. Both assumptions are met since the repurchases discontinuously is a ratio variable and the customers are from the same group and can be a Kuyichi customer as well as a G-Star customer (therefore dependent). 41
LIMITATION 5: It is important to consider the difference between the T-test within one group and the T-test between two groups (see exhibit 9), namely that for the T-test within one group the N is the same. This means that the number of repurchases of Kuyichi as well as of G-Star will be adjusted to one value of N. A large disadvantage of this is that the number of purchases of G-Star are much higher than for Kuyichi. This leads to results with a prejudice in favor of Kuyichi. This prejudice is caused by the fact that the proportion of Kuyichi will be lower since it is adjusted to a much bigger N (in the previous test the number of repurchases was adjusted to the number of purchases of the brand itself). Therefore it can already be said that this test will show customers of Kuyichi to be less loyal than they are in reality. 42 LIMITATION 6: Another disadvantage of the T-test is that it will measure the differences between the two customer groups in general. This means that it will not measure the buying behavior over time, but it will measure all purchases per person in total. By doing this the measurements will be less valid, because actually we want to measure whether the customer acts loyally, and whether this changes over time. This can be done by measuring whether the number of repurchases has increased or whether the customer has switched a lot. So a large pitfall of this measurement is that by using the overall number of purchases, a general view will occur of the number of repurchases, but it is not clear if they were done separately or continuously or if they were done in 2005 or 2010. In analyzing the results, this limitation should be included and considered.
39
during the last five years, which is also an indicator for brand loyalty43
. This phenomenon is called purchase
acceleration.
In exhibit 18.3 the results of the T-test are shown44
. The T-test measures whether there is a difference between
the two observed brands. The H0 assumes that there is no difference. If there is a difference and the significant
level is smaller than 0.05, the hypothesis must be rejected. In this case, it can be said that there is a difference
between the observed values of both brands since P<0.001. Hence the hypothesis must be rejected.
Although the above analysis already answers the question whether the two customer groups perform
differently, it does not answer the hypothesis whether the Kuyichi customer performs above expectation and
hence has a higher loyalty level. So only looking at the significant level is not enough. To answer this
hypothesis, the rest of the figures (like the mean, the correlation coefficient and the standard deviation) that
are given in the tables should also be analyzed.
The correlation coefficient of 0.514 shows that it is likely that if a customer buys a lot of G-Star, he/she will
also buy a lot of Kuyichi. (For example: if a customer purchases two G-Star products, then he/she will most
likely also buy one Kuyichi product (ratio 2:1).)
The mean of both brands differs with 1.97013 in the prejudice of Kuyichi. As was already discussed in the
limitations, this was expected to happen because of the large N and the small proportion of Kuyichi
customers45
. This difference in mean values plays an important role in the outcome of this test, hence the
low P-value (P< 0.0001).
The standard deviation of G-Star is much higher than that of Kuyichis’. This is caused by the fact that the
spread in the number of purchases is much larger for G-Star customers (a minimum of 1 and a maximum of
75) (see also exhibit 18.2). Since the total number of repurchases of Kuyichi is not that high, the differences
between the number of purchases between the customers is also relatively small, which explains the much
lower standard deviation.
5.2.2.3 Distribution of Repurchases Discontinuously
To analyze the results further, and to combat the previously mentioned limitations, the variable repurchases
(discontinuously) will be divided into three levels46
: The customer with a low loyalty level (1-2), medium loyalty
level (3-4) and high loyalty level (4 <)47
. This is done for both brands. In the table below the different levels of
loyalty will be compared and the differences between the loyalty groups will be estimated by showing the
43
Purchases acceleration, see exhibit 6. 44
The dependent means T-test is called in SPSS the Paired T-test. 45
Total N= 5423: Proportion Kuyichi = 1512/5423 = 27.9% Proportion of G-Star = 3438 / 5423 = 63.4%. 46
This method is based on the methodology in the article of Robert East and Julie Sinclair: ANZMAC 2000 Visionary Marketing for the 21st Century: Facing the Challenge; Loyalty: Definition and Explanation, Kingston Business School Phil Gendall, Massey University
46
47 This is the same method as is used for testing H1.1.1.

40
percentage of repurchases per brand48
. This analysis will complement the T-test that proved that the Kuyichi
customer differs in general from the G-Star customer.
Table 10 Distribution of repurchases discontinuously per brand
As you can see, all percentages of medium and high repeat patronage are much higher than for the continuous
repurchases. For Kuyichi this percentage is 23.9% (in contrast to the 3.9% of the continuous repurchases) and
for G-Star even 45.8% (compared with 22.5% of the continuous repurchases). Despite these higher
percentages, the results lead to the same conclusion. Just as for the continuous repurchases, this table shows
that the G-Star customers more often purchase the brand, and hence show more loyal behavior, than the
Kuyichi customers.
To conclude, it can be stated that all findings support the same conclusion, namely that the Kuyichi customer
shows less loyal behavior than the G-Star customer. Therefore, it has to be concluded with respect to the
hypothesis under investigation in this section:
H1.1.2 “If a customer buys a fair-trade brand, it is significantly more likely that he/she will not consecutively
repurchase the fair-trade brand instead of purchasing another brand”. REJECTED
5.3 Part (b) Retention rate
As discussed in the theory of chapter 2, not only repurchases are used to determine the behavioral loyalty, but
also the retention rate. Since it will shed its light on loyalty from a different perspective49
, also this indicator of
loyalty will be analyzed. In part (b) the following hypothesis will be tested:
H1.2 “Using a fair-trade production process leads to a customer with a significantly higher ‘retention
rate’50
”.
48
The repurchases were adjusted to the number of total purchases of the brand itself. 49
The opposite of retention is switch. 50
Total number of purchases (%) – the number of ‘churns’(%) = Retention rate (%) [100% - X% = Retention rate]
Repurchases (Discontinuously) Kuyichi % of total G-StAR % of total
Low repeat patronage 1151 76.1% 1886 54.1%
Medium repeat patronage 237 15.7% 722 20.7%
High repeat patronage 124 8.2% 876 25.1%
Total households 1512 100.0% 3484 100.0%

41
5.3.1 General findings
Just as for the other hypotheses, first some general information about the tested variables will be discussed. In
the next table the number of purchases and switches, and the resulting retention rate are shown over the last
6 years. This table again includes the control brand GSUS, which makes it possible to compare the
developments of both analyzed brands with a neutral brand51
.
The table shows that the retention rate of G-Star is about twice as high than for Kuyichi. Moreover, the
retention rate of Kuyichi is about twice as high than that of GSUS. These results support the earlier findings in
part (a) which are based on the number of repurchases. The data shows that G-Star has by far the most loyal
customers, followed by Kuyichi and that GSUS has the least loyal customers of all three brands.
Table 11 Switches and retention rate over time
5.3.2 Chi Square test
The results from the previous section suggest that the G-Star customer will switch less frequently than the
Kuyichi customer. To investigate this expectation, the Chi Square test will be used. The following hypothesis is
tested:
H1.2.1 “If a customer buys a fair-trade brand, it is significantly less likely that he/she will consecutively switch
to another brand”.
The goal of this hypothesis is to test whether the fair-trade brand leads to a customer with a higher level of
‘retention rate’52
. The measurements will be done by means of the variable ‘number of switches’, which is the
opposite of retention rate and can be directly derived from the data.
Hypothesis H1.2.1 can simply be tested using the same method as for hypothesis H1.1.1. This is because the
variable ‘number of switches’ is a nominal categorical variable (either Yes No). Secondly, also here we want to
measure proportions, namely the number of switches that resulted from a purchase: ratio switches/purchases.
51
This neutral brand is GSUS. The neutral brand is the control group. 52
Total number of purchases (%) – the number of ‘churns’(%) = Retention rate (%) [100% - X% = Retention rate]
Switch over
time
Sum
Kuyichi
Switch Retention
Rate
Sum G-Star Switch Retention
Rate
Sum GSUS Switch Retention
Rate
2005 189 105 44.4% 1929 680 64.7% 800 388 51.5%
2006 393 294 25.2% 2435 1048 57.0% 801 575 28.2%
2007 759 507 33.2% 3168 1370 56.8% 542 502 7.4%
2008 748 478 36.1% 2563 1131 55.9% 149 177 -18.8%
2009 726 418 42.4% 2380 755 68.3% 168 162 3.6%
2010 400 232 42.0% 1424 419 70.6% 128 77 39.8%
Total 3215 2034 ******** 13899 5403 ******** 2588 1881 ********
Average 536 339 37.2% 2317 901 62.2% 431 314 18.6%
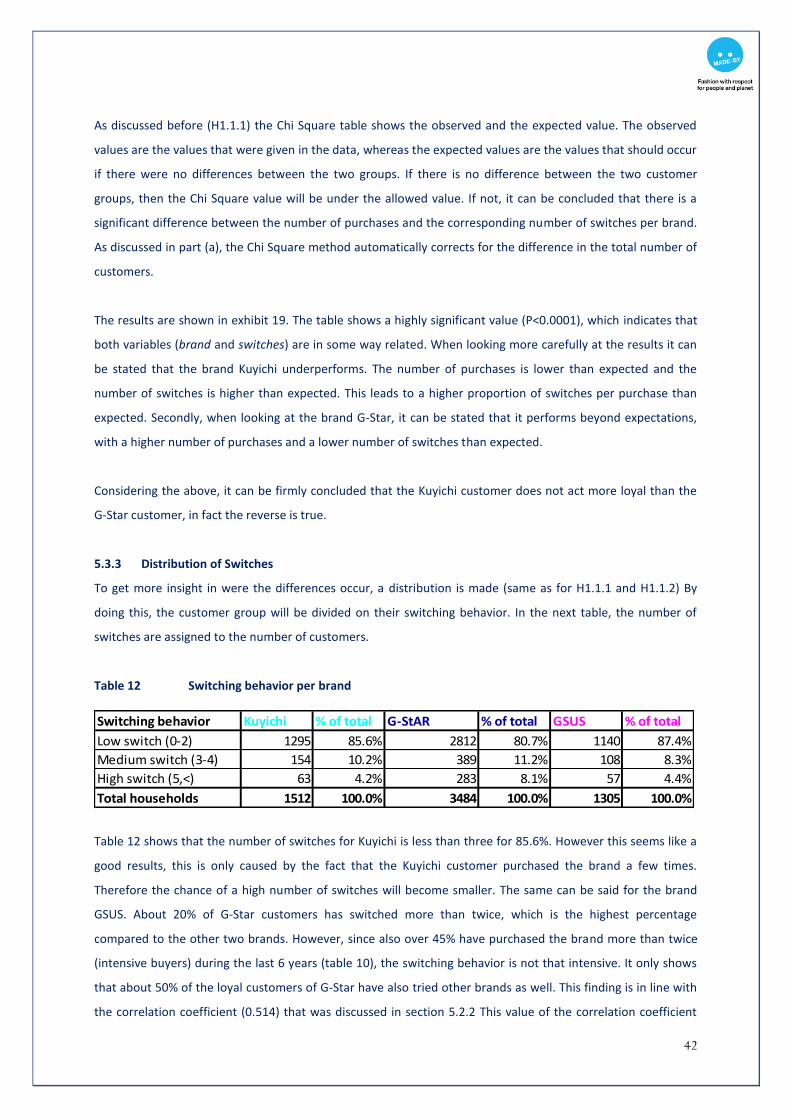
42
As discussed before (H1.1.1) the Chi Square table shows the observed and the expected value. The observed
values are the values that were given in the data, whereas the expected values are the values that should occur
if there were no differences between the two groups. If there is no difference between the two customer
groups, then the Chi Square value will be under the allowed value. If not, it can be concluded that there is a
significant difference between the number of purchases and the corresponding number of switches per brand.
As discussed in part (a), the Chi Square method automatically corrects for the difference in the total number of
customers.
The results are shown in exhibit 19. The table shows a highly significant value (P<0.0001), which indicates that
both variables (brand and switches) are in some way related. When looking more carefully at the results it can
be stated that the brand Kuyichi underperforms. The number of purchases is lower than expected and the
number of switches is higher than expected. This leads to a higher proportion of switches per purchase than
expected. Secondly, when looking at the brand G-Star, it can be stated that it performs beyond expectations,
with a higher number of purchases and a lower number of switches than expected.
Considering the above, it can be firmly concluded that the Kuyichi customer does not act more loyal than the
G-Star customer, in fact the reverse is true.
5.3.3 Distribution of Switches
To get more insight in were the differences occur, a distribution is made (same as for H1.1.1 and H1.1.2) By
doing this, the customer group will be divided on their switching behavior. In the next table, the number of
switches are assigned to the number of customers.
Table 12 Switching behavior per brand
Table 12 shows that the number of switches for Kuyichi is less than three for 85.6%. However this seems like a
good results, this is only caused by the fact that the Kuyichi customer purchased the brand a few times.
Therefore the chance of a high number of switches will become smaller. The same can be said for the brand
GSUS. About 20% of G-Star customers has switched more than twice, which is the highest percentage
compared to the other two brands. However, since also over 45% have purchased the brand more than twice
(intensive buyers) during the last 6 years (table 10), the switching behavior is not that intensive. It only shows
that about 50% of the loyal customers of G-Star have also tried other brands as well. This finding is in line with
the correlation coefficient (0.514) that was discussed in section 5.2.2 This value of the correlation coefficient
Switching behavior Kuyichi % of total G-StAR % of total GSUS % of total
Low switch (0-2) 1295 85.6% 2812 80.7% 1140 87.4%
Medium switch (3-4) 154 10.2% 389 11.2% 108 8.3%
High switch (5,<) 63 4.2% 283 8.1% 57 4.4%
Total households 1512 100.0% 3484 100.0% 1305 100.0%

43
showed that when a customer purchases G-Star, half of the times he/she will also purchases a Kuyichi product
(ratio 2:1). So of a total of three purchases, two will be of the brand G-Star and only one of Kuyichi, which
exactly corresponds to the 50% switches.
From the above analysis, it can be concluded that the Kuyichi customer switches more often when compared
to the G-Star customer. The brand Kuyichi therefore has a lower retention rate and only one possible
conclusion can be drawn:
H1.2.1 “If a customer buys a fair-trade brand, it is significantly less likely that he/she will consecutively switch
to another brand”. REJECTED
5.3.4 Limitation variable Switch
As also was discussed in the methodology, an important limitation of the variable switches is the fact that
switches can be counted double (see page paragraph 4.2.1). To combat this, the number of switches back
should be excluded from the data. In this way the negative effect of the double switch will be minimized. By
doing this, it can be expected that the conclusions that were made in section 5.3.1, and especially for the
category low brand loyalty, will be weakened. Simultaneously this leads to the final goal of this extra section: to
give a more realistic view of the outcomes of hypothesis H1.2.1.
5.3.5 Single Purchases
In the next table the number of customers with single purchases are shown. Also in this table, the brand GSUS
is shown in order to compare the two brands with a neutral brand.
Table 13 Number of customers with single purchases
As is shown in the previous table, the percentage of single purchases of Kuyichi is 54.9% and for GSUS 58.2%.
Both percentages are quite high in comparison with the 35.5% of G-Star. In line with earlier results in this
report, these figures also confirm that the average G-Star customer more often purchases more than one
product compared with Kuyichi and GSUS customers.
With this information we can make a new table that will subtract the number of single purchases only from the
number of switches (see table 14).
Single purchases per household Kuyichi G-StAR GSUS
Household with single purchases 830 1238 760
Total households that purchases the brand 1512 3484 1305
Percentage Single purchases of total 54.9% 35.5% 58.2%

44
Table 14 Switches minus single purchases
This table shows that, when excluding the number of single purchases, G-Star’s largest group of customers
(70.1% of the total) have only switched 0-2 times. For Kuyichi this number is 68.2%. The difference is not that
large, but when considering the fact that the average number of purchases of G-Star is about twice as high as
for Kuyichi’s customers, the number of switches for G-Star was expected to be higher. Therefore, it can be
stated that the G-Star customer relatively switches less often than the Kuyichi customer, which agrees with the
previous findings. So even when the number of switches is adjusted for the number of single purchases, the
outcome remains the same.53
H1.2 “Using a fair-trade production process leads to a customer with a significantly higher ‘retention rate’54
”.
REJECTED
5.4 Conclusion behavioral loyalty
From the analysis one has to conclude that G-Star has a much more loyal customer group than Kuyichi.
Therefore the hypothesis that fair-trade customers show much more loyal behavior compared to the
consumers of normally produced goods must be rejected.
Continuously repurchases: G-Star has a higher number of continuously repurchases comparing to Kuyichi. There
are two obvious explanations for this finding that can be derived from the analyzed data. First it can be
concluded that G-Star is already a mature brand and has its own strong customer group, think of the 20/80 rule
that is proved. Secondly Kuyichi has a lot of new customers, what will lead to a high number of purchases but a
low number of repurchases. Considering the growth rates, it is very plausible to think that these findings will
change over time and the customers of Kuyichi will show more loyal results in the future. Therefore it can be
stated that perhaps this analyzes is done a little bit too early to make a fair comparison of both brands.
53
Additional: Insight in the single purchases will not only adjust the previous results, but it will also show how often a customer switch to your brand. This can be interesting because in that case it will give the brand an opportunity to stick their feet between the door and conquer the customer. So simultaneously it can be stated that if a brand shows a high number of single purchases, it can be seen as an opportunity to steal customers away from their competitor. However, it should not be forgotten that since it remain single purchases, they failed to concur them. When looking at the absolute numbers of all brands, it can be concluded that all brands show large amount of single purchases, what indicates a not loyal market. Brands should try to improve the retention rate with marketing campaigns. 54
Total number of purchases (%) – the number of ‘churns’(%) = Retention rate (%) [100% - X% = Retention rate]
Switching behavior Kuyichi % of Total G-StAR % of Total GSUS % of Total
Single purchases 830 *********** 1238 *********** 760 ************
Low switch (0-2) 465 68.2% 1574 70.1% 380 69.7%
Medium switch (3-4) 154 22.6% 389 17.3% 108 19.8%
High switch (5,<) 63 9.2% 283 12.6% 57 10.5%
Total households 682 100.0% 2246 100.0% 545 100.0%

45
Conclusion repurchases discontinuously: Concluding it can be stated that also for the discontinuously
repurchases, the G-Star customers show much more loyal behavior than the Kuyichi customer. Since this
variable doesn’t give information about the progress of this repurchases over time, it cannot be stated whether
the Kuyichi customer does perform better in the last few years of worse. But considering the information about
the repurchases continuously, it can be assumed that most of the Kuyichi’s purchases were done in the last
couple of years. Therefore it would be wise to measure the repurchases in five years again and see if there is
still such a large difference. With the previous information, it can be assumed that the difference with G-Star
will be smaller over time. Nevertheless, at this moment, it cannot be proved that Kuyichi has a more loyal
customer group because of the fair-trade production process, hence the hypothesis must be rejected.
Switches: When analyzing the number of switches, it can be stated that also here G-Star showed better results
than Kuyichi. Kuyichi’s number of purchases were lower than expected but the number of switches were above
expectations. Even when the switches were adjusted to the single purchases, the outcomes remain the same.
The Kuyichi customer still showed less loyal behavior comparing to the G-Star customer.
Considering all the previous findings, it can be said that only one conclusion is right: The G-Star customer
shows much more loyal behavior than the Kuyichi customer, when taking into consideration repurchases and
retention rate. SO:
H1: “Using a fair-trade production process leads to a customer with a significant higher level of behavioral
loyalty”. REJECTED
Results versus Theory: To implement this findings in the theory that was discussed in chapter 2, both brands
will be classified in the matrix of Dick & Basu. With estimating the level of repeat patronage, half of the matrix
is already filled in. Considering all findings of chapter 5, it can be concluded that on this moment Kuyichi shows
low repeat patronage, and G-Star shows high repeat patronage (see figure 4). As is discussed it is very likely to
assume that the repeat patronage of Kuyichi will increase considering the growth rates for as well the
purchases as the repurchases.
Figure 4 Loyalty matrix (only behavioral loyalty is included)
Relative attitude
Repeat patronage
High Low
Kuyichi G-Star

46
Chapter 6 Investigation Part 2: Attitudinal Loyalty
As mentioned in chapter 4, the investigation will be divided in two parts: behavioral – and attitudinal loyalty.
The previous chapter (investigation part 1) discusses the behavioral attitude. In this chapter the level of
attitudinal loyalty, which was described in section 4.3, will be determined.
6.1 Introduction
The following hypothesis will be analyzed in this chapter:
H2: “Using a fair-trade production process to a product, leads to a customer with a significant higher level of
attitudinal loyalty”.
As is explained in chapter 4, this hypothesis is too general to test. It will be divided in three focus areas: brand
knowledge, relative attitude (as well the strength as the differentiation) and the Word of Mouth intensity. This
classification is based on the CBBE-matrix. As is shown in the hypotheses, it is assumed that the fair-trade
brand shows a higher level of attitudinal loyalty. Consequently it is also assumed that all three focus areas will
show better results for the fair-trade brand. By investigating all these levels, differences between both brands
(whether this is in favor of the fair-trade brand or not) will be clear. Simultaneously it is possible to give
specific recommendations at each level.
6.2 Brand Knowledge
Brand knowledge is the first level of the CBBE-matrix. Before loyalty can be achieved, the consumer needs to
know the brand. Therefore this investigation will start with testing whether there is a difference in brand
knowledge between both brands. To do so, the following hypothesis will be tested.
H2.1: “Using a fair-trade production process leads to a customer with a significant higher level of (passive and
active) knowledge of the brand”.
6.2.1 Level of passive knowledge
Knowledge can be divided in passive- and active knowledge. To answer this hypothesis, the differences
between passive and active knowledge of both brands should be established. To start, the level of active
knowledge of both brands will be compared. This comparison can be done by using the Chi Square test. In
short, it can be stated that this method measures the differences between two categorical variables. The used
in the Chi Square test is: Brand Knowledge Yes/No. In exhibit 20 the results of this test are shown.
The output shows that the P value is not significant (P>0.05). Although the Chi Square test does not show
significant results, it is too premature to state that there is no difference in the knowledge level. Since the P
value is only 0.125, there are some differences between the two groups, but not significant.

47
The absolute numbers show that the brand G-Star has an awareness level of 87%55
, compared to a brand
awareness of 70%56
for Kuyichi. This shows that the brand G-Star is better known among the group of
customers. Secondly the output shows that the double answer categories (categories 0-0 and 1-1) score above
expectation whereas the other two categories scored below expectation. This implies that if a person is in a
certain way involved with one of the brands, it is likely that he/she will know both brands. So in other words
this means that most respondents are very involved with fashion. This is not surprising since all respondents
are regular customers of the retail store.
From the above analysis, it can be concluded that although the passive knowledge does not significantly differ,
the absolute numbers do differ: G-Star 87% and Kuyichi 70%. So:
H2.1: “Using a fair-trade production process leads to a customer with a significantly higher level of passive
knowledge of the brand”. REJECTED
6.2.2 Level of active knowledge
Besides the level of passive knowledge, the total knowledge level also consists of the active knowledge level.
The active knowledge level refers to the amount of information about a brand that a customer has (Wood,
1982). In this survey the active knowledge level will be measured by means of associations. In the survey
several associations were given and the respondent had to choose between one and fours associations per
brand57
(see table 15 on the next page). Not only the number of associations, but also the choice distribution
among the associations is important. It is assumed that without any knowledge of the brand a respondent will
have no associations. But it is also assumed that the better the knowledge, the clearer the associations. For the
group of customers with a level of knowledge of the brand, it is expected that they would choose the same
associations. The distribution of the associations will give insight in the Points of Parity and the Points of
Difference (see page 32). The results of both levels will give insight into whether the brand has a high or low
level of active knowledge. Secondly, with this information it is possible to give more accurate
recommendations to the fair-trade brand how to improve their knowledge level.
First the number of associations per brand will be compared, which will give insight into the number of
respondents with active brand knowledge. In exhibit 21 a paired sample T-Test is done. Since a disadvantage of
the T-test is that it does not correct for differences in groups (it uses one N, limitation 5), a selection was made.
Only the respondents that already had active knowledge of G-Star are included to test the associations of G-
Star. The same is done for Kuyichi. This elimination of respondents without any active knowledge of the brand
55
Branding Rate G-Star: 96/110= 87,3% 56
Branding rate Kuyichi: 77/110 = 70% 57
None of the associations that were given were incorrect. Each element stood for a part of the total brand, namely: the assortment, the core values (of both brands) and best value for money. The only exception was the association Fair-trade, because only Kuyichi produces Fair-trade and G-Star does not.

48
is done to get a fair comparison, since it is logical that when the brand is unknown, the respondent does not
have any associations.
With a P-value of 0.000, it can be concluded that, even after correction, the number of associations significantly
differs between two brands. G-Star has an average of 2.6 associations compared to a mean value of only 2.2
associations for Kuyichi. The results show that the number of associations is significantly higher for G-Star than
the number of associations for Kuyichi. To conclude it can be stated that:
H2.1: “Using a fair-trade production process leads to a customer with a significantly higher level of active
knowledge of the brand”. REJECTED
Distribution of the number of associations
Next to the number of associations, it is also very important for a brand to have clear associations. First the
Points of Parity should be clear, followed up by strong, favorable and unique Points of Differences. As the next
table shows that both brands are seen differently.
Table 15 Number of associations per brand
Associations Kuyichi G-Star
Assortment Jeans (PoP) Accessories (PoP) Shirts (PoP)
136 100 10 26
312 178 34 96
Core value Trendy (PoP/PoD)
30 30
84 84
Value for money Expensive (PoP) Organic (PoD)
100 28 72
100 86 14
Fair-trade Fair-trade (PoD)
84 84
6 6
None 74 22
Total 424 – 74 = 350 520 – 22 = 498
Over 65% of the respondents does not know that Kuyichi is 100% organic.
Only 6.4% of the respondents knows that G-Star also has an organic line.
G-Star (81%) is much more seen as a Jeans brand than Kuyichi (45%).
A larger proportion of respondents seems to know that G-Star also has accessories and shirts, so a large
variety of products. In fact both brands offer the same range of products.
74 respondents do not have any association for Kuyichi at all, contrary to only 22 for G-Star
39% of the respondents see G-Star as an expensive brand, contrary to only 13% for Kuyichi.
G-Star is more seen as a trendy brand compared to Kuyichi.
84 respondents know that Kuyichi was fair-trade. This is about 50% of all the respondents with brand
awareness.
49
When looking at the above results, not only the number of, but also the kind of associations that the
respondents had differs. The associations for G-Star are divided among three core values: expensive, trendy
and jeans. Contrary to that, Kuyichi is seen as an organic fair-trade jeans brand, but with less convincing
numbers. To get more convincing numbers, and hence improve the passive and active knowledge, Kuyichi has
to send a clearer and stronger message (think about the unique, strong and favorable associations which were
discussed at page 32). Subsequently, to create some advantages of the fair-trade production, improvements in
this number should be made. However, as is discussed in paragraph 4.3.2.2, a brand should first have good
Points of Parity (jeans, good quality, trendy) before communicating the Points of Distribution (fair-trade,
organic, excellent quality).
6.2.3 Conclusion
Given these findings, it can be concluded that the passive and active knowledge of G-Star and Kuyichi does not
differ significantly. The insignificant differences that exists are even in favor of G-Star instead of the fair-trade
brand Kuyichi. Therefore it can be said with certainty that no evidence was found to support the hypothesis:
H2.1: “Using a fair-trade production process leads to a customer with a significantly higher level of passive and
active knowledge of the brand”. REJECTED
6.3 Brand Attitude
Brand attitude is the second level in the CBBE-matrix. It is very important for a brand to create a positive
attitude among consumers. However only achieving this is not enough. The consumer should also have a
positive attitudinal differentiation. This means that he/she should prefer your brand over all its competitors.
The combination of both can be defined as the relative attitude. In this section the difference of the relative
attitude, so both attitude strength as attitude differentiation, between both brands will be investigated. This
will be done by testing the following hypothesis:
H2.2: “Using a fair-trade production process leads to a customer with a significantly higher level of relative
attitude in favor of the fair-trade brand”.
6.3.1 Attitude strength
Relative attitude consists of attitude strength and attitudinal differentiation. In this section the attitude
strength will be determined. This will be done by testing the following hypothesis:
H2.2.1: “Using a fair-trade production process leads to a customer with a significantly higher attitude strength
in favor of the fair-trade brand”.

50
Several methods can be used to establish the attitude strength. In this survey the attitude strength will be
determined by means of the extreme attitudes (E. M. Pomerantz, S. Chaiken and R. S. Tordesillas, 1995)., which
is earlier discussed on page 31. Similar to knowledge and importance, extreme attitudes are more resistant to
social influences (Osgood & Tannenbaum, 1955; Petersen & Dutton, 1975), and therefore a good way to
measure loyalty. To do so, a statistical test will be done with the aim to establish whether there is a difference
between the number of extreme attitudes of both brands. The hypothesis will test whether the number of
extreme positive attitudes is higher for the fair-trade brand Kuyichi compared to G-Star.
Extreme attitudes
The respondent can choose from five categories (see exhibit 16 questions 7 and 8). The two most extreme
options are assumed to be the extreme attitudes: ‘Very positive’ and ‘Very negative’. To establish whether
there is a difference, a Chi Square test will be done. The H0 states that there is no difference, so the
respondents have the same extreme attitudes for Kuyichi as for G-Star.
First the descriptives of the extreme attitudes per brand will be analyzed. When looking at the values of both
brands, it becomes evident that the outcomes hardly differ. The descriptives show that, when using the
complete dataset, 38 respondents have an extreme attitude towards Kuyichi and 40 towards G-Star.
Table 16 Descriptive extreme attitudes
To test whether the extreme attitudes significantly differ between the two brands, a Chi Square test will be
done. Since one of the assumptions of the Chi Square is that in each cell the expected value should be bigger
than 5, and this is not the case for ‘Very Negative’, this variable has to be excluded from the test.
In exhibit 22 the results of the Chi Square test are shown. It shows a significant value (p < 0.05), which indicates
that both attitude strengths are not equally distributed. Therefore the H0 will be rejected. When looking more
carefully at the scores, it can be concluded that the main reason for showing a significant level of only 0.002 is
that 154 respondents have normal attitudes for both brands. This is on its own not surprising, but statistically,
when looking at the values in all other boxes, it is a very high score. Therefore this box really affects the results
of the Chi Square test. To combat this, the values that were in the test should be analyzed. Secondly, the
knowledge level (as described in paragraph 6.1) can influence the number of respondents with a strong

51
attitude. Therefore, besides only looking at the numbers in the crosstabs, these numbers should also be
adapted to the number of respondents with brand knowledge58
.
Table 17 Calculations extreme attitudes per brand
Absolute values G-Star Kuyichi
Number of respondents with an
extreme attitudes
40 38
Number of respondents with
brand awareness
192 154
% with extreme attitudes 20.8% 24.7%
As table 17 shows, when adjusting the number of respondents with an extreme attitude to the number of
respondents with brand knowledge, the proportion for Kuyichi is larger than the proportion for G-Star. So it
can be said that Kuyichi shows more extreme attitudes or Kuyichi has a higher penetration of extreme
attitudes. Absolute the number of extreme attitudes for G-Star is higher, but relatively Kuyichi scores higher.
Although the test was effected by the high number of respondents with normal attitudes for both brands, it
can still be concluded that Kuyichi scores relatively higher for the extreme attitude scores. Therefore the
hypothesis that fair-trade leads to a customer with a higher attitude strength will be accepted:
H2.2.1: “Using a fair-trade production process leads to a customer with a significantly higher attitude strength
in favor of the fair-trade brand”. ACCEPTED
6.3.2 Attitudinal differentiation
As discussed in the previous section, relative attitude consists of attitude strength and attitudinal
differentiation. In this section the attitudinal differentiation will be tested. The attitudinal differentiation will
show whether the correspondent prefers one of the two brands. In this thesis it is assumed that the consumer
prefers the fair-trade brand Kuyichi over G-star. To do so, the following hypothesis will be tested:
H2.2.2: “Using a fair-trade production process leads to a customer with a significantly higher attitudinal
differentiation in favor of the fair-trade brand”.
58
The adjustment is based on the assumption: when the respondent has no brand awareness, it cannot have any associations and/or attitudes.
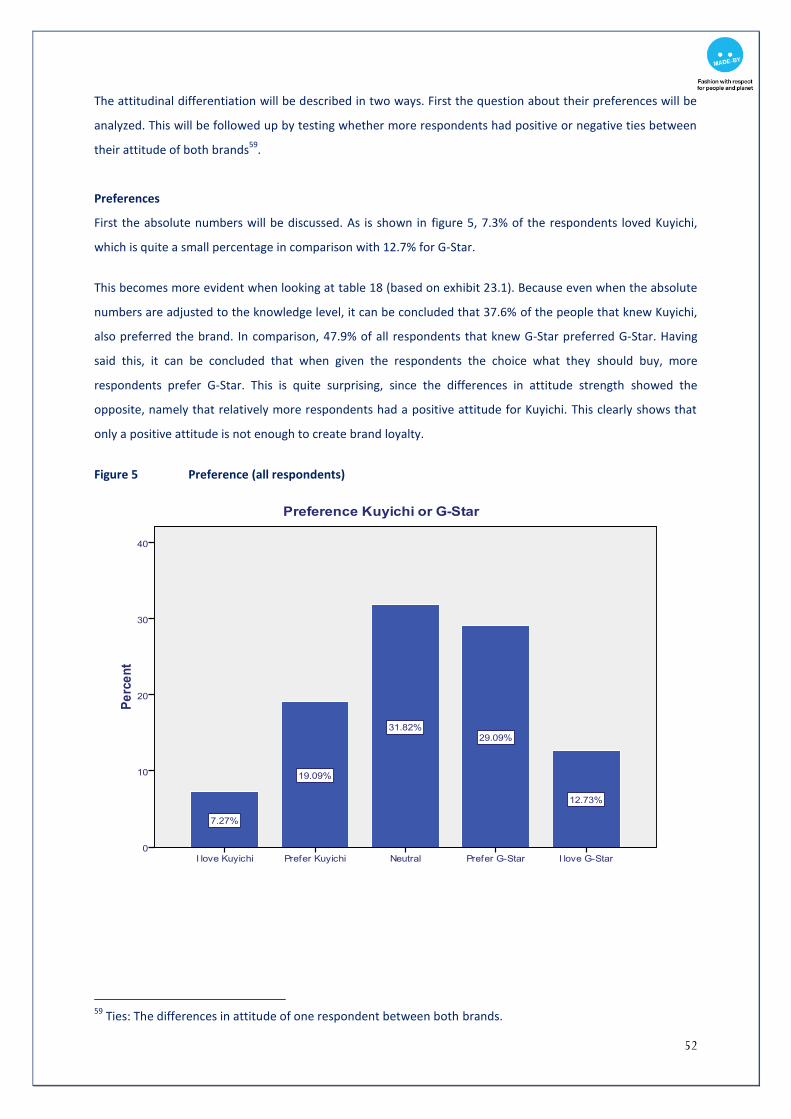
52
The attitudinal differentiation will be described in two ways. First the question about their preferences will be
analyzed. This will be followed up by testing whether more respondents had positive or negative ties between
their attitude of both brands59
.
Preferences
First the absolute numbers will be discussed. As is shown in figure 5, 7.3% of the respondents loved Kuyichi,
which is quite a small percentage in comparison with 12.7% for G-Star.
This becomes more evident when looking at table 18 (based on exhibit 23.1). Because even when the absolute
numbers are adjusted to the knowledge level, it can be concluded that 37.6% of the people that knew Kuyichi,
also preferred the brand. In comparison, 47.9% of all respondents that knew G-Star preferred G-Star. Having
said this, it can be concluded that when given the respondents the choice what they should buy, more
respondents prefer G-Star. This is quite surprising, since the differences in attitude strength showed the
opposite, namely that relatively more respondents had a positive attitude for Kuyichi. This clearly shows that
only a positive attitude is not enough to create brand loyalty.
Figure 5 Preference (all respondents)
59
Ties: The differences in attitude of one respondent between both brands.

53
Table 18 Number of respondents with preferences for each brand (adjusted to knowledge level)
Kuyichi % with knowledge60
G-Star % with knowledge61
Preference (I prefer) 42 27.2% 64 33.3%
Strong preference
(I love)
16 10.4% 28 14.6%
Total 58 37.6% 92 47.9%
Test higher attitudes
To underpin these findings, a Wilcoxon Signed Rank test will be done. The Wilcoxon Signed-rank test is non-
parametric and is used in situations in which there are two sets of scores to compare, but these scores come
from the same participants. Basically it measures the differences between scores in the two conditions (or
variables) that are compared. In this situation these two conditions are the attitudes of one respondent
towards G-Star and Kuyichi. The output shows the number of positive and negative ranks between both
attitudes. In other words it shows in how many cases the first variable was larger than the second, and vice
versa. This test is a good way to measure the attitude differentiation, since it shows how many respondents
have the opinion that G-star is better than Kuyichi and vice versa.
As is shown in the output (exhibit 23.2), for 44 respondents of a total of 220, ‘G-star negative-positive’ was
smaller than the ‘Kuyichi negative-positive’. In other words this means that in 44 times the respondent gave G-
star a more positive attitude than Kuyichi. Subsequently 80 of 220 times, the respondent gave Kuyichi a more
positive attitude than G-Star. A total of 96 respondents appointed the same score for both brands. This result is
quite surprising, since the just discussed descriptives of the preferences have shown the opposite.
The previous findings are based on the whole group of respondents, including those who had no knowledge of
the brand. To establish the effect of knowledge, the test was done again with the respondents with brand
knowledge. As is shown in exhibit 23.3, the results are very different. The test does not show any significant
values (P>0.05). This is caused by the fact that only 40 respondents had a more positive attitude towards
Kuyichi than towards G-Star, which is only 50% of the outcomes of the previous test. Consequently this means
that a lot of respondents without any brand knowledge, said to have a more positive attitude for Kuyichi than
for G-Star. The previous can be explained by the fact that those respondents are influenced by the social norm
to answer very positive considering a fair-trade brand62
.
60
Kuyichi: (58/154)*100 = 37.7% 61
G-Star: (92/192)*100 = 47.9% 62
LIMITATION 7: LIMITATION 7: Respondents are willing to give the socially desirable answer, hence they will talk more positive about fair-trade than they act in reality. This affects the results of the attitudinal loyalty of Kuyichi (prediction > reality). It was tried to reduce this effect during the survey by not telling that this investigation will focus on fair-trade. Secondly, for both brands the same associations were shown (so also fair-trade for G-Star). In this way the respondents were not (or barely) influenced. Still the results show that the respondents gave socially desirable answers in the survey.

54
Results
However the results of the Chi Square test regarding attitude strength, show that the attitudes differ in favor of
Kuyichi, the descriptives of the ‘Prefer question’ and the Wilcoxon Signed rank test (when adjusted to the
knowledge level) showed the opposite. The only way to explain this contradiction in the results, is that
respondents are willing to give the socially desirable answer. So when asking about their attitude towards a
sustainable and fair-trade brand, they are more likely to answer positively. However when asking about their
own preferences (so closer to their individual purchase decision moment), many respondents answer with
their own preferred brand. This decision is less influenced by social norms, and more based on their individual
decision factors64
. In other words this shows that only a positive attitude is not enough for a brand. The brand
should translate this positive attitude to a desire to purchase the brand.
Having said this, it must be concluded that the attitudinal differentiation is in favor of G-Star, even with
conflicting results. This conclusion is drawn because the scores of the differentiations outweigh the scores of
attitude, since the preference score is closer to the actual purchase decision moment. So:
H2.2.2: “Using a fair-trade production process leads to a customer with a significantly higher attitudinal
differentiation in favor of the fair-trade brand”. REJECTED
6.3.3 Relative attitude
The combination of attitudinal strength and attitude differentiation will establish the relative attitude. As
discussed in chapter 2, relative attitude and repeat patronage are
the basis of the overall loyalty level. To determine the relative
attitude the table on the right should be completed for both
brands. All numbers are based on the crosstab ‘relative attitude’
that can be found in exhibit 24.
When looking at both tables, the most notable is that the total
amount differ. The total amount of respondents with a high
relative attitude for G-Star is much higher compared to Kuyichi.
This difference is caused by the fact that more people preferred G-Star, and therefore were shown in the
Relative Attitude table for G-Star (and weren’t shown in the table of Kuyichi). Having said this, the first obvious
conclusion to make is that more respondents preferred G-Star compared to Kuyichi.
64
Examples of those factors are: Price, quality, material, fit, color and brand.
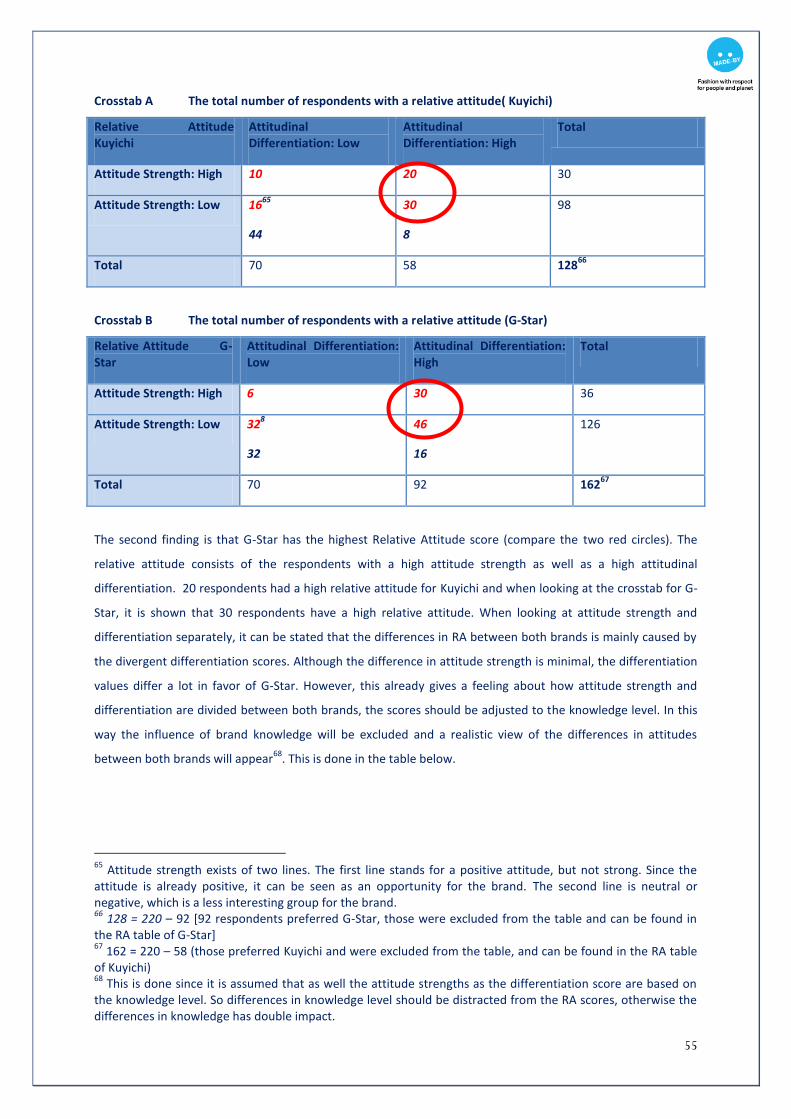
55
Crosstab A The total number of respondents with a relative attitude( Kuyichi)
Relative Attitude Kuyichi
Attitudinal Differentiation: Low
Attitudinal Differentiation: High
Total
Attitude Strength: High 10 20 30
Attitude Strength: Low 1665
44
30
8
98
Total 70 58 12866
Crosstab B The total number of respondents with a relative attitude (G-Star)
Relative Attitude G-Star
Attitudinal Differentiation: Low
Attitudinal Differentiation: High
Total
Attitude Strength: High 6 30 36
Attitude Strength: Low 328
32
46
16
126
Total 70 92 16267
The second finding is that G-Star has the highest Relative Attitude score (compare the two red circles). The
relative attitude consists of the respondents with a high attitude strength as well as a high attitudinal
differentiation. 20 respondents had a high relative attitude for Kuyichi and when looking at the crosstab for G-
Star, it is shown that 30 respondents have a high relative attitude. When looking at attitude strength and
differentiation separately, it can be stated that the differences in RA between both brands is mainly caused by
the divergent differentiation scores. Although the difference in attitude strength is minimal, the differentiation
values differ a lot in favor of G-Star. However, this already gives a feeling about how attitude strength and
differentiation are divided between both brands, the scores should be adjusted to the knowledge level. In this
way the influence of brand knowledge will be excluded and a realistic view of the differences in attitudes
between both brands will appear68
. This is done in the table below.
65
Attitude strength exists of two lines. The first line stands for a positive attitude, but not strong. Since the attitude is already positive, it can be seen as an opportunity for the brand. The second line is neutral or negative, which is a less interesting group for the brand. 66
128 = 220 – 92 [92 respondents preferred G-Star, those were excluded from the table and can be found in the RA table of G-Star] 67
162 = 220 – 58 (those preferred Kuyichi and were excluded from the table, and can be found in the RA table of Kuyichi) 68
This is done since it is assumed that as well the attitude strengths as the differentiation score are based on the knowledge level. So differences in knowledge level should be distracted from the RA scores, otherwise the differences in knowledge has double impact.
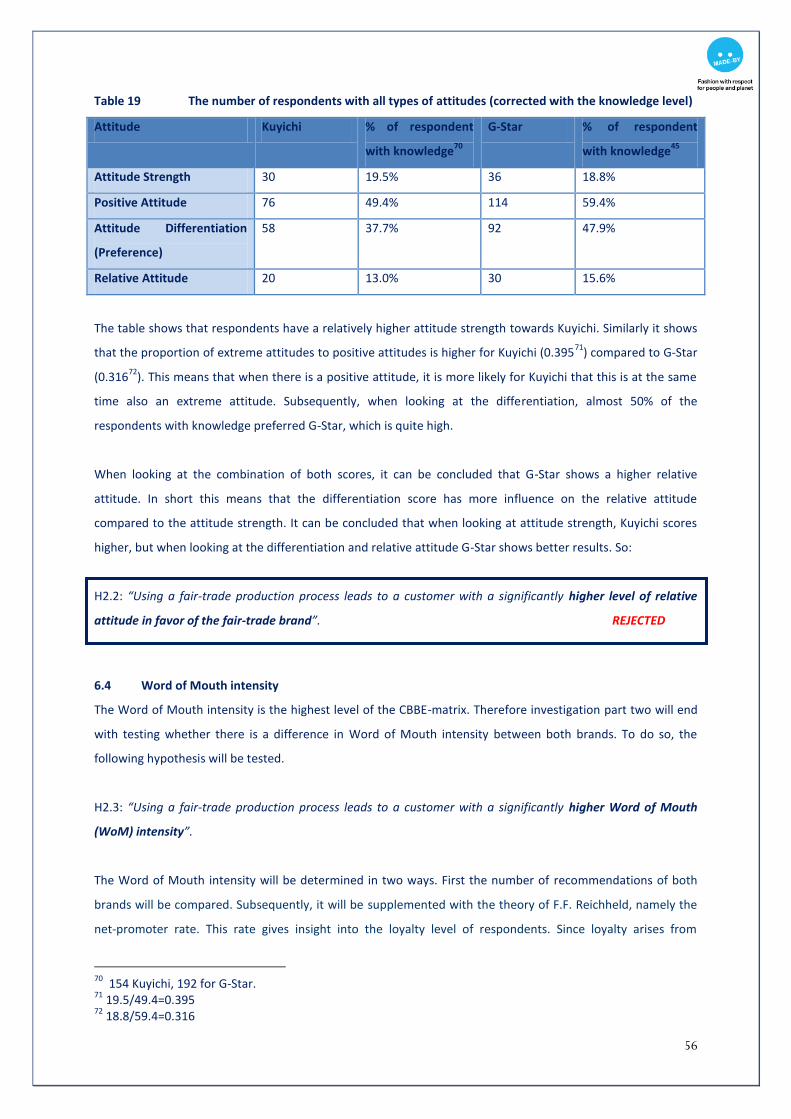
56
Table 19 The number of respondents with all types of attitudes (corrected with the knowledge level)
Attitude Kuyichi % of respondent
with knowledge70
G-Star % of respondent
with knowledge45
Attitude Strength 30 19.5% 36 18.8%
Positive Attitude 76 49.4% 114 59.4%
Attitude Differentiation
(Preference)
58 37.7% 92 47.9%
Relative Attitude 20 13.0% 30 15.6%
The table shows that respondents have a relatively higher attitude strength towards Kuyichi. Similarly it shows
that the proportion of extreme attitudes to positive attitudes is higher for Kuyichi (0.39571
) compared to G-Star
(0.31672
). This means that when there is a positive attitude, it is more likely for Kuyichi that this is at the same
time also an extreme attitude. Subsequently, when looking at the differentiation, almost 50% of the
respondents with knowledge preferred G-Star, which is quite high.
When looking at the combination of both scores, it can be concluded that G-Star shows a higher relative
attitude. In short this means that the differentiation score has more influence on the relative attitude
compared to the attitude strength. It can be concluded that when looking at attitude strength, Kuyichi scores
higher, but when looking at the differentiation and relative attitude G-Star shows better results. So:
H2.2: “Using a fair-trade production process leads to a customer with a significantly higher level of relative
attitude in favor of the fair-trade brand”. REJECTED
6.4 Word of Mouth intensity
The Word of Mouth intensity is the highest level of the CBBE-matrix. Therefore investigation part two will end
with testing whether there is a difference in Word of Mouth intensity between both brands. To do so, the
following hypothesis will be tested.
H2.3: “Using a fair-trade production process leads to a customer with a significantly higher Word of Mouth
(WoM) intensity”.
The Word of Mouth intensity will be determined in two ways. First the number of recommendations of both
brands will be compared. Subsequently, it will be supplemented with the theory of F.F. Reichheld, namely the
net-promoter rate. This rate gives insight into the loyalty level of respondents. Since loyalty arises from
70
154 Kuyichi, 192 for G-Star. 71
19.5/49.4=0.395 72
18.8/59.4=0.316

57
knowledge, followed with associations and attitude, the results of both tests considering WoM, should be in
line with the previous results. If not, the loyalty level is influenced by moderators like situational influences and
social norms (based on exhibit 3).
6.4.1 Number of recommendations
First the recommendation level of both brands will be compared. Since this is again a categorical nominal
variable, the Chi Square test will be used. The output of this test is shown in exhibit 25. It shows a significant
level of P<0.001, so therefore it can be said with certainty that both recommendation levels are not equally
distributed.
When looking more carefully at the results, it is shown that the scores of the No-No and Yes-Yes categories are
above expectation. Secondly both scores are very similar, 66 versus 68. This means that if a respondent
recommends one of the brands, it is likely that he/she will also recommend the other brand. This also applies
to no recommendations. Contrary to that, the other two boxes (Yes-No and No-Yes) are below expectation.
This indicates that the respondents are likely to have multi-branding-loyalty. Secondly it shows that the
absolute numbers are very different in favor of G-Star (60), when compared to Kuyichi (26). This suggests that
the main difference is caused by the high recommendation score of G-Star compared to the low score of
Kuyichi. Of course, to get the relative difference both scores should be adjusted to the knowledge level, see
next table. The table shows that even after adjusting the scores, G-Star shows a much higher recommendation
score comparing to Kuyichi.
Table 20 Recommendation adjusted to knowledge level
Recommendation adjusted Kuyichi G-Star
Recommendation scores 26 60
Adjusted to knowledge level 16.9%75
31.25%76
6.4.2 Net-promoter rate
In addition to the recommendation scores itself, most often the net-promoter rate is used to establish the
loyalty level. The net-promoter rate is based on the theory of F.F. Reichheld (2003). Promoters are seen as the
respondents that answered Certainly (equal to a score of 9-10). Detractors are the respondents that answered
Probably not and Never (equal to scores 0-577
). Tracking net promoters78
offers organizations a powerful way to
measure and manage customer loyalty. Firms with the highest net-promoter scores consistently garner the
lion’s share of industry growth (F.F. Riechheld, 2003).
75
26/154=0.169 76
60/192=0.3125 77
Normally the detractors also includes the answer category ‘maybe’. But since a lot of respondents did not know the brand Kuyichi, and therefore have answered with maybe, this category is excluded from the rate. 78
The percentage of customers who are promoters of a brand minus the percentage who are detractors

58
Exhibit 26 shows the different amounts per category. Based on that information the net-promoter score will be
determined (shown in the table below). The rates are determined by dividing the number of promoters by the
number of respondents with knowledge of the brand. Therefore the rates are already adjusted to knowledge
level. In table X the results are shown.
Table 21 Net-promoter score
Kuyichi G-Star
Promoters 42 / 154 = 27.2 % 68 / 192 = 35.4%
Detractors 30 / 154 = 19.5% 48 / 192 = 25%
Net-promoter rate 7.7% 10.4%
These results show that when using the net-promoter rate, G-Star shows better results. Although the detractor
level of G-Star is higher, it is sufficiently corrected by the higher number of promoters. Therefore
improvements for G-Star can be done regarding detractors. Contrary to that, Kuyichi should improve its
number of promoters. All previous findings lead to the following conclusion:
H2.3: “Using a fair-trade production process leads to a customer with a significantly higher Word of Mouth
(WoM) intensity”. REJECTED
6.5 Conclusion Attitudinal Loyalty
As is discussed before, this hypothesis is too general to test. It will be divided in three focus areas: brand
knowledge, relative attitude (as well the strength as the differentiation) and the Word of Mouth intensity. This
classification is based on the CBBE-matrix. As is shown in the hypotheses, it is assumed that the fair-trade
brand shows a higher level of attitudinal loyalty. Consequently it is also assumed that all three focus areas will
show better results for the fair-trade brand. By investigating all these levels, differences between both brands
(whether this is in favor of the fair-trade brand or not) will be clear. Simultaneously it is possible to give
specific recommendations at each level.
Chapter 6 has discussed the attitudinal loyalty level of two brands: the fair-trade brand Kuyichi and the normal
produced brand G-Star. As is discussed in chapter 4, the attitudinal loyalty is divided in three focus areas.
Brand knowledge, relative attitude (as well the strength as the differentiation) and the Word of Mouth
intensity, which is based on the CBBE-matrix. The scores of all steps per brand are given in figure 6. The figure
makes it very obvious where Kuyichi and G-Star are related and where the brands differ from each other.

59
Figure 6 CBBE matrix
Kuyichi G-Star
The only step in the loyalty ladder where Kuyichi beats G-Star is the attitude strength. Although this seems like
a good result, the attitude strength is overruled by the low differentiation score of Kuyichi. It is very important
that customers are not only positive about the brand, but they should also prefer it over other brands.
Otherwise, they like it but they will not buy it, which is not favorable for a brand. Despite that, Kuyichi loses
significant ground in terms of brand knowledge. Since all further steps are based on the knowledge level, the
first thing to improve is this knowledge level. By this not only the passive knowledge level (so the brand
recognition) is meant, but also the strength of the associations. As is shown in the investigation, not only the
number of associations differs between the two brands, but also the distribution of associations. Respondents
have some strong associations with high scores when thinking about G-Star. Contrary to that, Kuyichi had a lot
of associations but no ‘winners80
’. This means that respondents do not really know what the brand stands for.
Subsequently this is translated in the low differentiation score. When the respondent is positive about a brand
(good Points of Parity), but does not really know the extra value (Points of Difference81
), he/she will not make
the purchase. The customer will choose a brand that has a strong values that suit their own identity. Logically
and finally, the recommendation value is also lower for Kuyichi than for G-Star. Since a recommendation puts
your own image on the block, customers will not recommend a brand that they are uncertain about.
80
A few strong, unique and favourable associations. 81
This was discussed in paragraph 4.3.2.2
Attitudinal Loyalty:
Medium 10.4%
Relative attitude
Medium 15.6%
Attitude Differentiation:
High 47.9% prefer G-Star
Attitude Strenght:
Medium 20.8%
Associations:
OK, clear meassages (3)
Knowledge level
High 87%
Attitudinal Loyalty:
Low 7.7%
Relative attitude
Low 13%
Attitude Differentiation:
Low 37.7% prefer Kuyichi
Attitude Strenght:
High 24.7%
Associations:
Medium,
Knowledge level
Medium 70%

60
Having said all this, currently, Kuyichi shows a lower attitudinal loyalty than G-Star, therefore:
H2: “Using a fair-trade production process to a product, leads to a customer with a significantly higher level of
attitudinal loyalty”. REJECTED
Results versus Theory
To implement all findings in a theoretical framework, both brands will be classified in the matrix of Dick & Basu.
In chapter 5 the repeat patronage has already been determined. In this chapter the attitudinal loyalty, hence
the relative attitude, is determined. All findings confirm that the customers of G-Star show a higher relative
attitude than the customers of Kuyichi.
Figure 7 Loyalty matrix
Relative attitude
(Attitudinal loyalty)
Repeat patronage (Behavioral loyalty)
High Low
High Loyalty
Latent Loyalty
Low Spurious loyalty No Loyalty
Although G-Star showed a higher percentage of relative attitude, both brands did not show very convincing
numbers.83
Therefore, both brands will be placed between high and low relative attitude. These low
percentages indicate that in the fashion market it is difficult to achieve a high level of relative attitude. But is
also indicates that not only Kuyichi should try to improve this level, but also G-Star should. Since this
investigation is focused on how to translate fair-trade in loyal customers, only recommendations for the brand
Kuyichi will be given in the chapter 7.
83
Because of this lack of clear results, an additional investigation is done to determine which factors do cause the loyalty of Kuyichi. Since this is not the main goal of this investigation, it is excluded from this report and shown in exhibit 28. However, the findings of this additional investigation will be included in the managerial implications for Kuyichi of chapter 7. LIMITATION 8: The data did not exist of enough situational influences (like promotion activities of the brands) and social norms (for example the difference in dress code at work per customer, some brand have higher models than other brands). The variables that are included in the additional investigation shown at exhibit 28, are affected by this lack of information in the data. The results of the effect of the included variables is therefore less reliable. Additional research should be done to map all social norms and situational influences that affect purchasing behavior of customers in the fashion industry.
Kuyichi G-Star
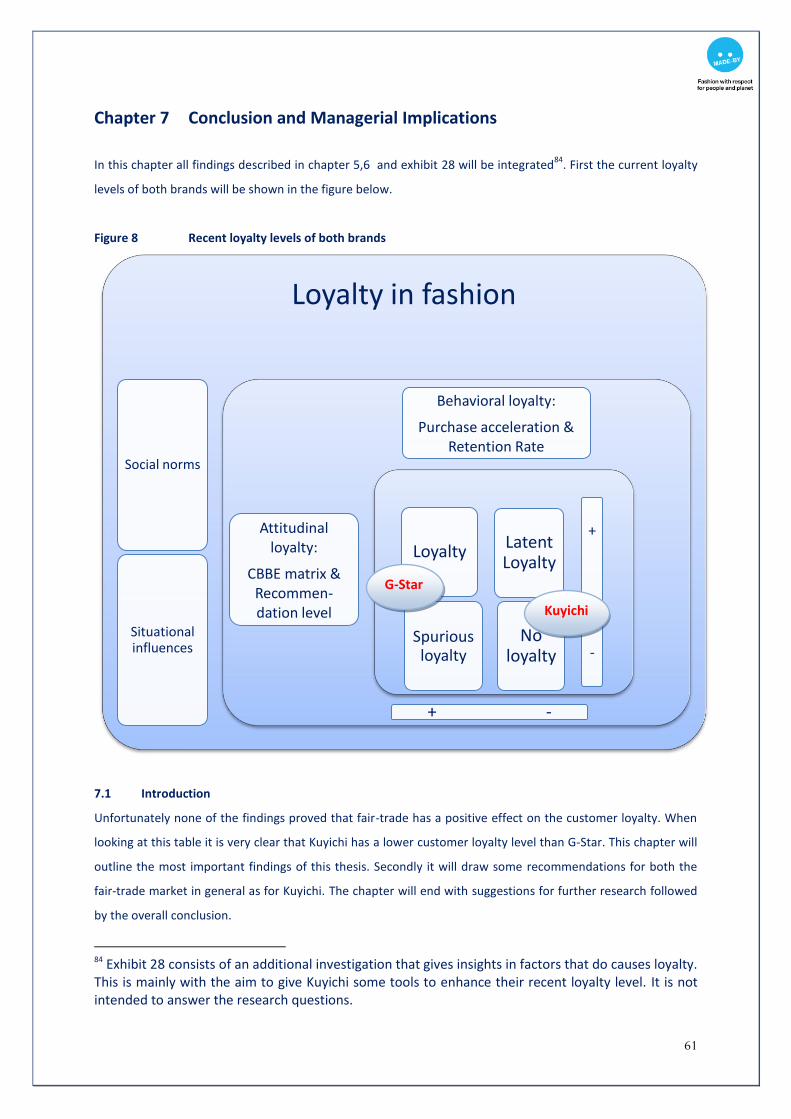
61
Chapter 7 Conclusion and Managerial Implications
In this chapter all findings described in chapter 5,6 and exhibit 28 will be integrated84
. First the current loyalty
levels of both brands will be shown in the figure below.
Figure 8 Recent loyalty levels of both brands
7.1 Introduction
Unfortunately none of the findings proved that fair-trade has a positive effect on the customer loyalty. When
looking at this table it is very clear that Kuyichi has a lower customer loyalty level than G-Star. This chapter will
outline the most important findings of this thesis. Secondly it will draw some recommendations for both the
fair-trade market in general as for Kuyichi. The chapter will end with suggestions for further research followed
by the overall conclusion.
84 Exhibit 28 consists of an additional investigation that gives insights in factors that do causes loyalty. This is mainly with the aim to give Kuyichi some tools to enhance their recent loyalty level. It is not intended to answer the research questions.
Loyalty in fashion
Social norms
Situational influences
Behavioral loyalty:
Purchase acceleration & Retention Rate
Attitudinal loyalty:
CBBE matrix & Recommen-dation level
+ -
Spurious loyalty
LoyaltyLatent Loyalty
No loyalty
+
-
Kuyichi
G-Star
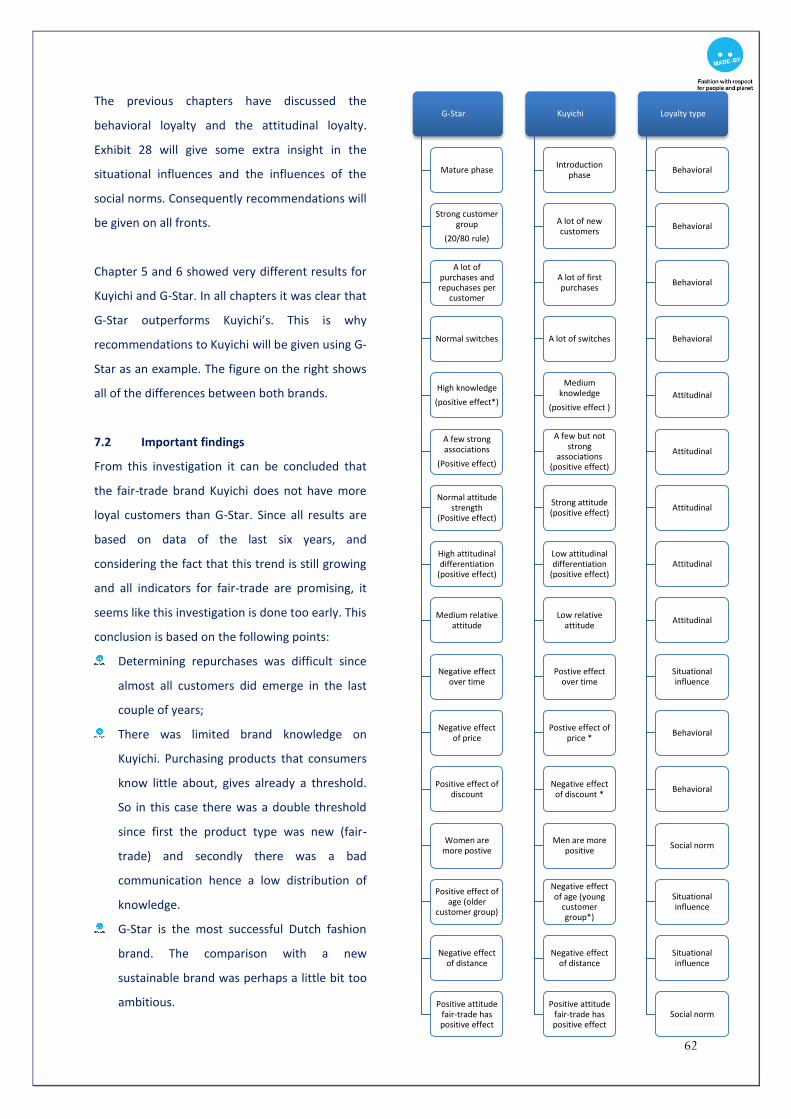
62
The previous chapters have discussed the
behavioral loyalty and the attitudinal loyalty.
Exhibit 28 will give some extra insight in the
situational influences and the influences of the
social norms. Consequently recommendations will
be given on all fronts.
Chapter 5 and 6 showed very different results for
Kuyichi and G-Star. In all chapters it was clear that
G-Star outperforms Kuyichi’s. This is why
recommendations to Kuyichi will be given using G-
Star as an example. The figure on the right shows
all of the differences between both brands.
7.2 Important findings
From this investigation it can be concluded that
the fair-trade brand Kuyichi does not have more
loyal customers than G-Star. Since all results are
based on data of the last six years, and
considering the fact that this trend is still growing
and all indicators for fair-trade are promising, it
seems like this investigation is done too early. This
conclusion is based on the following points:
Determining repurchases was difficult since
almost all customers did emerge in the last
couple of years;
There was limited brand knowledge on
Kuyichi. Purchasing products that consumers
know little about, gives already a threshold.
So in this case there was a double threshold
since first the product type was new (fair-
trade) and secondly there was a bad
communication hence a low distribution of
knowledge.
G-Star is the most successful Dutch fashion
brand. The comparison with a new
sustainable brand was perhaps a little bit too
ambitious.
G-Star
Mature phase
Strong customer group
(20/80 rule)
A lot of purchases and repuchases per
customer
Normal switches
High knowledge
(positive effect*)
A few strong associations
(Positive effect)
Normal attitude strength
(Positive effect)
High attitudinal differentiation
(positive effect)
Medium relative attitude
Negative effect over time
Negative effect of price
Positive effect of discount
Women are more postive
Positive effect of age (older
customer group)
Negative effect of distance
Positive attitude fair-trade has positive effect
Kuyichi
Introduction phase
A lot of new customers
A lot of first purchases
A lot of switches
Medium knowledge
(positive effect )
A few but not strong
associations (positive effect)
Strong attitude (positive effect)
Low attitudinal differentiation
(positive effect)
Low relative attitude
Postive effect over time
Postive effect of price *
Negative effect of discount *
Men are more positive
Negative effect of age (young
customer group*)
Negative effect of distance
Positive attitude fair-trade has positive effect
Loyalty type
Behavioral
Behavioral
Behavioral
Behavioral
Attitudinal
Attitudinal
Attitudinal
Attitudinal
Attitudinal
Situational influence
Behavioral
Behavioral
Social norm
Situational influence
Situational influence
Social norm

63
The fashion industry has to do with many more aspects than only price, quality and in this case fair-trade.
Many aspects influence the purchase decision, for example: personal taste, trends, stock out and other
situational influences. The data that was available did not include any of those factors. In this thesis it was
assumed that the only difference was the aspect fair-trade. Considering the large differences in results, this
does not seem very realistic. Further research should also include other factors.
Because of the limited results of this investigation regarding the effect of fair-trade on loyalty, only a few
managerial recommendations can be provided for the fair-trade market in general. In addition some
recommendations will be made for further research to investigate the possible connection between fair-trade
and loyalty (see section 7.4). Subsequently some recommendations will be given to the investigated brand
Kuyichi with the aim to get better marketing successes. In section 7.3 both managerial implications are
described.
7.3 Managerial implications
As discussed in the section before, it is difficult to give managerial implications for the fair-trade market in
general. This is mainly caused by limited results and the fact that fair-trade in fashion is still emerging. The data
that was analyzed was collected during the last six years. Considering the fact that the market in 2005 was very
different than the market of today, it would not be fair to use that as a comparison for the future. However, it
can be used to learn from the mistakes that were made in the past. First, recommendations will be given to the
fair-trade market in general. Thereafter, recommendations will be given to the brand Kuyichi in particular.
7.3.1 Managerial implications: fair-trade in fashion industry
It was clear that both investigations showed limited results. However, still some recommendations about the
fair-trade market in general can be made. The recommendations will be divided in behavioral and attitudinal
loyalty. Both are shown below.
Behavioral loyalty
Reward repurchases. Considering the fact that loyalty in fashion is difficult to achieve, it should be
rewarded. This can be done by means of a small discount or a special treatment (special sales nights).
Attitudinal loyalty
Communicate Points of Difference. Managers should be aware of the fact that the market is very
competitive. By only communicating the values fair-trade and sustainability, it will not win the war.
Brands should first communicate the required values very carefully: Points of Parity, think of good
quality, good fit, good price. Thereafter it should communicate its special value: Point of Difference,
think of fair-trade, organic or sustainability. Having done this, it will lead to a higher knowledge level

64
hence higher relative attitude hence higher attitudinal loyalty and consequently also to a higher level
of behavioral loyalty among customers.
Attract lead users86
(similar to promoters). Lead users are people who are creating the "innovations"
of the near future. Managers should select a small group of people that are lead users of the fashion
industry. This group should become the promoters of the brand. Important is that the consumers in
this group will share their opinions and experiences with a lot of people. The brand should invest in
this group: make them enthusiastic and communicate very carefully the Points of Parity and the Points
of Difference. By doing this the brand can create a snowball effect because the values that were
communicated to the lead users (promoters) will be widely spread. By doing this, the mass market will
soon be reached.
7.3.2 Managerial implications: Kuyichi
The previously discussed recommendations are applicable to all fair-trade brands in the fashion industry. Given
that this thesis has used the brand Kuyichi as an example, it will conclude with managerial implications or this
brand. The recommendations will be based on the results of chapter 5 and 6 and the additional investigation
that is shown in exhibit 28.
Behavioral loyalty
Encourage repurchases: The high number of switches and single purchases showed that true loyalty is difficult
to achieve and retain in the fashion market. However, it is clear that G-Star accomplished better results with
respect to behavioral loyalty than Kuyichi. If Kuyichi wants to increase its loyalty level, it should start with
encouraging repurchases. This can be done by giving a reward87
, for example with a loyalty card that gives a
small premium when purchasing the brand more than three times.
Price: The price of Kuyichi has a positive influence on the number of repurchases. There are two explanations
for this: (1) super strong loyalty or (2) demand is larger than supply. The first option is very unlikely, considering
the fact that all results proved the opposite. The second option can be the case. In this situations the brand can
do two things: (1) Increase productions levels till the breakeven point or (2) increase the price. In order to
remain competitive the first option is recommended. As is discussed in 7.2 the products should first establish a
good base (good price and quality) before the advantage of fair-trade can arise. Subsequently since Kuyichi has
already have been selling its product for this price, the risk of losing customers when increasing the price, is
also too large88
.
86
Lead users are people who are solving a problem or addressing a new market using products and services that are already available, but they are extending those products and/or services in ways that haven't been "approved" or considered by the firm producing the product or service. 87
This method is also discussed in exhibit 2 88
The fact that discount has a negative effect on repurchases can be explained by the same reason: supply < demand, and therefore stock out.
65
Attitudinal loyalty
Knowledge (active): The passive knowledge level of G-Star is higher for Kuyichi, but the difference is not very
large. When looking at the active knowledge level there are some large differences between both brands. The
respondents clearly knew better what the brand G-Star stands for, in comparison with Kuyichi. When looking at
the loglineair regression in exhibit 27.5, all associations have a significant positive influence on the attitudinal
loyalty. Therefore, if Kuyichi wants to improve its knowledge level, it should also communicate some (not
many) strong, favorable and unique associations (Keller and Tybout, 2002). By doing that, the active knowledge
level will increase which will have a positive influence on all other levels of the CBBE matrix. First, the Points of
Parity should be communicated properly. It should be clear that Kuyichi is also a trendy jeans brand of good
quality. When this message is clear, Kuyichi should differentiate the brand by communicating the Points of
Difference, for example by communicating the associations fair-trade and good quality (organic)89
. Having done
this, it is clear what the brands stands for, and Kuyichi can compete more effectively with all other brands90
.
Attitude: The results of the attitude strength were very positive with respect to Kuyichi. The problem is that this
positive attitude is not translated into attitudinal differentiation, so in a preference for the brand Kuyichi in
comparison with other brands. This means that when the customer proceeds to a purchase, he/she likes
Kuyichi but when comparing it with other brands he/she will prefer another brand. This is a big threat! To
combat this it is important that Kuyichi should communicate the Points of Difference very carefully. Then the
customer knows why to choose this brand over other brands. It is important that these Points of Difference are
something that the competitors do not offer (or in another way). Secondly it is important that it is an added
value, so not only something different but also something extra!
Word of Mouth: As is discussed in the theory of chapter 2, a very important indicator for the success of a brand
is the net-promoter rate. This rate is a good predictor for future growth. If Kuyichi succeeds in increasing the
knowledge level and attitudinal preference of consumers, then it is plausible to think that automatically the
net-promoter rate will also increase (the CBBE matrix shows that every level affects the next one). However,
this can be enhanced by creating more promoters or by decreasing the number of detractors. This theory is
similar to the theory of lead users. Lead users are very commonly used in the fashion industry. Mostly famous
people, employees of magazines or sometimes also employees of the fashion shops are chosen to promote the
brand since they communicate every day about fashion. This group can be seen as a large opportunity for
Kuyichi because if Kuyichi becomes their preferred brand, they will influence hundreds or even thousands of
other consumers. The most common way to do so is to find a well known actor/actress or singer to promote
the brand. But since Kuyichi has already attracted some famous people, it should be extended to also using
other groups. In my opinion the way to do so is to use the people that sell the brand. Those people are
89
The most obvious associations to choose are the ones with a positive beta: Jeans, fair-trade, Organic, T-Shirts. 90
A good way to communicate this values, is not by placing large billboards, but to communicate it very targeted. This can be done by means of sales people, since they can communicate carefully to the target group.
66
involved in the fashion industry so most of the time are well dressed, and maybe even more important because
they talk about the brand every day. Another advantage of choosing these people is that they are active in the
‘normal community’. This makes it easy for consumers to identify themselves with this group of people.
Common ways to achieve a higher number of promoters amongst people working in sales is by involving them
in the process by:
giving presentations about the production process,
inviting them to special events,
creating a fashion platform on the internet where they can find everything about the brand.
As a result of the above, it is expected that also the sales will increase, since the new lead users are directly in
contact with potential buyers. The lead users will share positive experiences and extra information with
potential buyers which will increase the likelihood of a purchase. In this way Kuyichi gets best of both worlds:
1. More promoters, and
2. Customers with a higher knowledge level and positive attitude.
Since the promoters are directly connected with potential buyers in the shop, it can be assumed that the
discussed effect will directly lead to higher sales.
Non-attitudinal sources
Increase over time: The growth rate and the effect over time show promising figures (see exhibit 11). This
shows that Kuyichi has done a good job in the past, which can give the brand some confidence. The fact that
Kuyichi grew with about 200% during the last five years should be regarded as a indicator of success. It could
also be used as a means to reduce the risk of the customer of purchasing new brand, because with such a high
growth rate, it must be a good brand.
The above does not mean that by doing nothing the brand will stay successful. It only indicates that the brand
has become more successful in the recent past. To maintain this level of success, Kuyichi should follow all other
recommendations that were discussed in this section.
Age & Gender: The age of consumers has a significant negative influence on the attitudinal loyalty (see exhibit
27.4). This means that mainly young people like Kuyichi. Kuyichi could try to enforce this by addressing
marketing campaigns to them, but it could also try to communicate to older people. Given that Kuyichi is still in
its growth phase, Kuyichi should first reach the early adopters/early majority91
(mostly young people in the
case of Kuyichi) which ultimately will overflow to the late majority.
The second difference between G-Star and Kuyichi is that men are more positive about Kuyichi than women,
and for G-Star it is the other way around. This does not need to be a problem, but considering that women are
91
Two phases of the product life cycle, Levitt T. (1965), also discusses on page 33.
67
a very important influence in the purchase process of men, (or in some cases they purchase for their
boyfriend/husband without his direct involvement), Kuyichi should focus more on women for both its
marketing communication and its products.
Positive attitude fair-trade: The attitude towards fair-trade was also included in the survey of chapter 6. The
results of this investigation show that there is a positive relation between positive attitude about fair-trade and
recommending Kuyichi (see exhibit 27.4). This means that this group of people (those who are positive about
fair-trade) can be potential buyers. To communicate to this group without spending high budgets, Kuyichi can
collaborate with other brands which offer trendy fair-trade or sustainable products. In this way they split costs
but still reach the right target group.
An outline of all the previous recommendations for Kuyichi is shown in figure 9. Each step will bring Kuyichi one
step closer to become a (more) successful sustainable brand.
7.4 Further research
As discussed earlier, it can be stated that this investigation is done a little too soon. However, results of this
thesis can support further research. Therefore some recommendations for further research are drawn below.
The recommendations are based on the results of investigations part one and two.
Investigate the effect of fair-trade on loyalty in the fashion industry, BUT only compare brands when both
are in the same stage (for example the growth/mature stage). For Kuyichi and G-Star this might be the case
in about 3-5 years.
o Focus on indirect and direct repurchases. The number of indirect repurchases says something
about the intensity of buying, whereas the number of direct repurchase tells something about the
individual changes over time.
Investigate the effect of fair-trade on different product categories: jeans, shirts, bags, etc. Is there a
connection between the price of the product and the influence of fair-trade?
Investigate the effect of fair-trade on other markets than the fashion industry. It is recommended to pick
an industry with few situational influences and social norms: for example simple food products. (Food
products are a good choice since it can be expected that it is less difficult to map all situational influences
and social norms for food products compared to the fashion industry. This because more research is done
regarding fair-trade in the food industry. Secondly it can be expected that the influence of social norms on
food is smaller compared to the influence of social norms on clothes.)
Which other factors do result in customer loyalty in the fashion industry? This investigation can be done by
making a regression with the number of repurchases as the dependent variable. The independent factors
are all available variables. This research will give insight into the situational influences and social norms of
the fashion industry. The result would be very interesting information for marketing managers since they
can influence these aspect with the aim to increase the loyalty level of customers.

68
The effect of each step of the CBBE matrix on customer loyalty. This would allow managers to guide the
level of loyalty by increasing certain aspects of the brand: knowledge, attitude or the overall intensity of
loyalty.
The interaction between attitudinal and behavioral loyalty. It would be interesting to investigate the effect
of attitudinal loyalty on the behavioral loyalty.
Figure 9 Recommendation Kuyichi in steps
92
92
Is most likely also applicable for other brands. However additional research should be done to be sure.
Target Group
•Focus on the early adopters/ early majority. These customers will communicate their experience hence reach the late majority.
•Work together with other companies that offer fair-trade or sustainable products in a trendy way.
good products
•Start with a good product for a good price
•More supply and no stock out
Knowledge
•The customers must acquire knowledge about the brand and its products (Strong Unique and .. associations: good jeans & shirt of good quality: organic (mention the advantages of organic)
•Communicate fair-trade as an extra value
Preference
•Compare Kuyichi with other brands and communicate the strong points hence advantages of Kuyichi
•The Points of Difference create attitudinal differentiation and if the associations fit the individual desires, he/she will prefer Kuyichi
Net-promoter rate
•Increase the amount of promoters (sales people): involve them by means of presentations, knowledge platform and events
Loyalty
•Reward loyalty: Achieve sustainable loyalty

69
7.5 Conclusion
To conclude, it can be stated that there is a very good future for fair-trade fashion brands. Nevertheless they
should realize that the fashion market is very competitive and they will have to compete with brands that have
been established for decades. Strong communication of the Points of Parity and Points of Difference to
(potential) customers is therefore essential. To get insight into the effect of fair-trade on customer loyalty,
further research should be done. It could be assumed that better data (of Kuyichi but also of other fair-trade
brands) is available in 3-5 years. In the meantime, younger brands have the chance to grow into a mature
brand. When fair-trade becomes a mature market a fair comparison can be made and the real effect of fair-
trade can be established.
70
Chapter 8 Limitations
LIMITATION 1: A large disadvantage of the variable “number of switches” is that it includes all switches that
were made by the customer. This may sound strange because in fact those switches are made, but it is crucial to
realize that in some situations the switch back is part of the first switch. In this case, the consumer can be said
to go back to the preferred (original) brand after a switch rather than making a switch to another brand (this is
illustrated in figure 2).
LIMITATION 2: The coincidence factor of choosing a G-Star product is higher considering the difference in supply
quantity.
LIMITATION 3: Unfortunately the loyalty card is sometimes used by more than one person. This may skew the
research results and therefore this limitation must be considered in the evaluation of the results.
LIMITATION 4: The fact that both brands are at different stages of the product life cycle (the growth stage for
Kuychi versus mature stage for G-Star) have affected the investigation results.
LIMITATION 5: It is important to consider the difference between the T-test within one group and the T-test
between two groups (see exhibit 9), namely that for the T-test within one group the N is the same. This means
that the number of repurchases of Kuyichi as well as of G-Star will be adjusted to one value of N. A large
disadvantage of this is that the number of purchases of G-Star are much higher than for Kuyichi. This leads to
results with a prejudice in favor of Kuyichi. This prejudice is caused by the fact that the proportion of Kuyichi will
be lower since it is adjusted to a much bigger N (in the previous test the number of repurchases was adjusted to
the number of purchases of the brand itself). Therefore it can already be said that this test will show customers
of Kuyichi to be less loyal than they are in reality.
LIMITATION 6: Another disadvantage of the T-test is that it will measure the differences between the two
customer groups in general. This means that it will not measure the buying behavior over time, but it will
measure all purchases per person in total. By doing this the measurements will be less valid, because actually
we want to measure whether the customer acts loyally, and whether this changes over time. This can be done
by measuring whether the number of repurchases has increased or whether the customer has switched a lot. So
a large pitfall of this measurement is that by using the overall number of purchases, a general view will occur of
the number of repurchases, but it is not clear if they were done separately or continuously or if they were done
in 2005 or 2010. In analyzing the results, this limitation should be included and considered.

71
LIMITATION 7: Respondents are willing to give the socially desirable answer, hence they will talk more positive
about fair-trade than they act in reality. This affects the results of the attitudinal loyalty of Kuyichi (prediction >
reality). It was tried to reduce this effect during the survey by not telling that this investigation will focus on fair-
trade. Secondly, for both brands the same associations were shown (so also fair-trade for G-Star). In this way
the respondents were not (or barely) influenced. Still the results show that the respondents gave socially
desirable answers in the survey.
LIMITATION 8: The data did not exist of enough situational influences (like promotion activities of the brands)
and social norms (for example the difference in dress code at work per customer, some brand have higher
models than other brands). The variables that are included in the additional investigation shown at exhibit 28,
are affected by this lack of information in the data. The results of the effect of the included variables is therefore
less reliable. Additional research should be done to map all social norms and situational influences that affect
purchasing behavior of customers in the fashion industry.
LIMITATION 9: When one customer makes a purchase that consists of more than one product, the data shows a
purchase and a repurchase despite the fact that those purchases were done at the same time. Although this is
not really a repurchase, since the loyalty level is investigated, and this situation still indicates loyal or not loyal
behavior, this is not a problem for the investigation: It is assumed that the customer does not act more or less
loyal when the repurchase is done on the same day or on separate days.
LIMITATION 10: The discussion above is also applicable to the variable “number of switches”. It is assumed that
the customer does not act more or less loyal when the switch is done on the same day or on separate days.
LIMITATION 11: The number of customers at any one time in the retail store was very unpredictable. The shop
had really busy moments, when the investigation could not be done. But it also had very quiet moments with
very few customers present in the store. These moments were the moments that the questionnaire was
conducted. The disadvantage of this is that the distribution of people who are included in the survey is affected.
The customers who were visiting the retail store during the weekends, are (generally speaking) not included in
the survey even though they account for a large percentage of the sales. The people that were included in the
survey were the people that in general do not work fulltime and were visiting the shop during the week. Most of
them (67%) were women. The average age of 33 years can be considered as normal.
LIMITATION 12: A disadvantage of this investigation is that the data of both parts of the investigation consists
of a limited number of variables. Therefore, it can occur that the results will show a positive relation between a
variable and customer loyalty, but in reality there is none. This is called apparent cohesion. The data based on
the variables that were included in this investigation is expected to be affected by this exclusion of some other
variables that could (potentially) influence customer loyalty . The previous is an important limitation and

72
therefore this investigation is only used to give more insight into the situation, but will not be included in the
main investigation.
Limitation 13: All data is acquired from customers in a single retail store. The results could be different when
choosing another store and city. However, considering the fact that the data consists of 35708 purchases made
by men and women of all ages, it can be assumed that this effect is insignificant.
LIMITATION 14: This investigation has only focused on two brands of jeans. It cannot be guaranteed that the
results are also applicable to other markets.
LIMITATION 15: This thesis did not investigate the effect of fair-trade for different product categories. This
effect can fluctuate (the effect of fair-trade on expensive goods or less expensive goods may be very different).
Additional
Additional: During this investigation the word fair-trade is used. As is described in chapter 3 it is very rare that a
brand offers a 100% fair-trade goods in the fashion industry. This is why an alternative of 100% fair-trade is
used in this investigation: the MADE-BY quality stamp (Blue Button). However the precise rules are different, the
idea is the same. Therefore it is assumed that this will not influence any results of this thesis.
73
Chapter 9 References Barrientos, S., Conroy, M. & Jones, E. (2007). Northern Social Movements and Fair-trade. In Raynolds, L.,
Murray, D. & Wilkinson, J. Fair-trade: The challenges of transforming globalization, (pp. 51-62). Oxon:
Routledge.
Belk, R.W. (1974). Application and Analysis of the Behavioral-differential Inventory for Assessing Situational
Effects in Buyer Behavior. In S. Ward and P. Wright (Eds.). Advances in consumer research. 1 (3): 370-80.
Business Dictionary. Lead Users. URL: http://www.businessdictionary.com/definition/lead-
users.html#ixzz17XS1VDFX (November 2010).
Cacioppo, J. T. and R. E. Petty, (1985). Central and Peripheral Routes to Persuasion: The Role of Message
Repetition. Eds. Linda E Alwilt and Andrew A. Mitchell. Hillsdale, N J:Lawrence Erlbanm. In Psychological
Processes and Advertising Effects: Theory, Research and Applications, 91-111.
Chaudhuri A. & M. B. Holbrook (2001). The Chain Effect From Brand Trust and Brand affect to Brand
Performance: The Role of Brand Loyalty. Journal of marketing 65 (April): 81-83.
Chi-Square Goodness of Fit Test. URL: http://www.stat.yale.edu/Courses/1997-98/101/chigf.htm (September
2010).
CiteMan Network (2006). Global Corporate Community And Knowledge-base. Points of parity and points of
difference. SALES/MARKETING MANAGEMENT. September 10. URL: http://www.citeman.com/990-points-of-
parity-and-points-of-difference (November 2010).
Day, G. S. and R. Wensley (1988). Assessing Advantage: A Framework for Diagnosing Competitive Superiority.
Journal of Marketing, 52 (4): 1-20.
Dick. A.S. and K. Basu (1994). Customer Loyalty: Toward an Integrated Conceptual Framework. Journal of the
Academy of Marketing Science, 22 (Spring): 99-113.
East, R. and J. Sinclair (2000). Loyalty: Definition and Explanation. ANZMAC 2000 Visionary Marketing for the
21st Century: Facing the Challenge, Kingston Business School and Phil Gendall, Massey University.
East Carolina University. Binary Logistic Regression with PASW/SPSS. URL: core.ecu.edu/psyc/wuenschk/MV/Multreg/Logistic-SPSS.doc (November 2010).
Engel, J. F. and R. D. Blackwell (1982). Consumer Behavior. The Dryden Press, (4). Chicago.

74
Fair-trade. Fair-trade Labelling Organizations International (FLO) . Tackling poverty and empowering producers
through trade, URL: http://www.fairtrade.net/facts_and_figures.html (June 2010).
FairTrade. Fairtrade Labelling Organizations International (FLO). Standards. URL: http://www.fairtrade.net/standards.html (June 2010).
Fazio, R. H. (1990). Multiple Processes by Which Attitudes Guide Behavior: The MODE Model as an Integrative
Framework. Ed. Mark P. Zanna. In Advances in Experimental Social Psychology, 23: 75-109. New York: Academic
Press.
Field A. (2005). Discovering Statistics Using SPSS. Second edition: 292-200. SAGE publications: London.
Frey, D. (1986). Recent Research on Selective Exposure to Information. Ed. Leonard Berkowitz. In Advances in
Experimental Social Psychology, 19: 41-80. New York: Academic Press.
Innovate on Purpose, OVO innovations blog site dedicated to ideas, conversations and approaches for
sustainable, repeatable innovation, Finding Lead Users for Innovation, URL:
http://innovateonpurpose.blogspot.com/2010/11/finding-lead-users-for-innovation.html (November 2010).
Keller, K.L. (2001). Building Customer-Based Brand Equity: A Blueprint for Creating Strong Brands. Marketing
Science Institute, Report Summary 01-107.
Keller, K.L., Sternthal B. & A. Tybout (2002). Three Questions You Need to Ask About You Brand. Harvard
Business Review, September.
Kumar, V. and D. Shah (2004). Building and Sustaining Profitable Customer Loyalty for the 21st Century. Journal
of Retailing, 80 (4): 317 – 330.
Kuyichi. Kuyichi love the world. URL: http://www.kuyichi.com/ (June 2010).
Levitt. T. (1965). Exploit the Product Life Cycle. Harvard Business Review, 43 (November - December) : 81-94.
Lutz, R.J. and P. Kakkar (1975). The Psychological Situation as a Determinant of Consumer Behavior. eds. Mary
Jane Schlinger, : Association for Consumer Research. Advances in Consumer Research. 2: 439-454.
Melnyk V. (2005). Creating Effective Loyalty Programs Knowing what (Wo-)Men Want. Tilburg: University of
Tilburg, Retrieved October 23, 2010 from http://arno.uvt.nl/show.cgi?fid=47035 (June 2010).

75
Maben A.F. Statistics for the Social Sciences. URL: http://www.enviroliteracy.org/pdf/materials/1210.pdf (September 2010).
MADE-BY. MADE-BY in het kort. URL: http://www.made-by.nl/downloads/madebykort.pdf (June 2010).
MADE-BY. MADE-BY Missie. URL: http://www.made-by.nl/madeby_missie.php?lg=nl (June 2010).
MADE-BY. MADE- BY Kuyichi. URL: http://www.made-by.nl/merk_kuyichi_result09.php?lg=nl (August 2010).
MADE-BY. MADE-BY Resultaten: URL: http://www.made-by.nl/madeby_result.php?lg=nl (June 2010).
MathWorks. Accelerating the pace of engineering and science. Chi2gof. URL: http://www.mathworks.com/help/toolbox/stats/chi2gof.html (September 2010).
Moore, W. L. and D. R. Lehmann (1980). Individual Differences in Search Behavior and Recall of Package
Information on a Nondurable. Journal of Consumer Research, 7: 296-307.
Narayandas, D. (2005). Building Loyalty in Business Markets. Tool Kit. Harvard Business Review, 83 (9): 131-139.
Nation Master. Encyclopedia. Unique Selling Point. URL: http://www.statemaster.com/encyclopedia/Unique-
selling-proposition (December 2010).
NSNI, National Social Norms Institute at the University of Virginia, URL:
http://www.socialnorms.org/FAQ/questions.php#whataresocialnorms (August 2010).
Newman, J. W. and R. Staelin (1972). Prepurchase Information Seeking for New Cars and Major Household
Appliances. Journal of Marketing Research, 9 (August): 249-257.
Oliver, R. L. (1980). A Cognitive Model of the Antecedents and Consequences of Satisfaction Decisions. Journal
of Marketing Research, 17 (November): 460-469.
Osgood, C. E. and P. H. Tannenbaum (1955). The Principle of Congruity in the Prediction of Attitude Change,
Psychological Review, 62: 42-55.
Peterson, K., & J. E. Dutton (1975). Certainty, Extremity, Intensity: Neglected variables in Research on Attitude–
Behavior consistency. Social Forces, 54: 393–414.
Pinnicle Management. Accelerating Results for Growing Businesses. Pareto Principle. How the 80/20 Rule
Helps Us be More Effective, URL: http://www.pinnicle.com/Articles/Pareto_Principle/pareto_principle.html
(August 2010).

76
Pomerantz, E. M., Chaiken S. and R. S. Tordesillas (1995). Attitude Strength and Resistance Processes, Journal of
Personality and Social Psychology, 69: 408-419.
PROZ the Translation Workplace. Customer Retention Rates, URL:
http://www.proz.com/kudoz/english_to_dutch/marketing/88011-customer_retention_rates.html (May 2010).
QuickMBA Marketing. Product Life Cycle, URL: http://www.quickmba.com/marketing/product/lifecycle/
(October 2010).
Reichheld F.F. (2003). The One Number You Need to Grow. Harvard business review, 81: 46-54.
Renard, M. C. (2003). Fair-trade: Qualitym Market and Conventions. Journal of Rural Studies, 19: 87-96.
Scott, W.A. (1986). Attitude Measurement. In G. Lindzey & E. Aronson (Eds.) Handbook of social psychology,
2 (2): 204-273. Reading MA: Addison-Wesley.
Shoemaker, S. and R.C. Lewis (1999). Customer Loyalty: the Future of Hospitality Marketing. International
Journal of Hospitality Management, 18 (4): 345-370.
Sixty Years of Fair Trade, A Brief History of the Fair Trade Movement, November 2006, URL:
http://www.european-fair-trade-association.org/efta/Doc/History.pdf (June 2010).
Solidaridad. Duurzaam produceren. Katoen. URL: http://www.solidaridad.nl/(June 2010).
Tanur, J.M. (1992). Questions about Questions : Inquiries into the Cognitive Bases of Surveys. New York: Russell
Sage Foundation.
Tesser, A. and M.C. Conlee (1975). Some Effects of Time and Thought on Attitude Polarization. Journal of
Personality and Social Psychology, 31 (February): 262-270.
Westbrook, R.A. (1987). Product/Consumption-Based Affective Responses and Post-Purchase Processes.
Journal of Marketing Research, 24 (August): 258-270.
VILT, Vlaams infocentrum land- en tuinbouw, Verkoop van fair trade stijgt fors ondanks crisis, URL:
http://www.vilt.be/Verkoop_van_fair_trade_stijgt_fors_ondanks_crisis (November 2010).
Wikipedia. Pearson’s chi-square test. URL: http://en.wikipedia.org/wiki/Pearson%27s_chi-square_test (September 2010).

77
Wood, W. (1982). The Retrieval of Attitude-Relevant Information from Memory: Effects on Susceptibility to
Persuasion and on Intrinsic Motivation. Journal of Personality and Social Psychology, 42: 798-810.
World Fair Trade Organization. 10 Standards of Fair Trade. 18 November 2009. URL: http://www.wfto.com/index.php?option=com_content&task=view&id=2&Itemid=14 (June 2010).
Yim, C. K. and P.K. Kannan (1999). Consumer Behavioral Loyalty: A Segmentation Model and Analysis, Journal of
Business Research, 44 (2): 75-92.


