
FACTORIAL DESIGNS
Terms for Factorials Types of Factorial Designs Notation for Factorials Types of Effects Looking at Tables of Means Looking at Graphs of Means

Terms for Factorials
level: value of an IV condition: combination of levels of two or
more IV’s factor: another name for IV
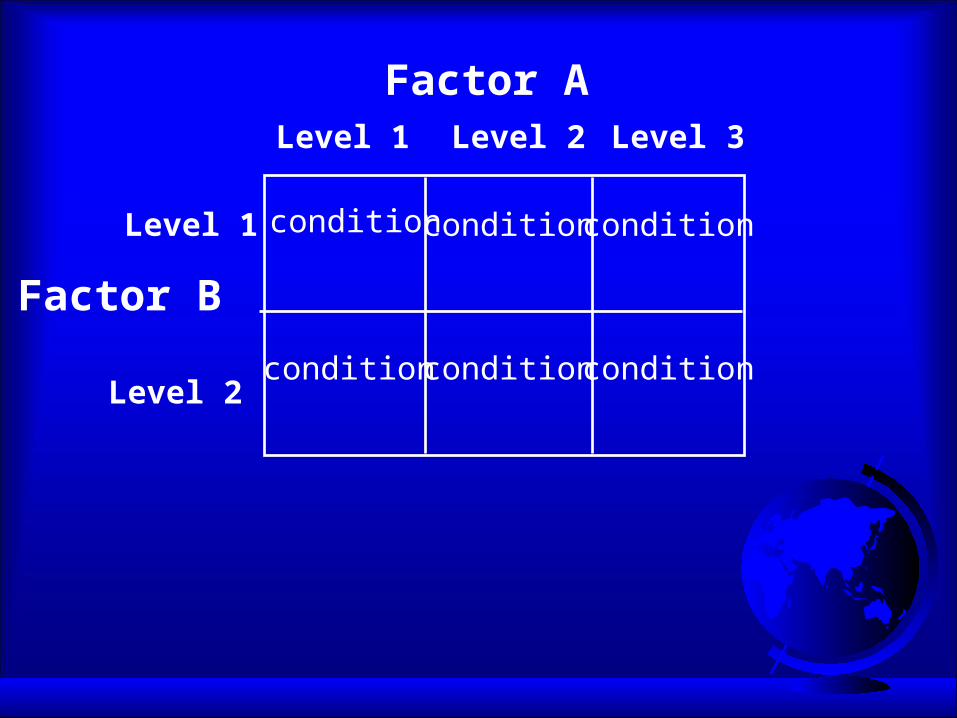
Factor A
Factor B
Level 1 Level 2
Level 1
Level 2
Level 3
condition condition condition
condition condition condition
Types of Factorial Designs
between subjects within subjects mixed
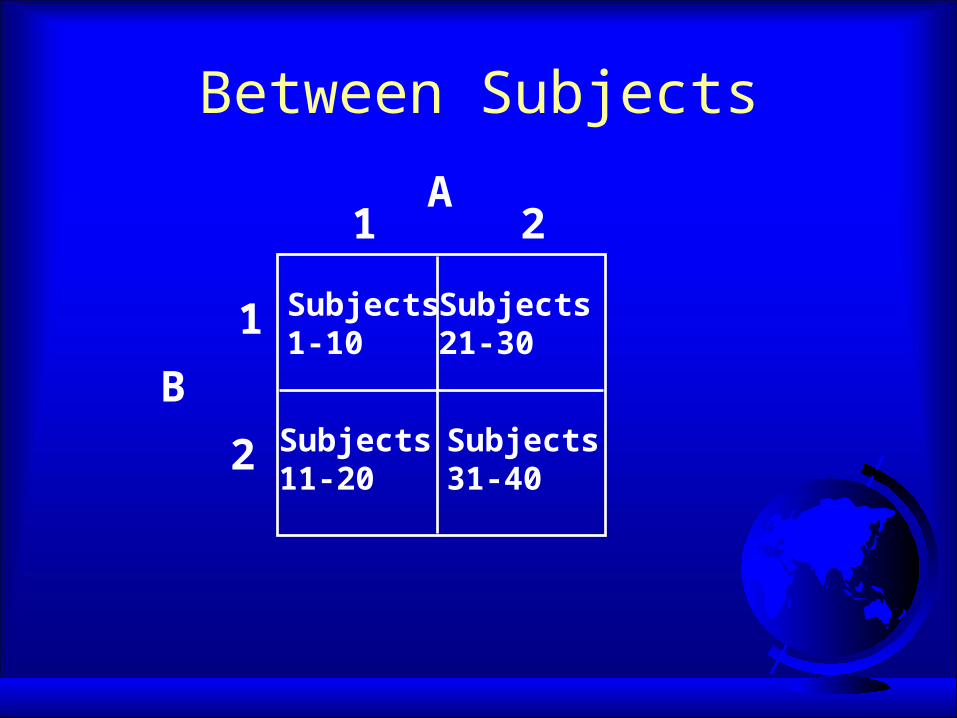
Between Subjects
B
1
2
A1 2
Subjects1-10
Subjects11-20
Subjects31-40
Subjects21-30
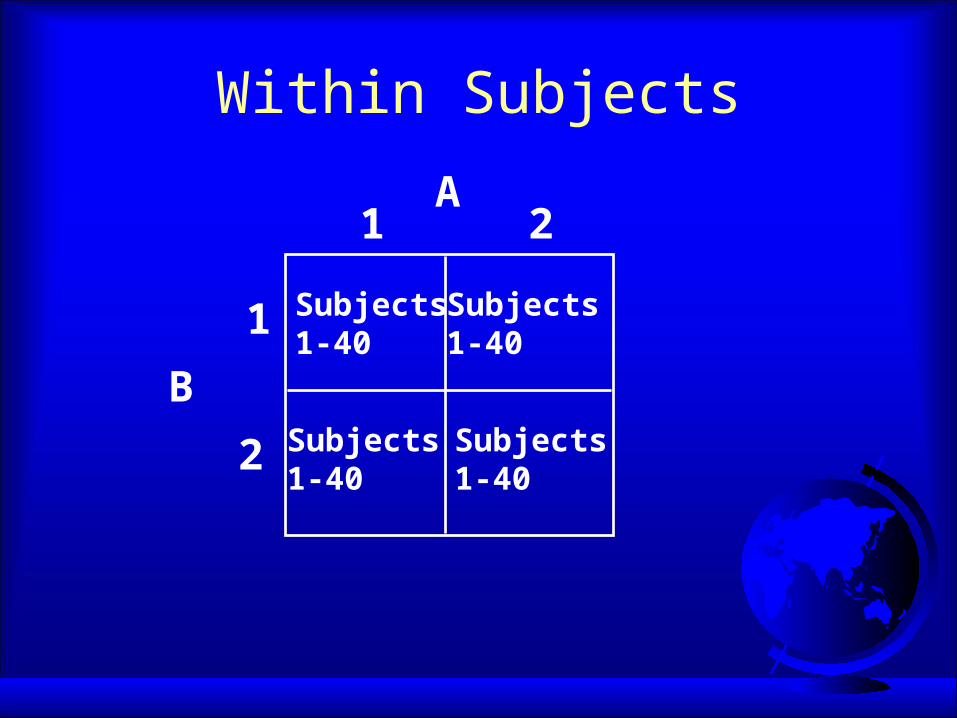
Within Subjects
B
1
2
A1 2
Subjects1-40
Subjects1-40
Subjects1-40
Subjects1-40

Mixed (A Between, B Within)
B
1
2
A1 2
Subjects1-20
Subjects1-20
Subjects21-40
Subjects21-40
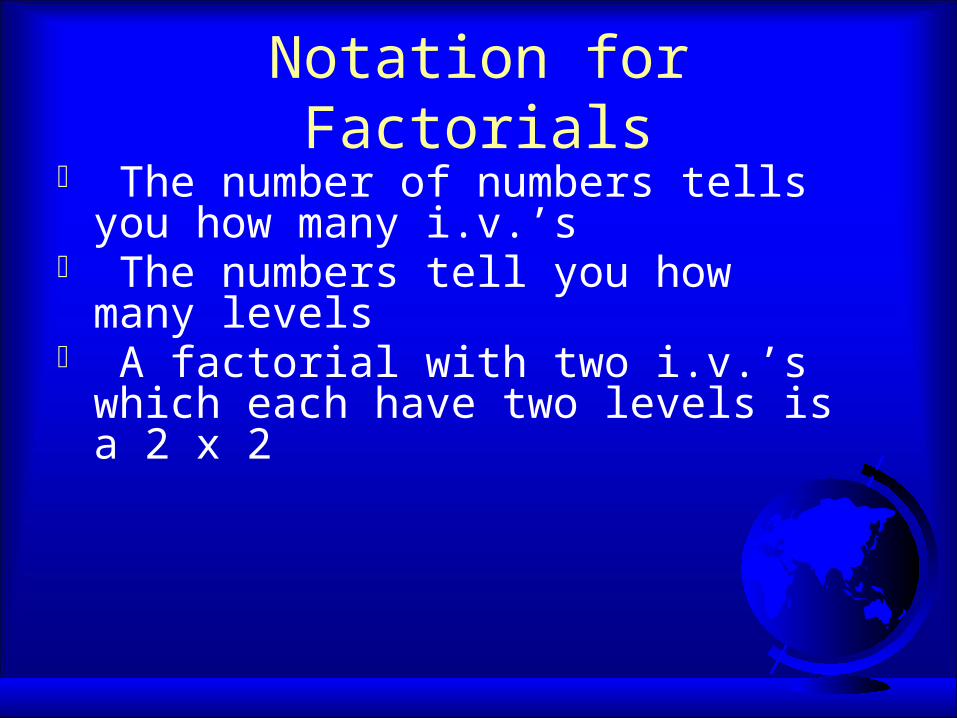
Notation for Factorials The number of numbers tells you how
many i.v.’s The numbers tell you how many levels A factorial with two i.v.’s which each have
two levels is a 2 x 2

Notation for Factorials
2x2 2x3 3x4How many i.v.’s?How many d.v.’s?How many conditions?
Types of Effects
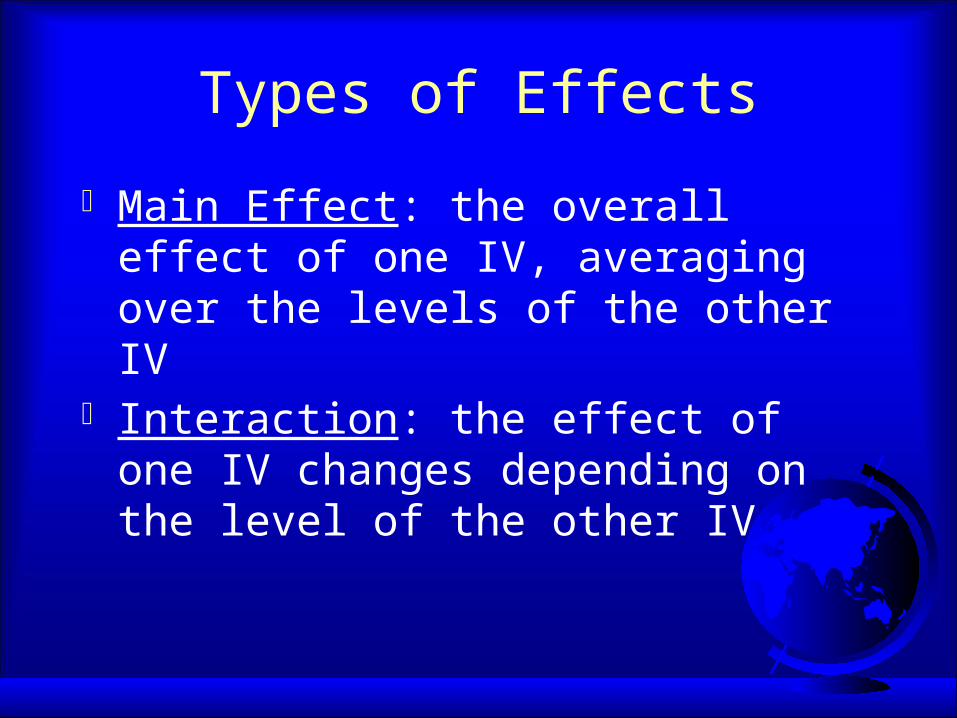
Main Effect: the overall effect of one IV, averaging over the levels of the other IV
Interaction: the effect of one IV changes depending on the level of the other IV
Drug
Therapy
1 2
1
2
40 60
60 40
meanrecoveryscore
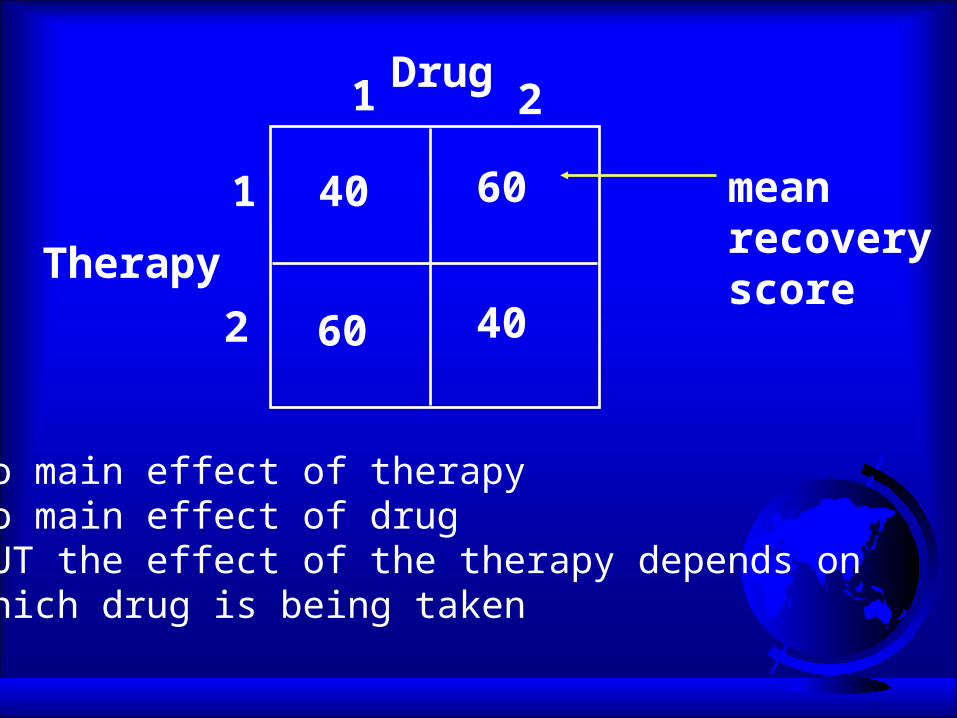
No main effect of therapyNo main effect of drugBUT the effect of the therapy depends on which drug is being taken
Why Factorials?
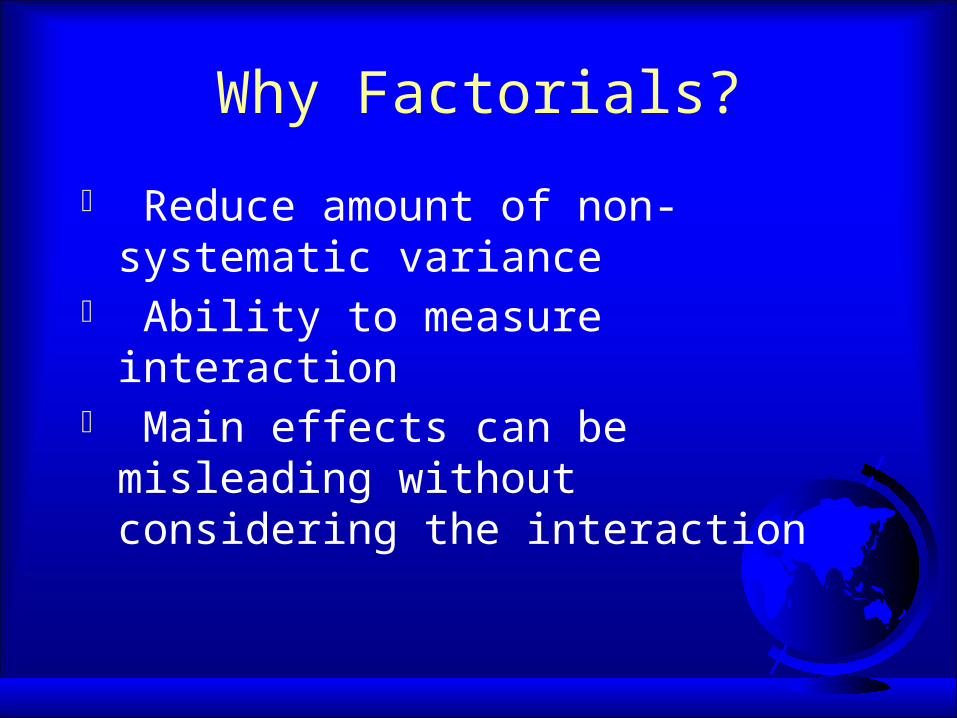
Reduce amount of non-systematic variance Ability to measure interaction Main effects can be misleading without
considering the interaction

Looking at Means Tables For main effects:
– find marginal means (means of levels)– if marginal means are different, there is a main
effect
Looking at Means Tables For interaction:
– find simple effects (effects of one variable for each level of other variable)
– If simple effects change, there is an interaction
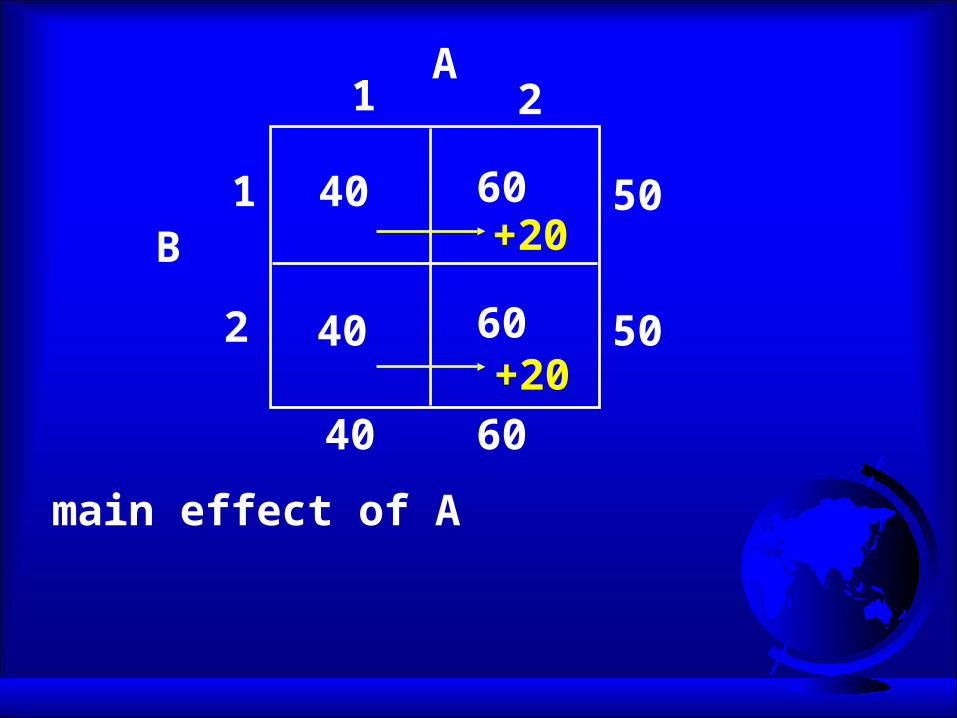
A
B
1 2
1
2
40 60
40 60
main effect of A
50
50
40 60
+20
+20

A
B
1 2
1
2
40 60
40 80
40 70
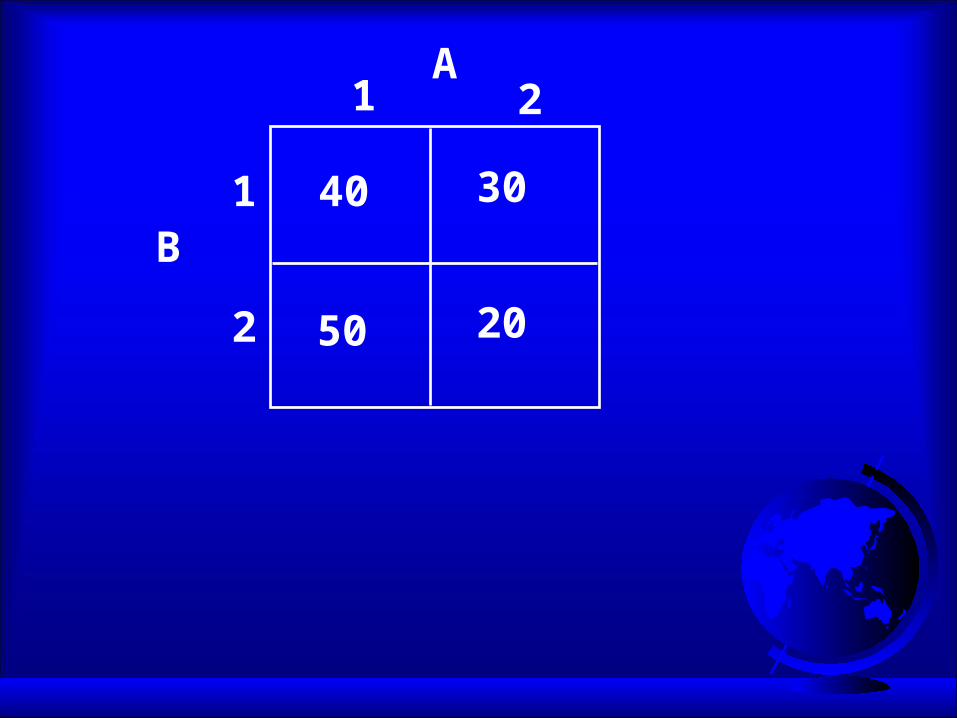
A
B
1 2
1
2
40 30
50 20
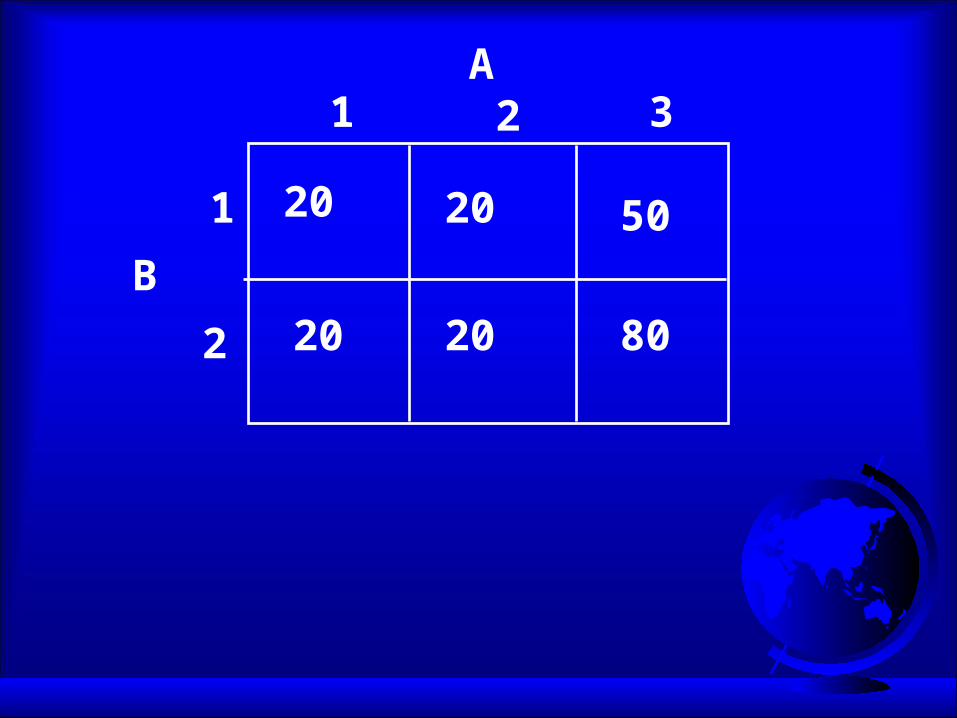
A
B
1 2
1
2
3
20
20
20
20
50
80
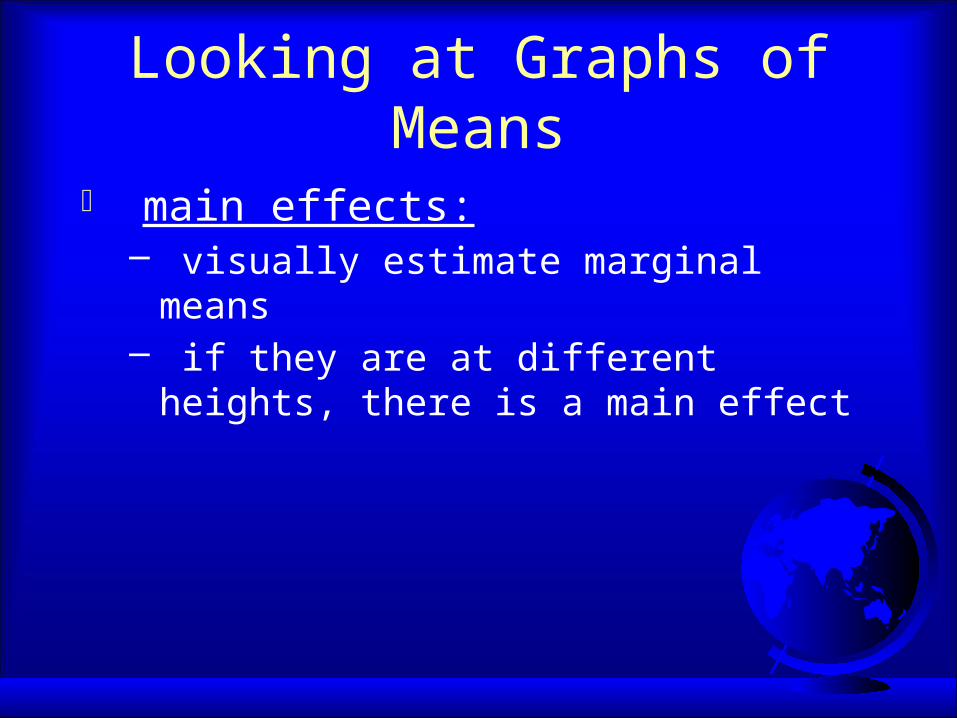
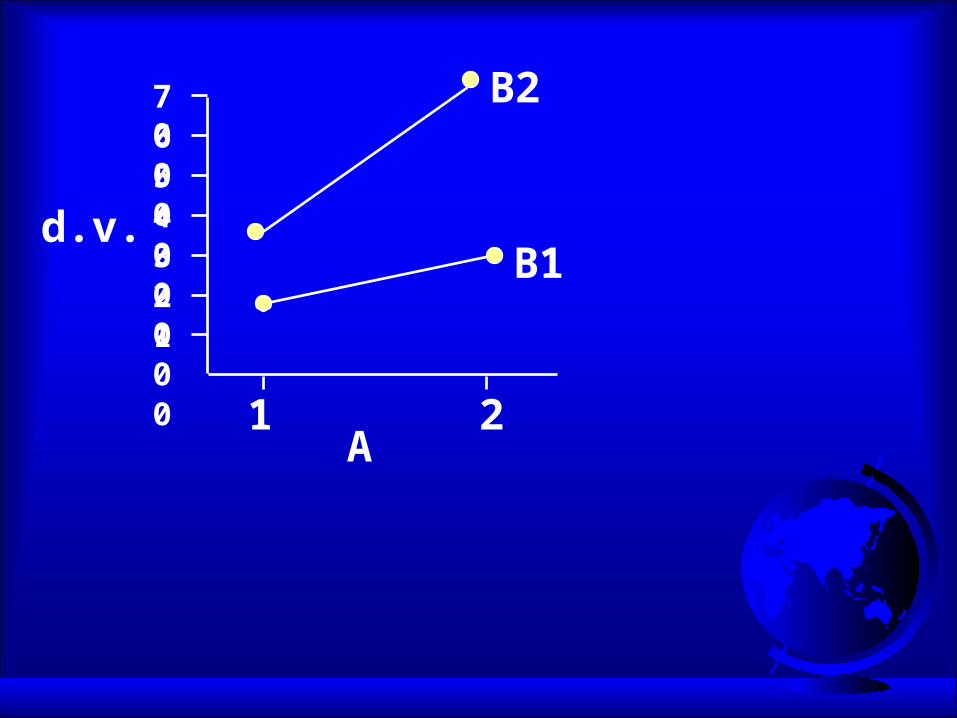
Looking at Graphs of Means
main effects: – visually estimate marginal means– if they are at different heights, there is a main
effect
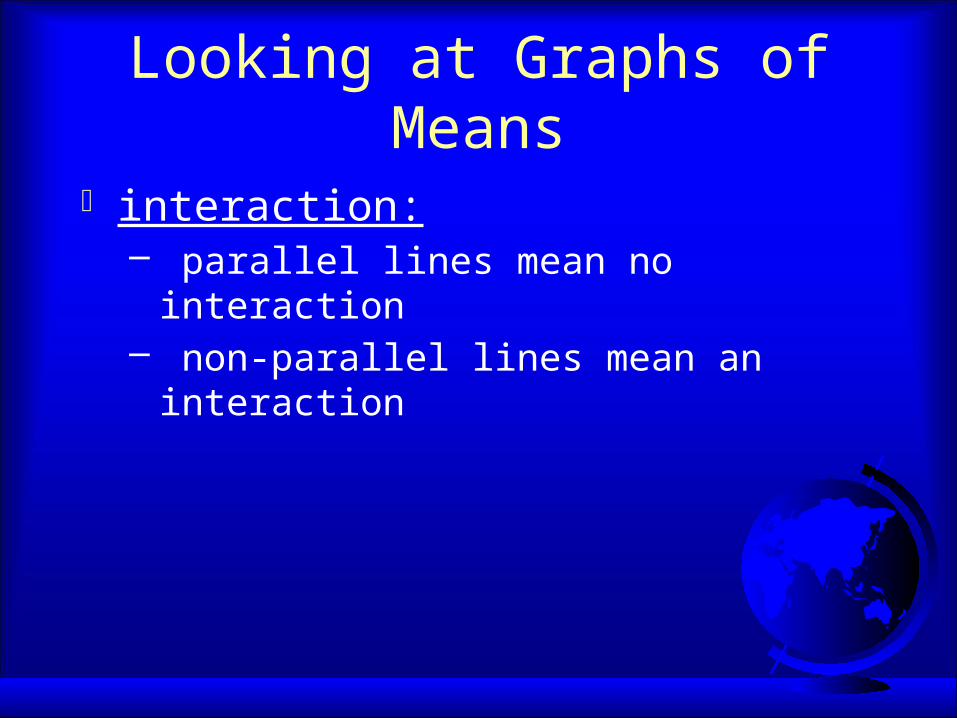
Looking at Graphs of Means
interaction:– parallel lines mean no interaction– non-parallel lines mean an interaction
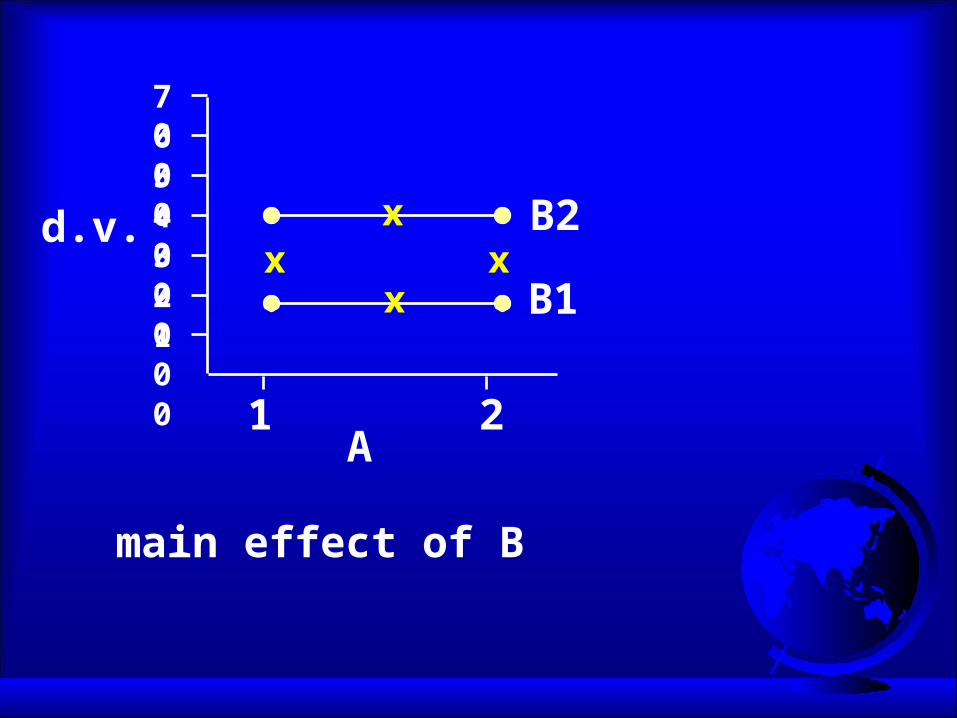
d.v.
10203040506070
0
A1 2
B1
B2x
xx x
main effect of B
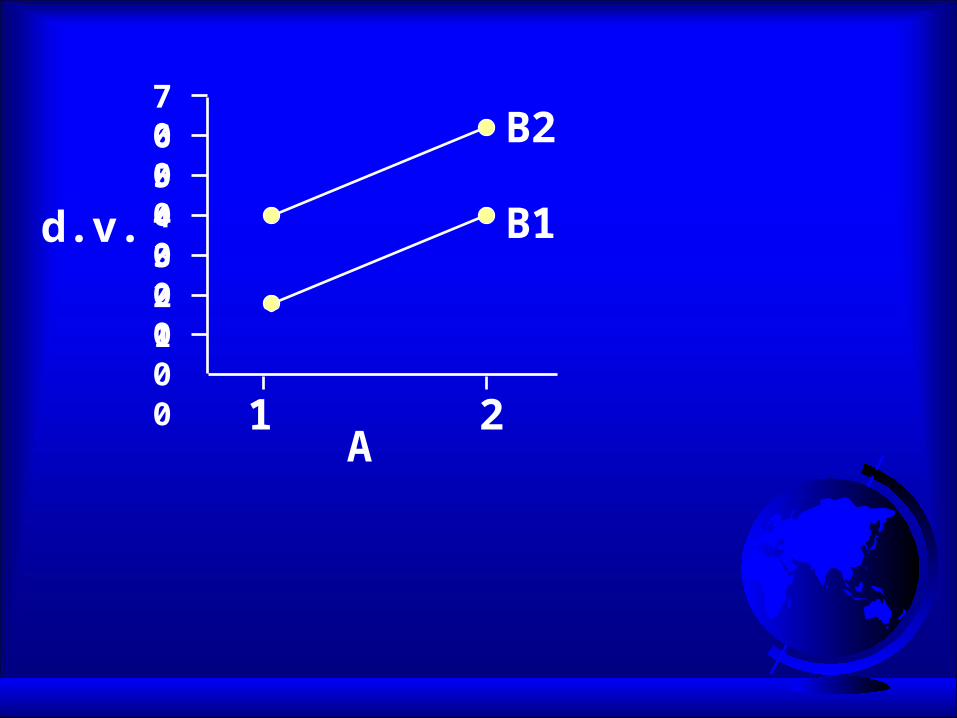
d.v.
10203040506070
0
A1 2
B1
B2
d.v.
10203040506070
0
A1 2
B1
B2

d.v.
10203040506070
0
A1 2
B1
B2

d.v.
10203040506070
0
A
1 3
B1
B2
2


