Download - Explanation and Analysis of Business Results

Millions of Yen(except for per share figures)
Thousands of
U.S. Dollars*1
(except for per share figures)
2018 2019 2019 Change (%)
Contract backlog at the beginning of the year ¥ 2,249,221 ¥ 2,407,221 $ 21,688,630 7.0 %
New orders received during the year 1,743,498 1,693,859 15,261,366 (2.8)
Net sales 1,585,498 1,650,878 14,874,115 4.1
Contract backlog at the end of the year ¥ 2,407,221 ¥ 2,450,202 $ 22,075,881 1.8 %
Net income attributable to owners of parent ¥ 126,788 ¥ 112,572 $ 1,014,254 (11.2)%
Per share (in yen and dollars) 561.36 511.90 4.61 (8.8)
Cash dividends applicable to the year 28,032 28,356 255,482 1.2
Per share (in yen and dollars) 85.00 130.00 1.17 52.9
Net assets 669,020 722,390 6,508,605 8.0
Per share (in yen and dollars) 2,975.02 3,302.86 29.76 11.0
Total assets 1,910,598 1,846,176 16,633,715 (3.4)
Explanation and Analysis of Business ResultsTAISEI CORPORATION and Consolidated Subsidiaries
Years ended March 31, 2018 and 2019
*1 U.S. dollar amounts above and elsewhere in this Annual Report were translated from yen, for convenience only, at the rate of U.S. $ 1 = ¥ 110.99, the approximate exchange
rate at March 31, 2019.
*2 The net assets per share and the net income per share are calculated assuming that the consolidation of shares took place at the beginning of the year ended March 31, 2018,
because the consolidation of shares, at the ratio of 1 share for 5 shares, was implemented on October 1, 2017.
*3 Total annual dividends per share as of March 31, 2018 is ¥ 85.00 ,which is the sum of the interim dividend per share of ¥ 10.00 and the year-end dividend per share of ¥ 75.00.
Due to the consolidation of shares at the ratio of 1 share for 5 shares implemented on October 1, 2017, the year-end dividend per share of ¥ 75.00 reflects this consolidation,
while the interim dividend per share of ¥ 10.00 does not.
If the interim dividend per share is calculated based on the consolidation of shares, it would be ¥ 50.00, making the total annual dividends per share ¥ 125.00.
*4 Effective from the year ended March 31, 2019, the Group retrospectively applied “Partial Amendments to Accounting Standard for Tax Effect Accounting” (ASBJ Statement
No.28, February 16, 2018).
The Group applied this change retrospectively and restarted the FINANCIAL HIGHLIGHTS from the year ended March 31, 2018, accordingly.
Client Project
Tokyo Electron Technology Solutions LimitedTokyo Electron Technology Solutions New Construction of new building of Tohoku Branch Office
Tokyo International University(Tentative Name) Tokyo International University New Construction of Ikebukuro International Campus
Harmonic Drive Systems Inc. Harmonic Drive Systems New Construction of Ariake new plant
Ministry of Land, Infrastructure, Transport and Tourism Tohoku Regional Development Bureau
Naruse Dam Quarry Work (1st Period)
Tokushima Tsuda Biomass Power Plant LLC. Tokushima Tsuda Biomass Power Plant
Client Project
MITSUBISHI ESTATE CO., LTD.The Tokyo Chamber of Commerce and IndustryTOKYO KAIKAN CO., LTD
New Construction of Marunouchi Niju-Bashi Building
Nippon Television Network Corporation (Tentative Name) Kojimachi New Studio Construction Project
Mitsui Fudosan Co., LtdMITSUBISHI ESTATE CO., LTD
(Tentative Name) TGMM Shibaura Project New Construction (Building“ A” and Hotel)
Ministry of Land, Infrastructure, Transport and Tourism Hokkaido Regional Development Bureau
Teshio River Sanru Dam Construction Project Dam Body Construction Work
West Nippon Expressway Company LimitedConstruction Work of the Shinmeishin Expressway Ikuno-ohashi Bridge(PC upper part Work)
Major new orders received during FY ended March 2019
Major projects completed during FY ended March 2019
While weakness is seen in exports and production in some sectors
due to the protectionist trade policy prevailing in the world economy
and uncertainty over the prospect of the Chinese economy, the
Japanese economy during this fiscal year moderately continued to
recover overall as consumer spending has recovered responding to
the improved employment and income environments.
In the domestic construction market, private investments in
facilities increased backed by strong corporate earnings and high
levels of public works investment continued, allowing the
construction industry to maintain a good business environment.
Under these circumstances, the Company and its affiliated
companies reported consolidated results of its operations as
follows:
Orders received decreased by 2.8% compared to the previous
consolidated fiscal year to ¥ 1,693.8 billion due to a decrease in
Civil Engineering.
Status of Results
75 TAISEI ANNUAL REPORT 2019

Millions of Yen
2018 2019
Name of reporting segment, etc.:
Civil engineering ¥ 520,407 ¥ 411,058
Building construction 1,099,950 1,148,973
Real estate development 113,411 124,586
Others 9,727 9,241
Total ¥ 1,743,497 ¥ 1,693,859
(Consolidated) Orders received
(Consolidated) Sales
Note: In Orders received and Sales, transactions between segments have been eliminated.
Millions of Yen
2018 2019
Name of reporting segment, etc.:
Civil engineering ¥ 441,269 ¥ 439,109
Building construction 1,020,765 1,087,671
Real estate development 113,736 114,855
Others 9,727 9,241
Total ¥ 1,585,497 ¥ 1,650,877
Net sales increased by 4.1% compared to the previous
consolidated fiscal year to ¥ 1,650.8 billion due to increases in
Building Construction and Real Estate Development.
Operating income decreased by 15.7% compared to the
previous consolidated fiscal year to ¥ 153.3 billion due to declining
profit resulting partly from deterioration of gross profit margin in Civil
Engineering, Building Construction and Real Estate Development.
Ordinary income decreased by 14.8% compared to the previous
consolidated fiscal year to ¥ 157.9 billion due to a decrease in
operating income, despite an improvement in non-operating income
and expenses associated with a decrease in interest expenses, etc.
Net income attributable to owners of parent decreased by 11.2%
compared to the previous consolidated fiscal year to ¥ 112.5 billion
due to an improvement in extraordinary loss (income) accompanying
the rebound effect of recorded impairment loss in the previous
consolidated fiscal year, etc., and a decrease in income taxes. ROE
(return on equity) decreased by 4.3% compared to the previous
consolidated fiscal year to 16.2%.
Results according to reporting segment, etc., are as follows (the
results for reporting segments include internal transactions between
segments).
1. Civil Engineering
In our Group, net sales was almost at the same level compared with
the previous consolidated fiscal year at ¥ 468.6 billion. Operating
income, meanwhile, decreased by 25.8% year on year to ¥ 53.0
billion due to deterioration of gross profit margin.
2. Building Construction
In our Group, net sales increased by 6.6% compared with the
previous consolidated fiscal year to ¥ 1,130.4 billion due to an
increase in net sales for both the Company and its consolidated
subsidiaries. Operating income, meanwhile, decreased by 9.0%
year on year to ¥ 87.6 billion due to deterioration of gross profit
margin.
3. Real Estate Development
As for the real estate industry, the condominium market has shown
to be more polarizing as we see that while demand remained strong
mainly for properties in central Tokyo and convenient areas close to
stations with sales prices continuing to maintain high levels, some
properties in the suburbs took a long time to sell. Further, the
building leasing market remains steady as the rent continued to
moderately rise amid strong demand mainly in central Tokyo.
In our Group, net sales increased by 1.7% compared with the
previous consolidated fiscal year to ¥ 121.8 billion, due to an
increase in net sales for both the Company and its consolidated
subsidiaries. Operating income, meanwhile, decreased by 0.4%
year on year to ¥ 12.9 billion due to deterioration of gross profit
margin.
4. Other
In our Group, net sales decreased by 1.6% compared with the
previous consolidated fiscal year to ¥ 12.1 billion, and operating
income increased by 2.7% year on year to ¥ 1.1 billion.
Abou
t the
Tai
sei G
roup
Tow
ard
Sust
aina
ble
Grow
th o
f the
Taise
i Gro
upSp
ecia
l Fea
ture
Busi
ness
Sec
tion
ESG
Sect
ion
Data
Sec
tion
Data
Sec
tion
76TAISEI ANNUAL REPORT 2019

2. Cash Flows from Investing Activities
A balance of expenditure of ¥ 82.2 billion was incurred in this
consolidated fiscal year due to the acquisition of property, plant and
equipment, etc. (expenditure of ¥ 11.8 billion in the previous
consolidated fiscal year).
3. Cash Flows from Financing Activities
A balance of expenditure of ¥ 96.1 billion was incurred in this
consolidated fiscal year due to the acquisition of treasury stock
and repayment of interest-bearing loans associated with
procurement of finance, etc. (expenditure of ¥ 41.6 billion in the
previous consolidated fiscal year).
1. Cash Flows from Operating Activities
A balance of expenditure of ¥ 71.0 billion was incurred in this
consolidated fiscal year (excess revenue of ¥ 207.0 billion in the
previous consolidated fiscal year) due to an increase in trade
receivables and other factors, although income before income taxes
of ¥ 160.7 billion was earned in this term.
Cash Flows
1. Assets
As a result of a decrease in cash and time deposits, etc., total
assets decreased by 3.4% or ¥ 64.4 billion compared with the end
of the previous consolidated fiscal year to ¥ 1,846.1 billion.
2. Liabilities
Total liabilities decreased by 9.5% or ¥ 117.7 billion compared with
the end of the previous consolidated fiscal year to ¥ 1,123.7 billion,
due to a decrease in advances received and progress billings on
uncompleted contracts, etc.
Financial Position
3. Net Assets
Net assets increased by 8.0% or ¥ 53.3 billion compared with the
end of the previous consolidated fiscal year to ¥ 722.3 billion, due
to posting of net income attributable to owners of parent, etc.,
despite carrying out an acquisition of treasury stock.
As a result of the above, the ratio of capital to assets increased by
4.1% compared with the end of the previous consolidated fiscal
year to 39.0%. The balance of interest-bearing loans associated
with procurement of finance decreased by ¥ 29.9 billion from the
end of the previous consolidated fiscal year to ¥ 217.4 billion.
As a result of the above, cash and cash equivalents at the end of
this consolidated fiscal year was ¥ 437.5 billion (a decrease of
¥ 249.7 billion compared with the end of the previous consolidated
fiscal year).
Cash Flows Status
(71.0) (96.1)(82.2)
(FY)(249.7)2018
■ Cash flows from operating activities
■ Cash flows from investing activities
■ Cash flows from financing activities
Increase / decrease in cash and cash equivalents
(17.2)(30.4)
24.0
(13.9)
300.0
200.0
100.0
(100.0)
(200.0)
(300.0)
0
(Billions of Yen)
2014 2015
34.5
163.0218.1
6.2
(35.1)(60.0)
95.3
(25.0)
2016
152.5207.0
(41.6)
2017
(11.8)
Explanation and Analysis of Business ResultsTAISEI CORPORATION and Consolidated Subsidiaries
Years ended March 31, 2018 and 2019
77 TAISEI ANNUAL REPORT 2019

The Company has made it a basic policy to pay long-term stable
dividends to shareholders. The Company tries to reinforce internal
reserve for the future business operation, and returns the profit to
the shareholders by way of a special dividend and the like when
the business performance of the Company is well.
With regard to the dividend at the end of the fiscal year ended
March 31, 2019, comprehensively taking into account both
achievement of greater performance than the initial plan, and
business surroundings in the future, etc., it has been decided to
allocate a dividend of ¥ 70.00 per share.
As a result, the total dividend for the fiscal year ended March
31, 2019, including the interim dividend, is ¥ 130.00 per share, a
¥ 5 increase compared to the dividend of the previous fiscal year
after taking into consideration the consolidation of shares
conducted on October 1, 2017, and the latest dividend forecast.
The Articles of Incorporation of the Company permit an interim
dividend to be allocated, in accordance with Paragraph 5 of Article
454 of the Companies Act, with dividends allocated twice every
year, at the middle and at the end of the fiscal year. These
dividends are decided at the General Meeting of Shareholders for
the end of term and the Board meeting for the interim dividend.
At the Board meeting on May 10, 2019, acquisition of treasury
stock, the maximum limitation of which is 8,300 thousand shares
(¥ 28.0 billion), was resolved in order to increase shareholder
returns and to improve the capital efficiency.
Dividend Policy
Millions of Yen Yen
Total dividend amount Dividend per share
Resolution meeting date:
Board meeting, November 8, 2018 ¥ 13,087 ¥ 60.00
General Meeting of Shareholders, June 26, 2019 15,268 70.00
Total dividend amount and dividend per share
Abou
t the
Tai
sei G
roup
Tow
ard
Sust
aina
ble
Grow
th o
f the
Taise
i Gro
upSp
ecia
l Fea
ture
Busi
ness
Sec
tion
ESG
Sect
ion
Data
Sec
tion
Data
Sec
tion
78TAISEI ANNUAL REPORT 2019

Consolidated Balance SheetsTAISEI CORPORATION and Consolidated Subsidiaries
March 31, 2018 and 2019
Millions of Yen
Thousands of
U.S. Dollars
(Note 1)
ASSETS 2018 2019 2019
Current assets:
Cash and time deposits (Notes 3 and 4) ............................... ¥ 687,456 ¥ 467,750 $ 4,214,344
Notes and accounts receivable, trade (Notes 4 and 7) .......... 441,631 542,009 4,883,404
Cost on uncompleted contracts ............................................ 50,095 42,472 382,665
Cost on development projects in progress ............................ 86,207 96,750 871,700
Other inventories ................................................................... 2,757 3,804 34,273
Other current assets (Note 7) ................................................ 59,514 47,773 430,426
Allowance for doubtful accounts ........................................... (173) (121) (1,090)
Total current assets ............................................ 1,327,487 1,200,437 10,815,722
Fixed assets:
Tangible fixed assets
Buildings and structures (Notes 6,10,16 and 20) ............... 136,975 152,138 1,370,736
Machinery, vehicles and equipment (Notes 6,16 and 20) ................. 56,173 60,380 544,013
Land (Notes 6,10,16,18 and 20) ........................................ 119,964 135,939 1,224,786
Construction in progress ................................................... 1,523 1,255 11,307
Subtotal ............................................................. 314,635 349,712 3,150,842
Accumulated depreciation ................................................. (126,238) (129,967) (1,170,979)
Total tangible fixed assets .................................. 188,397 219,745 1,979,863
Intangible fixed assets (Note 16) ............................................ 11,554 13,028 117,380
Investments and other assets:
Investment securities (Notes 4, 5 and 6) ............................ 337,382 367,627 3,312,253
Net defined benefit asset (Note 11) .................................... 9,561 11,387 102,595
Deferred income tax assets (Notes 2 and 9) ...................... 6,557 3,915 35,274
Other assets (Note 6) ......................................................... 31,413 31,806 286,566
Allowance for doubtful accounts ........................................ (1,753) (1,769) (15,938)
Total investments and other assets ..................... 383,160 412,966 3,720,750
Total fixed assets .................................. 583,111 645,739 5,817,993
Total assets ........................................... ¥ 1,910,598 ¥ 1,846,176 $ 16,633,715
The accompanying notes are an integral part of these balance sheets.
79 TAISEI ANNUAL REPORT 2019

Millions of Yen
Thousands of
U.S. Dollars
(Note 1)
LIABILITIES AND NET ASSETS 2018 2019 2019
Current liabilities:
Notes and accounts payable, trade (Notes 4 and 7) .............. ¥ 509,576 ¥ 507,335 $ 4,570,997
Short-term loans (Notes 4, 6 and 8) ...................................... 69,304 59,924 539,904
Current portion of long-term debt (Notes 4, 6 and 8) ............. 31,449 31,344 282,404
Income taxes payable ........................................................... 30,843 18,982 171,024
Advances received and progress billings on uncompleted contracts .... 148,516 99,746 898,694
Deposits received (Note 4) .................................................... 182,142 155,030 1,396,793
Allowance for warranty on completed contracts .................... 3,129 3,475 31,309
Allowance for losses on construction contracts (Note 16) ...... 9,394 2,761 24,876
Allowance for losses on order received ................................. 3 — —
Allowance for losses on Anti-Monopoly Act ........................... — 9,129 82,251
Other current liabilities (Note 7) .............................................. 38,270 37,065 333,949
Total current liabilities ............................... 1,022,626 924,791 8,332,201
Long- term liabilities:
Long-term debt (Notes 4 and 8) ............................................ 147,321 126,850 1,142,896
Deferred income tax liabilities (Notes 2 and 9) ....................... 1,431 6,199 55,852
Deferred income tax liabilities for revaluation of land (Notes 9 and 18) ... 3,286 3,286 29,606
Retirement benefits for directors and audit & supervisory board members .. 391 417 3,757
Allowance for losses on investments in subsidiaries and affiliates ... 40 16 144
Allowance for environmental spending .................................. 89 44 396
Allowance for losses on Anti-Monopoly Act ........................... 10,694 — —
Net defined benefit liability (Note 11) ...................................... 35,787 42,022 378,611
Other long-term liabilities ....................................................... 19,913 20,161 181,647
Total long-term liabilities ........................................................ 218,952 198,995 1,792,909
Total liabilities ........................................... 1,241,578 1,123,786 10,125,110
Net assets (Notes 12 and 21):
Shareholders’ equity:
Common stock
Authorized: 440,000,000 shares
Issued: 224,541,172 shares .............................................. 122,742 122,742 1,105,883
Capital surplus ...................................................................... 60,199 60,199 542,382
Retained earnings ................................................................. 382,462 465,127 4,190,711
Less: Treasury stock, at cost (Note 23) .................................. (1,490) (37,503) (337,895)
Total shareholders' equity (Note 23) ......... 563,913 610,565 5,501,081
Accumulated other comprehensive income:
Unrealized holding gains on securities, net of taxes ............... 98,579 108,782 980,106
Deferred losses on hedging derivatives, net of taxes (Note 14) ... (115) (74) (667)
Revaluation reserve for land (Note 18) ................................... (1,245) (1,245) (11,217)
Foreign currency translation adjustments .............................. (3,058) (3,343) (30,120)
Remeasurements of defined benefit plans, net of taxes (Note 11) ... 9,079 5,738 51,699
Total accumulated other comprehensive income ... 103,240 109,858 989,801
Non-controlling interests: ......................................................... 1,867 1,967 17,723
Total net assets ........................................ 669,020 722,390 6,508,605
Total liabilities and net assets ................... ¥ 1,910,598 ¥ 1,846,176 $ 16,633,715
Abou
t the
Tai
sei G
roup
Tow
ard
Sust
aina
ble
Grow
th o
f the
Taise
i Gro
upSp
ecia
l Fea
ture
Busi
ness
Sec
tion
ESG
Sect
ion
Data
Sec
tion
Data
Sec
tion
80TAISEI ANNUAL REPORT 2019

Consolidated Statements of IncomeTAISEI CORPORATION and Consolidated Subsidiaries
Years Ended March 31, 2018 and 2019
Millions of Yen
Thousands of
U.S. Dollars
(Note 1)
2018 2019 2019
Revenue:
Net sales (Note 16):
Construction contracts ...................................................... ¥ 1,445,277 ¥ 1,511,724 $ 13,620,362
Real estate development (and other) (Note 10) .................. 140,221 139,154 1,253,753
1,585,498 1,650,878 14,874,115
Costs and expenses (Note 16):
Cost of sales (Note 19) .......................................................... 1,318,880 1,409,418 12,698,604
Selling, general and administrative expenses (Note 19) ......... 84,758 88,136 794,089
1,403,638 1,497,554 13,492,693
Operating income (Note 16) ...................................................... 181,860 153,324 1,381,422
Other income (expenses):
Interest and dividend income ................................................ 4,332 4,526 40,778
Interest expenses .................................................................. (1,684) (1,278) (11,515)
Taxes and dues ..................................................................... (12) (445) (4,009)
Commission expenses .......................................................... (45) (356) (3,207)
Investment gain on equity method ........................................ 1,004 1,283 11,560
Gains on sales of investment securities (Note 5) .................... 779 153 1,379
Gains on sales of tangible fixed assets .................................. 35 1,642 14,794
Reversal of allowance for losses on Anti-Monopoly Act ......... 117 1,565 14,100
Write-down of marketable and investment securities (Note 5) ... (4) (92) (829)
Loss on disposal of fixed assets ............................................ (275) (188) (1,694)
Loss on investments in related companies ............................ — (167) (1,505)
Impairment losses on fixed assets (Notes 16 and 20) ............ (3,631) (340) (3,063)
Other, net (Note 5) ................................................................. (179) 1,150 10,361
437 7,453 67,150
Income before income taxes ..................................................... 182,297 160,777 1,448,572
Income taxes (Note 9):
Current .............................................................................. (51,437) (43,594) (392,774)
Deferred ............................................................................ (4,071) (4,481) (40,373)
(55,508) (48,075) (433,147)
Net income ............................................................................... 126,789 112,702 1,015,425
Net income (loss) attributable to non-controlling interests ......... (1) (130) (1,171)
Net income attributable to owners of parent ............................. ¥ 126,788 ¥ 112,572 $ 1,014,254
Yen
U.S. Dollars
(Note 1)
Amounts per share of common stock:
Net income (Note 21) ........................................................ ¥ 561.36 ¥ 511.90 $ 4.61
Diluted net income (Note 21) ............................................. — — —
Cash dividends applicable to the year (Note 12) ................ 85.00 130.00 1.17
The accompanying notes are an integral part of these statements.
81 TAISEI ANNUAL REPORT 2019

Consolidated Statements of Comprehensive IncomeTAISEI CORPORATION and Consolidated Subsidiaries
Years Ended March 31, 2018 and 2019
Millions of Yen
Thousands of
U.S. Dollars
(Note 1)
2018 2019 2019
Net income ............................................................................... ¥ 126,789 ¥ 112,702 $ 1,015,425
Other comprehensive income (Note 22):
Unrealized holding gains on securities, net of taxes ............... 16,112 10,205 91,945
Deferred gains (losses) on hedging derivatives, net of taxes ... (7) 8 72
Foreign currency translation adjustments .............................. (30) (239) (2,153)
Remeasurements of defined benefit plans, net of taxes ......... 5,794 (3,351) (30,192)
Share of other comprehensive income of associates accounted for by the equity method ... (1) (35) (315)
Total other comprehensive income ........................................ 21,868 6,588 59,357
Comprehensive income ............................................................ ¥ 148,657 ¥ 119,290 $ 1,074,782
Comprehensive income attribute to:
Owners of parent .................................................................. ¥ 148,662 ¥ 119,190 $ 1,073,881
Non-controlling interests ....................................................... (5) 100 901
The accompanying notes are an integral part of these statements.
Abou
t the
Tai
sei G
roup
Tow
ard
Sust
aina
ble
Grow
th o
f the
Taise
i Gro
upSp
ecia
l Fea
ture
Busi
ness
Sec
tion
ESG
Sect
ion
Data
Sec
tion
Data
Sec
tion
82TAISEI ANNUAL REPORT 2019

Consolidated Statements of Changes in Net AssetsTAISEI CORPORATION and Consolidated Subsidiaries
Years Ended March 31, 2018 and 2019
Millions of Yen
Common
stock Capital surplus
Retained
earnings Treasury stock
Total
shareholders’
equity
Balance at March 31, 2017 ........................................... ¥ 122,742 ¥ 85,150 ¥ 278,614 ¥ (1,110) ¥ 485,396
Dividends ..................................................................... — — (24,958) — (24,958)
Net income attributable to owners of parent ................. — — 126,788 — 126,788
Acquisition of treasury stock ........................................ — — — (25,047) (25,047)
Sale of treasury stock ................................................... — 0 — 2 2
Retirement of treasury stock ........................................ — (24,665) — 24,665 —
Reversal of revaluation reserve for land ........................ — — 2,018 — 2,018
Changes of shares from transaction with non-controlling shareholders ... — (286) — — (286)
Changes other than shareholders’ equity, net ............... — — — — —
Balance at March 31, 2018 ........................................... ¥ 122,742 ¥ 60,199 ¥ 382,462 ¥ (1,490) ¥ 563,913
Dividends ..................................................................... — — (29,907) — (29,907)
Net income attributable to owners of parent ................. — — 112,572 — 112,572
Acquisition of treasury stock ........................................ — — — (36,014) (36,014)
Sale of treasury stock ................................................... — (0) — 1 1
Retirement of treasury stock ........................................ — — — — —
Reversal of revaluation reserve for land ........................ — — — — —
Changes of shares from transaction with non-controlling shareholders ... — — — — —
Changes other than shareholders’ equity, net ............... — — — — —
Balance at March 31, 2019 ........................................... ¥ 122,742 ¥ 60,199 ¥ 465,127 ¥ (37,503) ¥ 610,565
Thousands of U.S. Dollars (Note 1)
Common
Stock Capital surplus
Retained
earnings Treasury stock
Total
shareholders’
equity
Balance at March 31, 2018 ........................................... $ 1,105,883 $ 542,382 $ 3,445,914 $ (13,424) $ 5,080,755
Dividends ..................................................................... — — (269,457) — (269,457)
Net income attributable to owners of parent ................. — — 1,014,254 — 1,014,254
Acquisition of treasury stock ........................................ — — — (324,480) (324,480)
Sale of treasury stock ................................................... — (0) — 9 9
Retirement of treasury stock ........................................ — — — — —
Reversal of revaluation reserve for land ........................ — — — — —
Changes of shares from transaction with non-controlling shareholders ... — — — — —
Changes other than shareholders’ equity, net ............... — — — — —
Balance at March 31, 2019 ........................................... $ 1,105,883 $ 542,382 $ 4,190,711 $ (337,895) $ 5,501,081
The accompanying notes are an integral part of these statements.
83 TAISEI ANNUAL REPORT 2019

Millions of Yen
Unrealized
holding gains on
securities, net of
taxes
Deferred losses
on hedging
derivatives, net
of taxes
Revaluation
reserve for land
Foreign currency
translation
adjustments
Remeasure-
ments of defined
benefit plans, net
of taxes
Total
accumulated
other
comprehensive
income
Non-controlling
interests
Total net
assets
¥ 82,463 ¥ (158) ¥ 773 ¥ (2,969) ¥ 3,275 ¥ 83,384 ¥ 2,034 ¥ 570,814
— — — — — — — (24,958)
— — — — — — — 126,788
— — — — — — — (25,047)
— — — — — — — 2
— — — — — — — —
— — (2,018) — — (2,018) — —
— — — — — — — (286)
16,116 43 — (89) 5,804 21,874 (167) 21,707
¥ 98,579 ¥ (115) ¥ (1,245) ¥ (3,058) ¥ 9,079 ¥ 103,240 ¥ 1,867 ¥ 669,020
— — — — — — — (29,907)
— — — — — — — 112,572
— — — — — — — (36,014)
— — — — — — — 1
— — — — — — — —
— — — — — — — —
— — — — — — — —
10,203 41 — (285) (3,341) 6,618 100 6,718
¥ 108,782 ¥ (74) ¥ (1,245) ¥ (3,343) ¥ 5,738 ¥ 109,858 ¥ 1,967 ¥ 722,390
Thousands of U.S. Dollars (Note 1)
Unrealized
holding gains on
securities, net of
taxes
Deferred losses
on hedging
derivatives, net
of taxes
Revaluation
reserve for land
Foreign currency
translation
adjustments
Remeasure-
ments of defined
benefit plans, net
of taxes
Total
accumulated
other
comprehensive
income
Non-controlling
interests
Total net
assets
$ 888,179 $ (1,036) $ (11,217) $ (27,552) $ 81,800 $ 930,174 $ 16,821 $ 6,027,750
— — — — — — — (269,457)
— — — — — — — 1,014,254
— — — — — — — (324,480)
— — — — — — — 9
— — — — — — — —
— — — — — — — —
— — — — — — — —
91,927 369 — (2,568) (30,101) 59,627 902 60,529
$ 980,106 $ (667) $ (11,217) $ (30,120) $ 51,699 $ 989,801 $ 17,723 $ 6,508,605
Abou
t the
Tai
sei G
roup
Tow
ard
Sust
aina
ble
Grow
th o
f the
Taise
i Gro
upSp
ecia
l Fea
ture
Busi
ness
Sec
tion
ESG
Sect
ion
Data
Sec
tion
Data
Sec
tion
84TAISEI ANNUAL REPORT 2019

Consolidated Statements of Cash FlowsTAISEI CORPORATION and Consolidated Subsidiaries
Years Ended March 31, 2018 and 2019
Millions of Yen
Thousands of
U.S. Dollars
(Note 1)
2018 2019 2019
Cash flows from operating activities:
Income before income taxes ................................................. ¥ 182,297 ¥ 160,777 $ 1,448,572Depreciation and amortization ............................................... 7,050 7,856 70,781Impairment losses on fixed assets ......................................... 3,631 340 3,063Increase (decrease) in allowance for doubtful accounts ......... (836) (37) (333)Increase (decrease) in allowance for losses on construction contracts ...... (6,272) (6,633) (59,762)Increase (decrease) in net defined benefit liability ................... (5,476) 6,235 56,176Increase (decrease) in allowance for losses on Anti-Monopoly Act ..... (342) (1,565) (14,100)Interest and dividend income ................................................ (4,332) (4,526) (40,778)Interest expenses .................................................................. 1,684 1,278 11,515Write-down of marketable and investment securities ............. 4 92 829Gain (loss) on sale of marketable and investment securities .... (758) (123) (1,108)Loss on investments in related companies ............................ — 167 1,505Losses (gains) on sales of tangible fixed assets .................... (35) (1,642) (14,794)Losses on disposal of fixed assets ........................................ 275 188 1,694Investment losses (gains) on equity method .......................... (1,004) (1,283) (11,560)Decrease (increase) in trade receivables ................................ (21,538) (99,707) (898,342)Decrease (increase) in cost on uncompleted contract ........... 16,948 7,641 68,844Decrease (increase) in inventories .......................................... (4,615) (10,239) (92,252)Decrease (increase) in other inventories ................................. 704 (1,047) (9,433)Decrease (increase) in accounts receivables - other .............. 4,085 11,545 104,018Decrease (increase) in other current assets ........................... 3,356 233 2,099Decrease (increase) in net defined benefit asset .................... 1,217 (1,822) (16,416)Decrease (increase) in investment and other assets ............... 3,374 (251) (2,262)Increase (decrease) in trade payables .................................... 85,141 (3,127) (28,174)Increase (decrease) in advances received and progress billings on uncompleted contracts ... (27,146) (48,947) (441,004)Increase (decrease) in deposits received ............................... 11,011 (27,110) (244,256)Other, net .............................................................................. 6,520 (7,882) (71,015)
254,943 (19,589) (176,493)Cash received (paid) during the year for:
Interest and dividend received ............................................... 4,792 4,972 44,797Interest paid .......................................................................... (1,684) (1,283) (11,560)Income taxes paid ................................................................. (51,031) (55,128) (496,694)
Net cash provided by (used in) operating activities ......... 207,020 (71,028) (639,950)
Cash flows from investing activities:
Decrease (increase) in time deposits ..................................... 705 (30,056) (270,799)Purchase of marketable and investment securities ................ (6,171) (17,363) (156,438)Proceeds from sale of marketable and investment securities ... 2,041 2,117 19,074Purchase of property, equipment and intangible assets ......... (9,354) (46,645) (420,263)Proceeds from sale of property, equipment and intangible assets ... 591 9,478 85,395Other, net .............................................................................. 336 180 1,622
Net cash provided by (used in) investing activities .......... (11,852) (82,289) (741,409)
Cash flows from financing activities:
Increase (decrease) in short-term loans ................................. (2,105) (9,380) (84,512)Proceeds from long-term loans ............................................. 44,850 12,600 113,524Repayment of long-term loans .............................................. (43,404) (19,726) (177,728)Repayment of long-term non-recourse loans ........................ (100) (2,950) (26,579)Redemption of non-recourse bonds ...................................... — (500) (4,505)Issue of bonds ...................................................................... 19,968 — —Redemption of bonds ........................................................... (10,000) (10,000) (90,098)Acquisition of treasury stock ................................................. (25,047) (36,014) (324,480)Cash dividends paid, including those to minority interest ....... (24,958) (29,907) (269,457)Other, net .............................................................................. (887) (321) (2,892)
Net cash provided by (used in) financing activities .......... (41,683) (96,198) (866,727)
Effect of exchange rate changes on cash and cash equivalents ..... (925) (247) (2,225)Net increase (decrease) in cash and cash equivalents ............... 152,560 (249,762) (2,250,311)Cash and cash equivalents at beginning of year ....................... 534,787 687,347 6,192,873Cash and cash equivalents at end of year (Note 3) ................... ¥ 687,347 ¥ 437,585 $ 3,942,562
The accompanying notes are an integral part of these statements.
85 TAISEI ANNUAL REPORT 2019

Notes to Consolidated Financial StatementsTAISEI CORPORATION and Consolidated Subsidiaries
Years Ended March 31, 2018 and 2019
1. Basis of Presenting Consolidated Financial StatementsThe accompanying consolidated financial statements of Taisei Corporation (the “Company”) and its consolidated subsidiaries (collectively the “Group”) have been prepared in accordance with the provisions set forth in the Japanese Financial Instruments and Exchange Law and its related accounting regulations, and in conformity with accounting principles generally accepted in Japan (“Japanese GAAP”), which are different in certain respects as to application and disclosure requirements of International Financial Reporting Standards.
The accompanying consolidated financial statements have been reformatted and translated into English (with some expanded descriptions) from the consolidated financial statements of the Company prepared in accordance with Japanese GAAP and filed with the appropriate Local Finance Bureau of the Ministry of Finance as required by the Financial Instruments and Exchange Law. Certain supplementary information, included in the statutory Japanese language consolidated financial statements but not required for fair presentation, is not presented in the accompanying consolidated financial statements.
The translations of the Japanese yen amounts into U.S. dollars are included solely for the convenience of readers outside Japan, using the prevailing exchange rate at March 31, 2019, which was ¥ 110.99 to U.S. $ 1. The translations should not be construed as representations of what the Japanese yen amounts have been, could have been, or could in the future be when converted into U.S. dollars at this or any other rate of exchange.
2. Summary of Significant Accounting Policies(a) Consolidation and equity methodThe Company prepares the consolidated financial statements including the accounts of the Company and those of its majority-owned subsidiaries, whether directly or indirectly controlled. The consolidated financial statements include the accounts of 32 subsidiaries for the year ended March 31, 2019 (31 subsidiaries for the year ended March 31, 2018). TAISEI PHILIPPINE CONSTRUCTION, Inc., which had been an equity method affiliate, was included in the scope of consolidation due to the acquisition of shares by the Group. In addition, TAISEI CONCESSION CORPORATION and one other company were included in the scope of consolidation by new establishments.
YB HAMACHO KAIHATSU TMK. and one other company were excluded from the scope of consolidation by liquidation.Exclusion of certain small-scale subsidiaries from the scope of consolidation does not have material impact on the consolidated financial
statements.All significant intercompany transactions, account balances and unrealized gains or losses have been eliminated in consolidation.
The financial statements of non-consolidated subsidiaries, and investments in affiliated companies in which the Group does not have control but has the ability to exercise significant influence, are accounted for by the equity method.
The financial statements in 20 non-consolidated subsidiaries, mainly consist of TOKYO ACADEMIC SERVICE Co., Ltd. and EHIME HOSPITAL PERTNERS Co., Ltd. are accounted for by the equity method for the year ended March 31, 2018 and 2019.
Investments in 38 affiliated companies are also accounted for by the equity method for the year ended March 31, 2019 (40 affiliated companies for the year ended March 31, 2018). TAISEI PHILIPPINE CONSTRUCTION, Inc. was excluded from the scope of equity method as the company was included in the scope of consolidation. One other affiliate was excluded from the scope of equity method due to sales of shares by the Company.
Exclusion of certain small-scale non-consolidated subsidiaries and the affiliated company from the scope of equity method does not have material effect on the consolidated financial statements.
All consolidated subsidiaries other than 11 consolidated overseas subsidiaries have the same balance sheet date, March 31, corresponding with that of the Company. As for the 11 consolidated overseas subsidiaries whose fiscal year ends at December 31, their financial statements as of December 31 are used in preparation of the consolidated financial statements. Significant transactions, if any, in the period from January 1 to March 31 have been adjusted in the consolidated financial statements.
(b) Valuation of Assets and Liabilities of Subsidiaries In the elimination of the investments in subsidiaries, the assets and liabilities of the subsidiaries including the portion allocated to non-controlling interests are recorded based on their fair value at the time the Company acquired control of the respective subsidiaries.
(c) Goodwill included in Intangible assets Significant excesses of investment cost over net equity of consolidated subsidiaries and affiliated companies accounted for by the equity method are recognized as goodwill (negative goodwill, if credit balance), and amortized principally over the estimated useful lives or less than twenty years on a straight-line basis. However, immaterial goodwill is charged to income in the year of acquisition. Negative goodwill is credited to income upon occurrence.
(d) Foreign Currency TranslationReceivables and payables denominated in foreign currencies are translated into Japanese yen at year-end exchange rates. The resulting exchange gains and losses are reflected in the consolidated statements of income. All revenues and expenses associated with foreign currencies are translated at rates of exchange prevailing when such transactions are made.
The financial statements of consolidated foreign subsidiaries and affiliated companies under the equity method are translated into Japanese yen at exchange rates prevailing at the respective year-end dates except for shareholders’ equity accounts, which are translated at historical rates. The resulting foreign currency translation adjustments are presented in accumulated other comprehensive income in the net assets section of the consolidated balance sheets.
(e) Cash and Cash Equivalents in the Consolidated Statements of Cash FlowsIn preparing the consolidated statements of cash flows, cash on hand, readily available deposits and short-term highly liquid investments with maturities not exceeding three months at the date of purchase and with insignificant risks of change in value are considered to be cash and cash equivalents.
(f) SecuritiesSecurities held by the Group are classified into (a) debt securities intended to be held to maturity, (b) equity securities issued by subsidiaries and affiliated companies, and (c) all other securities that are not classified in any of the categories above (hereafter “available-for-sale securities”).
Debt securities intended to be held to maturity are stated at amortized cost. Equity securities issued by subsidiaries and affiliated companies that are not consolidated or accounted for by the equity method are stated at moving-average cost. Available-for-sale securities with available fair market value is stated at fair market value. Unrealized holding gains and losses on securities, net of taxes are reported as a separate component of accumulated other comprehensive income in the net assets section. Realized gains and losses on sales of such securities are computed using moving-average cost. Other securities with no available fair market value are stated at moving-average cost.
Abou
t the
Tai
sei G
roup
Tow
ard
Sust
aina
ble
Grow
th o
f the
Taise
i Gro
upSp
ecia
l Fea
ture
Busi
ness
Sec
tion
ESG
Sect
ion
Data
Sec
tion
Data
Sec
tion
86TAISEI ANNUAL REPORT 2019

Notes to Consolidated Financial Statements (cont.)TAISEI CORPORATION and Consolidated Subsidiaries
Years Ended March 31, 2018 and 2019
(g) Revenue Recognition of Construction Revenue associated with construction contracts of which the outcome can be reliably estimated is accounted for by the percentage-of-completion method; otherwise contract revenue is accounted for by the completed-contract method. The percentage of completion at the end of the reporting period is determined by the percentage of the cost incurred to the estimated total costs.
(h) InventoriesThe Company and its certain subsidiaries develop real estate projects on their own account. Cost on development projects in progress are mainly stated at the lower of cost based on the specific-identification cost method or net realizable value. For this purpose, the cost includes the purchase cost of land, incidental costs, direct development costs and (in relation to certain developments by one of the subsidiaries) interest expenses.
Cost on uncompleted contracts is mainly stated at cost based on the specific-identification cost method.
(i) Tangible Fixed AssetsTangible fixed assets except for buildings and structures are recorded at cost and depreciated principally by the declining-balance method over the standard useful lives prescribed in the Corporation Tax Law. Buildings and structures are principally depreciated by the straight-line method.
(j) Accounting for Lease TransactionsFinance leases, except for certain immaterial or short-term finance leases in which ownership is not transferred to lessee, are capitalized. Capitalized leased assets whose ownership is transferred to lessee are depreciated by the same method of depreciation applied to property, plant and equipment. Capitalized leased assets whose ownership is not transferred to lessee are depreciated to a residual value of zero by the straight-line method over a useful life period corresponding to the lease contract period.
(k) Derivatives and Hedge AccountingDerivative financial instruments are stated at fair value and changes in fair value are recognized as gains or losses unless derivative financial instruments are used for hedging purposes.
If derivative financial instruments are used as hedges and meet certain hedging criteria, the Company and its consolidated domestic subsidiaries defer recognition of gains or losses resulting from changes in fair value of the derivative financial instruments until related losses or gains on hedged items are recognized.
If interest rate swap contracts are used as hedge and meet certain hedging criteria, net amounts to be paid or received under the interest rate swap contracts are added to or deducted from the interest on liabilities for which the swap contract were executed.
(l) Income TaxesThe Company and its wholly owned domestic subsidiaries apply the system of consolidated tax returns.
(m) Allowance for Doubtful AccountsAllowance for doubtful accounts is provided to reserve for probable losses from bad debt. It consists of the estimated uncollectible amount of certain identified doubtful receivables and the amount estimated on the basis of the past default ratio for normal receivables.
(n) Allowance for Warranty on Completed ContractsAllowance for warranty on completed contracts is provided as the amount estimated using an actual ratio of related losses during the past certain periods.
(o) Allowance for Losses on Construction ContractsAllowance for losses on construction contracts is provided with respect to construction projects for which eventual losses are reasonably estimated.
(p) Allowance for Losses on Order ReceivedAllowance for losses on order received is provided with respect to orders (excluding construction contracts) for which eventual losses are reasonably estimated.
(q) Retirement Benefits for Directors and Audit & Supervisory Board MembersRetirement benefits for directors and audit & supervisory board members of certain consolidated subsidiaries have been set up in accordance with each company’s regulations.
(r) Allowance for Losses on Investments in Subsidiaries and AffiliatesAllowance for losses on investments in subsidiaries and affiliates is provided for estimated losses from certain subsidiaries and affiliates in liquidation.
(s) Allowance for Environmental SpendingAllowance for environmental spending is provided based on estimated costs for disposal of Polychlorinated Biphenyl (“PCB”) waste, which is obligated to dispose by the Act on Special Measures Concerning Promotion of Proper Treatment of PCB Waste.
(t) Allowance for Losses on Anti-Monopoly ActAllowance for losses on Anti-Monopoly Act is provided based on estimated payment for penalties under the Anti-Monopoly Act.
(u) Accounting Method for Retirement BenefitNet defined benefit liability is provided for severance and retirement benefits for employees and executive officers of the Company’s certain consolidated subsidiaries based on estimated amounts of projected benefit obligations and plan assets at the year-end.
In calculating projected benefit obligations, the method of attributing estimated amounts of retirement benefits to the period until this fiscal year is based on the benefit formula basis.
Past service costs are amortized using the straight-line method (some consolidated subsidiaries use the declining-balance method) over 1-10 years, which is not longer than an average remaining service period of the employees when the costs are incurred.
Actuarial gains and losses are amortized from the subsequent fiscal year (some consolidated subsidiaries amortize actuarial gains and losses from the current fiscal year) using the straight line method (some consolidated subsidiaries use the declining balance method) over 1-10 years, which is not longer than an estimated average remaining service period of the employees when the gains or losses are incurred.
(v) Net Income and Cash Dividends per ShareNet income per share is calculated by dividing net income available to common shares by the weighted average number of common shares outstanding during the year. Cash dividends per share shown for each year represent dividends declared as applicable to the respective years.
87 TAISEI ANNUAL REPORT 2019

(w) ReclassificationsCertain prior year amounts have been reclassified to conform to the current year presentation. These reclassifications have no impact on previously reported results of operations or retained earnings.
(x) Accounting standard issued but not yet effective The following standard and guidance were issued but are not yet effective - “Accounting Standard for Revenue Recognition” (ASBJ Statement No.29, March 30, 2018)- “Implementation Guidance on Accounting Standard for Revenue Recognition” (ASBJ Guidance No.30, March 30, 2018) (1) OverviewThe IASB and the FASB jointly developed and issued a converged Standard on the recognition of ‘Revenue from Contracts with Customers’ (IFRS 15 for IASB and Topic 606 for FASB.) in May, 2014. IFRS 15 will be applied from the fiscal year beginning on or after January 1, 2018 and Topic 606 will be applied from the fiscal year beginning after December 15, 2017. Under these circumstances, the ASBJ developed the converged standard for revenue recognition and issued the “Accounting Standard for Revenue Recognition” along with “Implementation Guidance on Accounting Standard for Revenue Recognition”.
In developing the ‘Accounting Standard for Revenue Recognition,’ the principal policy of the ASBJ is to incorporate the basic concept of IFRS 15 from the perspective of comparability between financial statements, as one way to establish consistency with IFRS 15. The ASBJ will add alternative treatments in the case that there are different accounting treatments prevalent in accounting practices in Japan that require consideration, to the extent that they do not impair comparability.(2) Effective dateEffective from the beginning of the fiscal year ending March 31, 2022.(3) Effects of the application of the standardsThe Company and its consolidated subsidiaries are currently in the process of determining the effects of these new standards on the consolidated financial statements.
(y) Changes in presentation(1) Changes due to application of “Partial Amendments to Accounting Standard for Tax Effect Accounting” (ASBJ Statement No.28, February 16, 2018 (“Statement No.28”))The Group applied Statement No.28 from the beginning of this fiscal year. Accordingly, the Group changed the presentation, such that deferred income tax assets and deferred income tax liabilities are classified as part of investments and other assets and long-term liabilities, respectively.
As a result, deferred income tax assets of ¥ 24,777 million classified as “current assets” have been included in deferred income tax assets ¥ 6,557 million in “investments and other assets” in the consolidated balance sheet as of the end of the previous fiscal year. In addition, due to the effect of offsetting deferred income tax assets and deferred income tax liabilities by the same taxable entity, total assets and total liabilities decreased by ¥ 20,227 million, respectively.
3. Cash and Cash EquivalentsCash and cash equivalents as of March 31, 2018 and 2019 consisted of the following:
Millions of Yen Thousands of U.S. Dollars
2018 2019 2019
Cash and time deposits .......................................................................... ¥ 687,456 ¥ 467,750 $ 4,214,344
Less: Time deposits with maturities exceeding three months .................. (109) (30,165) (271,782)
Cash and cash equivalents ..................................................................... ¥ 687,347 ¥ 437,585 $ 3,942,562
4. Financial Instruments(1) Policies for using financial instrumentsThe Group restricts investments to the low risk assets such as deposits, and raise funds by the indirect finance such as loans from bank as well as by the direct finance such as issuing corporate bonds or commercial papers.
Derivative financial instruments are employed mainly for hedging fluctuation in interest rate and foreign currency exchange, not for speculation.
Receivables: trade notes and trade accounts are exposed to the credit risks of customers. In order to reduce such risks, the Group conducts strict credit examinations when orders are received, and afterward manage the receivables individually and make effort to detect reduction of credit risks early.
For investment securities which are mainly debt securities intended to be held to maturity and shares held to keep the relationship with business partners, the Group regularly monitors the fair value or financial positions of the invested companies, and revises the portfolio timely (except for debt securities intended to be held to maturity) considering the relationship with them.
Debts, trade payables: trade notes and trade accounts are debts mostly due within one year. Loans, commercial papers and bonds are primarily for working capital, and have maturity dates of five years or less. Although the loans or bonds issued at variable rates are exposed to interest rate fluctuation risk, the risk is hedged by derivative transactions (interest rate swap contracts).
The Group primarily utilizes derivative transactions related to interest rates in order to mitigate the fluctuation risk in interest rates or to reduce financing costs, and derivative transactions related to currency in order to mitigate the foreign exchange risk. These transactions are exposed to the fluctuation risk in interest rates and the foreign exchange risk. However, the Group is exposed to limited risk, because most of them are hedged by the corresponding transactions. They consider the credit risk to be low, because they conduct derivative transactions solely with reliable international financial institutions.
The Group executes and manages derivative transactions in accordance with internal rules. Their Finance Departments are responsible for conducting, evaluating transactions and managing related risks.
(2) Fair Value of Financial InstrumentsBook value of the financial instruments was included in the consolidated balance sheet, the fair value of said items as of March 31, 2018 and 2019, was as follows. Items for which it is extremely difficult to calculate the fair value were not included in the following table (see “Note 2” below).
Abou
t the
Tai
sei G
roup
Tow
ard
Sust
aina
ble
Grow
th o
f the
Taise
i Gro
upSp
ecia
l Fea
ture
Busi
ness
Sec
tion
ESG
Sect
ion
Data
Sec
tion
Data
Sec
tion
88TAISEI ANNUAL REPORT 2019

Notes to Consolidated Financial Statements (cont.)TAISEI CORPORATION and Consolidated Subsidiaries
Years Ended March 31, 2018 and 2019
Millions of Yen
2018
Book Value Fair Value Difference
ASSETS
Cash and time deposits .......................................................................... ¥ 687,456 ¥ 687,456 ¥ —
Notes and accounts receivable, trade ..................................................... 441,631 441,627 (4)
Investment securities
Debt securities intended to be held to maturity ................................... 662 678 16
Available-for-sale securities ................................................................. 270,938 270,938 —
LIABILITIES
Notes and accounts payable, trade ........................................................ 509,576 509,576 —
Short-term loans and long term loans due within one year ...................... 87,030 87,114 (84)
Short-term non-recourse loans payable .................................................. 2,950 2,967 (17)
Straight bonds due within one year ......................................................... 10,000 10,012 (12)
Non-recourse bonds due within one year ............................................... 500 503 (3)
Deposits received ................................................................................... 182,142 182,142 —
Straight bonds ........................................................................................ 40,000 40,309 (309)
Long-term loans ..................................................................................... 106,900 107,813 (913)
[Derivative financial instruments (*)] ......................................................... (10) (10) —
Millions of Yen
2019
Book Value Fair Value Difference
ASSETS
Cash and time deposits .......................................................................... ¥ 467,750 ¥ 467,750 ¥ —
Notes and accounts receivable, trade ..................................................... 542,009 542,009 (0)
Investment securities
Debt securities intended to be held to maturity ................................... 619 631 12
Available-for-sale securities ................................................................. 299,246 299,246 —
LIABILITIES
Notes and accounts payable, trade ........................................................ 507,335 507,335 —
Short-term loans and long term loans due within one year ...................... 90,952 91,072 (120)
Short-term non-recourse loans payable .................................................. — — —
Straight bonds due within one year ......................................................... — — —
Non-recourse bonds due within one year ............................................... — — —
Deposits received ................................................................................... 155,030 155,030 —
Straight bonds ........................................................................................ 40,000 40,394 (394)
Long-term loans ..................................................................................... 86,472 87,196 (724)
[Derivative financial instruments (*)] ......................................................... 1 1 —
Thousands of U.S. dollars
2019
Book Value Fair Value Difference
ASSETS
Cash and time deposits .......................................................................... $ 4,214,344 $ 4,214,344 $ —
Notes and accounts receivable, trade ..................................................... 4,883,404 4,883,404 (0)
Investment securities
Debt securities intended to be held to maturity ................................... 5,577 5,685 108
Available-for-sale securities ................................................................. 2,696,153 2,696,153 —
LIABILITIES
Notes and accounts payable, trade ........................................................ 4,570,997 4,570,997 —
Short-term loans and long term loans due within one year ...................... 819,461 820,542 (1,081)
Short-term non-recourse loans payable .................................................. — — —
Straight bonds due within one year ......................................................... — — —
Non-recourse bonds due within one year ............................................... — — —
Deposits received ................................................................................... 1,396,793 1,396,793 —
Straight bonds ........................................................................................ 360,393 363,943 (3,550)
Long-term loans ..................................................................................... 779,097 785,620 (6,523)
[Derivative financial instruments (*)] ......................................................... 9 9 —
(*) Note: The assets and liabilities are reported as net amounts. Any items for which the total becomes a net liability are indicated in
parentheses.
89 TAISEI ANNUAL REPORT 2019

Note 1: The calculation method of the fair value of financial instrument and securities, derivative transactions
ASSETS
∙ Cash and time deposits and Notes and accounts receivable, trade
The fair value of these financial instruments is almost equivalent to the book value, due to the short term settlements; although, the fair value
of receivables due after one year is based on the present value of discounted cash flows using the interest rate determined by the factors of
the estimated collection terms and credit risks with respect to each receivables categorized by collection terms.
∙ Investment securities
The fair value of marketable securities is based on the quoted market value, and bonds are based on the market value, the price indicated
by a third party such as broker or the present value of discounted cash flows.
See the notes on “5. Securities” for notes pertaining to securities categorized by the purposes for which they are held.
LIABILITIES
∙ Notes and accounts payable, trade, Short-term loans and Long term loans due within one year and Deposits received
The fair value of these financial instruments are almost equivalent to the book value, due to the short term settlements; although, the fair
value of long-term loans due within one year is based on the same method as that for long-term loans.
∙ Short-term non-recourse loans payable and Long-term loans
The fair value of these financial instruments is based on the present value of discounted cash flows by the interest rate which may be
applicable when the same kind of loans is conducted.
∙ Bonds
The fair value of marketable bonds is based on the quoted market value, otherwise the fair value of nonmarketable bonds is based on the
present value of discounted cash flows using the interest rate determined by the factors of the estimated redemption terms and issuer’s
credit risk.
[Derivative financial instruments]
See the notes on “14. Derivative Transactions”.
Note 2: Financial instruments which are extremely difficult to calculate the fair value
Nonmarketable securities (book value amount to ¥ 65,782 million and ¥ 67,762 million ($ 610,523 thousand) as of March 31, 2018 and
2019, respectively) are not included in the Assets Investment securities–Available-for-sale securities above, as it is extremely difficult to
calculate the fair value because they have no quoted market prices and the future cash flows cannot be estimated.
Note 3: Scheduled redemption amounts after the consolidated balance sheet date for monetary claims and securities with period of
maturities as of March 31, 2018 and 2019 were as follows:
Millions of Yen
2018
Due within one year
Due after one year but
within five years
Due after five years but
within ten years
Time deposits ......................................................................................... ¥ 687,018 ¥ — ¥ —
Notes and accounts receivable, trade ..................................................... 440,051 1,580 —
Investment securities
Debt securities intended to be held to maturity
Government bonds ......................................................................... 45 381 236
Available-for-sale securities
Government bonds ......................................................................... 0 — —
Total ................................................................................... ¥ 1,127,114 ¥ 1,961 ¥ 236
Millions of Yen
2019
Due within one year
Due after one year but
within five years
Due after five years but
within ten years
Time deposits ......................................................................................... ¥ 467,333 ¥ — ¥ —
Notes and accounts receivable, trade ..................................................... 540,248 1,761 —
Investment securities
Debt securities intended to be held to maturity
Government bonds ......................................................................... 337 83 199
Available-for-sale securities
Government bonds ......................................................................... 1 — —
Total ................................................................................... ¥ 1,007,919 ¥ 1,844 ¥ 199
Abou
t the
Tai
sei G
roup
Tow
ard
Sust
aina
ble
Grow
th o
f the
Taise
i Gro
upSp
ecia
l Fea
ture
Busi
ness
Sec
tion
ESG
Sect
ion
Data
Sec
tion
Data
Sec
tion
90TAISEI ANNUAL REPORT 2019

Notes to Consolidated Financial Statements (cont.)TAISEI CORPORATION and Consolidated Subsidiaries
Years Ended March 31, 2018 and 2019
Thousands of U.S. Dollars
2019
Due within one year
Due after one year but
within five years
Due after five years but
within ten years
Time deposits ......................................................................................... $ 4,210,586 $ — $ —
Notes and accounts receivable, trade ..................................................... 4,867,538 15,866 —
Investment securities
Debt securities intended to be held to maturity
Government bonds ......................................................................... 3,036 748 1,793
Available-for-sale securities
Government bonds ......................................................................... 9 — —
Total ................................................................................... $ 9,081,169 $ 16,614 $ 1,793
Note 4: See the notes on “8. Short-term Loans and Long-term Debt” for notes pertaining to the aggregate annual maturities of long term
debt after the consolidated balance sheet date.
5. Securities(1) Following tables summarized acquisition costs, book value and fair value of securities with fair value available as of March 31, 2018 and
2019:
(a) Debt securities intended to be held to maturity:
∙ Securities with fair value exceeding book value
Millions of Yen
2018
Type Book value Fair value Difference
Government bonds ............................ ¥ 662 ¥ 678 ¥ 16
Millions of Yen Thousands of U.S. Dollars
2019 2019
Type Book value Fair value Difference Book value Fair value Difference
Government bonds ............................ ¥ 619 ¥ 631 ¥ 12 $ 5,577 $ 5,685 $ 108
Securities with fair value not exceeding book value were not applicable as of March 31, 2018 and 2019.
(b) Available-for-sale securities:
∙ Securities with book value exceeding acquisition costs
Millions of Yen
2018
Type Book value Acquisition cost Difference
Equity securities ................................. ¥ 257,429 ¥ 113,851 ¥ 143,578
Government bonds ............................ — — —
Others ............................................... 975 642 333
Total ........................ ¥ 258,404 ¥ 114,493 ¥ 143,911
Millions of Yen Thousands of U.S. Dollars
2019 2019
Type Book value Acquisition cost Difference Book value Acquisition cost Difference
Equity securities ................................. ¥ 281,476 ¥ 122,456 ¥ 159,020 $ 2,536,048 $ 1,103,307 $ 1,432,741
Government bonds ............................ — — — — — —
Others ............................................... 1,104 642 462 9,947 5,784 4,163
Total ........................ ¥ 282,580 ¥ 123,098 ¥ 159,482 $ 2,545,995 $ 1,109,091 $ 1,436,904
∙ Securities with book value not exceeding acquisition costs
Millions of Yen
2018
Type Book value Acquisition cost Difference
Equity securities ................................. ¥ 12,420 ¥ 14,291 ¥ (1,871)
Government bonds ............................ 0 0 (0)
Others ............................................... 114 114 (0)
Total ........................ ¥ 12,534 ¥ 14,405 ¥ (1,871)
91 TAISEI ANNUAL REPORT 2019

Millions of Yen Thousands of U.S. Dollars
2019 2019
Type Book value Acquisition cost Difference Book value Acquisition cost Difference
Equity securities ................................. ¥ 16,551 ¥ 19,284 ¥ (2,733) $ 149,122 $ 173,746 $ (24,624)
Government bonds ............................ 1 1 (0) 9 9 (0)
Others ............................................... 114 114 (0) 1,027 1,027 (0)
Total ........................ ¥ 16,666 ¥ 19,399 ¥ (2,733) $ 150,158 $ 174,782 $ (24,624)
(2) Total sales of available-for-sale securities and the related gains and losses for the years ended March 31, 2018 and 2019 were as follows:
Millions of Yen
2018
Type Equity securities Others Total
Total amount of available-for-sale
securities sold ................................. ¥ 1,531 ¥ — ¥ 1,531
Gains on sales of available-for-sale
securities ......................................... 779 — 779
Losses on sales of available-for-sale
securities ......................................... 20 — 20
Millions of Yen
2019
Type Equity securities Others Total
Total amount of available-for-sale
securities sold ................................. ¥ 472 ¥ — ¥ 472
Gains on sales of available-for-sale
securities ......................................... 153 — 153
Losses on sales of available-for-sale
securities ......................................... 31 — 31
Thousands of U.S. Dollars
2019
Type Equity securities Others Total
Total amount of available-for-sale
securities sold ................................. $ 4,253 $ — $ 4,253
Gains on sales of available-for-sale
securities ......................................... 1,379 — 1,379
Losses on sales of available-for-sale
securities ......................................... 279 — 279
(3) Impairment losses on securities
The Group recognized impairment losses on the following securities for the years ended March 31, 2018 and 2019 were as follows:
Millions of Yen
Thousands of
U.S. Dollars
Type 2018 2019 2019
Write-down of investment securities ... ¥ 4 ¥ 92 $ 829Ab
out t
he T
aise
i Gro
upTo
war
d Su
stai
nabl
e Gr
owth
of t
he Ta
isei G
roup
Spec
ial F
eatu
reBu
sine
ss S
ectio
nES
G Se
ctio
nDa
ta S
ectio
nDa
ta S
ectio
n
92TAISEI ANNUAL REPORT 2019

Notes to Consolidated Financial Statements (cont.)TAISEI CORPORATION and Consolidated Subsidiaries
Years Ended March 31, 2018 and 2019
6. Pledged Assets(1) The following assets were pledged as liabilities as of March 31, 2018 and 2019:
Secured liabilities
Millions of Yen Thousands of U.S. Dollars
2018 2019 2019
Short-term non-recourse loans payable .................................................. ¥ 2,950 ¥ — $ —
Short-term loans ..................................................................................... 1,600 — —
Non-recourse bonds due within one year ............................................... 500 — —
Total ................................................................................... ¥ 5,050 ¥ — $ —
Pledged Assets
Millions of Yen Thousands of U.S. Dollars
2018 2019 2019
Land ....................................................................................................... ¥ 6,311 ¥ — $ —
Buildings and structures net of accumulated depreciation ...................... 1,182 — —
Machinery, vehicles and equipment net of accumulated depreciation ...... 11 — —
Total ................................................................................... ¥ 7,504 ¥ — $ —
(2) The following assets were pledged principally as collateral for loans of companies which were not consolidated as of March 31, 2018 and
2019:
Millions of Yen Thousands of U.S. Dollars
2018 2019 2019
Investment securities .............................................................................. ¥ 2,895 ¥ 2,876 $ 25,912
Other assets ........................................................................................... 1,589 1,739 15,668
Total ................................................................................... ¥ 4,484 ¥ 4,615 $ 41,580
7. Amount of notes receivable and notes payable with maturity on the balance sheet date (the “Date”) and the day before the Date (the bank holidays)
Notes receivable and notes payable are processed on the clearing date or the settlement date. As the Date and the day before the Date
were bank holidays, notes receivable and notes payable maturing on that days could not be settled and were included in the consolidated
balance sheets, as follows:
Millions of Yen Thousands of U.S. Dollars
2018 2019 2019
Notes receivable (Trade) ...................................................................... ¥ 593 ¥ 315 $ 2,838
Electronically recorded monetary claims .............................................. 1,066 164 1,478
Notes receivable (Other) ...................................................................... 54 29 261
Notes payable (Trade) ......................................................................... 6,606 5,606 50,509
Electronically recorded obligations ...................................................... 21,628 30,407 273,962
Notes payable (Other) ......................................................................... 8 13 117
Electronically recorded obligations (Other) ........................................... — 1 9
93 TAISEI ANNUAL REPORT 2019
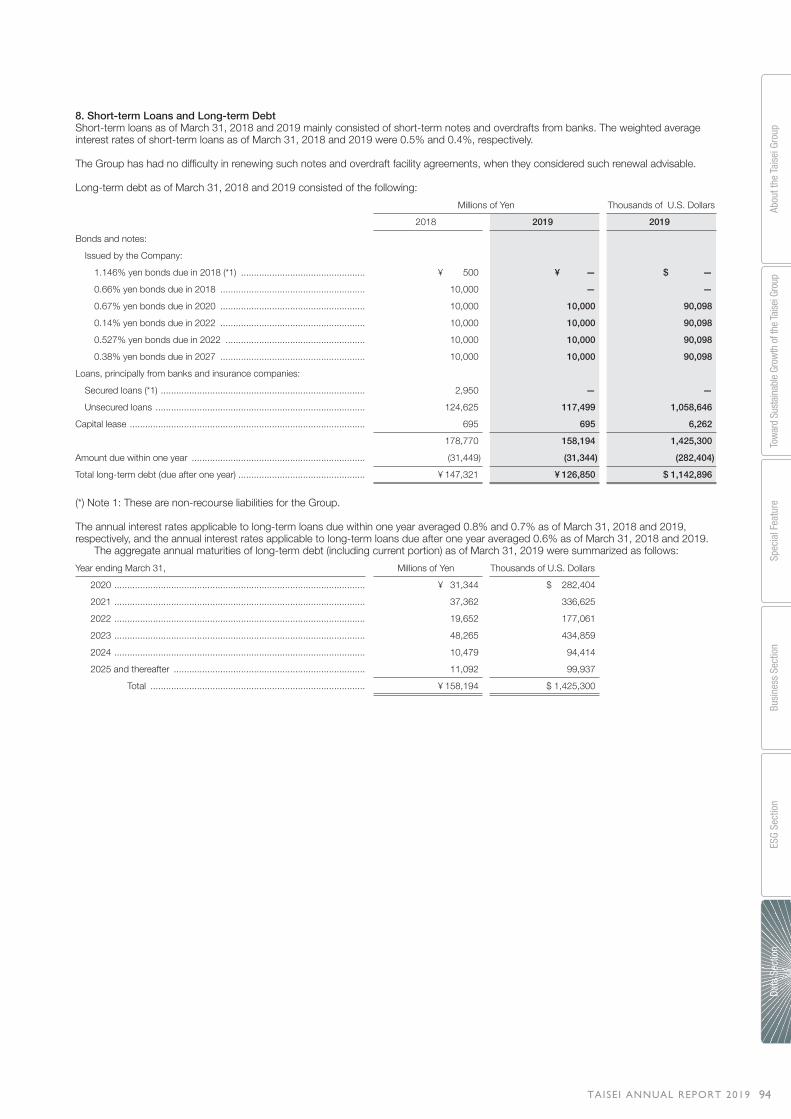
8. Short-term Loans and Long-term Debt Short-term loans as of March 31, 2018 and 2019 mainly consisted of short-term notes and overdrafts from banks. The weighted average
interest rates of short-term loans as of March 31, 2018 and 2019 were 0.5% and 0.4%, respectively.
The Group has had no difficulty in renewing such notes and overdraft facility agreements, when they considered such renewal advisable.
Long-term debt as of March 31, 2018 and 2019 consisted of the following:
Millions of Yen Thousands of U.S. Dollars
2018 2019 2019
Bonds and notes:
Issued by the Company:
1.146% yen bonds due in 2018 (*1) ................................................ ¥ 500 ¥ — $ —
0.66% yen bonds due in 2018 ........................................................ 10,000 — —
0.67% yen bonds due in 2020 ........................................................ 10,000 10,000 90,098
0.14% yen bonds due in 2022 ........................................................ 10,000 10,000 90,098
0.527% yen bonds due in 2022 ...................................................... 10,000 10,000 90,098
0.38% yen bonds due in 2027 ........................................................ 10,000 10,000 90,098
Loans, principally from banks and insurance companies:
Secured loans (*1) ............................................................................... 2,950 — —
Unsecured loans ................................................................................. 124,625 117,499 1,058,646
Capital lease ........................................................................................... 695 695 6,262
178,770 158,194 1,425,300
Amount due within one year ................................................................... (31,449) (31,344) (282,404)
Total long-term debt (due after one year) ................................................. ¥ 147,321 ¥ 126,850 $ 1,142,896
(*) Note 1: These are non-recourse liabilities for the Group.
The annual interest rates applicable to long-term loans due within one year averaged 0.8% and 0.7% as of March 31, 2018 and 2019,
respectively, and the annual interest rates applicable to long-term loans due after one year averaged 0.6% as of March 31, 2018 and 2019.
The aggregate annual maturities of long-term debt (including current portion) as of March 31, 2019 were summarized as follows:
Year ending March 31, Millions of Yen Thousands of U.S. Dollars
2020 ................................................................................................. ¥ 31,344 $ 282,404
2021 ................................................................................................. 37,362 336,625
2022 ................................................................................................. 19,652 177,061
2023 ................................................................................................. 48,265 434,859
2024 ................................................................................................. 10,479 94,414
2025 and thereafter .......................................................................... 11,092 99,937
Total ................................................................................... ¥ 158,194 $ 1,425,300
Abou
t the
Tai
sei G
roup
Tow
ard
Sust
aina
ble
Grow
th o
f the
Taise
i Gro
upSp
ecia
l Fea
ture
Busi
ness
Sec
tion
ESG
Sect
ion
Data
Sec
tion
Data
Sec
tion
94TAISEI ANNUAL REPORT 2019

Notes to Consolidated Financial Statements (cont.)TAISEI CORPORATION and Consolidated Subsidiaries
Years Ended March 31, 2018 and 2019
9. Income TaxesTaxes on income consist of corporation, enterprise and inhabitants taxes.
The reconciliations for the year ended March 31, 2018 and 2019 are not presented because the difference between the statutory tax
rate and the effective tax rate were less than or equal to 5% of the statutory tax rate.
Significant components of deferred income taxes at March 31, 2018 and 2019 were as follows:
Millions of Yen Thousands of U.S. Dollars
2018 2019 2019
Deferred income tax assets:
Disallowed portion of expenses and losses:
Net defined benefit liability ............................................................... ¥ 35,566 ¥ 37,037 $ 333,697
Inventories ....................................................................................... 13,023 8,188 73,773
Accrued bonuses ............................................................................ 7,107 7,148 64,402
Fixed assets .................................................................................... 2,829 2,537 22,858
Advances received .......................................................................... 1,173 2,180 19,641
Others ............................................................................................. 7,842 7,484 67,429
Tax loss carryforward .......................................................................... 532 776 6,992
Unrealized profits ................................................................................ 7,523 7,414 66,799
Sub-total ............................................................................ 75,595 72,764 655,591
Valuation allowance ............................................................................. (4,288) (4,348) (39,175)
Total ................................................................................... 71,307 68,416 616,416
Deferred income tax liabilities:
Unrealized holding gains on securities ................................................. (43,446) (47,948) (432,003)
Gains on securities contribution to employee retirement benefit trust ... (17,711) (17,711) (159,573)
Net defined benefit asset .................................................................... (3,830) (3,920) (35,318)
Others ................................................................................................. (1,194) (1,121) (10,100)
Total ................................................................................... (66,181) (70,700) (636,994)
Net total ............................................................................. ¥ 5,126 ¥ (2,284) $ (20,578)
In addition to the deferred income taxes shown above, deferred tax liabilities concerning revaluation of land amounting to ¥ 3,286 million ($
29,606 thousand) as of March 31, 2018 and 2019 were presented separately in the consolidated balance sheets.
95 TAISEI ANNUAL REPORT 2019

10. Investment and Rental Property(1) The Company and certain consolidated subsidiaries hold some office buildings for rent in Tokyo and other areas. The rental income on
office buildings for rent was ¥ 2,683 million and ¥ 4,040 million ($ 36,400 thousand) at the year ended March 31, 2018 and 2019,
respectively. Rental income is mainly booked in Net sales: Real estate development and other, and rental cost is mainly booked in Cost of
sales.
(2) The amounts of investment and rental property which booked in consolidated balance sheets, the amounts of increase or decrease, and
fair value as of March 31, 2018 and 2019 were as follows:
Millions of Yen
2018
Book value Fair value
April 1, 2017 Increase (decrease) March 31, 2018 March 31, 2018
¥ 56,693 ¥ 25,754 ¥ 82,447 ¥ 100,065
Millions of Yen
2019
Book value Fair value
April 1, 2018 Increase (decrease) March 31, 2019 March 31, 2019
¥ 82,447 ¥ 27,271 ¥ 109,718 ¥ 138,796
Thousands of U.S. Dollars
2019
Book value Fair value
April 1, 2018 Increase (decrease) March 31, 2019 March 31, 2019
$ 742,833 $ 245,707 $ 988,540 $ 1,250,527
Note 1: The carrying amount is stated at cost of acquisition less accumulated depreciation and impairment losses.
Note 2: The main reasons of increase for the year ended March 31, 2018 was the reclassification from inventories (real estate) amounting to
¥ 26,032 million. The main reasons of increase and decrease for the year ended March 31, 2019 were acquisition of fixed assets ¥
36,460 million ($ 328,498 thousand) and sales of fixed assets ¥ 7,686 million ($ 69,249 thousand) , respectively.
Note 3: The book value as of March 31, 2018 and 2019 included asset retirement obligations of ¥ 206 million and ¥ 199 million ($ 1,793
thousand), respectively.
Note 4: The fair value of investment and rental property as of March 31, 2018 and 2019 were mainly calculated by the Company according
to the Japanese Real Estate Appraisal Standards (it may include adjustments using official indices).
11. Employees’ Severance and Retirement Benefits1. The Company and its main consolidated subsidiaries have adopted the defined-benefit pension plans and defined-contribution pension
plans. The defined-benefit pension plans adopted consist of defined-benefit corporate pension plans and lump-sum payment plans.
Liabilities and expenses for severance and retirement benefits of the Company and its consolidated domestic subsidiaries are
determined based on amounts obtained by actuarial calculations. The Company may also pay additional retirement benefits which are not
subject to actuarial calculation.
The Company has established a retirement benefit trust.
2. Defined-benefit pension plans
(1) Movement in retirement benefit obligations
Millions of Yen Thousands of U.S. Dollars
2018 2019 2019
Balance at beginning of the year ............................................................. ¥ 145,642 ¥ 143,380 $ 1,291,828
Current service cost ............................................................................ 6,312 6,454 58,149
Interest cost ........................................................................................ 907 877 7,902
Actuarial loss (gain) ............................................................................. 1,310 447 4,027
Benefits paid ....................................................................................... (10,502) (10,741) (96,774)
Past service costs ............................................................................... (450) (808) (7,280)
Other .................................................................................................. 161 239 2,153
Balance at end of the year ...................................................................... ¥ 143,380 ¥ 139,848 $ 1,260,005
Some of the consolidated subsidiaries use simplified method for the calculation of retirement benefit obligations.
Retirement benefit expenses in the consolidated subsidiaries applying simplified method are recorded in current service cost.
Abou
t the
Tai
sei G
roup
Tow
ard
Sust
aina
ble
Grow
th o
f the
Taise
i Gro
upSp
ecia
l Fea
ture
Busi
ness
Sec
tion
ESG
Sect
ion
Data
Sec
tion
Data
Sec
tion
96TAISEI ANNUAL REPORT 2019

Notes to Consolidated Financial Statements (cont.)TAISEI CORPORATION and Consolidated Subsidiaries
Years Ended March 31, 2018 and 2019
(2) Movements in plan assets
Millions of Yen Thousands of U.S. Dollars
2018 2019 2019
Balance at beginning of the year ............................................................. ¥ 115,157 ¥ 117,153 $ 1,055,527
Expected return on plan assets ........................................................... 1,938 2,457 22,137
Actuarial loss (gain) ............................................................................. 6,246 (4,582) (41,283)
Contributions paid by the employer ..................................................... 1,056 1,060 9,550
Benefits paid ....................................................................................... (6,360) (5,811) (52,356)
Other .................................................................................................. (883) (1,064) (9,586)
Balance at end of the year ...................................................................... ¥ 117,154 ¥ 109,213 $ 983,989
(3) Reconciliation from retirement benefit obligations and plan assets to net defined benefit liability (asset)
Millions of Yen Thousands of U.S. Dollars
2018 2019 2019
Funded retirement benefit obligations ..................................................... ¥ 140,567 ¥ 136,731 $ 1,231,922
Plan assets ............................................................................................. (117,154) (109,213) (983,990)
23,413 27,518 247,932
Unfunded retirement benefit obligations .................................................. 2,813 3,117 28,084
Net total at year-end ............................................................................... 26,226 30,635 276,016
Net defined benefit liability ...................................................................... 35,787 42,022 378,611
Net defined benefit asset ........................................................................ (9,561) (11,387) (102,595)
Net total at year-end ............................................................................... ¥ 26,226 ¥ 30,635 $ 276,016
(4) Retirement benefit expenses
Millions of Yen Thousands of U.S. Dollars
2018 2019 2019
Current service cost ................................................................................ ¥ 6,312 ¥ 6,454 $ 58,149
Interest cost ........................................................................................... 907 877 7,902
Expected return on plan assets .............................................................. (1,938) (2,457) (22,137)
Net actuarial loss amortization ................................................................ 4,238 721 6,496
Past service costs amortization ............................................................... (1,288) (1,334) (12,019)
Other ...................................................................................................... 1 6 54
Total retirement benefit expenses for the year ......................................... ¥ 8,232 ¥ 4,267 $ 38,445
(5) Remeasurements of defined benefit plans
Items recorded in remeasurements of defined benefit plans (before considering tax effect) were as follows:
Millions of Yen Thousands of U.S. Dollars
2018 2019 2019
Past service costs .................................................................................. ¥ (838) ¥ (525) $ (4,730)
Actuarial loss (gain) ................................................................................. 9,174 (4,309) (38,823)
Total balance as of March 31, 2018 and 2019 ........................................ ¥ 8,336 ¥ (4,834) $ (43,553)
(6) Accumulated remeasurements of defined benefit plans
Items recorded in accumulated remeasurements of defined benefit plans (before considering tax effect) were as follows:
Millions of Yen Thousands of U.S. Dollars
2018 2019 2019
Unrecognized past service costs ............................................................ ¥ (6,368) ¥ (5,842) $ (52,635)
Unrecognized actuarial loss (gain) ........................................................... (6,760) (2,451) (22,083)
Total balance as of March 31, 2018 and 2019 ........................................ ¥ (13,128) ¥ (8,293) $ (74,718)
97 TAISEI ANNUAL REPORT 2019

(7) Plan assets
2018 2019
① Plan assets comprise:
Equity securities ................................................................................. 48% 46%
Bonds ................................................................................................ 20 21
General accounts ............................................................................... 18 18
Special accounts ............................................................................... 3 3
Short-term assets .............................................................................. 1 1
Other ................................................................................................. 10 11
Total .................................................................................... 100% 100%
The retirement benefit trust established for corporate pension plans accounted for 41% and 40% of total plan assets, for the fiscal year
ended March 31, 2018 and 2019, respectively.
② Long-term expected rate of return
Current and target asset allocations, historical and expected returns on various categories of plan assets have been considered in
determining the long-term expected rate of return.
(8) Actuarial assumptions
The principal actuarial assumptions as of March 31, 2018 and 2019 were as follows:
2018 2019
Discount rate
The Company and its consolidated domestic subsidiaries 0.4∼1.5 0.4∼1.5
Consolidated overseas subsidiaries 6.3 7.5∼8.0
Long-term expected rate of return 1.0∼3.0 1.0∼3.0
3. Defined-contribution pension plans
Amount payable for defined-contribution pension plans of the Company and its consolidated subsidiaries were ¥ 2,490 million and ¥ 2,550
million ($ 22,975 thousand), for the fiscal year ended March 31, 2018 and 2019, respectively.
12. Net assetsNet assets comprise three subsections; which are shareholders’ equity, accumulated other comprehensive income and non-controlling
interests.
Under Japanese laws and regulations, the entire amount paid for new shares is required to be designated as common stock. However,
a company may, by a resolution of the Board of Directors, designate an amount not exceeding one-half of the price of the new shares as
additional paid-in capital, which is included in capital surplus.
Under the Japanese Corporate Law (“the Law”), when a dividend distribution of surplus is made, the smaller of an amount equal to 10%
of the dividend or the excess, if any, of 25% of common stock over the total of additional paid-in capital and legal earnings reserve must be
set aside as additional paid-in capital or legal earnings reserve. Legal earnings reserve is included in retained earnings in the accompanying
consolidated balance sheets.
Under the Law, appropriations of legal earnings reserve and additional paid-in capital generally require a resolution of the shareholders’
meeting.
Additional paid-in capital and legal earnings reserve may not be distributed as dividends. Under the Law, however, all additional paid-in
capital and all legal earnings reserve may be transferred to other capital surplus and retained earnings, respectively, which are potentially
available for dividends.
The maximum amount that the Company can distribute as dividends is calculated based on the non-consolidated financial statements
of the Company in accordance with the Law.
Total annual dividends per share as of March 31, 2019 is ¥ 130.00 (U.S. $ 1.2), which is the sum of the interim dividend per share of ¥
60.00 (U.S. $ 0.6) and the year-end dividend per share of ¥ 70.00 (U.S. $ 0.6). Ab
out t
he T
aise
i Gro
upTo
war
d Su
stai
nabl
e Gr
owth
of t
he Ta
isei G
roup
Spec
ial F
eatu
reBu
sine
ss S
ectio
nES
G Se
ctio
nDa
ta S
ectio
nDa
ta S
ectio
n
98TAISEI ANNUAL REPORT 2019

Notes to Consolidated Financial Statements (cont.)TAISEI CORPORATION and Consolidated Subsidiaries
Years Ended March 31, 2018 and 2019
13. Lease TransactionsOperating leases
(a) Lessee
Future minimum lease payments as of March 31, 2018 and 2019 were as follows:
Millions of Yen Thousands of U.S. Dollars
2018 2019 2019
Due within one year ................................................................................ ¥ 4,584 ¥ 4,972 $ 44,797
Due after one year .................................................................................. 21,265 16,747 150,887
Total ................................................................................... ¥ 25,849 ¥ 21,719 $ 195,684
(b) Lesser
Future minimum lease receipts as of March 31, 2018 and 2019 were as follows:
Millions of Yen Thousands of U.S. Dollars
2018 2019 2019
Due within one year ................................................................................ ¥ 3,793 ¥ 3,549 $ 31,976
Due after one year .................................................................................. 20,168 16,708 150,536
Total ................................................................................... ¥ 23,961 ¥ 20,257 $ 182,512
14. Derivative Transactions(1) Derivative transactions of the Company and its consolidated subsidiaries as of March 31, 2018 and 2019 were as follows:
① Derivative transactions which were not accounted for by the hedge accounting
Corresponding derivative transactions for the year ended March 31, 2018 and 2019 were not applicable.
② Derivative transactions which were accounted for by the hedge accounting as of March 31, 2018 and 2019 were as follows:
· Currency related transactions
Main items hedged by forward foreign exchange contracts are accounts payable for construction contracts.
Millions of Yen
2018
Contract amount
Forward foreign exchange contract (short commitment) Total Due after one year Fair value
to sell U.S. dollars ................................................................................... ¥ 395 ¥ — ¥ (10)
Millions of Yen
2019
Contract amount
Forward foreign exchange contract (short commitment) Total Due after one year Fair value
to sell U.S. dollars ................................................................................... ¥ 60 ¥ — ¥ 1
Thousands of U.S. Dollars
2019
Contract amount
Forward foreign exchange contract (short commitment) Total Due after one year Fair value
to sell U.S. dollars ................................................................................... $ 541 $ — $ 9
Note: Fair value was determined at the quoted price obtained from the counterparty financial institutions.
99 TAISEI ANNUAL REPORT 2019

∙ Interest Rate-Related Derivatives:
Main items hedged by interest rate swap contracts are long-term loans.
The following interest rate swaps are used as hedges. The net amounts to be paid or received are added to or deducted from interests.
Special treatment of swap
Millions of Yen
2018
Contract amount
Total Due after one year Fair value
Interest rate swaps receive floating rate, pay fixed rate ........................... ¥ 50,540 ¥ 43,770 ¥ —
Millions of Yen
2019
Contract amount
Total Due after one year Fair value
Interest rate swaps receive floating rate, pay fixed rate ........................... ¥ 43,110 ¥ 27,890 ¥ —
Thousands of U.S. Dollars
2019
Contract amount
Total Due after one year Fair value
Interest rate swaps receive floating rate, pay fixed rate ........................... $ 388,413 $ 251,284 $ —
Note: Fair value of interest rate swaps was included in the corresponding hedged long-term loans (long-term loans due within one year was
considered as short-term loans) as those interest rate swaps were recorded as an adjustment to the corresponding hedged long-term
loans under the special treatment.
15. Related Party TransactionsThe Company had no transaction with related individuals, including shareholders and directors, for the year ended March 31, 2018 and
2019.
The Company’s consolidated subsidiaries had the following transaction with related individuals, including shareholders and directors, for the
year ended March 31, 2019, but no transaction was made for the year ended March 31 2018.
Millions of yen
(a) Name
(b) Attribution
(c) Capital (Million yen)
(d) Equity ownership percentage of the
Company
2019
Transactions during the year ended March 31, 2019 Balance at the end of the year
Description of
transaction Amount Account Amount
(a) Takashi Yamauchi
(b) The director of the Corporation
(c) —
(d) 0.03%
House renovation work
by Taisei Housing Co.,
Ltd.
¥ 18 — ¥ —
(a) Atsushi Yamamoto
(b) The executive officer of the
Corporation
(c) —
(d) 0.00%
Sale of
condominium
apartment by Taisei
Yuraku Real Estate Co.,
Ltd.
¥ 72 — ¥ —
Notes 1. Consumption taxes were not included in the transaction amounts.
2. Transaction conditions and policies to decide transaction conditions
(1) The transaction price of house renovation was determined properly on an arm’s length basis as in the case of other general
transactions. The amount of transaction above represents the contract price on the construction contract.
(2) The transaction price of sale of condominium apartment was determined properly considering normal market prices as in the
case of other general transactions. The amount of transaction above represents the contract price.
Abou
t the
Tai
sei G
roup
Tow
ard
Sust
aina
ble
Grow
th o
f the
Taise
i Gro
upSp
ecia
l Fea
ture
Busi
ness
Sec
tion
ESG
Sect
ion
Data
Sec
tion
Data
Sec
tion
100TAISEI ANNUAL REPORT 2019

16. Segment Information(1) Segment Information
(a) General information on reportable segments
Each reportable segment of the Group is a business unit in the Group, whose discrete financial information is available. Reportable segments
are reviewed periodically at the Board of Directors Meeting in order to determine distribution of management resources and evaluate
business result of each reportable segment.
The headquarters in the head office are established by the products of construction and the services. Each headquarter proposes
comprehensive domestic and oversea strategies with respect to products and services, and operates its business activities.
The Group consists of segments identified by products and services based on the headquarters, and identifies the three segments, “Civil
engineering,” “Construction contracts,” and “Real estate development” as reportable segments: “Civil engineering” delivering construction of
civil engineering, etc.; “Construction contracts” delivering construction of building and housing, etc.; “Real estate development” delivering
purchase, sale and rental of land and buildings, etc.
(b) Basis of measurement of net sales, profit or loss and other material items on reportable segment
The accounting methods for each reportable segment are the same as that set forth in the “Summary of Significant Accounting Policies”.
The profit (loss) of a reportable segment is based on the operating income (loss) before amortization of goodwill in Consolidated Statements
of Income. In addition, conditions of intersegment transactions and transfers are determined by considering market prices as in the case of
other general transactions.
Assets of the Group are not allocated to the segments. However, the corresponding depreciation expenses are allocated to the segments
according to the rational bases such as the usage of assets.
(c) Information of net sales, profit or loss and other material items on reportable segment
Segment information as for the years ended March 31, 2018 and 2019 was as follows:
Millions of Yen
2018
Reportable segments
Civil
engineering
Construction
contracts
Real estate
development Others Total Adjustments Consolidated
Net sales:
Customers ................................... ¥ 441,270 ¥ 1,020,765 ¥ 113,736 ¥ 9,727 ¥ 1,585,498 ¥ — ¥ 1,585,498
Intersegment ................................ 25,161 39,788 6,095 2,574 73,618 (73,618) —
Total ....................... 466,431 1,060,553 119,831 12,301 1,659,116 (73,618) 1,585,498
Operating income ............................ ¥ 71,519 ¥ 96,399 ¥ 12,966 ¥ 1,114 ¥ 181,998 ¥ (138) ¥ 181,860
Depreciation and amortization ......... ¥ 3,135 ¥ 2,895 ¥ 1,064 ¥ 80 ¥ 7,174 ¥ (124) ¥ 7,050
Increase (decrease) in allowance for
losses on construction contracts ... ¥ (2,171) ¥ (4,101) ¥ — ¥ — ¥ (6,272) ¥ — ¥ (6,272)
Notes 1. ”Others” presented businesses such as incidental business to the construction business, leisure business, and other service
businesses, which are not included in reportable segments.
2. Adjustment amount of operating income was ¥ 138 million, which included intersegment elimination of dividend income.
3. Segment operating income was adjusted against operating income of Consolidated Statement of Income.
Millions of Yen
2019
Reportable segments
Civil
engineering
Construction
contracts
Real estate
development Others Total Adjustments Consolidated
Net sales:
Customers ................................... ¥ 439,110 ¥ 1,087,672 ¥ 114,855 ¥ 9,241 ¥ 1,650,878 ¥ — ¥ 1,650,878
Intersegment ................................ 29,543 42,768 7,043 2,869 82,223 (82,223) —
Total ....................... 468,653 1,130,440 121,898 12,110 1,733,101 (82,223) 1,650,878
Operating income ............................ ¥ 53,098 ¥ 87,686 ¥ 12,912 ¥ 1,144 ¥ 154,840 ¥ (1,516) ¥ 153,324
Depreciation and amortization ......... ¥ 3,357 ¥ 2,881 ¥ 1,753 ¥ 90 ¥ 8,081 ¥ (225) ¥ 7,856
Increase (decrease) in allowance for
losses on construction contracts ... ¥ (469) ¥ (6,164) ¥ — ¥ — ¥ (6,633) ¥ — ¥ (6,633)
Notes to Consolidated Financial Statements (cont.)TAISEI CORPORATION and Consolidated Subsidiaries
Years Ended March 31, 2018 and 2019
101 TAISEI ANNUAL REPORT 2019

Thousands of U.S. Dollars
2019
Reportable segments
Civil
engineering
Construction
contracts
Real estate
development Others Total Adjustments Consolidated
Net sales:
Customers ................................... $ 3,956,302 $ 9,799,730 $ 1,034,823 $ 83,260 $ 14,874,115 $ — $ 14,874,115
Intersegment ................................ 266,177 385,332 63,456 25,849 740,814 (740,814) —
Total ....................... 4,222,479 10,185,062 1,098,279 109,109 15,614,929 (740,814) 14,874,115
Operating income ............................ $ 478,404 $ 790,035 $ 116,335 $ 10,307 $ 1,395,081 $ (13,659) $ 1,381,422
Depreciation and amortization ......... $ 30,246 $ 25,957 $ 15,794 $ 811 $ 72,808 $ (2,027) $ 70,781
Increase (decrease) in allowance for
losses on construction contracts ... $ (4,226) $ (55,536) $ — $ — $ (59,762) $ — $ (59,762)
Notes 1. ”Others” presented businesses such as incidental business to the construction business, leisure business, and other service
businesses, which are not included in reportable segments.
2. Adjustments of operating income of ¥ 1,516 million ($ 13,659 thousand) included intersegment elimination of dividend income
amounting to ¥ 1,433 million ($ 12,911 thousand) and amortization of goodwill amounting to ¥ 83 million ($ 748 thousand).
3. Segment operating income was adjusted against operating income of Consolidated Statement of Income.
(2) Related Information
(a) Information about products and services
The information about products and services is included in “(c) Information of net sales, profit or loss and other material items on reportable
segment” of “(1) Segment Information” for the years ended March 31, 2018 and 2019.
(b) Information about geographic areas
∙ Net sales
The information about net sales was not presented for the years ended March 31, 2018 and 2019 since sales to unaffiliated customers in
Japan accounted for more than 90% of sales of Consolidated Statement of Income.
∙ Tangible fixed assets
The information about tangible fixed assets was not presented for the years ended March 31, 2018 and 2019 since the amounts of tangible
fixed assets that located in Japan accounted for more than 90% of the amounts of tangible fixed assets of Consolidated Balance Sheet.
(c) Information about major customers
The information about major customers was not presented for the years ended March 31, 2018 and 2019 since net sales to any customer
were less than 10% of the amounts of sales of Consolidated Statement of Income.
(d) Information about impairment losses on fixed assets of reportable segment for the years ended March 31, 2018 and 2019 was as
follows:
Millions of Yen
2018
Reportable segments
Civil engineering
Construction
contracts
Real estate
development Others
Elimination
and/or
corporate Total
Impairment losses on fixed assets ..... ¥ 183 ¥ 219 ¥ 3,284 ¥ — ¥ (55) ¥ 3,631
Millions of Yen
2019
Reportable segments
Civil engineering
Construction
contracts
Real estate
development Others
Elimination
and/or
corporate Total
Impairment losses on fixed assets ..... ¥ 327 ¥ 13 ¥ — ¥ — ¥ — ¥ 340
Thousands of U.S. Dollars
2019
Reportable segments
Civil engineering
Construction
contracts
Real estate
development Others
Elimination
and/or
corporate Total
Impairment losses on fixed assets ..... $ 2,946 $ 117 $ — $ — $ — $ 3,063
Abou
t the
Tai
sei G
roup
Tow
ard
Sust
aina
ble
Grow
th o
f the
Taise
i Gro
upSp
ecia
l Fea
ture
Busi
ness
Sec
tion
ESG
Sect
ion
Data
Sec
tion
Data
Sec
tion
102TAISEI ANNUAL REPORT 2019

(e) Information about amortization and unamortized balance of goodwill of reportable segment
There was no information about amortization and unamortized balance of goodwill of reportable segment for the year ended March 31,
2018. Information for the year ended March 31, 2019 was as bellow:
Millions of Yen
2019
Reportable segments
Civil engineering
Construction
contracts
Real estate
development Others
Elimination
and/or
corporate Total
Amortization of goodwill ..................... ¥ — ¥ 43 ¥ 40 ¥ — ¥ — ¥ 83
Unamortized balance of goodwill ....... ¥ — ¥ 172 ¥ — ¥ — ¥ — ¥ 172
Thousands of U.S. Dollars
2019
Reportable segments
Civil engineering
Construction
contracts
Real estate
development Others
Elimination
and/or
corporate Total
Amortization of goodwill ..................... $ — $ 388 $ 360 $ — $ — $ 748
Unamortized balance of goodwill ....... $ — $ 1,550 $ — $ — $ — $ 1,550
(f) Information about gains on negative goodwill of reportable segment
Information about gains on negative goodwill for the years ended March 31, 2018 and 2019 was not applicable.
17. Contingent LiabilitiesThe Group was contingently liable to invest in the specific purpose company for their repayment and other obligations of borrowings with the
amount of ¥ 15,680 million as of March 31, 2018. The amounts indicated their shares of the additional investment obligations. As the Group
terminated the contract on March 29, 2019, it was no longer effective as of March 31, 2019.
18. Revaluation Reserve for LandIn the year ended March 31, 2002, certain consolidated domestic subsidiaries executed revaluation of their land for business in accordance
with the Law Concerning Revaluation of Land (the “Law”).
As a result of this revaluation, deferred income taxes concerning the differences between the amounts after revaluation and the book
value before revaluation was stated in the assets and liabilities in the consolidated balance sheets. The differences between these amounts,
net of taxes, were stated as “Revaluation reserve for land” in “Accumulated other comprehensive income”.
The revaluation was executed in accordance with the method prescribed in the Article 2, Items 3, 4 and 5 of the Law on November 30,
2001 and March 31, 2002.
One of the consolidated subsidiaries, which was merged with another consolidated subsidiary on December 1, 2001, executed the
revaluation on November 30, 2001.
Excess amount of the book value of the revaluated land over the fair value as of March 31, 2018 and 2019 was ¥ 2,374 million and ¥
2,472 million ($ 22,272 thousand), respectively (including the excess amount of ¥ 1,489 million and ¥ 1,285 million ($ 11,578 thousand)
related to investment and rental property as of March 31, 2018 and 2019, respectively).
19. Research and Development ExpensesResearch and development expenses, which were included in selling, general and administrative expenses and cost of sales, amounted to ¥
11,608 million and ¥ 12,472 million ($ 112,370 thousand) for the years ended March 31, 2018 and 2019, respectively.
20. Impairment Losses on Fixed AssetsImpairment losses on fixed assets for the years ended March 31, 2018 and 2019 consisted of the following:
2018
Use Type of assets Location
Assets reclassified from business purpose to trading purpose Land and others Tokyo and the other (2 lots)
Assets for business use Land, Machinery and equipment, Building, and others Kyoto and the others (4 lots)
Idle assets Land Miyagi (1 lot)
2019
Use Type of assets Location
Idle assets Machinery and equipment Tokyo (1 lot)
Rental property Land Kanagawa (1 lot)
Assets for business use Machinery and equipment, Building and others Osaka and the others (8 lots)
Notes to Consolidated Financial Statements (cont.)TAISEI CORPORATION and Consolidated Subsidiaries
Years Ended March 31, 2018 and 2019
103 TAISEI ANNUAL REPORT 2019

The Company and its consolidated subsidiaries grouped their fixed assets based on units, for which decisions for investments were made.
Book value of the fixed assets listed above was reduced to recoverable amounts and impairment losses were recognized as follows:
Millions of Yen Thousands of U.S. Dollars
2018 2019 2019
Assets reclassified from business purpose to trading purpose
Buildings and structures ...................................................................... ¥ 305 ¥ — $ —
Land ................................................................................................... 3,222 — —
Subtotal .......................................................................................... 3,527 — —
Assets for business use
Buildings and structures ...................................................................... 19 13 117
Land ................................................................................................... 66 — —
Machinery and equipment ................................................................... 18 35 315
Others ................................................................................................. 0 3 27
Subtotal .......................................................................................... 103 51 459
Rental property
Land ................................................................................................... — 126 1,135
Subtotal .......................................................................................... — 126 1,135
Idle assets
Land ................................................................................................... 1 — —
Machinery and equipment .................................................................. — 163 1,469
Subtotal .......................................................................................... 1 163 1,469
Total ................................................................................... ¥ 3,631 ¥ 340 $ 3,063
The recoverable amount of the fixed assets for the year ended March 31, 2018 was their net realizable value mainly based on amounts
determined by valuations made in accordance with real estate appraisal standards.
The recoverable amount of the fixed assets for the year ended March 31, 2019 was their net realizable value mainly based on amounts
determined by the sales contract price.
21. Per Share DataNet assets per share and net income per share as of and for the years ended March 31, 2018 and 2019 were as follows:
Yen U.S. Dollars
2018 2019 2019
Net assets per share ¥ 2,975.02 ¥ 3,302.86 $ 29.76
Net income per share ............................................................................. 561.36 511.90 4.61
Diluted net income per share .................................................................. — — —
Diluted net income per share for the years ended March 31, 2018 and 2019 were not presented because the Company had no shares with
dilutive effects.
Calculation bases for basic net income per share for the years ended March 31, 2018 and 2019 were as follows:
Millions of Yen Thousands of U.S. Dollars
2018 2019 2019
Basic net income per share
Net income attributable to owners of parent ........................................ ¥ 126,788 ¥ 112,572 $ 1,014,254
Net income not available to common stock holders ............................ — — —
Net income attributable to owners of parent available to common stock ... 126,788 112,572 1,014,254
Average common stock outstanding (in thousands share) ................... 225,859 219,910
The net assets per share and the net income per share are calculated assuming that the consolidation of shares took place at the beginning
of the year ended March 31, 2018, because the consolidation of shares, at the ratio of 1 share for 5 shares, was implemented on October 1,
2017.
Abou
t the
Tai
sei G
roup
Tow
ard
Sust
aina
ble
Grow
th o
f the
Taise
i Gro
upSp
ecia
l Fea
ture
Busi
ness
Sec
tion
ESG
Sect
ion
Data
Sec
tion
Data
Sec
tion
104TAISEI ANNUAL REPORT 2019

22. Comprehensive Income
Recycling adjustments and tax effects for each component of other comprehensive income were as follows:
Millions of Yen Millions of Yen Thousands of U.S. Dollars
2018 2019 2019
Unrealized holding gains on securities
Amount incurred ................................................................................. ¥ 23,537 ¥ 14,697 $ 132,417
Recycling ............................................................................................ (327) 10 90
Before Tax ....................................................................................... 23,210 14,707 132,507
Tax effect ......................................................................................... (7,098) (4,502) (40,562)
Unrealized holding gains on securities, net of taxes ......................... 16,112 10,205 91,945
Deferred gains or losses on hedging derivatives
Amount incurred ................................................................................. (10) 23 207
Recycling ............................................................................................ 0 (12) (108)
Before Tax ....................................................................................... (10) 11 99
Tax effect ......................................................................................... 3 (3) (27)
Unrealized gains or losses on hedging derivatives, net of taxes ....... (7) 8 72
Foreign currency translation adjustments
Amount incurred ................................................................................. (45) (246) (2,216)
Recycling ............................................................................................ 15 7 63
Foreign currency translation adjustments ......................................... (30) (239) (2,153)
Remeasurements of defined benefit plans
Amount incurred ................................................................................. 5,386 (4,222) (38,040)
Recycling ............................................................................................ 2,951 (613) (5,523)
Before Tax ....................................................................................... 8,337 (4,835) (43,563)
Tax effect ......................................................................................... (2,543) 1,484 13,371
Remeasurements of defined benefit plans, net of taxes ................... 5,794 (3,351) (30,192)
Share of other comprehensive income of associates accounted for by the equity method
Amount incurred ................................................................................. (1) (35) (315)
Total other comprehensive income ................................ ¥ 21,868 ¥ 6,588 $ 59,357
105 TAISEI ANNUAL REPORT 2019
Notes to Consolidated Financial Statements (cont.)TAISEI CORPORATION and Consolidated Subsidiaries
Years Ended March 31, 2018 and 2019
23. Subsequent Event(1) Acquisition of treasury stock
The Company resolved the item related to the acquisition of treasury stock at the board of directors held on May 10, 2019, in accordance
with the article 156 of the Japanese Corporate Law (the “Law”), which is applicable as replacement of the article 165, paragraph 3 of the
law, as detailed below.
① Reason of acquisition of treasury stock
The Company decided to acquire its treasury stock in order to enhance the shareholders’ value per share and to improve the capital
efficiency.
② Details
(a) Type of stock to be acquired: Common stock of the Company
(b) Number of stocks to be acquired: Up to 8,300,000 stocks (3.81% of the total outstanding stocks excluding treasury stock)
(c) Total cost of acquisition: Up to ¥ 28,000 million ($ 252,275 thousand)
(d) Period of acquisition: From May 13, 2019 to September 30, 2019
Abou
t the
Tai
sei G
roup
Tow
ard
Sust
aina
ble
Grow
th o
f the
Taise
i Gro
upSp
ecia
l Fea
ture
Busi
ness
Sec
tion
ESG
Sect
ion
Data
Sec
tion
Data
Sec
tion
106TAISEI ANNUAL REPORT 2019

Independent Auditor’s Report
107 TAISEI ANNUAL REPORT 2019

ESG Data of the Taisei Group
Data Section
Abou
t the
Tai
sei G
roup
Tow
ard
Sust
aina
ble
Grow
th o
f the
Taise
i Gro
upSp
ecia
l Fea
ture
Busi
ness
Sec
tion
ESG
Sect
ion
Data
Sec
tion
*1 Refers to Taisei Corporation and the seven major Group companies.
*2 Refers to Taisei Corporation and the six major Group companies.
*3 Refers to our primary suppliers centered on Soyukai (an association of our core subcontractors).
*4 Refers to Taisei Corporation and the 25 major Group companies.
*5 Refers to Taisei Corporation and the 21 major Group companies.
*6 Refers to our primary supplier, Soyukai (an association of our core subcontractors).
*7 Refers to Taisei Corporation and the eight major Group companies.
*8 Base years for CO2 emissions targets: FY1990
*9 Including dissemination and promotion of ZEB
*10 The actual result for FY2016 is set at 100. 110 is the target for the end of FY2020.
*11 No questionnaire survey for subcontractors will be conducted in FY2019 (biennial implementation)
*12 Actual results from January to December in 2016, 2017, and 2018.
*13 The ratio of total net sales of registered worksites against the total net sales. The target set for
September 2019 is 60% or more. The system went into full-scale operation from April 2019.
*14 A system to rehire retired employees at their own request.
*15 No surveys were conducted in FY2016 and FY2018 due to biennial implementation.
*16 Refers to new graduates in general and expert positions.
*17 Number of major security breaches of electronic information related to the Taisei Group.
KPIs (Key Performance Indicators) (FY)
ESG Materialities Scope of report Key Indicators 2016 2017 2018
ERealization of a sustainable and environmentally friendly society
Taisei Group*1 Total CO2 Emissions 332 103t-CO2 340 103t-CO2 360 103t-CO2
Taisei Corporation
At construction stage: CO2 emissions per construction cost (intensity)*8 23.3 % 28.4 % 28.9 %
At construction stage: Total CO2 emissions*8 51.9 % 48.4 % 44.7 %
At building operation stage: Design-build estimated CO2 emissions*8*9 38.9 % 48.1 % 40.2 %
Promotion of recycling construction waste: Final disposal rate 3.5 % 3.2 % 3.4 %
Implementation of proposals that consider biodiversity: Number of proposals 42 cases 52 cases 35 cases
Zero environmental accidents (Implementation of management procedure based on“Operation Manual for Priority Environmental Issues”) 0 cases 0 cases 0 cases
S
Ensuring quality and improving technology Taisei Corporation
Customer satisfaction (Civil Engineering) 80 % 95 % 96 %
Customer satisfaction (Construction) 90 % 90 % 92 %
Productivity (Net sales/number of employees working at construction sites)*10 100 107 111
Technical development for realizing a sustainable society
Taisei Group*2 Number of patent applications filed 311 cases 253 cases 226 cases
Taisei CorporationNumber of patent applications filed 304 cases 235 cases 213 cases
Number of patent rights registered 232 cases 191 cases 250 cases
Promotion of supply chain management
Suppliers*3
Implementation rate of companies where CSR activity survey was conducted*11 62.6 % 74.2 %
Number of companies responding 63.5 % 79.3 %
Number of companies surveyed 523 companies 1,060 companies
Thorough management of labor safety and sanitary conditions
Taisei CorporationHealth exam participation rate 100 % 100 % 100 %
Labor union participation rate 100 % 100 % 100 %
Taisei Group*2 Frequency Rates*12 0.53 0.44 0.58
Taisei CorporationFrequency Rates*12 0.47 0.41 0.42
Number of fatal accidents*12 1 case 2 cases 2 cases
Cultivation of technical staff and securing human resources
Taisei Corporation
Average overtime hours per month 38.4 hours 37.5 hours 37.8 hours
Construction career up system worksite registration rate*13
Number of female engineers 584 persons 621 persons 663 persons
Realization of an attractive working environment that is good to work in
Taisei Corporation
Rate of attendance at human rights training 93.8 % 98.2 % 96.8 %
Rate of employment of handicapped persons 2.05 % 2.07 % 2.33 %
Number of re-employed 663 persons 663 persons 739 persons
Number of former employee's registered with the Job-Return system*14 15 persons 1 persons 2 persons
Number of female managers 62 persons 83 persons 167 persons
Rate of taking childcare leave by males 1.7 % 93.8 % 94.2 %
Numbers taking leave for childcare (male) 4 persons 243 persons 244 persons
Rate of return to work after childcare leave 100 % 97.5 % 100 %
Numbers taking nursing care leave 2 persons 3 persons 0 persons
Rate of paid leave utilization 37.3 % 42.9 % 47.5 %
Rate of milestone leave utilization 93.6 % 97.8 % 94.0 %
Rate of refresh leave utilization 89.1 % 89.1 % 92.2 %
Employee satisfaction surveys for union members*15 80.6 %
Turnover rate of employees within three years of hiring*16 5.0 % 4.3 % 5.4 %
Training hours per person 44.7 hours 32.8 hours 36.6 hours
Training hours per person for new employees 38.8 hours
Number of employee's who participated in overseas training system 10 persons 14 persons 22 persons
Implementation rate of career development review 73.1 % 87.8 % 87.7 %
Non-regular employee promotion rate 11.9 % 11.7 % 12.2 %
Number of employees promoted from non-regular employees to regular employees
251 persons 42 persons 45 persons
G Promotion of compliance
Taisei Group*4 Rate of participation in the large-scale disaster drill 100 % 100 % 100 %
Taisei Group*5 "Corporate ethics helpline" and "Group helpline" response rate 100 % 100 %
Taisei Corporation Compliance training participation rate 100 % 100 % 100 %
Suppliers*6 Number of compliance training sessions conducted for new employee's of Soyukai member companies
1 time 2 times 2 times
Taisei Corporation Number of training regarding intellectual property rights 22 times 17 times 19 times
Taisei Group*7 Number of times education in information security implemented in all companies
16 times 15 times 19 times
Taisei Group*7 Number of major information security accidents*17 0 cases 0 cases 0 cases
108TAISEI ANNUAL REPORT 2019

ESG Data of Major Group Companies
*1 Actual results from January to December in 2016, 2017, and 2018.
*2 Group compliance training sessions include those related to the Anti-Monopoly Act.
*3 FY2013 is used as the base year until FY2016, and FY2015 is used as the base year from FY2017 onward.
*4 In-house training sessions include those on human rights and diversity.
TAISEI ROTEC CORPORATION (Pavement and civil engineering) (FY)
ESG ISO26000 CSR Issues Key Indicators Unit 2016 2017 2018
E The Environment Realization of a sustainable and environmentally friendly society
Number of times training for prevention of industrial waste accidents was implemented
Times 9 9 30
S
Consumer Issues Ensuring quality and improving technologyRatio of achievement of target score in construction evaluation (number achieved / total number)
% 42.8 72.7 77.8
Human Rights / Labor Practices
Realization of an attractive working environment that is good to work in
Rate of taking refreshment leave % 89.5 62.5 86.4
Labor Practice s Thorough management of labor safety and sanitary conditions Frequency rates*1 ̶ 0.81 0.42 1.0
G Fair Operating Practices Promotion of compliance
Compliance training participation rate*2 % 100 100 100
Participation rate for e-learning on compliance % 100 100 100
CSR newsletters issuance rate % — — 100
Taisei-Yuraku Real Estate Co., Ltd. (Real estate development, facility management, etc.) (FY)
ESG ISO26000 CSR Issues Key Indicators Unit 2016 2017 2018
E The Environment Realization of a sustainable and environmentally friendly society
Rate of reduction of electrical power usage (office)*3 % 8.2 5.2 9.3
Number of projects proposing improvement in energy efficiency at customers' facilities
Cases 81 190 158
SHuman Rights / Labor Practices
Realization of an attractive working environment that is good to work in
Participation rate of training*4 % 99.8 100 100
G
Organization Governance Risk management Rate of participation in the Large-Scale Disaster Drill % 100 100 100
Fair Operating Practices Promotion of complianceParticipation rate for e-learning on compliance % 100 100 100
Rate of implementation of information security measures % 100 100 100
TAISEI U-LEC CO., LTD. (Planning, design, and construction of housing complexes) (FY)
ESG ISO26000 CSR Issues Key Indicators Unit 2016 2017 2018
E The Environment Realization of a sustainable and environmentally friendly society
Rate of recycling of construction waste % 95.9 97.1 97.9
Rate of use of Electronic Manifest System % 99.6 100 99.8
SLabor Practice s Thorough management of labor safety and sanitary conditions
Number of fatal accidents Cases 0 1 0
Frequency rates*1 ̶ 0.6 0.59 0.28
Consumer Issues Ensuring quality and improving technology Rate of return of customer questionnaires % 72 88 65
G Fair Operating Practices Promotion of compliance Compliance training participation rate % 100 100 100
TAISEI SETSUBI CO., LTD. (Air conditioning, sanitation, electrical equipment, and interior finishing) (FY)
ESG ISO26000 CSR Issues Key Indicators Unit 2016 2017 2018
E The Environment Realization of a sustainable and environmentally friendly society
Percentage of energy efficiency proposals to customers % 56.2 100 100
Attendance rate of environmental education % 82.4 92.5 90.1
SHuman Rights / Labor Practices
Realization of an attractive working environment that is good to work in
Number of productivity improvement activities Cases — 12 12
Labor Practice s Thorough management of labor safety and sanitary conditions Frequency rates*1 ̶ 0.56 0 0.75
G Fair Operating Practices Promotion of complianceCompliance training participation rate % 100 100 100
Number of major information security accidents Cases 0 0 0
TAISEI HOUSING CORPORATION (Design, construction, and sales of order-made individual housing) (FY)
ESG ISO26000 CSR Issues Key Indicators Unit 2016 2017 2018
E The Environment Realization of a sustainable and environmentally friendly society
Number participation in social responsibility activities Persons 20 17 15
Rate of use of Electronic Manifest System % 99.4 99.7 99.9
% 11.5 12 12.7
S Consumer Issues Ensuring quality and improving technology Customer satisfaction surveys (promoter survey) % 97 94 93
GOrganization Governance Risk management Rate of participation in the Large-Scale Disaster Drill % 100 100 100
Fair Operating Practices Promotion of compliance Compliance training participation rate % 100 100 100
SEIWA RENEWAL WORKS CO., LTD. (Civil engineering, renewal work, production and sales of construction machinery, etc.) (FY)
ESG ISO26000 CSR Issues Key Indicators Unit 2016 2017 2018
E The Environment Development and providing technologies to solve social issues Number of technical proposals submitted Cases 10 6 12
SHuman Rights / Labor Practices
Realization of an attractive working environment that is good to work in
Number of taking nursing leave and caregiving leave Persons 4 4 6
Labor Practice s Thorough management of labor safety and sanitary conditions Number of labor accidents (four or more days off work)*2 Cases 2 1 2
GOrganization Governance Risk management Rate of participation in the Large-Scale Disaster Drill % 100 100 100
Fair Operating Practices Promotion of compliance Compliance training participation rate % 100 100 100
Data Section
109 TAISEI ANNUAL REPORT 2019
Rate of construction wastemi ed waste in

Third-Party Opinion
This report is the second issue in a new “integrated report” format
that the Taisei Group introduced in the last year for its annual CSR
reporting. Compared to last year’s, this year’s report provides
information more simply and clearly, such as the part “Toward
Sustainable Growth.” But I also notice some parts could be further
improved, and they are pointed out below.
Introduction
It is vital that the integrated report presents (or describes) how the
Group, considering material challenges/issues posed in CSR or
ESG activities, achieves financial targets specified in the Medium-
term Business Plan and connects its diverse business lines to the
value creation process. It is important to show a story of the
Group’s corporate value enhancement through its social
contribution businesses to relevant stakeholders including
investors, in an easy-to-understand manner.
In my previous year’s third-party opinion, I suggested a few
more pages be devoted to a discussion of the outcomes of
specific initiatives implemented during the year and plans of further
efforts for the future. This year’s report explains key management
issues in the Medium-term Business Plan by illustrating specific
actions taken and related ongoing business activities. A list of key
KPIs (including Group companies’ ones) covering financial data as
well as ESG data is added in the Data Section, which also helps
readers understand matters more easily. In the Talk and Dialogue
features, the investors’ take on and expectations for Taisei
Corporation and the mindset and activities of the work sites are
focused on, and they hopefully will be regarded not merely as a
stand-alone topic but as part of the whole context of the report.
The suspicion of bid-rigging in connection with the Linear
Chuo Shinkansen Project, which transpired in the previous fiscal
year, is mentioned again this year in the President’s Message as
well as in the compliance section, where how it was handled in the
previous year is outlined. After an in-depth discussion of this issue
by its Compliance Committee and Board in the previous year, the
Company has already enforced the revised and tightened versions
of the “Code of Conduct for Compliance with the Anti-Monopoly
Act” and the “Detailed Rules for the Process of Ensuring
Legitimacy of Bids.” It is best to disclose these arrangements as
much as possible. The disclosure of these rules should help the
Company define its own stance/principle.
In association with this issue, the “Fundamental Policies” on risk
management, information disclosure, and human rights, for
instance, are posted on the website, whereas the details of specific
standards and rules are not clear due to the simplified description.
Without (proper) disclosure, outside parties (including evaluation
The overseas business is one of Taisei Corporation’s crucial
management issues, and the development of human resources
who drive its globalization is also a pressing matter to attend to.
In an age of sustainability revolution, the development of talented
sustainability people who are capable of making efforts with a
triple bottom line (environmental, social, and financial) mindset is in
urgent need. The Company must recruit/collect and cultivate
young talent with a global mindset and a sustainability mindset all
together—they will be tackling management issues in the future.
One of the important themes to this end should be how to
promote the creation of attractive workplaces and organizations
that are open to a diverse range of people.
institutions) cannot know how and how far the Company will be
committed to the issue. (Note that the “Fundamental Corporate
Governance Policy” is well articulated, and that the report also goes
into the details of the “Fundamental Policy to Enhance Operational
Compliance Systems” but the reason for its disclosure is left out.)
The website outlines a variety of policies as the “corporate policies,”
but they would be clearer for readers (more reader-friendly) if the
policies, standards, and rules were disclosed appropriately by item,
along with the current status of actions and challenges/issues (in
conjunction with the website).
This year the report covers the summary of the CSR
Procurement Guideline, while many manufacturers and other
companies disclose the details of procurement standards. Having
engaged in research and enlightenment activities targeted at the
“Souyu-kai” members since 2013, Taisei Corporation increases
the number of targets further to a total of more than 1,000
customers for in-depth research. As a third party, I check the
results of the research in detail on a yearly basis; it is also vital that
the Company publicly discloses the summary of these results, to
the extent possible, to show its strengths and challenges/issues to
be addressed in the future.
Kanji TanimotoProfessor,
Ph. D. in Business Administration
School of Commerce,
Faculty of Commerce,
Waseda University
Issues
Going Forward
Abou
t the
Tai
sei G
roup
Tow
ard
Sust
aina
ble
Grow
th o
f the
Taise
i Gro
upSp
ecia
l Fea
ture
Busi
ness
Sec
tion
ESG
Sect
ion
Data
Sec
tion
110TAISEI ANNUAL REPORT 2019

Domestic Network
Outline of the Company
Corporate Data (As of March 31, 2019)
Name TAISEI CORPORATION
Established December 28, 1917
Paid-in capital ¥122.7 billion
Number of employees 8,490 people (non-consolidated)
Representative Yoshiyuki Murata, President and Chief Executive Officer
Head office 25-1, Nishi-Shinjuku 1-chome, Shinjuku-ku, Tokyo, JapanTEL. 81-3-3348-1111 (main number)
Branches Tokyo, Osaka, Nagoya, Fukuoka, Sapporo, Sendai, Hiroshima, Yokohama, Niigata, Takamatsu, Chiba, Saitama, Kobe, Kyoto
Taisei Technology Center(Yokohama City)
Sapporo
Tohoku (Sendai)
Head Office
Tokyo
International OperationsHeadquarters (Shinjuku, Tokyo)
Chiba
Yokohama
Technology Center (Yokohama)
Head Office
Branch Office
Technology Center
Kansai (Osaka)
Shikoku (Takamatsu)
Chugoku (Hiroshima)
Kyushu (Fukuoka)
Kobe
Kyoto
Nagoya
Kanto (Saitama)
Hokushinetsu (Niigata)
Share Information (As of March 31, 2019)
Financial Institutions
72,413 thousand shares(32.25%)
Individuals and Others
55,908 thousand shares(24.90%)
Securities Companies
7,123 thousand shares(3.17%)
Foreign Corporations etc.
72,685 thousand shares(32.37%)
Other Japanese Corporations
16,411 thousand shares(7.31%)
Shareholder
Composition
Number of Shareholders:
Status of Shares
TAISEI (THAILAND) CO., LTD
THAILAND
SINGAPORE
PAKISTAN
MYANMARTAISEI MYANMAR CO., LTD
VINATA INTERNATIONAL CO., LTD. VIETNAM(Hochiminh City Branch Office)
VINATA INTERNATIONAL CO., LTD. VIETNAM (Head Office)
VIETNAM (Hochiminh City)
VIETNAM (Hanoi)
TAISEI PHILIPPINE CONSTRUCTION INCORPORATED
JAKARTA
PT.TAISEI PULAUINTANCONSTRUCTION INTERNATIONAL
PT. INDOTAISEI INDAH DEVELOPMENT
ISTANBULINDIA
KUALA LUMPUR
PHILIPPINE
TAIPEI
NORTH AFRICA
MIDDLE EAST
SRI LANKA
CSCEC-TAISEI CONSTRUCTION, LTD.(Head Office)Beijing
Overseas Network (As of August 1, 2019)
Number of Shares Authorized 440,000,000
Number of Shares Issued 224,541,172
Number of Shareholders 72,265
Major Shareholders (Top 10):
Name of Shareholder
Number of Shares Held
(Unit: Thousand Shares)
Ratio ofShares Held
(%)
The Master Trust Bank of Japan, Ltd. (Trust Account) 15,843 7.26
Japan Trustee Services Bank, Ltd. (Trust Account) 13,156 6.03
Retirement Benefit Trust in Mizuho Trust (Mizuho Bank, Ltd. Account) 7,857 3.60
Taisei Associates’ Shareholding Plan 5,272 2.42
Japan Trustee Services Bank, Ltd. (Trust Account No.7) 4,549 2.09
Japan Trustee Services Bank, Ltd. (Trust Account No.5) 4,376 2.01
Taisei Employees’ Shareholding Plan 3,578 1.64
State Street Bank West Client-Treaty 505234 3,412 1.56
JPMorgan Chase Bank, N.A., 385151 3,250 1.49
Japan Trustee Services Bank, Ltd. (Trust Account No.9) 3,022 1.39
Note: The Company’s own shares (6,419,832) are excluded in calculating
the Ratio of Shares Held.
Stock Listings Tokyo, Nagoya
Code 1801
Transfer Agent Mizuho Trust & Banking Co., Ltd.1-2-1, Yaesu, Chuo-ku, Tokyo 103-8670, Japan
111 TAISEI ANNUAL REPORT 2019

TAISEI CORPORATION Organization Chart (As of July 1, 2019)
Engineering Div.
Building Construction Div.
Design Div.
★Engineering Planning Dept.
Engineering Solution Dept.
Life-science Proposal Dept.
Life-science Project Dept.
Industrial Facilities Project Dept.
Project Management Dept.
Technology Strategy Dept.
International Projects Management Dept.
Productivity Promotion Dept.
Power Plant Construction Planning Dept.
Building Construction Dept.
Technology Control Dept.
Estimate Dept.
Mechanical & Electrical Div. Mechanical & Electrical Dept.
Operations Planning Dept.
Administration Dept.
Architectural Design Depts.
Structural Engineering Depts.
Structural Planning Dept.
M&E Engineering Depts.
M&E Planning Dept.
Planning & Design Dept.
Construction Administration Dept.
Quality Management & Technology Dept.
International Projects Dept.
Nuclear Facilities Dept.
Specific Project Dept.
Civil Engineering Div.
Strategy Dept.
Civil Engineering Dept.
Construction Engineering Dept.
Machinery Dept.
Design Dept.
Estimate Dept.
Project Analysis & Information Dept.
International Projects Management Dept.
Procurement Div.
Procurement Dept.ⅠCoordination & Analysis Dept.
Procurement Dept.ⅡProcurement Dept.ⅢPlanning & Administration Dept.
Branch
Administration Dept.
Safety Administration & Environmental Dept.
Marketing & Sales Depts.
Building Construction Dept.
Design Dept.
Civil Engineering Dept.
International Operations Headquarters
International Business Strategy Dept.
Administration Dept.
Safety Administration & Environmental Dept.
Building Construction & Engineering Dept.
Civil Engineering Dept.
Archit
ectur
e & En
ginee
ring D
iv.(Int
egrat
ed)
Audit & Supervisory Board Member
Auditing Dept.
Industrial Affairs Dept.
Audit & Supervisory Board Members’ Dept.
★
Corporate Planning Office Corporate Communication Dept.
Corporate Planning Dept.
Information Planning Dept.
Business Administration Div.
Human Resources Dept.
General Affairs Dept.
Legal Dept.
Accounting Dept.
Finance Dept.
Energy Div.
Planning Dept.
Energy Projects Promotion Dept.
ZEB & Smart Community Dept.
Thermal Power & Next Generation Energy Dept.
Renewable Energy Dept.
Environment Div.
Planning & Administration Dept.
Environmental Technology Innovation Dept.
Natural Symbiosis Engineering Dept.
Geo-Environmental Technology Dept.
Taisei Technology Center
Technology Planning Dept.
Intellectual Property Dept.
Urban Engineering Research Dept.
Infrastructure Technology Research Dept.
Advanced Technology Development Dept.
Production Engineering Technology Dept.
Nuclear Facilities Div.
Planning Dept.
Structural Engineering Dept.
Advanced Analysis Technology Dept.
Civil Engineering Dept.
Environmental Engineering Dept.
Marketing & Sales Promotion Div.
Marketing & Sales Promotion Dept.
Planning & Business Promotion Dept.
Real Estate Information Dept.
Marketing & Sales (Building Construction) Div. Ⅰ Marketing & Sales Depts.
Marketing & Sales (Building Construction) Div. Ⅱ Marketing & Sales Depts.
Marketing & Sales (Building Construction) Div. Ⅲ Marketing & Sales Depts.
Medical & Pharmaceutical Business Div.Marketing & Sales Depts.
Marketing & Planning Dept.
Urban Development Div.
Planning & Management Dept.
Project Development Dept.ⅠProject Development Dept.ⅡPPP Projects Dept.
Urban Redevelopment Dept.ⅠUrban Redevelopment Dept.Ⅱ
Development Business Dept.(International)
Property Management Business Dept.
Development Business Dept.
Marketing & Sales (Civil Engineering)Div. Marketing & Sales Depts.
Marketing & Sales (West Japan) Div. Marketing & Sales Depts.
Planning & Business Promotion Dept.
Project Engineering & Promotion Dept.
International Marketing & Business Development Div. Marketing & Business Development Depts.
Sales Mindset/Skills Training Dept.
Secretarial Dept.
Safety Administration Div.
Safety Administration Dept.
Environmental Administration Dept.
Subcontractor Relations Dept.
Pres
iden
t
Mar
ketin
g &
Sales
Div.
(Inte
grat
ed)
Proposal & Solutions Div.
Customer Satisfaction Dept.
Project Solutions Dept.
Business Design & Master Plan Consulting Dept.
Projects Information Analysis & Strategy Dept.
Life Cycle Care Promotion Dept.
AI & IoT Business Promotion Dept.
Abou
t the
Tai
sei G
roup
Tow
ard
Sust
aina
ble
Grow
th o
f the
Taise
i Gro
upSp
ecia
l Fea
ture
Busi
ness
Sec
tion
ESG
Sect
ion
Data
Sec
tion
Data
Sec
tion
112TAISEI ANNUAL REPORT 2019

TAIPEI OFFICE Zone B, 6F, No. 16, Sec. 4, Nan-Jing E. Road,
Taipei, Taiwan R. O. C.
TEL. 886-2-2578-5656 FAX. 886-2-2578-3300
MIDDLE EAST OFFICE (Doha) Corner Abdullah Bin Jassim St.
United Bank Bldg. 4th Floor, Facing QNB Bldg, Doha - Qatar, PO
BOX 47366
TEL. 974-4443-4174 FAX. 974-4443-7176
SINGAPORE OFFICE 16 Collyer Quay, Level 21, Singapore,
049318
TEL. 65-6818-9779
KUALA LUMPUR OFFICE 9-3, 9th Floor, Faber Imperial Court,
Jalan Sultan Ismail, 50250 Kuala Lumpur, MALAYSIA
TEL. 60-3-2070-6155 FAX. 60-3-2070-6010
JAKARTA OFFICE PLAZA OLEOS 18th Floor JI. TB Simatupang
No.53, Pasar Minggu Jakarta Selatan, 12520, Indonesia
TEL. 62-21-2278-3902 FAX. 62-21-2278-3903
INDIA OFFICE #602, 6th Floor, Tower B, Global Business Park,
M.G. Road, Gurgaon, Haryana-122002, India
TEL. 91-124-466-9800 FAX. 91-124-466-9888
PAKISTAN OFFICE Office-A, 5th Floor, Block-A, Saudi Pak
Tower, 61-A, Jinnah Ave., Islamabad, Pakistan
TEL. 92-51-8316620 FAX. 92-51-8316629
VIETNAM OFFICE (Hanoi) 2nd Floor,Block A,Song Da Building
Pham Hung Road,My Dinh1,Nam Tu Liem District Hanoi,
S.R.VIETNAM
TEL. 84-24-3553-5033 FAX. 84-24-3553-5002
VIETNAM OFFICE (Hochiminh City) VIETNAM CHAMBER OF
COMMERCE AND INDUSTRY, Hochiminh City Branch Building
7th FL, 171 Vo Thi Sau St., Ward7, District-3, Hochiminh City,
S.R.VIETNAM
TEL. 84-28-3932-1759 FAX. 84-28-3932-1758
THAILAND OFFICE 19th Floor, Thanapoom Tower, 1550 New
Petchburi Road, Kwaeng Makkasan, Khet Rachtavee, Bangkok
10400, THAILAND
TEL. 66-2-207-0331
PHILIPPINE OFFICE 9th Floor, BDO Equitable Tower, Paseo de
Roxas, Salcedo Village, Makati City, PHILIPPINES
TEL. 63-2-403-9105 FAX. 63-2-478-9542
MYANMAR OFFICE 2nd Floor, Tokyo Enterprise Building, No.32,
Pyay Road, 61/2 miles, Hlaing Township, Yangon, Myanmar
TEL./FAX. 95-1-654-838
SRI LANKA OFFICE No.177, 3rd Floor, Galle Road, Colombo
03, Sri Lanka
TEL. 94-11-2446194 FAX. 94-11-2446198
NORTH AFRICA OFFICE 25th, Rd. No.10, Station Sqr, Maadi,
Cairo, ARAB REPUBLIC OF EGYPT
TEL. 20-2-2378-3609 FAX. 20-2-2380-1362
ISTANBUL OFFICE Barbaros Mah. Seyit Ahmet Deresi Sok.
Bahar Sitesi Yani, 34662 Altunizade - Uskudar Istanbul, TURKEY
TEL. 90-216-651-8160 FAX. 90-216-651-8180
PT.TAISEI PULAUINTAN CONSTRUCTION INTERNATIONAL
PLAZA OLEOS 18th Floor JI. TB Simatupang No.53, Pasar
Minggu Jakarta Selatan, 12520, Indonesia
TEL. 62-21-2278-3906 FAX. 62-21-2278-3903
TAISEI (THAILAND) CO., LTD. 9th Floor, Thanapoom Tower,
1550 New Petchburi Road, Kwaeng Makkasan, Khet Rachtavee,
Bangkok 10400, THAILAND
TEL. 66-2-207-0330 FAX. 66-2-207-0332
VINATA INTERNATIONAL CO., LTD. (Head Office) 3rd Floor,Block C,Song Da Building Pham Hung Road,My
Dinh1,Nam Tu Liem District Hanoi, S.R. VIETNAM
TEL. 84-24-3553-3839, -3840 FAX. 84-24-3553-3788
(Hochiminh City Branch Office) 7th FL, VIETNAM CHAMBER
OF COMMERCE AND INDUSTRY TOWER,171 Vo Thi Sau St.,
District3, Hochiminh City, S.R.VIETNAM
TEL. 84-28-3932-1765 FAX. 84-28-3932-1764
CSCEC-TAISEI CONSTRUCTION, LTD. (Head Office)4th Floor, Building No. 8, Foreign Culture Creativity Park, 19
Chegongzhuang Xi Road, Haidian District, BEIJING, P.R.C.
100048
TEL. 86-10-6845-1267 FAX. 86-10-6845-1266
TAISEI PHILIPPINE CONSTRUCTION INCORPORATED 23rd
Floor, BDO Equitable Bank Tower, Paseo de Roxas, Salcedo
Village, Makati City, PHILIPPINES
TEL. 63-2-886-0670 FAX. 63-2-886-0663
PT. INDOTAISEI INDAH DEVELOPMENT Kawasan Industri Indotaisei, Kota Bukit Indah Sector IA, Block B
Karihurip, Cikampek, Karawan, Jawa Barat, INDONESIA
TEL. 62-264-351-003 FAX. 62-264-351-026
TAISEI MYANMAR CO., LTD. 2nd Floor Tokyo Enterprise
Building, No.32, Pyay Road, 61/2 miles, Hlaing Township, Yangon,
Myanmar
TEL. 95-1-654-838 FAX. 95-1-654-838
Overseas Network (As of August 1, 2019)
Overseas Business Offices Overseas Subsidiaries / Affiliated Companies
113 TAISEI ANNUAL REPORT 2019


