
International Journal of Food and Agricultural Economics
ISSN 2147-8988, E-ISSN: 2149-3766
Vol. 4 No. 4, 2016, pp. 59-77
59
EXPLAINING THE PERCEPTION OF SMALLHOLDERS
TOWARDS WEATHER INDEX MICRO-INSURANCE ALONGSIDE
RISKS AND COPING STRATEGIES
Hezron Nyarindo Isaboke
Information Analysis and Evaluation Division, Agricultural Information Institute,
Chinese Academy of Agricultural Sciences, China & Department of Agricultural
Economics and Extension, University of Embu, Kenya,
Email: [email protected]
Zhang Qiao
Information Analysis and Evaluation Division, Agricultural Information
Institute, Chinese Academy of Agricultural Sciences, China
Wilckyster Nyateko Nyarindo
Department of Agricultural Economics and Business Management, Egerton
University, Kenya.
Wang Ke
Information Analysis and Evaluation Division, Agricultural Information
Institute, Chinese Academy of Agricultural Sciences, China
Abstract
Many studies associate smallholders with negative attitudes towards weather index-based
micro-insurance. This article analyses the perceptions of small-scale maize producers
towards weather index insurance amid common risks and coping strategies. Findings do not
strongly suggest a negative attitude towards weather index insurance among smallholders
thus controverting hitherto studies. Rather, the study postulates that other risks facing
smallholders and their risk responses disposition may distort and override farmers’ attitude
towards weather index insurance. Further, results of the Ordered Probit model revealed that
Sex of the household head, size of the household, if a farmer experienced crop loss in the
previous farming seasons, off-farm income, if a farmer received compensation, the level of
education of the household head, if the household head accessed Credit and group
membership had a significant influence on the perception of the smallholders towards the
index-based micro insurance scheme.
Key Words: Perception, Risk, Coping strategies, Weather index insurance
JEL Codes: D81, Q12, Q14, Q16
1. Introduction and Background
Agricultural risks are associated with undesirable effects that arise due to imperfectly
predictable biological and non-biological factors which are normally beyond the control of
the farmers. Such may include sporadic outbreaks of new pests and diseases, adverse climatic
conditions like drought, flood, storm and frost. In addition, others may include or can be

Explaining the Perception of Smallholders Towards…
60
classified as resource risks like lack of farm inputs, credit access, poor markets, plummeting
of producer prices, un-cushioned input cost fluctuations, destruction of property and loss of
lives among farming households. Thus, it is perturbing that the agricultural sector is
vulnerable to many risks and uncertainties. As part of the remedy, weather index insurance
(WII) is emerging to address the evolving weather perils like drought and excess rains.
Weather index-micro insurance (WII) thus is a topical subject in the present times than
ever before and has subsequently stirred up discourse because of the vital role played by
agriculture to humanity. Many studies reveal that agriculture is one of the most weather
sensitive sectors with a substantially huge demand for financial protection against weather
perils by farmers (Jerry R. Skees, 2008; Turvey, 2001; World Bank, 2011). In addition,
informal insurance mechanisms commonly used by smallholders have been unsuccessful
during manifestations of large covariate risks (Dercon, 1996; Rosenzweig & Binswanger,
1993; Rosenzweig, 1988; Townsend, 1994; Zimmerman & Carter, 2003). Consequently,
researchers and policy makers are concerned with agricultural risks and how they can be
managed using insurance (Enjolras, Capitanio, & Adinolfi, 2012).
It is noteworthy that index products that are based on cumulative rainfall, cumulative
temperature, area yield, livestock mortality and satellite imagery have been developed over
time for agricultural producers (Deng, Barnett, Vedenov, & West, 2007; Mahul, 2001; Martin,
Barnett, & Coble, 2001; Miranda & Vedenov, 2001; J. R Skees & Enkh-Amgalan, 2002;
Turvey, 2001). Progressively also research has concentrated on the potential for using index
based products in low-income countries to mitigate against loss of agricultural assets that
results from various climate perils (Chantarat, Mude, & Barrett, 2009; Hess, Richter, &
Stoppa, 2002; Hess, Skees, Stoppa, Barnett, & Nash, 2005; Mahul & Skees, 2006; Sakurai &
Reardon, 1997; J. Skees, Barnett, & Hartell, 2005; J. Skees, Gober, & Varangis, 2001; J.
Skees, Hazell, & Miranda, 1999; J. R Skees & Enkh-Amgalan, 2002; J. Skees, Varangis,
Larson, & Siegel, 2005; Jerry R. Skees, 2000; Varangis, Skees, & Barnett, 2002). Index based
insurance products have also been developed for a number of crops such as maize and cotton
growers respectively (Daninga & Qiao, 2014b; Osgood et al., 2007) and the scope is
expanding so as to include more crops. In this study index insurance refers to a financial
product linked to an index that is highly correlated to the local yields and its contracts are
written against specific perils or events that are defined and recorded at regional levels (Hazell
et al., 2010). In addition, Hazell et al. affirm that pay-outs are triggered by pre-specified
patterns of the index, and not necessarily the actual yields that are obtained. Hazell et al. also
explain that the insurance product is based on an independently verifiable index, which can
be re-insured, thus allowing insurance companies to transfer part of their risk to international
markets.
A plethora of literature in crop insurance exists that focus on the analysis of factors
influencing crop insurance uptake (Cole et al., 2013; Daninga & Qiao, 2014b; Gine,
Townsend, Vickery, & Take-up, 2008; Sakurai & Reardon, 1997; Smith & Baquet, 1996;
Velandia, Rejesus, Knight, & Sherrick, 2009). This uptake of insurance products in the
agricultural sector though, remains low Leblois and Quirion (2013) whereas in other
commercial sectors like mining, motor vehicle, the services and industrial sectors it continues
to thrive. Likewise, implementation of index based insurance has been slow and subsequent
uptake by both potential insurance providers and beneficiaries is still low (Cole, Bastian,
Vyas, Wendel, & Stein, 2012). Conversely, in a country like the USA where agricultural
insurance is heavily subsidised, agricultural insurance uptake is high (Goodwin & Smith,
2013). Some studies suggests negative attitude towards insurance (Daninga & Qiao, 2014a)
or limited willingness to pay for the insurance services or products (Enjolras et al., 2012; Hill,
Hoddinott, & Kumar, 2013; Mahul & Stutley, 2010) as some of the factors that influence up-
take. According to World Bank (2011) certain behavioural and institutional reasons are also
H. N. Isaboke,Z. Qiao, W. N. Nyarindo and W. Ke
61
causes of the slow uptake of index based insurance because of farmers pursuing other informal
risk sharing arrangements. Others reasons are attributed to significant basis risk1, limited
perils, lack of technical capacity, expertise, and data (International Fund for Agricultural
Development and World food programme, 2011).
Research further shows that households with low incomes and limited wealth do not
choose to adopt risky, but high return activities (Jerry R. Skees, 2008) or to invest in improved
agricultural technology and market opportunities thus encouraging precautionary strategies
over activities that are more profitable on average (Barrett et al., 2007; Hansen, Mason, Sun,
& Tall, 2011). In effect a vicious cycle of low incomes and poverty results, hence impeding
adoption of technology as well as innovative tools for managing agricultural risks like WII
among smallholders. Presently, more than 100 countries are carrying out crop insurance
programmes (Mahul & Stutley, 2010) so as to minimize the effects of adverse weather
conditions on farmers. In Africa, for example, WII programs have been piloted widely in
several countries such as South Africa, Nigeria, Ethiopia, Kenya, Malawi and Tanzania
(Barnett, Barrett, & Skees, 2008; Cole et al., 2013; Daninga & Qiao, 2014b; Hess & Hazell,
2009; Meherette, 2009).
Generally, in practice traditional insurance is an expensive measure of risk mitigation,
particularly to smallholders given the costs associated with the assessment of damages and
subsequent verifications of individual claims in named-peril or multiple-peril insurance
contracts (Jerry R. Skees, 2008). In addition, traditional agricultural insurance schemes face
financial challenges because of high administrative and operational costs, adverse selection
and moral hazard problems (Kang, 2007) that are caused by the prevalence of asymmetric
information. According to Skees (2008) the impact of weather risks on agricultural enterprises
and rural households is real, however individuals suffer because development of insurance is
hampered by enormous transactional costs and information asymmetry. Index based insurance
thus provides an alternative risk-reducing tool with the potential to alleviate the financial
effects of adverse weather (Banerjee & Berg, 2012) which to a large extent affect the
smallholder farmers attitudes towards agricultural insurance. The index-based insurance
though, is subject to salient limitations like basis risk, however, it can provide a less-costly
and more-transparent risk management option than other alternative products, hence enabling
farmers to make more-productive investments and better manage consumption risk (Cole et
al., 2012).
Therefore, against this backdrop, this article examines factors that influence perception
towards WII amid common risks and risk coping strategies, following the case of the Kilimo
Salama (safe Agriculture in Kiswahili) insurance scheme farmers in Kenya. The weather
index crop insurance scheme was established in the year 2008. The insurance was designed
for maize and wheat farmers. The scheme protects farmers’ investment in farm inputs such as
seed, fertilizer and chemicals and against extreme weather risk of drought or excess rainfall.
The project is a partnership between the Syngenta Foundation for Sustainable Agriculture,
UAP Insurance, and telecoms operator Safaricom Limited. The scheme uses solar powered
weather stations to monitor rainfall and mobile phone payment technology to collect
premiums and make payments to farmers respectively. Every time farmers purchase inputs
(seeds, fertilizer or chemicals) from authorized dealers, they pay an extra 5% in addition to
the price as premium. The insurance scheme is distributed by Agro-dealers. These Agro-
dealers register the farmer using a camera-phone to scan a bar code on every input that is sold.
1Basis risk depicts the mismatch between the index-triggered pay-outs and the actual losses
suffered by the smallholders/policy holders. This means that it is possible for farmers/policy
holders to receive a pay-out even when they have suffered no losses, and conversely,
policyholders may not receive a pay-out when they have actually suffered a loss.

Explaining the Perception of Smallholders Towards…
62
Then a text message confirming the policy instantly goes to farmer’s cell phone. The Syngenta
Foundation for Sustainable Agriculture has set up automated weather stations to monitor the
insurance. If a station reports at the end of the season that the local rainfall has been
insufficient, farmers in affected area receive a payout via Safaricom M-PESA money transfer
service. The scheme modernized manual rain gauges with solar powered and computerized
gauges send out data on rainfall levels, sun and temperatures every 15 minutes. The index
insurance policy is offered with respect to the nearest weather station that is within 20
kilometers from where the farm land is located. If the weather station indicates that the rainfall
was insufficient early in the growing season, or too much late in the maize season, all farmers
in that area receive an automatic payout. And if the rainfall was only slightly off, farmers get
a small payment and if the weather was extreme enough to destroy their whole harvest, they
get full compensation as prescribed. We further attempt to show how multiple common risks
facing smallholder farmers may influence the perception and possibly disadvantage the uptake
of index insurance. This study, therefore, contributes to the growing body of literature on WII.
Survey data from smallholder maize producers are assessed to give policy implications for
nurturing WII.
2. Materials and methods
2.1 Description of study area, sampling and data
The study was carried out in Embu County in Kenya. A sample of 401 smallholder farmers
was obtained following Multi-stage sampling technique. Smallholder farmers are defined on
the basis of land cultivation that is less than 5 acres. In the first stage, Embu County was
purposively selected because of the WII programme. In the second stage, purposive sampling
was also used to select maize farmers around the five weather stations (Embu Divisional
Agricultural office, Ishiara Agriculture farm; Runyenjes Agricultural Office; Siakago Rural
Technology Development Unit; Gachoka DO Office) because Kilimo Salama index insurance
targeted maize farmers. In the third stage, systematic random sampling was done to identify
the farmers who participated in the WII. The final stage involved selection of the non-
participants following the simple random sampling.
Cross sectional data were collected by administering a pre-tested interview schedule to the
smallholder maize farmers. The interview schedule captured information pertaining to the
farm characteristics, social-economic, institutional factors and WII technology characteristics,
others include input-output market access, household size, the age, sex and education level
attained by a household head, various sources of income, membership to a formal and or
informal organizations, participation and frequency of contact with extension personnel, land
size, access to credit, distance from home to weather station, years of farming experience
and access to weather forecast information. In addition, data on common risks faced by
farmers, the risk coping strategies used by farmers, source of information about the WII
scheme and perception of farmers towards index insurance were collected. Moreover, the
respondents were asked to rank the commonly experienced risks on a scale of 1-8 and the risk
coping strategies they use using a scale of 1-10. The scales used in the ranking of risks and
risk management strategies vary because the risk management strategies used were not
specific or limited to the types of risk experienced.
2.2 Modelling strategy
The perception towards weather index insurance was obtained using a five point Likert
scale as follows; 0= poor, 1= fair, 2= average, 3= good, 4= excellent. The mean scores were

H. N. Isaboke,Z. Qiao, W. N. Nyarindo and W. Ke
63
then determined. An Ordered Probit model was used to evaluate the relationship between
perception and factors that were hypothesized to influence it. The suitability of this model
derives from the assumption that there is a latent continuous metric underlying ordinal
response observed (Jackman, 2000). The latent continuous variable y*is a linear combination
of some predictions, X and a disturbance term that has a standard normal distribution:
iii Xy * , εi ∼ N (0, 1), ⩝=1…N (1)
Where, 𝑦𝑖∗
is the observed ordinal variable that takes on values 0 through m according to
the following scheme:
nini yny
*
1
Where, n=0....m
The Ordered Probit explicitly shows how changes in the predictors translate into the
probability of observing a particular ordinal outcome. The Ordered Probit is appropriate
because it identifies the relationships between explanatory variables e.g. socio-economic and
institutional factors and a dependent variable (perception of weather index insurance). The
model estimates the statistical significance and direction of the relationship each explanatory
variable has on each rank of perception, as well as marginal effects (Winship & Mare, 1984).
The marginal effects show the probabilities that a farmer would rank the index insurance
scheme in the five categories given a set of farmer characteristics and farm attributes. The
sign in the parameter estimates and their statistical inference indicates the direction of the
relationship (Verbeek, 2004). The Ordered Probit can be expressed in the form:
Xy '*
(2)
Where y* is the dependent variable (perception) that takes the values 0= poor, 1= fair, 2=
average, 3= good, 4= excellent); β’ is a vector of estimated parameters and X is the vector of
explanatory variables; 𝓔 is the error term assumed to be normally distributed with a mean of
zero and unit variance). It has a cumulative distribution denoted by Ф(.) and a density function
on individual falls in category n if µn-1 <y* <µn. The perception data y1 are related to
underlying latent variable y* through thresholds µ, where, n= 0...4 as shown on the following
probabilities.
)'1()'()( XnXnnypro , n=0...4 (3)
where, µ=0 and µ=+∞ and μ0<μ1<μ2<μ3<μ4 are defined as five thresholds within which
the categorical responses are estimated. The estimation of this model is simple and the
likelihood function can be derived easily (Mckelvey & Zavoina, 1975). The threshold µ shows
the range of the normal distribution associated with specific values of the response variable.
The parameter β shows the effect of change in explanatory variable on the underlying scale.
The marginal effect of factors X on the underlying perception index can be evaluated as
shown:
,)]'1()'[)( XnXnXnyprob n=0...4 (4)
In addition, a measure of goodness of fit can be obtained by calculating:
Explaining the Perception of Smallholders Towards…
64
]/[12
oInLb
InL (5)
where, InLb is the log likelihood at convergence and InLo is the log likelihood computed
at zero. If all the coefficients are zero, the goodness of fit will be zero. Normally, the goodness
of fit cannot be equal to one. However a value that is approaching one indicates a very good
fit (Duncan, Khattak, & Council, 1998).
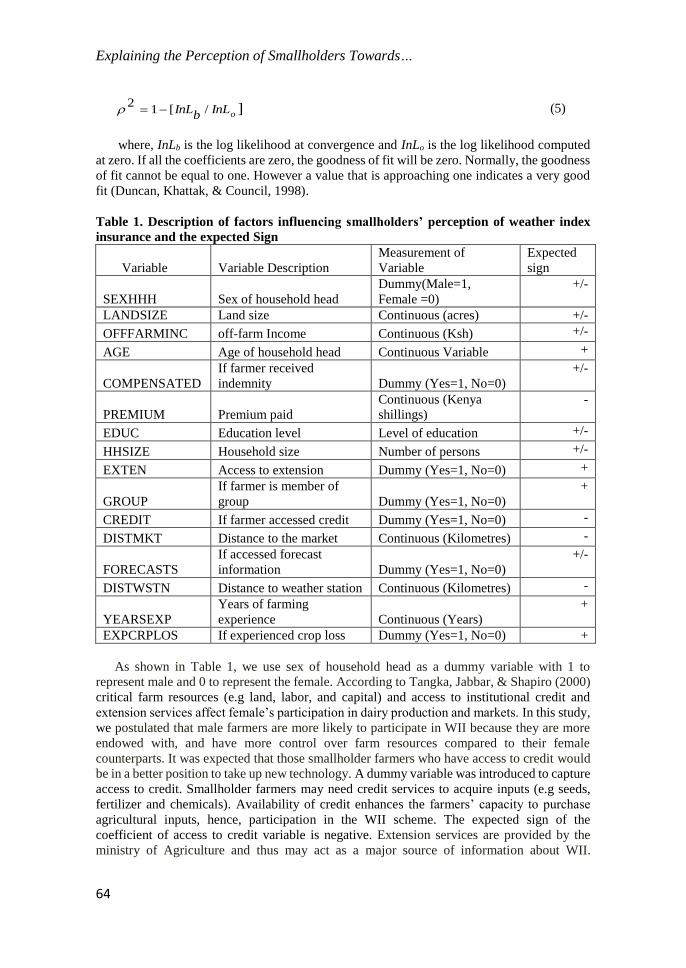
Table 1. Description of factors influencing smallholders’ perception of weather index
insurance and the expected Sign
Variable Variable Description
Measurement of
Variable
Expected
sign
SEXHHH Sex of household head
Dummy(Male=1,
Female =0)
+/-
LANDSIZE Land size Continuous (acres) +/-
OFFFARMINC off-farm Income Continuous (Ksh) +/-
AGE Age of household head Continuous Variable +
COMPENSATED
If farmer received
indemnity Dummy (Yes=1, No=0)
+/-
PREMIUM Premium paid
Continuous (Kenya
shillings)
-
EDUC Education level Level of education +/-
HHSIZE Household size Number of persons +/-
EXTEN Access to extension Dummy (Yes=1, No=0) +
GROUP
If farmer is member of
group Dummy (Yes=1, No=0)
+
CREDIT If farmer accessed credit Dummy (Yes=1, No=0) -
DISTMKT Distance to the market Continuous (Kilometres) -
FORECASTS
If accessed forecast
information Dummy (Yes=1, No=0)
+/-
DISTWSTN Distance to weather station Continuous (Kilometres) -
YEARSEXP
Years of farming
experience Continuous (Years)
+
EXPCRPLOS If experienced crop loss Dummy (Yes=1, No=0) +
As shown in Table 1, we use sex of household head as a dummy variable with 1 to
represent male and 0 to represent the female. According to Tangka, Jabbar, & Shapiro (2000)
critical farm resources (e.g land, labor, and capital) and access to institutional credit and
extension services affect female’s participation in dairy production and markets. In this study,
we postulated that male farmers are more likely to participate in WII because they are more
endowed with, and have more control over farm resources compared to their female
counterparts. It was expected that those smallholder farmers who have access to credit would
be in a better position to take up new technology. A dummy variable was introduced to capture
access to credit. Smallholder farmers may need credit services to acquire inputs (e.g seeds,
fertilizer and chemicals). Availability of credit enhances the farmers’ capacity to purchase
agricultural inputs, hence, participation in the WII scheme. The expected sign of the
coefficient of access to credit variable is negative. Extension services are provided by the
ministry of Agriculture and thus may act as a major source of information about WII.
H. N. Isaboke,Z. Qiao, W. N. Nyarindo and W. Ke
65
Kaufmann (2007) showed that agricultural extension agents are required to deliver and
implement agricultural-related goods and services to farmers and therefore it was expected
that access to extension service, especially on WII, would influence the perception of the
household head positively.
Off-farm income refers to that part of the income measured in Kenya shillings that is
earned from non-farm activities. Such income may enable the farmers to purchase farm inputs.
As a result off-farm income was expected to positively influence participation in WII.
Similarly off-farm income would have a negative effect where farmers spend more time away
from the farm to earn it. Regarding the effect of age of household head, we assume that age is
positively correlated with the uptake of WII on the basis that older farmers are likely to have
accumulated more capital that would lessen the risk effects associated with the adoption of
new technology. Age can also be used as a proxy of farming experience and exposure to
production technologies in addition to higher physical and social capital. This agrees with
Staal et al. (2006) who found that investment level and experience are highly correlated with
age. We assume that older farmers may have expertise through their own experience as
compared to the younger ones and therefore they are more likely to evaluate and adopt new
technologies such as a WII. Education level is considered as a categorical variable that
captures various levels of the farmers’ education. We postulate that household heads with
higher levels of education may have better access to non-farm income and hence, are able to
participate in WII. Educated farmers may also be aware of the benefits of modern
technologies, have a greater ability to access new information and may understand the
complexities associated with WII thus enhancing a positive perception. To the contrary, better
educated household heads may pursue more of off-farm employment and less of the farming
activities, hence a negative effect on the WII.
Mostly, household size has been positively associated with adoption of new agricultural
technologies through provision of labour (Faturoti, Emah, Isife, Tenkouano, & Lemchi, 2006)
which is a limited perspective. The household size variable is defined as the total number of
household members measured in adult equivalent. It is likely that in a big household, the head
may diversify on crops and livestock so as to effectively cope with the common risks hence a
negative perception on WII. Land size is an indicator of wealth and is assumed to influence
the perception of WII positively or negatively. It was also expected that ownership of smaller
parcels land would encourage a positive perception towards WII among farmers because WII
concept primarily targets small-scale producers.
Membership to an organization is used as a dummy in the study. Group membership as a
form of social network was expected to affect perception towards technology uptake. Farmers
who are engaged in informal and/or formal organizations would be in a better position,
compared to those who are not in terms of access to information and possibly access to both
the input and output markets. It was hypothesized that membership to an organization would
positively influence perception towards WII. Concerning distance to the market, it was
assumed that ease of access to the market would readily influence the perception of the
smallholders towards WII; hence it was expected that distance to the market would have a
negative effect. Similarly, since every farmer who buys insurance is linked to the nearest
weather station not more than 20 kilometres from where the farm land is located, it was
postulated that this would have a negative effect on the perception as distance from the
weather station increases. Previous experience of maize crop loss due to extreme weather
changes by farmers was expected to positively influence the household head’s perception of
WII. This is because the WII scheme aim is to cushion farmers against drought or excess rains
that subsequently damage maize crop leading to losses. It was also assumed that the insurance
premium paid would have a negative effect on the perception of the WII. This assumption
holds because when farmers purchase inputs (seeds, fertilizer or chemicals) they pay an extra

Explaining the Perception of Smallholders Towards…
66
5% in addition to price as an insurance premium hence increasing the costs of inputs to the
farmers. Compensation or indemnity in the event of suffering a loss is very important in
insurance (Vaughan & Vaughan, 2014). It was anticipated to positively influence the
perception of farmers towards WII. Likewise, insurance pay-out may have a negative
influence to perception, especially in WII due to basis risk. Access to weather forecast
information was captured as a dummy variable with 1 representing access and 0 otherwise.
We assumed that access to forecast information by the smallholders would either influence
their perception towards WII positively or negatively.
3. Results and discussion
3.1 Perception and selected risks and coping strategies
In order to determine the perception of farmers towards the common risks that affect
agriculture in the study area, we identified common risks such as drought, excess rains, floods,
frost, crop pests and diseases, input costs, marketing difficulties and price volatility. The
smallholder farmers were then asked to rank these risks on a scale of 1 to 8 where 1 represents
most important risk. Out of this, the most important risks to smallholder farmers were drought
(1.29), input costs (3.55) and crop pests and diseases (3.63) respectively. The least ranked
risks in the same order of importance were excess rains (5.53), floods (6.60) and frost (7.86)
as shown in Table 2. The introduction of WII scheme is a deliberate effort to create a
sustainable, effective tool for farmers to manage climate risks commonly associated with
rainfall variability and drought that directly affect livelihoods by damaging farmers’ harvest
and inhibiting the prospects of recovery and continuity of smallholders farming activities in
the future seasons. Proceeds from sales of farm produce are the main sources of income for
majority of the small-scale farmers in developing countries. Thus when the adverse effects of
weather perils harm and the reduce quantity and quality of crop yield, farmers end up with
limited food and crop incomes. The latter implication further drives farmers who are low
resource users to meagre spending on the farm inputs in the successive season. This means an
arduous season would have consequential spiral effects for several seasons where formal risk
mitigation measures are limited. Though, as earlier pointed out, agricultural insurance
coverage for small-scale producers is not widely available in many developing countries.
Thus, establishing and widely scaling-up of WII schemes is vital because of the fundamental
risks facing farmers today. The input costs (3.55), crop pests (3.63) and market difficulties
(3.71) revealed a clustered trend in the ranking of risks affecting the smallholders as given by
the means of the respective scores. This implies that farmers perceive they are entangled in an
array of perils and exposed to multiple threats where a singular approach to addressing risks
may not necessarily be sufficient. Therefore, an indifferent attitude towards weather index
based innovations may result, especially if they are perceived to be incapable of addressing a
range of threats.
Furthermore, the analysis sought to determine the farmers’ most preferred strategies that
are used to cushion them against weather related risks. These include; household engagement
in off-farm work, household savings, undertaking crop diversification, reliance on food aid,
measures such as stopping children from attending school, borrowing from banks, taking up
WII policy, selling of livestock, reducing consumption and borrowing from relatives.
Similarly, farmers were asked to rank the various risk coping strategies on a scale of 1-10
where, 1 represent most important and often used strategy and 10 the least important and
rarely used risk coping strategy among the smallholders. The results show that the smallholder
farmers ranked engagement in off-farm work (2.01), use of household savings (3.26) and crop
diversification (3.71) as the most important strategies of coping with drought and hunger.

H. N. Isaboke,Z. Qiao, W. N. Nyarindo and W. Ke
67
Borrowing from banks (7.04), food aid (7.27) and stopping children from attending school
(8.36) were ranked the least important strategies (Table 2). Notably, in the study was the use
of savings as a coping strategy which poses a conundrum because farmers who are low
resource users may not always be able to amass sufficient wealth to cover their losses in the
event of crop damages and loss that result from weather variations. This would be observed
more when covariate risks occur. Hazell et al. (2010) asserts that loss of productive assets can
push households into poverty, from which it may be difficult to recover in the subsequent
years. In addition, literature shows that informal risk coping mechanisms that depend on
neighbours for example, are not effective in the case of covariate shock such as drought
because many households within a certain region suffer simultaneously (Dercon, Hoddinott,
& Woldehanna, 2005; Harrower & Hoddinott, 2005). Eventually this leads to a persistent
pattern of reduced consumption thus agreeing with our argument that savings can be regarded
as a frail option that may not sustain coping with the risks substantively. Thus, it is more likely
that individuals result in immediate liquidation of assets such as livestock, which is a form of
savings to smallholders for resilience after shock. In effect this might as well exhaust the
resources that are required to obtain farm inputs for the subsequent seasons. Moreover, it has
been observed that climate shocks precipitate effects such as children withdrawing from
school and causes a decline in household productivity, asset accumulation and income growth
(Dercon & Hoddinott, 2005; Dercon & Krishnan, 2000; Hoddinott & Kinsey, 2001;
Hoddinott, 2006).
As explained, drought can literally deprives farmers off the capacity to save for the future.
Equally, excess rain at the time of crop establishment or harvest too is hazardous and can
subject farmers to the misery of incurring massive crop losses (Kibui, 2015). This is due to
the physical crop and yield damage before harvest as well as lack of proper storage facilities
which leads to wastage of farm produce. In such circumstances, sustainable remedies like the
innovative WII that can ultimately compensate the farmers (except for the crop that has been
already harvested) are most appropriate.
Strikingly, the results indicate that WII was ranked seventh in the order of preference as a
risk coping strategy by the farmers. This is critical in an effort to understand and curb weather
related risks because it’s a pointer to existing perception challenges. Innovations in index-
based insurance may still present challenges, however, Ke, Qiao, Kimura, & Akter (2015)
affirm that crop insurance programs benefits are quantifiable and that they improve the
welfare farmers. Similarly, Ali (2013) found that in the rain-fed areas of Pakistan farmers
considered index based insurance as an important risk management strategy.
Analogous to the ranking of risks in the study, ranking of the risk coping strategies
revealed that selling of livestock (5.39), Reduce consumption (5.60) and weather index
insurance (5.71) were clustered too. It can thus be said that WII is preferred, just as much as
the other coping strategies, even though in absolute terms the strategies are distinctly ordered.
This buttress the explanation that given the average clustered scores where WII is embedded,
perception towards insurance does not necessarily suggest a strong negative connotation in
isolation. Rather, it qualifies that multiple-risks play a role in the orientation that farmers have
about coping strategies in addition, the risks response disposition of the farmers may distort
and override farmers’ attitudes towards the WII. The ranking of index insurance on an average
basis reveals that farmers possibly have certain inherent reservations to the use of WII. This
is exercised when farmers’ meagre resources are split and allocated among several risk coping
strategies, including WII to mitigate possible risks. In the likely circumstances that most
smallholders are low resource users the multiple divisions of resources infers that not a single
strategy gets the requisite financial support sustainably. As a result, farmers remain exposed
to risks, including where technology is advancing solutions like in WII. Ultimately, farmers
may tend to exude negative perceptions when they shun WII products because they are

Explaining the Perception of Smallholders Towards…
68
uncertain about relying upon the index insurance to cushion them against devastating crop
losses due to the numerous risks that they encounter.
Table 2. Order of importance of risks and coping strategies as perceived by
smallholder farmers
RIS
KS
Ord
er o
f
Imp
ort
an
ce
N
Mea
n
Std
Err
or
RIS
KS
CO
PIN
G
ST
RA
TE
GIE
S
Ord
er o
f
Imp
ort
an
ce
N
Mea
n
Std
Err
or
Drought 1 401 1.29 0.073 off-farm work 1 401 2.01 0.123
input costs 2 401 3.55 0.124 HH savings 2 401 3.26 0.116
Crop pests 3 401 3.63 0.089 Diversification 3 401 3.71 0.176
market
difficulties
4 401 3.71 0.096 borrow from
relatives
4 401 4.97 0.121
Price
volatility
5 401 4.81 0.112 sell livestock 5 401 5.39 0.128
Excess rain 6 401 5.53 0.100 Reduce
consumption
6 401 5.60 0.145
Flood 7 401 6.60 0.113 Index
insurance
7 401 5.71 0.116
Frost 8 401 7.86 0.123 borrow from
banks
8 401 7.04 0.109
Food Aid 9 401 7.27 0.104
stop children
schooling
10 401 8.36 0.001
Source: Survey data 2015, Embu County
3.2 Determinants of perception towards rating the effectiveness of index-based weather
insurance
Table 3 presents the coefficients and marginal effects of the Ordered Probit model of the
various factors influencing producers’ perceptions towards WII. The marginal effects were
estimated because the interpretation of coefficients as shown in table 3 alone is not sufficiently
informative. The marginal effects (partial derivatives) depict the probabilities and impacts of
a change in an explanatory variable on the predicted probabilities denoted by columns dy/dx_0
(poor), dy/dx_1 (fair), dy/dx_2 (average) dy/dx_3 (good) dy/dx_4 (excellent). The findings
suggest that both socioeconomic and institutional characteristics are vital in shaping the
households’ head perceptions. The R2 value indicates that 16.7% variation in the dependent
variable was due to the independent variables included in the model. The LR χ2 was significant
at 1% level, indicating the robustness of the variables used.
The Sex of the household head was significant with a positive marginal effect in rating the
effectiveness of WII of 5.39%. Both male and female genders participate in rural household
small-scale farming activities as well as in technology uptake. This may suggest differences
in the way household heads reveal perception towards WII technology due to the diversity of
household decision making. Studies show that men and women exhibit different
characteristics, in terms of their willingness to take risks and to trust people with women
tending to make less risky choices (Eckel & Grossman, 2008). Likewise, others argue that

H. N. Isaboke,Z. Qiao, W. N. Nyarindo and W. Ke
69
WII and other rural financial products are mostly designed for men, and they hardly account
for gender-specific needs and constraints (Fletschner & Kenney, 2014). In addition (Akter,
Krupnik, Rossi, & Khanam, 2016) found significant insurance aversion among female
farmers, irrespective of the attributes of the insurance scheme under consideration.
Table 3. Coefficients and Marginal Effects of the Ordered Probit Model of Farmer
Perceptions towards Weather Index Insurance
NOTE ***, **, * means significant at 1%, 5% and 10% probability levels, respectively, LR chi2
(15) = 41.71, Prob > chi2 = 0.000, Pseudo R2 = 0.167, Log likelihood = -135.9741, N=401
variable Coefficients dy/dx_0 dy/dx_1 dy/dx_2 dy/dx_3 dy/dx_4
Sex of
household head
-4.3112
(2.2163)*
0.3484
(0.3922)
0.0539
(0.2550)*
0.0629
(0.0912)
-0.6215
(0.4207)
-0.3295
(0.4945)
Land size 0.7713
(0.5191)
-0.0100
(0.0164)
-0.1752
(0.1404)
-0.0825
(0.0739)
0.2549
(0.1849)
0.0128
(0.0308)
logoff-farm
income
3.4682
(1.4704)**
-0.0448
(0.0692)
-0.0807
(0.3501)**
-0.3710
(0.2885)
0.0410
(0.4620)**
0.0575
(0.1341)
Age of
household head
0.1436
(0.0959)
-0.0019
(0.0030)
-0.0326
(0.0205)
-0.0154
(0.0149)
0.0475
(0.0298)
0.0024
(0.0058)
Compensated
for loss
-2.4077
(1.3646)*
0.1133
(0.1542)
0.0028
(0.2179)**
-0.0643
(0.2261)*
0.1136
(0.0829)
-0.0734
(0.1384)
Premium paid 0.6560
(0.7376)
-0.0085
(0.0152)
-0.1490
(0.1813)
-0.0702
(0.0860)
0.2168
(0.2513)
0.0109
(0.0264)
Education level -1.4960
(0.9524)*
0.0193
(0.0300)
0.3398
(0.2103)
0.1601
(0.1486)
-0.1443
(0.2893)*
-0.0248
(0.0611)
Household size 1.9490
(0.7139)**
-0.0251
(0.0391)
-0.0046
(0.1760)**
-0.2085
(0.1572)
0.0640
(0.2293)***
0.0323
(0.0751)
Access to
extension
0.4999
(1.2929)
-0.0095
(0.0356
-0.1258
(0.3501)
-0.0474
(0.1079)
0.1763
(0.4695)
0.0063
(0.0213)
Group
membership
-1.4063
(1.9714)*
0.0112
(0.0212)
0.2217
(0.2039)
0.1369
(0.1553)
-0.0991
(0.1623)*
-0.0706
(0.2694)
Access to credit -2.4537
(1.3982)*
0.1186
(0.1715)
0.0264
(0.2054)**
0.1123
(0.0830)
-0.0014
(0.2404)***
-0.0659
(0.1316)
Distance to
market
-0.2323
(0.1450)
0.0030
(0.0049)
0.0528
(0.0340)
0.0249
(0.0228)
-0.0768
(0.0477)
-0.0038
(0.0092)
Forecast
information
-0.8766
(1.8080)
0.0054
(0.0100)
0.1377
(0.1690)
0.0934
(0.1693)
-0.1997
(0.1919)
-0.0368
(0.1666)
Distance to
weather station
0.0868
(0.0734
-0.0011
(0.0019)
-0.0197
(0.0167)
-0.0093
(0.0099)
0.0287
(0.0232)
0.0014
(0.0037)
Years of
farming
experience
-0.1331
(0.0600)**
0.0017
(0.0028)
0.0302
(0.0149)**
-0.0142
(0.0113)**
-0.0440
(0.0196)
-0.0022
(0.0053)
Experienced
crop loss
3.7249
(1.3227)
-0.4288
(0.2963)
0.0842
(0.2274)
-0.0241
(0.0503)
0.0093
(0.1769)
0.1079
(0.1764)
Predicted probabilities
Prob(Y=0|X) 0.0044
0.1523
0.1419
0.6955
0.0058
Prob(Y=1|X)
Prob(Y=2|X)
Prob(Y=3|X)
Prob(Y=4|X)

Credit access influenced perception about the effectiveness of WII in two fold. Firstly, the
results show that credit access has a probability of 2.64% to positively influence perception
regarding effectiveness of WII as fair. Secondly, credit has a probability of 0.14% to
negatively influence the rating of index insurance as being good when credit changes by one
unit. This can be explained that credit is an important variable that could improve the
perception of farmers when accessed by the rural farming households who normally do not
obtain it from formal institutions. The negative influence implies that farmers may access
credit and expend it on other purposes other than farming activities like the WII. Ordinarily
just like in non-farming activities, individual farmers seek credit when hard pressed by other
special domestic (e.g dowry, medical, school fees) needs hence they may not give insurance
policy (added cost) a priority. Nonetheless, access to credit is a major challenge to most rural
smallholder farmers due to lack of collateral, lack of bankable projects and high risk of
agricultural credit to farmers (Munyambonera, Nampewo, Adong, & Mayanja, 2012). Studies
examining the effects of bundling index insurance with micro-credit have assumed that small-
scale farmers already have access to credit, and therefore, focused on how insurance affects
farmer demand for loans (Carter, Cheng, & Sarris, 2011). In reality, one of the reasons of low
adoption of WII products among rural farm households in many developing countries is linked
to poor access to credit, implying that farmers often have difficulty finding enough money
when they are supposed to make these purchases (Mcintosh, Sarris, & Papadopoulos, 2013) .
Therefore, access to credit may allow farmers who want but cannot afford WII an opportunity
to insure their crops.
Contrary to expectation, the membership to a group variable had a negative effect on the
ratings of the WII effectiveness. The probability thus declines by 9.91% where a smallholder
farmer participates in the local social groups. Both formal and informal groups are used as
important avenues for trainings; farmer field schools (FFS), extension demonstrations and
dissemination of information by various organs in the rural setup. This enhances ease of
information and knowledge sharing about WII among group members. Thus the finding
suggests that farmers used the groups much more on other social and cultural activities (e.g
weddings, funerals) other than agricultural related where WII uptake is one. A study by
(Kumar et al., 2011) showed that farmer’s participation in social and community-based
organization increased the probability of being aware about crop insurance scheme.
It was noted that farmers’ education levels significantly influence perception towards WII.
The probability of education level reducing the chance of rating WII as good was found to be
14.43%. An increase in the level of education thus implies that education makes individuals
more versatile and enhances the way individuals perceive, understand, interpret and respond
to issues. In addition, better educated farmers may consider pursuing other economic activities
other than agriculture thus the negative effect. A study by (Murage et al., 2011) affirms that
educated farmers were more flexible in acquisition of information sources and would consult
depending on the prevailing circumstances to meet their needs.
Just like other forms of insurance where compensation or indemnity is vital in the event
of suffering a loss (Vaughan & Vaughan, 2014), it is equally important in agricultural
insurance. We find that compensation due to crop loss variable led to positive rating of the
WII as fair with a probability of 0.28%. Conversely, the rating of the WII had a probability of
6.43% with a negative effect. This implies that although pay-out was done, possibly it did not
cover the full losses as experienced by the farmers. This is called downside basis risk, where
a farmer pays for an insurance contract, the year turns out to be bad and no pay-out is made
following the difference between the index and actual rainfall record on the field. Thus, having
knowledge and understanding of whether payment will be made or not when the peril operates
is vital. As mentioned, index insurance is based on local e.g rainfall indexes that are closely

H. N. Isaboke, Z. Qiao, W.N. Nyarindo , W. Ke
71
related with the yields in the region. So that when the payment threshold is met farmers
automatically receive payment without a costly process of estimating their losses. Normally
farmers will expect full compensation in the event of loss. In addition, the weather index
concept holds that farmers may also receive pay-out even when they have actually not suffered
a loss as long as the index triggers payment due to the differences recorded between the farm
and the reference weather station. Such varied occurrences may wield potential to influence
the perception that small-scale farmers hold about WII.
Further, the effect of household size was positive and significant. This reveals that an
increase in size of household by one member reduces the probability of rating the effectiveness
as fair by 0.46% while it also increases the probability of a good rating by 6.40%. These
observations can be explained differently; firstly, a big household may have diversified on
crops, livestock and income to effectively cope with the common risks. Secondly, in positively
increasing the probability these empirical results suggest that an increase in the size of the
household impelled the household to view other innovative measures such as WII as
appropriate in cushioning against crop loss. In addition, a bigger household size may imply
diversity in opinions, exposure to new knowledge, information or ideas as shared by different
members that could affect how the household head makes decisions. Mostly a big household
size has been associated with adoption of new agricultural technologies through provision of
labour (Faturoti et al., 2006).
The number of years of farming experience was significant in the study and a change in
the years of farming led to a fair and average rating of the effectiveness of the WII by 3.02%
and 1.42% respectively. The negative sign on the average rating imply that those farmers with
more years of farming experience were less likely to rank WII as average and more likely to
rank it as fair. According to (Isaboke, Mshenga, Mutai, & Saidi, 2012) increase in years of
experience leads to a better understanding of farming by way of learning new skills and
appreciating new knowledge thus leading to an increase in the extent of adoption of
technology. Similarly, (Oluoch-Kosura, Marenya, & Nzuma, 2001) affirmed that experienced
farmers often have better technical knowledge and are better placed to assess risks and
possible returns on investment of a technology.
The Household head’s off-farm income was also significant and it negatively influenced
the probability of perceiving WII as fair. This implies that an increase in off-farm income by
one unit reduced the probability of rating the scheme by 8.07%. This is probably because of
the fact that farmers who were involved in off-farm activities and other formal employment
engaged limited time in pursuit of other on-farm activities and measures of risk mitigation
such as WII. It is also possible that farmers who participate more in off-farm activities tend to
earn higher income which allows a household to easily smooth consumption; as a result
farmers would view WII as just a fair coping strategy. Contrary, it was also observed that an
increase in off-farm income by one unit would increase the probability rating of WII as good
by 4.10%. This can be explained that off-farm income may have been used to some extent to
meet farm expense requirements such as any extra costs coming with the new innovation of
WII like the premium load on the price of inputs (seeds, fertilizer and pesticides) at the start
of a planting season. Other empirical studies show that off–farm income may provide income
for the purchase of inputs, thus enhancing uptake of new technology since that addresses the
risk in trying out new technologies (Mathenge & Tschirley, 2007)
4. Conclusion and policy implications
Smallholder farmers face multiple risks in their farming activities. Studies also show that
agriculture is one of the most weather sensitive sectors and farmers’ demand for financial
protection against weather perils is huge. In order to address this situation an innovation

Explaining the Perception of Smallholders Towards…
72
platform and research beyond classical agricultural insurance has led to development of WII
products. Smallholders who are the ultimate beneficiaries on the other hand, however are non-
exuberant and slow in embracing such innovations. This continues to be a major setback
towards adoption and advancement of suitable technologies that could enhance smallholders’
productivity and smoothing of agricultural incomes. Literatures also reveal that farmers have
a negative perception towards WII without extensive prodding the effects of other risks that
farmers face. This research sought to determine the perception of smallholder farmers towards
WII amid common risks and risk coping strategies. The study generally established that
farmers do not rank WII as the most preferred risk coping strategy. Instead, involvement in
off-farm activity, drawing from savings or investments and crop diversification provide an
alternative cushion against risks. Furthermore, the findings do not strongly suggest a negative
attitude towards the use of WII among smallholders thus controverting hitherto studies. In
addition, the study rather postulates that other risks facing smallholders and their risk
responses disposition may distort and override farmers’ attitude towards WII. Thus leaving
farmers uncertain regarding the extent to which they can rely upon WII in cushioning against
devastating crop losses due to the occurrence of multiple risks.
The output of the Ordered Probit model further reveal that Sex of the household head, size
of the household, if a farmer experienced crop loss in the previous farming seasons, off-farm
income, if a farmer received compensation/indemnity, the level of education of the household
head, if the household head accessed Credit and group membership had a significant influence
on the perception of the smallholders towards the WII. The findings reveal the ranking of WII
as largely fair and good at the same time with respect to various independent variables, thus
signifying potential for success of such a tool of risk mitigation. We recommend the use of
farmers' perceptions as an important entry point for enhancing crop insurance research and
dissemination of WII information to the ultimate consumers and policy framework
development. Further studies on the role of gender and collective action in enhancing WII are
also recommended. It is important, however to note that index insurance is a financial product
and not a physical product like in other innovative crop or animal technologies. It is rather
conceptual but has observable benefits occasionally thus due diligence is paramount in the
totality of processes that would make WII functional as well as in scaling it-up among
smallholder farmers.
5. Acknowledgement
The authors gratefully acknowledge the financial support of the University of Embu in
funding this research. The authors would also like to thank the farmers, agricultural officers,
enumerators, anonymous referees and editors for their helpful contributions to this article. The
views expressed in this article are those of the authors and not necessarily those of the
supporting or affiliate organizations.
References
Akter, S., Krupnik, T. J., Rossi, F., & Khanam, F. (2016). The influence of gender and product
design on farmers ’ preferences for weather-indexed crop insurance. Global
Environmental Change, 38, 217–229. http://doi.org/10.13140/RG.2.1.1057.4569
Ali, A. (2013). Farmers ’ Willingness to Pay for Index Based Crop Insurance in Pakistan : A
Case Study on Food and Cash Crops of Rain-fed Areas. Agricultural Economics Research
Review, 26(2), 241–248.
Banerjee, C., & Berg, E. (2012). Policy for implementation of Index Based Weather Insurance
revisited: the case of Nicaragua. In 123 rd EAAE Seminar (pp. 1–17). Dublin.

H. N. Isaboke, Z. Qiao, W.N. Nyarindo , W. Ke
73
Barnett, B. J., Barrett, C. B., & Skees, J. R. (2008). Poverty Traps and Index-Based Risk
Transfer Products. World Development, 36(10), 1766–1785.
http://doi.org/10.1016/j.worlddev.2007.10.016
Barrett, C. B., Barnett, B. J., Carter, M. R., Chantarat, S., Hansen, J. W., Mude, A. G., …
Ward, M. N. (2007). Limitations and opportunities of Index-based Risk Financing (No.
07-03). Poverty Traps and Climate and Weather Risk. Columbia University Academic
Commons. Retrieved from http://hdl.handle.net/10022/AC:P:8902
Carter, M. R., Cheng, L., & Sarris, A. (2011). The Impact of Interlinked Index Insurance and
Credit Contracts on Financial Market Deepening and Small Farm Productivity. Working
Paper March 16th. University of California, Davis.
Chantarat, S., Mude, A. G., & Barrett, C. B. (2009). Willingness to pay for index based
livestock insurance: results from a field experiment in northern Kenya. Ithaca, NY (USA):
Retrieved from
http://results.waterandfood.org/bitstream/handle/10568/784/chantarat_et_al__wilingness.
pdf?sequence=2
Cole, S., Bastian, G. G., Vyas, S., Wendel, C., & Stein, D. (2012). The effectiveness of index-
based micro-insurance in helping smallholders manage weather-related risks. London:
EPPI-Centre, Social Science Research Unit, Institute of Education, University of London.
Cole, S., Giné, X., Tobacman, J., Townsend, R., Topalova, P., & Vickery, J. (2013). Barriers
to Household Risk Management : Evidence from India. American Economic Journal:
Applied Economics, 5(1), 104–135. http://doi.org/10.1257/app.5.1.104
Daninga, P. D., & Qiao, Z. (2014a). Factors affecting attitude of farmers towards drought
insurance in TanzaniaFactors affecting attitude of farmers towards drought insurance in
Tanzania. International Journal of Science and Humanities, 2(8), 27–38.
Daninga, P. D., & Qiao, Z. (2014b). Factors Influencing Holding of Drought Insurance
Contracts. International Journal of Development and Economic Sustainability, 2(5), 16–
30.
Deng, X., Barnett, B. J., Vedenov, D. V., & West, J. W. (2007). Hedging dairy production
losses using weather-based index insurance. Agricultural Economics, 36, 271–280.
http://doi.org/10.1111/j.1574-0862.2007.00204.x
Dercon, S. (1996). Risk, Crop Choice, and Savings: Evidence from Tanzania. Economic
Development and Cultural Change, 44(3), 485–513. http://doi.org/10.1086/452229
Dercon, S., & Hoddinott, J. (2005). Health, Shocks and Poverty Persistence. In S. Dercon
(Ed.), Insurance Against Poverty. Oxford: Oxford University Press.
Dercon, S., Hoddinott, J., & Woldehanna, T. (2005). Shocks and consumption in 15 Ethiopian
villages, 1999-2004. Journal of African Economies, 14(4), 559–585.
http://doi.org/10.1093/jae/eji022
Dercon, S., & Krishnan, P. (2000). In Sickness and in Health : Risk Sharing within
Households in Rural Ethiopia. Journal of Political Economy, 108(4), 688–727.
http://doi.org/10.1086/316098
Duncan, C. S., Khattak, A. J., & Council, F. M. (1998). Applying the ordered probit model to
injury severity in truck – passenger car rear-end collisions. Transportation Research
Record: Journal of the Transportation Research Board, 1635(98), 63–71.
http://doi.org/10.3141/1635-09
Eckel, C. C., & Grossman, P. J. (2008). Men, Women and Risk Aversion: Experimental
Evidence. Handbook of Experimental Economics Results, 1, 1061–1073.
Enjolras, G., Capitanio, F., & Adinolfi, F. (2012). The demand for crop insurance : Combined
approaches for France and Italy. Agricultural Economics Review, 13(1), 5–22.

Explaining the Perception of Smallholders Towards…
74
Faturoti, B. O., Emah, G. N., Isife, B. I., Tenkouano, A., & Lemchi, J. (2006). Prospects and
determinants of adoption of IITA plantain and banana based technologies in three Niger
Delta States of Nigeria. African Journal of Biotechnology, 5(14), 1319–1323. Retrieved
from http://www.academicjournals.org/AJB ISSN
Fletschner, D., & Kenney, L. (2014). Rural women’s access to financial services: credit,
savings, and insurance. In A. R. Quisumbing, R. Meinzen-Dick, T. L. Raney, A.
Croppenstedt, J. A. Behrman, & A. Peterman (Eds.), Gender in Agriculture. Netherlands:
Springer.
Gine, X., Townsend, R., Vickery, J., & Take-up. (2008). Patterns of Rainfall Insurance
Participation in Rural India. The World Bank Economic Review, 22(3), 539–566.
http://doi.org/10.1093/wber/lhn015
Goodwin, B. K., & Smith, V. H. (2013). What harm is done by subsidizing crop insurance?
American Journal of Agricultural Economics, 95(2), 489–497.
http://doi.org/10.1093/ajae/aas092
Hansen, J. w., Mason, S. J., Sun, L., & Tall, A. (2011). Review of Seasonal Climate
Forecasting for Agriculture in Sub-Saharan Africa. Expl Agric, 47, 205–240.
http://doi.org/10.1017/S0014479710000876
Harrower, S., & Hoddinott, J. (2005). Consumption smoothing in the Zone Lacustre, Mali.
Journal of African Economies, 14(4), 489–519. http://doi.org/10.1093/jae/eji007
Hazell, P., Anderson, J., Balzer, N., Clemmensen, A. H., Hess, U., & Rispoli, F. (2010). The
Potential for Scale and Sustainability in Weather Index Insurance: for Agriculture and
Rural Livelihoods. Rome: IFAD and WFP.
Hess, U., & Hazell, P. (2009). Sustainability and Scalability of Index-Based Insurance for
Agriculture and Rural Livelihoods. International Food Policy Research Institute 2020.
Focus 17 Brief 5, 1–2.
Hess, U., Richter, K., & Stoppa, A. (2002). Weather Risk Management for Agriculture and
Agri-Business in Developing Countries. In R. Dischel (Ed.), Financial Risk Management
with Weather Hedges (Risk Books). London.
Hess, U., Skees, J. R., Stoppa, A., Barnett, B. J., & Nash, J. (2005). Managing Agricultural
Production Risk: Innovations in Developing Countries (No. No. 32727-GLB). Retrieved
from http://portal.iri.columbia.edu/~deo/insurancereading/Managing Ag Production
Risk_FINAL.doc
Hill, R. V., Hoddinott, J., & Kumar, N. (2013). Adoption of weather-index insurance : learning
from willingness to pay among a panel of households in rural Ethiopia. Agricultural
Economics, 44, 385–398.
Hoddinott, J. (2006). Shocks and their consequences across and within households in rural
Zimbabwe. Journal of Development Studies, 42(2), 301–321.
http://doi.org/10.1080/00220380500405501
Hoddinott, J., & Kinsey, B. (2001). Child growth in the time of drought. Oxford Bulletin of
Economics and Statistics, 63(4), 409–436. http://doi.org/10.1111/1468-0084.t01-1-00227
International Fund for Agricultural Development and World food programme. (2011).
Weather index-based insurance in agricultural development: a technical guide. Rome,
Italy. Retrieved from www.ifad.org/ruralfinance/pub/WII_tech_guide.pdf
Isaboke, H. N., Mshenga, P., Mutai, B. K., & Saidi, M. (2012). Determinants of Adoption of
Butternut Squash (Cucurbita moschata) Farming by Small-holders in Suba District,
Kenya. Journal of Agriculture & Rural Development, 9, 82–97.
Jackman, S. (2000). Models for Ordered Outcomes. Political Science 200c. Retrieved from
http://web.stanford.edu/class/polisci203/ordered.pdf

H. N. Isaboke, Z. Qiao, W.N. Nyarindo , W. Ke
75
Kang, M. G. (2007). Innovative agricultural insurance products and schemes: Agricultural
Management, Marketing and Finance Occasional Paper 12. Rome: Food and Agriculture
Oganization of the United Nations.
Kaufmann, D. (2007). Governance matters VI : aggregate and individual governance
indicators, 1996-2006. World Bank Publications.
Ke, W., Qiao, Z., Kimura, S., & Akter, S. (2015). Is the crop insurance program effective in
China ? Evidence from farmers analysis in five provinces. Journal of Integrative
Agriculture, 14(10), 2109–2120. http://doi.org/10.1016/S2095-3119(14)60842-X
Kibui, R. (2015, December 12). Insurance wipes away the burden of erratic weather.
SATURDAY NATION, p. 29.
Kumar, D. S., Barah, B. C., Ranganathan, C. R., Venkatram, R., Gurunathan, S., &
Thirumoorthy, S. (2011). An Analysis of Farmers ’ Perception and Awareness towards
Crop Insurance as a Tool for Risk Management in Tamil Nadu. Agricultural Economics
Research Review, 24, 37–46.
Leblois, A., & Quirion, P. (2013). Agricultural insurances based on meteorological indices :
realizations , methods and research challenges. Meteorol. Appl, 20, 1–9.
http://doi.org/10.1002/met.303
Mahul, O. (2001). Optimal Insurance Against Climatic Experience. American Journal of
Agricultural Economics, 83(3), 593–604. http://doi.org/10.1111/0002-9092.00180
Mahul, O., & Skees, J. (2006, March). Piloting Index-Based Livestock Insurance in Mongolia.
Access Finance: A Newsletter Published by the Financial Sector Vice Presidency, The
World Bank Group, Issue No. 10, 1–4.
Mahul, O., & Stutley, C. J. (2010). Government Support to Agricultural Insurance:
Challenges and Options for Developing Countries. Washington DC: The International
Bank for Reconstruction and Development / The World Bank.
Martin, S. W., Barnett, B. J., & Coble, K. H. (2001). Developing and Pricing Precipitation
Insurance. Journal of Agricultural and Resource Economics, 26(1), 261–274.
Mathenge, M. K., & Tschirley, D. (2007). Off-farm Work and Farm Production Decisions :
Evidence from Maize-Producing Households in Rural Kenya Off-farm Work and Farm
Production Decisions : Evidence. In CSAE Conference 2007 on “Economic Development
in Africa”, St. Catherine’s College, University of Oxford. UK.
Mckelvey, R. D., & Zavoina, W. (1975). A statistical model for the analysis of ordinal level,
dependent variables. Journal of Mathematical Sociology, 4(1), 103–120.
http://doi.org/10.1080/0022250X.1975.9989847
Meherette, E. (2009, December). Providing Weather Index and Indemnity Insurance in
Ethiopia. International Food Policy Research Institute 2020. Focus 17 Brief 8, 1–2.
Miranda, M., & Vedenov, D. V. (2001). Innovations in Agricultural and Natural Disaster
Insurance. American Journal of Agricultural Economics, 83(3), 650–655.
http://doi.org/10.1111/0002-9092.00185
Munyambonera, E., Nampewo, D., Adong, A., & Mayanja, M. (2012, November). Access
and Use of Credit in Uganda : Unlocking the Dilemma of Financing Small Holder Farmers.
Economic Policy Research Centre (EPRC) Policy Brief. Kampala, Uganda. Retrieved
from http://ageconsearch.umn.edu/bitstream/150229/2/policybrief25.pdf
Murage, A. W., Amudavi, D. M., Obare, G., Chianu, J., Midega, C. A. O., Pickett, J. A., &
Khan, Z. R. (2011). Determining smallholder farmers ’ preferences for technology
dissemination pathways : the case of “ push – pull ” technology in the control of stemborer
and Striga weeds in Kenya. International Journal of Pest Management, 57(2), 133–145.
http://doi.org/10.1080/09670874.2010.539715

Explaining the Perception of Smallholders Towards…
76
Oluoch-Kosura, W. A., Marenya, P. P., & Nzuma, M. J. (2001). Soil Fertility Management in
Maize-Based Production Systems in Kenya: Current Options and Future Strategies. In
Seventh Eastern and Southern Africa Regional Maize Conference (pp. 350–355).
Osgood, D., Mclaurin, M., Carriquiry, M., Mishra, A., Fiondella, F., Hansen, J., … Ward, N.
(2007). Designing Weather Insurance Contracts for Farmers in Malawi, Tanzania, and
Kenya. Final Report to the Commodity Risk Management Group, ARD, World Bank. New
York, USA.
Rosenzweig, M. R. (1988). Labor markets in low-income countries. In H. Chenery & T. N.
Srinivasan (Eds.), Handbook of Development Economics (Vol. 1, pp. 713–762).
Amsterdam, North Holland. http://doi.org/10.1016/S1573-4471(88)01018-6
Rosenzweig, M. R., & Binswanger, H. P. (1993). Wealth, Weather Risk and the Composition
and Profitability of Agricultural Investments. The Economic Journal, 103(416), 56–78.
http://doi.org/10.2307/2234337
Sakurai, T., & Reardon, T. (1997). Potential Demand for Drought Insurance in Burkina Faso
and Its Determinants. American Journal of Agricultural Economics, 79, 1193–1207.
Skees, J., Barnett, B., & Hartell, J. (2005). Innovations in Government Responses to
Catastrophic Risk Sharing for Agriculture in Developing Countries. In Innovations in
Agricultural Production Risk Management in Central America: Challenges and
Opportunities to Reach the Rural Poor, May 9-12 (pp. 0–25). Antigua, Guatemala.
Skees, J., Gober, S., & Varangis, P. (2001). Developing Rainfall-Based Index Insurance in
Morocco. Policy Research Working Paper. Washington, D.C.
Skees, J., Hazell, P., & Miranda, M. (1999). New Approaches to Crop Yield Insurance in
Developing Countries. EPTD Discussion Paper No. 55. Washington, D.C.
Skees, J. R. (2000). A role for capital markets in natural disasters: A piece of the food security
puzzle. Food Policy, 25(3), 365–378. http://doi.org/10.1016/S0306-9192(00)00012-9
Skees, J. R. (2008). Innovations in Index Insurance for the Poor in Lower Income Countries.
Agricultural and Resource Economics Review, 37(1), 1–15.
Skees, J. R., & Enkh-Amgalan, A. (2002). Examining the Feasibility of Livestock Insurance
in Mongolia (No. 2886). Policy Research Working Paper.
Skees, J., Varangis, P., Larson, D., & Siegel, P. (2005). Can Financial Markets be Tapped to
Help Poor People Cope with Weather Risks? In S. Dercon (Ed.), Insurance Against
Poverty. Oxford: Oxford University Press. http://doi.org/10.1093/0199276838.003.0019
Smith, V. H., & Baquet, A. E. (1996). The Demand for Multiple Peril Crop Insurance :
Evidence from Montana Wheat Farms. American Journal of Agricultural Economics, 78,
189–201.
Staal, S. J., Baltenweck, I., Njoroge, L., Patil, B. R., Ibrahim, M. N. M., & Kariuki, E. (2006).
Smallholder dairy farmer access to alternative milk market channels in Gujarat. In The
26th Conference of the International Association of Agricultural Economists. Brisbane,
Australia.
Tangka, F. K., Jabbar, M. A., & Shapiro, B. I. (2000). Gender roles and child nutrition in
livestock production systems in developing countries: A critical review. Socio-economics
and Policy Research Working Paper 27. Nairobi, Kenya. Retrieved from
http://ageconsearch.umn.edu/bitstream/182898/2/2000-Gender and LivestockFlorence-
WP27.pdf
Townsend, R. M. (1994). Risk and Insurance in Village India. Econometrica, 62(3), 539–591.
Turvey, C. G. (2001). Weather Derivatives for Specific Event Risks in Agriculture. Review of
Agricultural Economics, 23(2), 333–351.
Varangis, P., Skees, J., & Barnett, B. (2002). Weather Indexes for Developing Countries. In
S. Dischel (Ed.), Climate Risk and the Weather market: Financial Risk management and
Weather Hedge (pp. 279–294). London: Risk Books, Risk Water Group, Ltd.
H. N. Isaboke, Z. Qiao, W.N. Nyarindo , W. Ke
77
Vaughan, E. J., & Vaughan, T. M. (2014). Fundamentals of Risk and Insurance (11th ed.).
U.S.A: John Wiley & Sons.
Velandia, M., Rejesus, R. M., Knight, T. O., & Sherrick, B. J. (2009). Factors Affecting
Farmers ’ Utilization of Agricultural Risk Management Tools : The Case of Crop
Insurance , Forward Contracting , and Spreading Sales. Journal of Agricultural and
Applied Economic, 41(1), 107–123.
Verbeek, M. (2004). A Guide to Modern Econometrics (2nd ed.). England: John Wiley &
Sons Ltd.
Winship, C., & Mare, R. D. (1984). Regression Models With Ordinal Variables. American
Sociological Review, 49, 512–525.
World Bank. (2011). Weather Index Insurance for Agriculture: Guidance for Development
Practitioners: Agriculture and Rural Development Discussion Paper 50. Washington,
DC: World Bank.
Zimmerman, F. J., & Carter, M. R. (2003). Asset smoothing, consumption smoothing and the
reproduction of inequality under risk and subsistence constraints. Journal of Development
Economics, 71(2), 233–260. http://doi.org/10.1016/S0304-3878(03)00028-2


