i
Research Report
EXPERIMENTAL TESTING AND DESIGN EVALUATION OF PRECAST THREE SIDED
ARCH BRIDGES
Submitted to
Foley Products
Prepared by
Justin D. Marshall
J. Brian Anderson
R. Luke Meadows
T. Jared Jensen
JULY 2012
SAMUEL GTNN COLLEGE OF ENGINEERING
Highway R esearch Center Harbert Engineering Center
Auburn, Alabama 36849
www. eng. auburn. edu/research/centers /hrc. html
i
DISCLAIMERS
The contents of this report reflect the views of the authors, who are responsible for the facts and
the accuracy of the data presented herein. The contents do not necessarily reflect the official
views or policies of Auburn University or the Federal Highway Administration. This report does
not constitute a standard, specification, or regulation.
NOT INTENDED FOR CONSTRUCTION, BIDDING, OR PERMIT PURPOSES
Justin D. Marshall, Ph.D., P.E.
J. Brian Anderson, Ph.D., P.E.
Research Supervisors

ii
ABSTRACT
The use of precast, three-sided arch culverts has become fairly popular for new short-
span bridges and bridge replacements due to their rapid construction time, aesthetic appeal, and
minimal impact to the waterway, but little research has been performed into the strength of these
structures. It has been thought that, due to arching action, large lateral earth pressures can be
developed in the backfill behind the legs, and that these pressures allow the bridge to achieve
strengths much larger than possible without the confinement of the backfill soil. The research
detailed in this report sought verify the behavior of this bridge system through field testing of an
existing bridge, as well as two ultimate load tests on individual bridge units. Nonlinear numerical
models of the bridge sections were calibrated with the results from the laboratory experimental
tests and used to evaluate the design procedure and safety of the arch bridge sections.
It was concluded that the test bridges were too stiff to cause enough lateral deflection to
mobilize passive earth pressures in the backfill, and the earth pressures had a minimal effect.
The bridges reached the expected strength although some issues with bridge performance were
discovered at ultimate loads. Although there were some discrepancies between the design
structural model and the calibrated structural model, the design methodology produced a safe
design with reasonable conservatism.
iii
TABLE OF CONTENTS
LIST OF TABLES ..…………………..………………..………………………………………………… v
LIST OF FIGURES …………………………………….……………………………………………….. vi
CHAPTER 1: INTRODUCTION ……..………………..………………………………………………….1
1.1 Overview …………………..………………………………………………………………..1
1.2 Project Purpose and Scope ……………..………………………………………………..1
CHAPTER 2: FIELD TEST OF 42 FT SPAN ARCH ……..……………………………………….… 2
2.1 Introduction ……………………………………….…………………………………….…. 2
2.2 Instrumentation …………………………………….…………………………………...… 2
2.3 Testing Procedure ………………………………….……………………………....…….. 4
2.4 Analysis, Results and Discussion of Testing ………………………………………..…. 6
2.5 Chapter Summary ………………………………………………………………….......… 9
CHAPTER 3: LABORATORY TEST OF 20 FT SPAN ARCH……….……………..…………..… 10
3.1 Introduction…………………….…………………………………………………..……… 10
3.2 Instrumentation ……………………….……………….………………………………..… 12
3.3 Testing Setup and Equipment ………………………………….…….…………………. 13
3.4 Testing Procedure ……………………………………………………….……………….. 15
3.5 Analysis, Results and Discussion of Testing ……….…………………………………. 15
3.6 Observed Bridge Behavior and Failure ………….…….……………………………….. 18
3.7 Chapter Summary ………………………………….…………………………………….. 22
CHAPTER 4: LABORATORY TEST OF 36 FT SPAN ARCH …………………………………….. 23
4.1 Introduction ……………………………………………………………………………….. 23
4.2 Instrumentation and Setup …………………………………………………………...…. 26
4.3 Testing Procedure ……………………………………………………………………….. 27
4.4 Analysis Results and Discussion of Testing ………………………………………….. 27
4.5 Observed Bridge Behavior and Failure ………………………………………………... 31
4.6 Chapter Summary …………………………………………………………………..…… 35
CHAPTER 5: COMPUTER MODELING ……………………………………………………………. 36
5.1 Introduction ………………………………………………………………………………. 36
5.2 Model Development …………………………………………………………………….. 36
5.3 Nonlinear Analysis ………………………………………………………………………. 37
iv
5.4 Model Analysis Results …………………………………………………………………. 39
5.5 Chapter Summary ……………………………………………………………………….. 44
CHAPTER 6: DESIGN METHODOLOGY ………………………………………………………...… 45
6.1 Introduction ……………………………………………………………………………….. 45
6.2 Modeling and Analysis ……..……………………………………………………………. 45
6.3 Experimental Results Versus Design ………………………………………………….. 51
6.4 Chapter Summary ……………………………………………………………………….. 52
CHAPTER 7: SUMMARY, CONCLUSIONS AND RECOMMENDATIONS …………………….. 53
7.1 Summary …………………………………………………………………………………. 53
7.2 Conclusions ………………………………………………………………………………. 53
7.3 Recommendations ………………………………………………………………………. 54
REFERENCES …………………………………………………………………………………………. 56
v
LIST OF TABLES
Table 3-1 20 ft Bridge Unit Reinforcement Details (Foley Arch, 2010) ……………….…… 10
Table 4-1 36 ft Bridge Unit Reinforcement Details (Foley Arch, 2011) ……..……...……... 23
Table 6-1 Design Calculation Properties ………………………………...………………….… 48
Table 6-2 Comparison of RISA and SAP2000 Model Moments …………..………......…… 50
Table 6-3 Test Structure Midspan Properties ………………………………..……….………. 51
Table 6-4 Ratio of Design to Test/Model Specimen Properties …….………..…………….. 51
vi
LIST OF FIGURES
Figure 2-1 42 ft Bridge Structure …………………………………………………………………. 2
Figure 2-2 42 ft Bridge Unit Overall Dimensions (Foley Arch, 2010) ……………..………….. 3
Figure 2-3 Field Test Strain Gage Layout …………………………………………….…………. 4
Figure 2-4 Earth Pressure Cell Layout ………………………………………………………...… 4
Figure 2-5 Bridge Unit Layout ………………………………………………………………….…. 5
Figure 2-6 Live Load Testing ………………………………………………………………...…… 6
Figure 2-7 Cross Section Layout ……………………………………………….......………...….. 6
Figure 2-8 Moments due to Love Load Only Versus Time ……………………...…………….. 7
Figure 2-9 Live Load Moment Versus Rear Axle Location – Run 1 ……………….…………. 8
Figure 2-10 Lateral Earth Pressure due to Live Load Only Versus Time ……………….…….. 9
Figure 2-11 Live Load Lateral Earth Pressure Versus Rear Axle Location – Run 1 ……..….. 9
Figure 3-1 20 ft Bridge Unit Reinforcement Layout (Foley Arch, 2010) …………………….. 11
Figure 3-2 20 ft Cross Section Layout ………………………………………………………..… 12
Figure 3-3 20 ft Wirepot and Load Cell Layout ……………………………………………...… 13
Figure 3-4 Actuator Loading Frames …………………………………………………………… 13
Figure 3-5 Bridge Base Plate ……………………………….…………………………………… 14
Figure 3-6 Strain-Gaged Rods to Apply Additional Vertical Load ……………………….….. 14
Figure 3-7 Moment Versus Total Load – Second Ultimate Load Test ……………………… 16
Figure 3-8 Load Cell Reaction Versus Total Load – Second Ultimate Load Test ……….… 17
Figure 3-9 Deflection Versus Total Load – Second Ultimate Load Test ……………….…… 18
Figure 3-10 Corner Crack at 156 kip Total Load …………………………………………..…… 19
Figure 3-11 Corner Crack at 175 kip Total Load …………………………………………..…… 20
Figure 3-12 Corner Crack Immediately Prior to Failure ……………………………………….. 20
Figure 3-13 Failure Mechanism ………………………………………………………………….. 21
Figure 3-14 Failure Load Configuration …………………………………………………………. 21
Figure 3-15 Failed Bridge Section ……………………………………………………………….. 22
Figure 4-1 36 ft Bridge Unit Overall Dimensions (Foley Arch, 2011) ………………………. 24
Figure 4-2 36 ft Bridge Unit Reinforcement Layout (Foley Arch, 2011) ………….………… 25
Figure 4-3 36 ft Cross Section Locations ……………………………………………………… 26
Figure 4-4 36 ft Wirepot and Load Cell Layout ……………………………………………….. 27
Figure 4-5 Steel Reinforcement Testing Results …………………………………...………… 28
Figure 4-6 Moment Versus Load ……………………………………………………………….. 29
Figure 4-7 Load Cell Reaction Versus Load ……………………………………………..…… 30
vii
Figure 4-8 Deflection Versus Load ………………………………………………………...…… 31
Figure 4-9 Initial Spalling on Bridge Leg ……………………………………………………….. 32
Figure 4-10 Midspan Cracking – 120 kips Total Load …………………………………………. 32
Figure 4-11 Bridge Cracking Immediately Prior to Failure …………………………………….. 33
Figure 4-12 Bridge Section Immediately After Failure …………………………………………. 33
Figure 4-13 Failure Load Configuration …………………………………………….………...…. 34
Figure 4-14 Failure Through Lifter Location …………………………………….………………. 35
Figure 5-1 20 ft Clear Span – SAP2000 Elements ……………………………………………. 37
Figure 5-2 36 ft Clear Span – SAP2000 Elements ……………………………………………. 37
Figure 5-3 Hinge Locations and Labels – 20 ft Clear Span Model ……………………….…. 38
Figure 5-4 Hinge Locations and Lables – 36 ft Clear Span Model ………………………….. 39
Figure 5-5 Model Versus Laboratory Specimen – 20 ft Span Midspan Moment ………….. 40
Figure 5-6 Model Versus Laboratory Specimen – 20 ft Span Midspan Displacement …… 41
Figure 5-7 Model Versus Laboratory Specimen – 20 ft Span Corner Displacement ……… 41
Figure 5-8 Model Versus Laboratory Specimen – 36 ft Span Midspan Moment ………….. 42
Figure 5-9 Model Versus Laboratory Specimen – 36 ft Span Midspan Displacement ……. 43
Figure 5-10 Model Versus Laboratory Specimen – 36 ft Span Corner Moment ………...….. 43
Figure 6-1 Extruded View – 20 ft Span RISA Model ……………………………………..…… 46
Figure 6-2 Moment Diagram – 20ft Span RISA Model ……………………………………….. 46
Figure 6-3 Beam Elements – 36 ft Span RISA Model ……………………………………..…. 47
Figure 6-4 Moment Diagram – 36 ft Span RISA Model ………………………………………. 47
Figure 6-5 Moment Diagram of Factored Design Loads – 20 ft SAP2000 Model ………... 49
Figure 6-6 Moment Diagram of Factored Design Loads – 36 ft SAP2000 Model ………… 49

1
Chapter 1
INTRODUCTION
1.1 Overview
The use of precast, three-sided arch culverts has become fairly popular for new bridges and
bridge replacements, due to their rapid construction time, aesthetic appeal, and minimal impact to
the waterway. However, little research has been performed into the strength of these structures.
Foley Products contracted with Auburn University to investigate and demonstrate the strength of
arches that are currently produced and used for bridge applications.
1.2 Project Purpose and Scope
The objective of the project was to validate the strength and design methodology of the Foley
Arch bottomless bridge. Three experimental tests including a serviceability field test of a 42 ft
clear span and laboratory ultimate strength tests of 20 ft and 36 ft clear span sections were
completed. Data from the laboratory tests was used to develop analytical computer models. The
models were developed to the point that the analytical results were correlated to the results of the
laboratory test. The tests and structural computer models could then be used to validate the
design methodology used for the arches. This report presents the data from the three tests and
the analysis of the data and the design methodology used for the Foley Arch. This report
represents an abbreviated summary of the research. More detail on the research project can be
found in Meadows (2012) and Jensen (2012).
2
Chapter 2
FIELD TEST OF 42 FT SPAN ARCH
2.1 Introduction
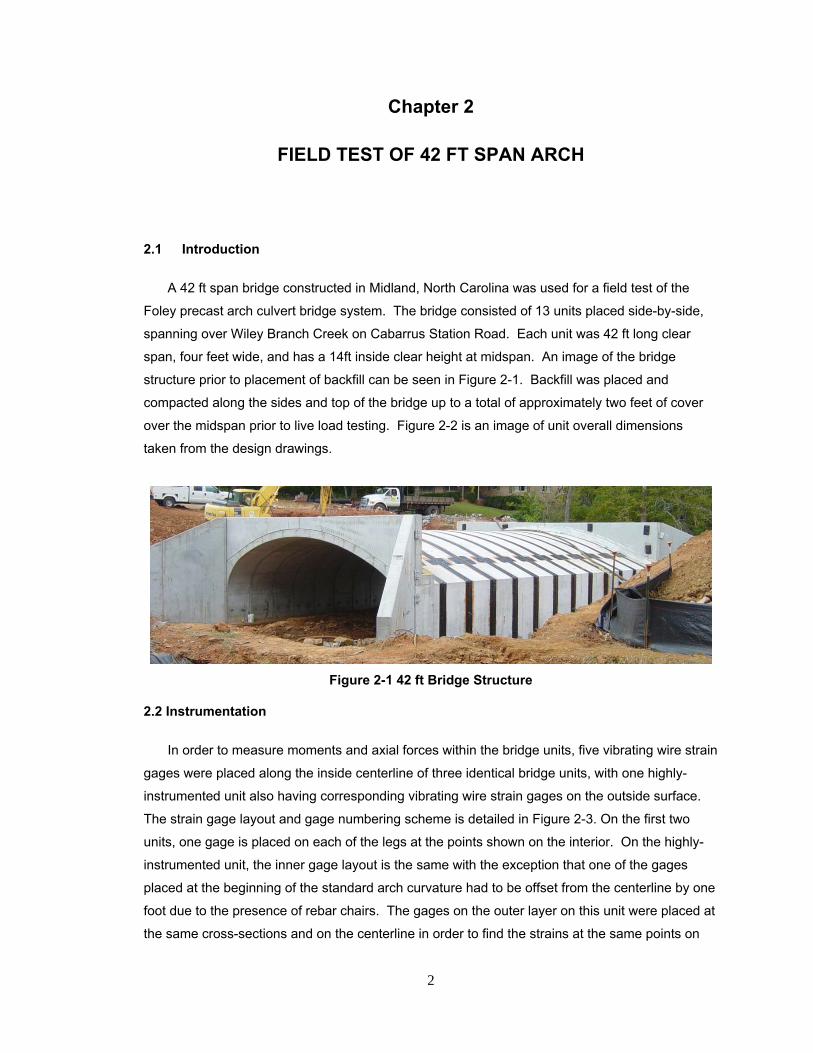
A 42 ft span bridge constructed in Midland, North Carolina was used for a field test of the
Foley precast arch culvert bridge system. The bridge consisted of 13 units placed side-by-side,
spanning over Wiley Branch Creek on Cabarrus Station Road. Each unit was 42 ft long clear
span, four feet wide, and has a 14ft inside clear height at midspan. An image of the bridge
structure prior to placement of backfill can be seen in Figure 2-1. Backfill was placed and
compacted along the sides and top of the bridge up to a total of approximately two feet of cover
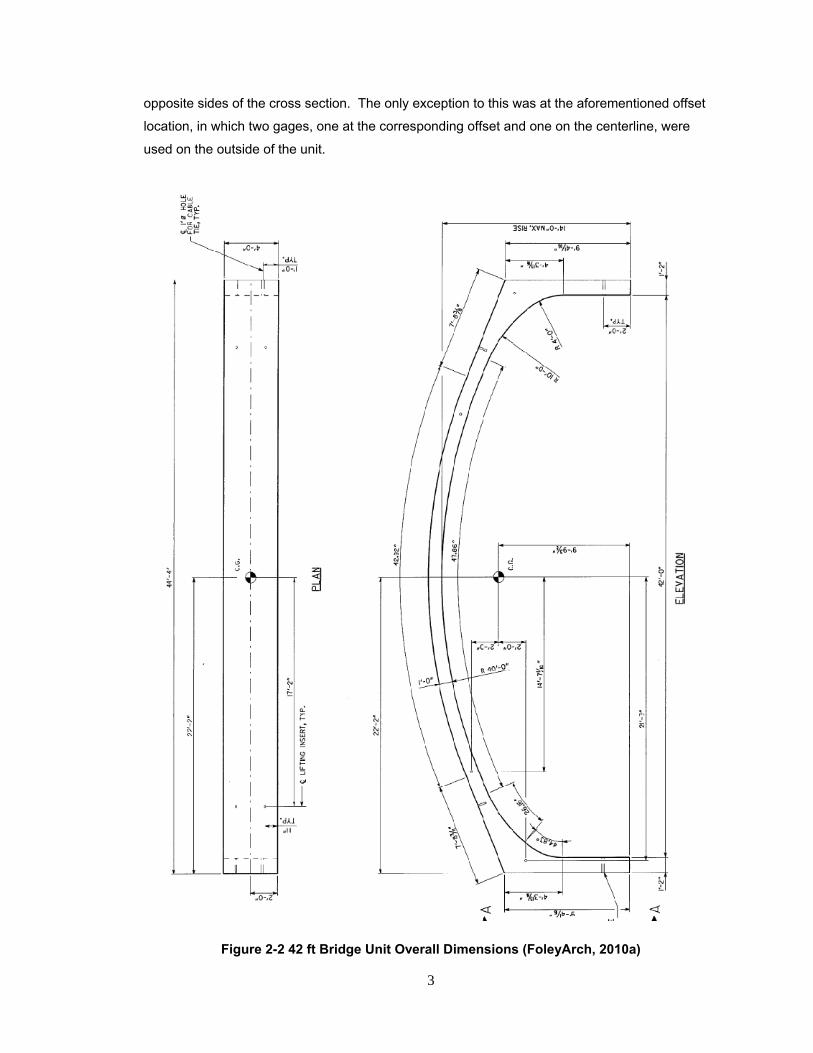
over the midspan prior to live load testing. Figure 2-2 is an image of unit overall dimensions
taken from the design drawings.
Figure 2-1 42 ft Bridge Structure
2.2 Instrumentation
In order to measure moments and axial forces within the bridge units, five vibrating wire strain
gages were placed along the inside centerline of three identical bridge units, with one highly-
instrumented unit also having corresponding vibrating wire strain gages on the outside surface.
The strain gage layout and gage numbering scheme is detailed in Figure 2-3. On the first two
units, one gage is placed on each of the legs at the points shown on the interior. On the highly-
instrumented unit, the inner gage layout is the same with the exception that one of the gages
placed at the beginning of the standard arch curvature had to be offset from the centerline by one
foot due to the presence of rebar chairs. The gages on the outer layer on this unit were placed at
the same cross-sections and on the centerline in order to find the strains at the same points on
3
opposite sides of the cross section. The only exception to this was at the aforementioned offset
location, in which two gages, one at the corresponding offset and one on the centerline, were
used on the outside of the unit.
Figure 2-2 42 ft Bridge Unit Overall Dimensions (FoleyArch, 2010a)
~ ~
, I ,
I I
I I
I ' I
I - - , ....
L J .. o-.z
<;' f::
'dAl
·"
3$11 'XYN .0-.•1
' < b I iii >
~, ~
~ i:, .. ~ N "' :g ~ ... ~
"
) ~ ,!.
<{ .. IJ.t, - Ji, •

4
Figure 2-3 Field Test Strain Gage Layout
In addition, two earth pressure cells (EPCs) were placed on each exterior leg of the highly-
instrumented unit, one near the bottom and one near the top. The exact layout of each EPC,
numbered 38 through 41, can be seen in Figure 2-4. The reason the EPC 39 is not as low as
EPC 41 is due to the presence of some backfill on that side when the pressure cells were
installed.
Figure 2-4 Earth Pressure Cell Layout
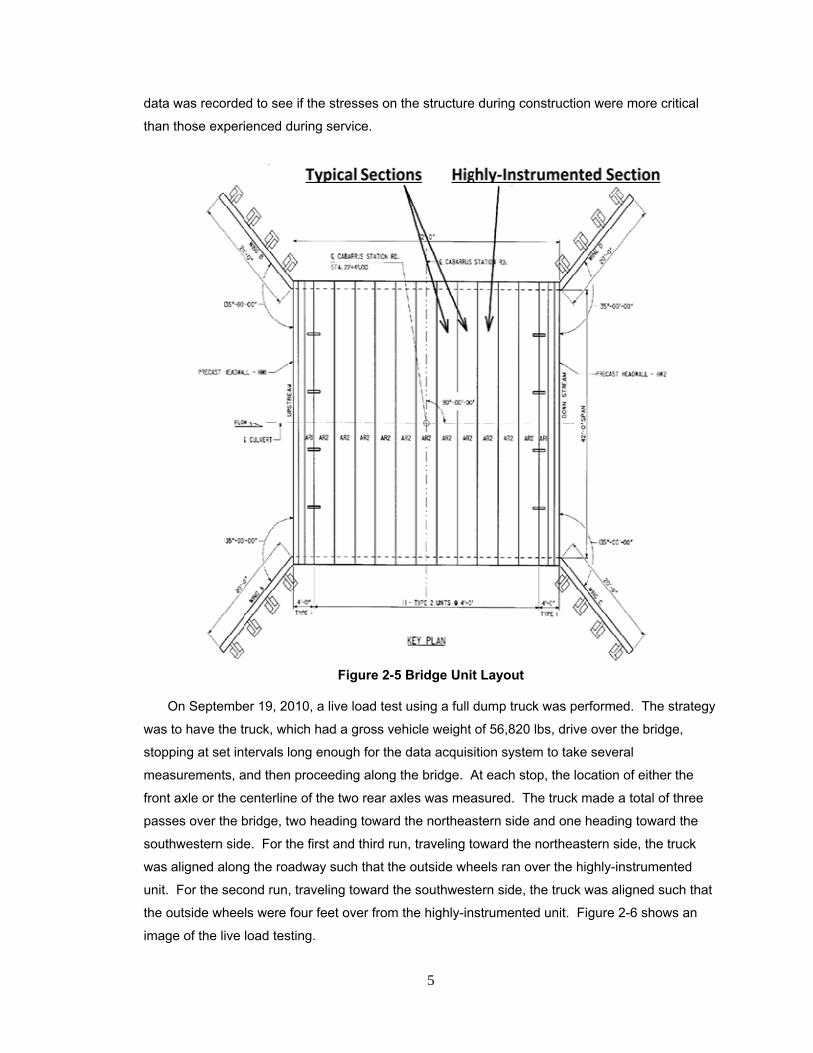
The three instrumented units were placed next to each other in order to better determine how
a vehicle load is spread through the backfill to the actual bridge units. The highly-instrumented
unit was placed furthest to the outside in order to maximize the effect of the live load in that unit.
This occurs because, when the live load is directly above it, there is less width of the bridge for
the live load to be distributed over. Figure 2-5 shows the layout of the three gaged units in the 13
unit bridge.
2.3 Testing Procedure
This section consists of the procedure used during testing. For this test, two sets of data
were recorded. The first set was recorded during the backfill process to measure construction
loads on the bridge. The second set was recorded during a live load test on the bridge after
backfilling.
On September 7, 2010, after the bridge units had been placed and grouted into the footings,
the strain gages and earth pressure cells were installed. Data was recorded with these
instruments over the next 12 days. During this time, backfill was placed around the legs and over
the top of the bridge using standard construction practices up to a total cover of two feet. This
Typical Unit
-;::::------6"1 ,~r
EPC 41
Highly-Instrumented Unit
Gage 8
Gage 4 (offset
Gage 5
------.::::::: i 1
ss 40.5"
EPC39
age 11
5
data was recorded to see if the stresses on the structure during construction were more critical
than those experienced during service.
Figure 2-5 Bridge Unit Layout
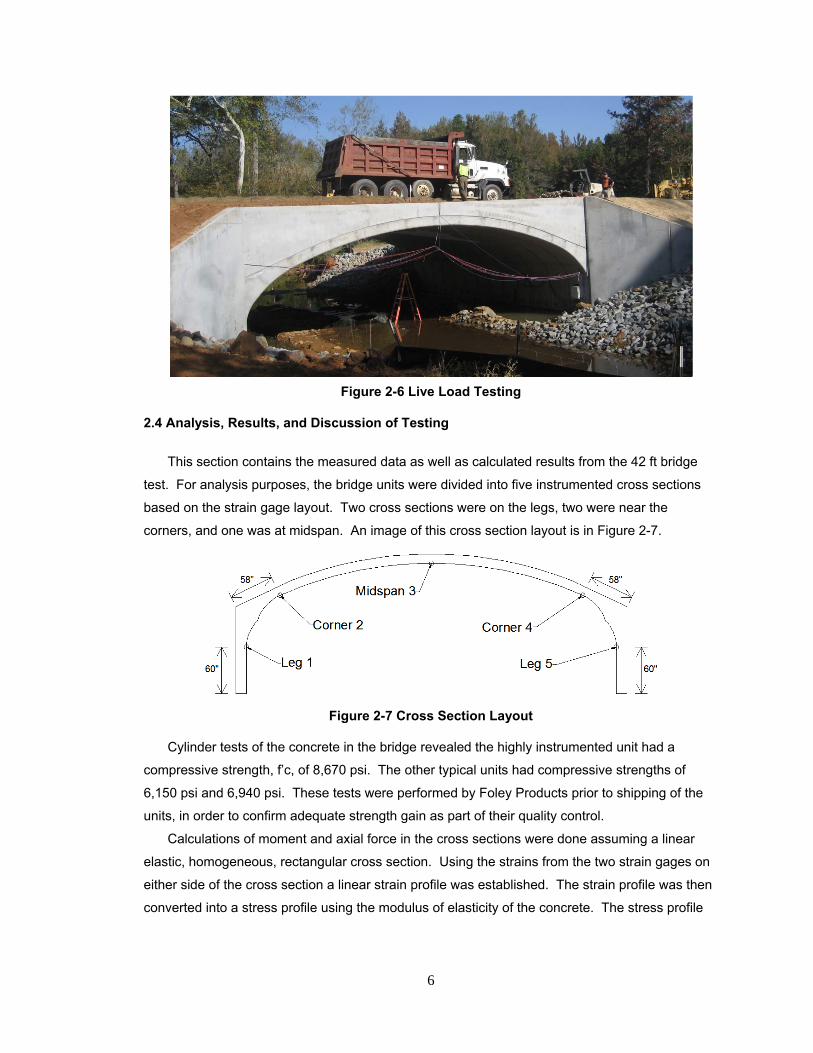
On September 19, 2010, a live load test using a full dump truck was performed. The strategy
was to have the truck, which had a gross vehicle weight of 56,820 lbs, drive over the bridge,
stopping at set intervals long enough for the data acquisition system to take several
measurements, and then proceeding along the bridge. At each stop, the location of either the
front axle or the centerline of the two rear axles was measured. The truck made a total of three
passes over the bridge, two heading toward the northeastern side and one heading toward the
southwestern side. For the first and third run, traveling toward the northeastern side, the truck
was aligned along the roadway such that the outside wheels ran over the highly-instrumented
unit. For the second run, traveling toward the southwestern side, the truck was aligned such that
the outside wheels were four feet over from the highly-instrumented unit. Figure 2-6 shows an
image of the live load testing.
I
' \: !Q'IJC'-:»'
~ \_ • ~ ~ ~ w ~ w ~ ~ ~ ~
I · m 2UtT$ 1 1'-<:'
N .
6
Figure 2-6 Live Load Testing
2.4 Analysis, Results, and Discussion of Testing
This section contains the measured data as well as calculated results from the 42 ft bridge
test. For analysis purposes, the bridge units were divided into five instrumented cross sections
based on the strain gage layout. Two cross sections were on the legs, two were near the
corners, and one was at midspan. An image of this cross section layout is in Figure 2-7.
Figure 2-7 Cross Section Layout
Cylinder tests of the concrete in the bridge revealed the highly instrumented unit had a
compressive strength, f’c, of 8,670 psi. The other typical units had compressive strengths of
6,150 psi and 6,940 psi. These tests were performed by Foley Products prior to shipping of the
units, in order to confirm adequate strength gain as part of their quality control.
Calculations of moment and axial force in the cross sections were done assuming a linear
elastic, homogeneous, rectangular cross section. Using the strains from the two strain gages on
either side of the cross section a linear strain profile was established. The strain profile was then
converted into a stress profile using the modulus of elasticity of the concrete. The stress profile
,.r Leg 1
Midspan 3
orner 2 Corner 4
Leg 5
7
was then turned into axial forces and moments using the cross sectional properties of the
concrete. Moments were based on the linear elastic behavior stress.
The magnitude of moments measured in the bridge units was as expected. Larger, positive
moments were measured at midspan, while smaller, negative moments were measured at the
corners and legs. Moments were calculated on a per foot width of bridge, as was done in design.
The maximum moment developed by the truck load was 10.5 kip-ft/ft at midspan when the rear
axles were centered over midspan. This compares favorably to the factored ultimate midspan
moment strength of 38 kip-ft/ft. As for the other cross sections, their maximum moments
occurred when the rear axles were centered seven to ten feet away from midspan. The
maximum moment due to the truck load was -6.5 kip-ft/ft for the corner gages and -5 kip-ft/ft for
the leg. It is of note to point out that the strains did not go above the theoretical concrete cracking
strain of 131 με, either during the backfill operation or during live load testing.
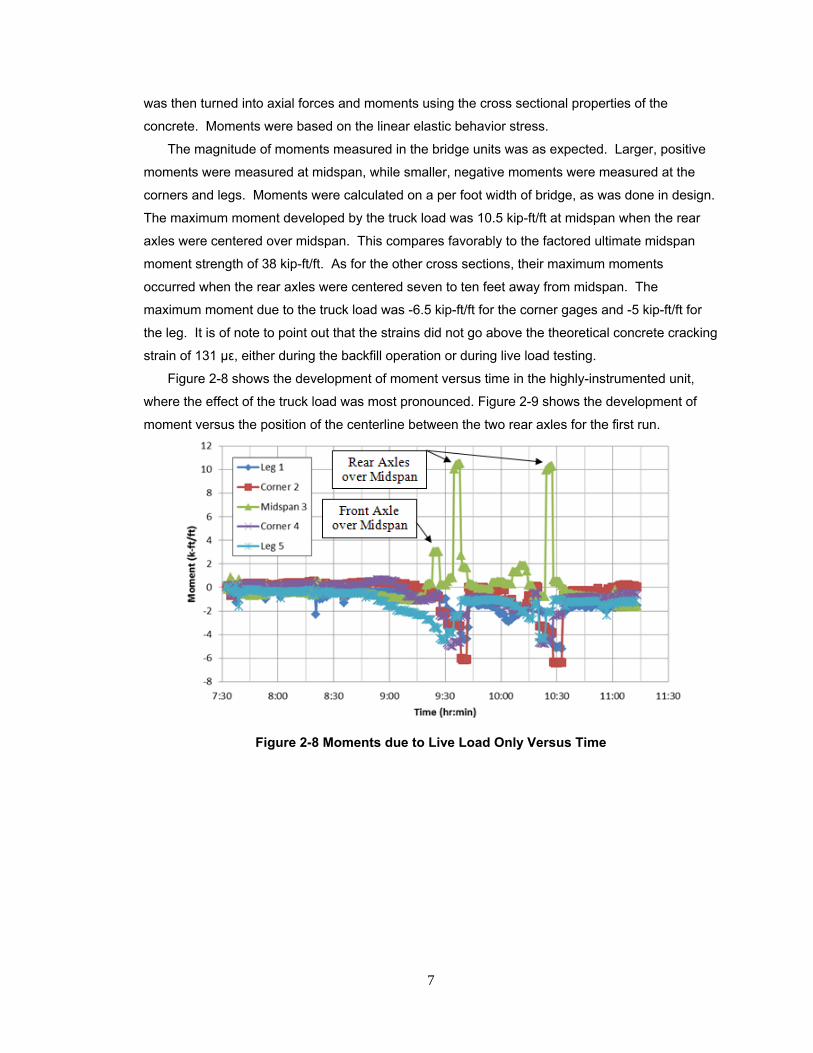
Figure 2-8 shows the development of moment versus time in the highly-instrumented unit,
where the effect of the truck load was most pronounced. Figure 2-9 shows the development of
moment versus the position of the centerline between the two rear axles for the first run.
Figure 2-8 Moments due to Live Load Only Versus Time
12 r-;=.=-=-=-::r.=-=-~~Ft~~~=rs~~==:i:==::-1--,-, Rear Axle.s 10 --Legl
8 -.corner 2
-..Midspan 3
- corner4
- Legs
over Midspan
Front Axle over Midspan
-8 ~-~-~--~~-~~---~-~-~-~-~---~---~
7:30 8:00 8:30 9:00 9:30
Time (h r:min)
10:00 10:30 11:00 11:30

8
Figure 2-9 Live Load Moment Versus Rear Axle Location - Run 1
Moment diagrams showed that for all measured cross sections, the maximum moment
occurred when the centerline of the two real axles was over or near midspan. Negative moments
in the legs and corners were not as large as the positive moment. The negative moments were
largest when the rear axle was near the quarter span.
Axial forces in the cross sections were found to be negligible. However, it is worth noting that
the presence of backfill around and above the bridge put all cross sections into a net
compression, which helped prevent the concrete from cracking.
Lateral earth pressures on the external walls developed as anticipated when the truck load
was applied to the bridge. As the truck load thrust the arch outward, larger lateral earth
pressures were measured at the top of the wall, while very small pressures were measured at the
bottom of the wall, indicating a “pinned” support condition, as opposed to a “roller” support
condition. Figure 2-10 shows how the earth pressures developed versus time during the live load
test in each EPC. Figure 2-11 shows the development of earth pressures versus the position of
the centerline between the two rear axles for each of the three test runs. This graph provides a
better illustration of the effect of the truck load as it passes over the bridge.
Lateral earth pressures that developed during the live load testing indicate that the largest
pressures are felt at the top of the wall, with very small or even no lateral earth pressure
developing near the bottom of the wall. This means that the grouted bottom of the bridge
behaved as a pin, with backfill acting as a distributed spring resistance to the lateral displacement
of the bridge. The largest measured earth pressures also occurred when the centerline of the two
rear axles was over midspan.
i ,!, ~
C • ~ :i
12
10 . '--6
4
2
0
-2 .. ~ ..
"'°
Front A.sle
over Midspan
-30 -20 -10 0 10
RHr ald• lou,tlon from mld,pan (tt)
-+-Leg 1
~ Corner2 , ....,_Midspan )
r -corner4
H
30 40

9
Figure 2-10 Lateral Earth Pressure due to Live Load Only Versus Time
Figure 2-11 Live Load Lateral Earth Pressure Versus Rear Axle Location - Run 1
2.5 Chapter Summary
The 42 ft bridge behaved exceptionally well and was very stiff. Measurements taken during
the backfill operation indicated that no cracking occurred during construction, and that the
presence of backfill creates a net compression in the bridge. Under a live load test using a truck
weighing 56,820lbs, the bridge showed no signs of cracking. Measured moment magnitudes
were within reason, and relatively small lateral earth pressures were recorded. Pinned support
behavior at the keyed footings was verified by the negligible mobilization of lateral earth
pressures near the bottom of the bridge.
C "' ~ GI ~
21 GI .. Q.
0 .8
0 .7
0 .6
o.s
0 .4
0.3
0 .2
0 .1
0
-0.1
7 Rear Axles ov er :Midspan
7:30
,. =-QI :; ~ QI
it
~ EPC38
1-,.-----------a-EPC39
EPC 40
- EPC 41 H --+---+--+-.-i~ ~--+--+4W.. t---+--t---+---i
0 .8
0 .7
0 .6
0.5
0.4
0 .3
0 .2
0 .1
0
-0 .1
-0 .2
8:00 8:30 9:00 9:30
Time [hr:mln)
10:00 10:30
....-t PL 40 l----+----+---F--+ ..... F---+-....... .----"-1----+----j
~ EPC41
-40 -30 -20 -10 0 10 20 30
Rear axle location from midspan (ft)
11:(Xl 11:30
40
10
Chapter 3
LABORATORY TEST OF 20 FT SPAN ARCH
3.1 Introduction
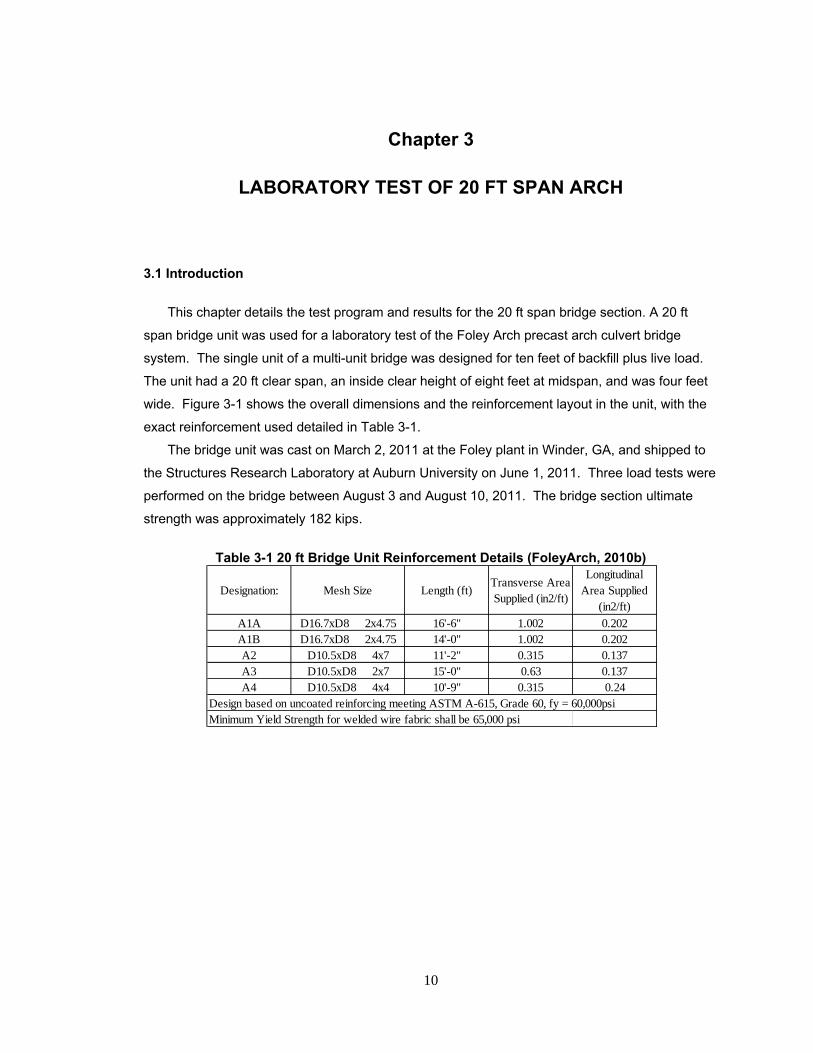
This chapter details the test program and results for the 20 ft span bridge section. A 20 ft
span bridge unit was used for a laboratory test of the Foley Arch precast arch culvert bridge
system. The single unit of a multi-unit bridge was designed for ten feet of backfill plus live load.
The unit had a 20 ft clear span, an inside clear height of eight feet at midspan, and was four feet
wide. Figure 3-1 shows the overall dimensions and the reinforcement layout in the unit, with the
exact reinforcement used detailed in Table 3-1.
The bridge unit was cast on March 2, 2011 at the Foley plant in Winder, GA, and shipped to
the Structures Research Laboratory at Auburn University on June 1, 2011. Three load tests were
performed on the bridge between August 3 and August 10, 2011. The bridge section ultimate
strength was approximately 182 kips.
Table 3-1 20 ft Bridge Unit Reinforcement Details (FoleyArch, 2010b)
Designation: Mesh Size Length (ft)Transverse Area Supplied (in2/ft)
Longitudinal Area Supplied
(in2/ft)
A1A D16.7xD8 2x4.75 16'-6" 1.002 0.202A1B D16.7xD8 2x4.75 14'-0" 1.002 0.202A2 D10.5xD8 4x7 11'-2" 0.315 0.137A3 D10.5xD8 2x7 15'-0" 0.63 0.137A4 D10.5xD8 4x4 10'-9" 0.315 0.24
Design based on uncoated reinforcing meeting ASTM A-615, Grade 60, fy = 60,000psiMinimum Yield Strength for welded wire fabric shall be 65,000 psi

11
Fig
ure 3-1 20 ft B
ridg
e Un
it Rein
forcem
ent L
ayo
ut (F
ole
yArch
, 2010b)
z . 0 7
"' A2
10 ·
21·-a·
10'- 9""
16 '· 6"
Z0'·O"SFAN
TYPICAL ELEVATION
A?
l'/2"CLR. ~
10·
vf-"' ' U)
2"CLR, ~
~ g; x < :Ii
0 ' ~
12
3.2 Instrumentation
The 20 ft clear span bridge unit was initially instrumented with 15 sister bar strain gages, ten
concrete surface strain gages, three displacement potentiometers, or wirepots, and four load
cells. Two additional wirepots were added following the preliminary testing.
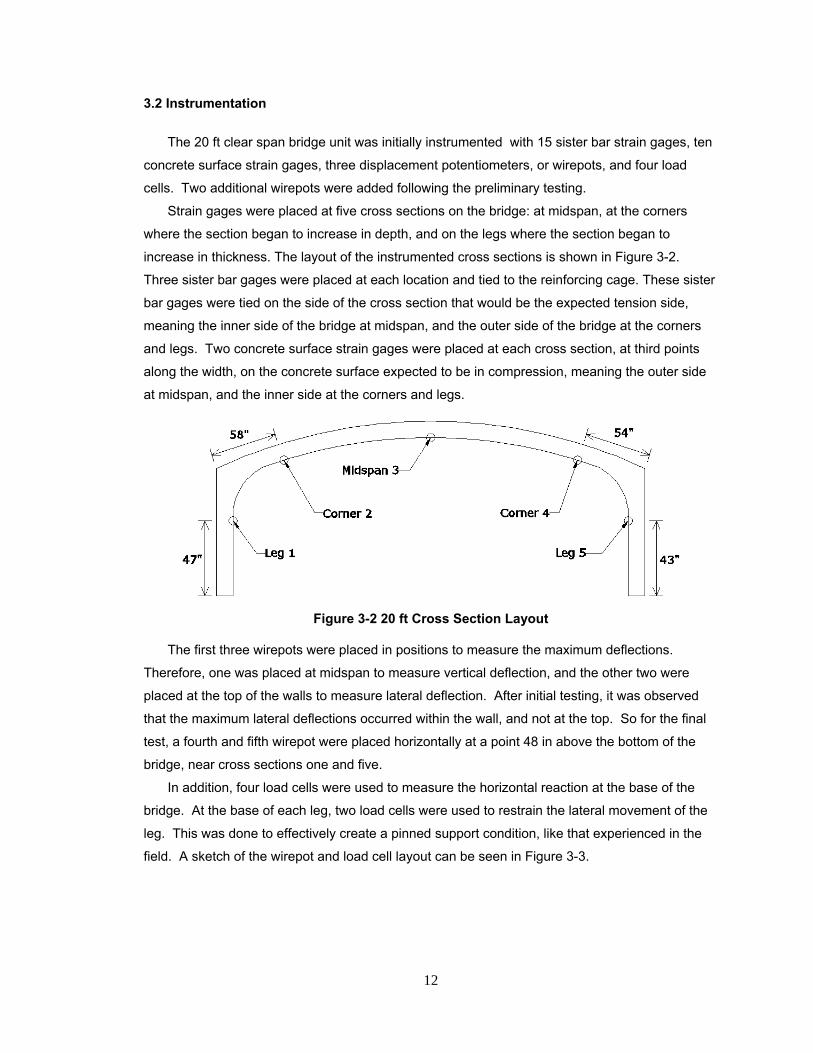
Strain gages were placed at five cross sections on the bridge: at midspan, at the corners
where the section began to increase in depth, and on the legs where the section began to
increase in thickness. The layout of the instrumented cross sections is shown in Figure 3-2.
Three sister bar gages were placed at each location and tied to the reinforcing cage. These sister
bar gages were tied on the side of the cross section that would be the expected tension side,
meaning the inner side of the bridge at midspan, and the outer side of the bridge at the corners
and legs. Two concrete surface strain gages were placed at each cross section, at third points
along the width, on the concrete surface expected to be in compression, meaning the outer side
at midspan, and the inner side at the corners and legs.
Figure 3-2 20 ft Cross Section Layout
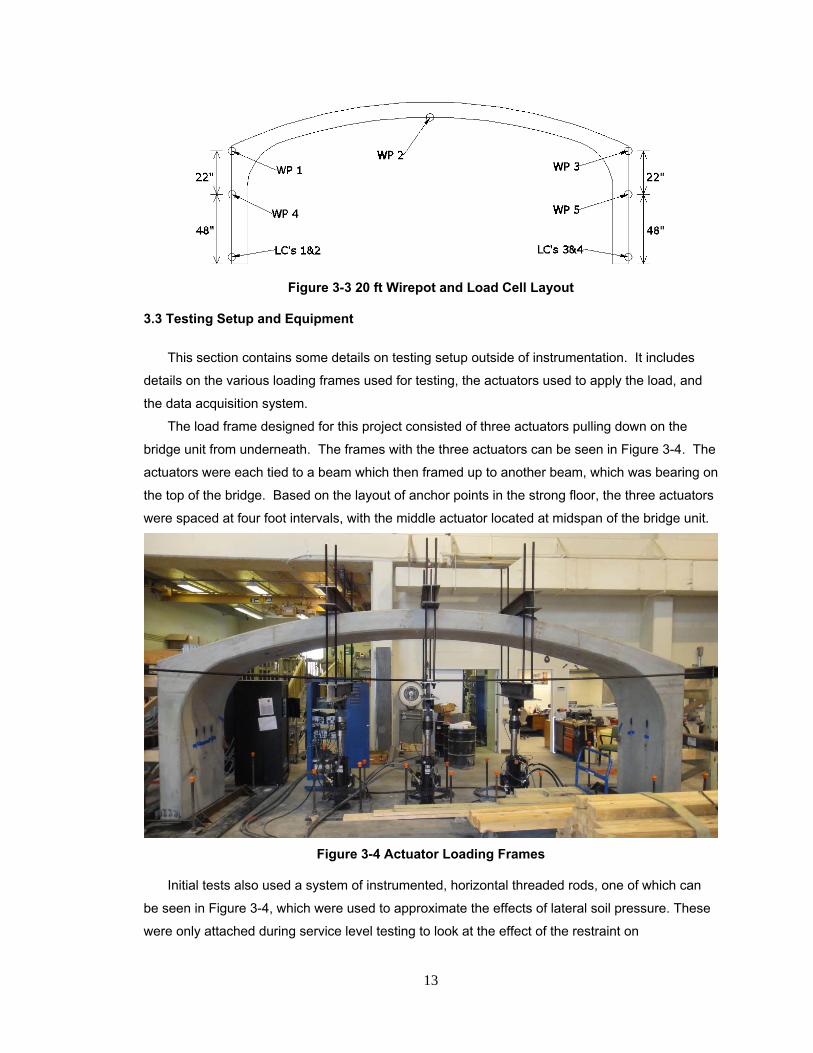
The first three wirepots were placed in positions to measure the maximum deflections.
Therefore, one was placed at midspan to measure vertical deflection, and the other two were
placed at the top of the walls to measure lateral deflection. After initial testing, it was observed
that the maximum lateral deflections occurred within the wall, and not at the top. So for the final
test, a fourth and fifth wirepot were placed horizontally at a point 48 in above the bottom of the
bridge, near cross sections one and five.
In addition, four load cells were used to measure the horizontal reaction at the base of the
bridge. At the base of each leg, two load cells were used to restrain the lateral movement of the
leg. This was done to effectively create a pinned support condition, like that experienced in the
field. A sketch of the wirepot and load cell layout can be seen in Figure 3-3.
Midspan
orner 2 comer4
gl Leg
13
Figure 3-3 20 ft Wirepot and Load Cell Layout
3.3 Testing Setup and Equipment
This section contains some details on testing setup outside of instrumentation. It includes
details on the various loading frames used for testing, the actuators used to apply the load, and
the data acquisition system.
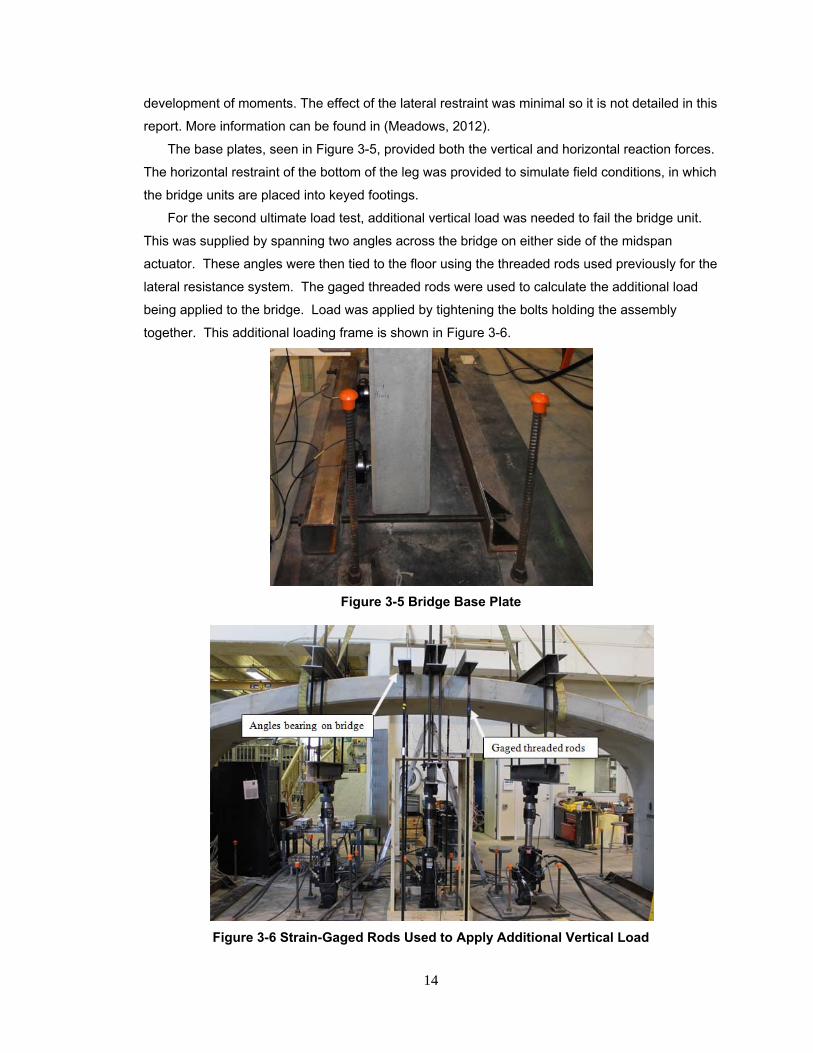
The load frame designed for this project consisted of three actuators pulling down on the
bridge unit from underneath. The frames with the three actuators can be seen in Figure 3-4. The
actuators were each tied to a beam which then framed up to another beam, which was bearing on
the top of the bridge. Based on the layout of anchor points in the strong floor, the three actuators
were spaced at four foot intervals, with the middle actuator located at midspan of the bridge unit.
Figure 3-4 Actuator Loading Frames
Initial tests also used a system of instrumented, horizontal threaded rods, one of which can
be seen in Figure 3-4, which were used to approximate the effects of lateral soil pressure. These
were only attached during service level testing to look at the effect of the restraint on
WP2
14
development of moments. The effect of the lateral restraint was minimal so it is not detailed in this
report. More information can be found in (Meadows, 2012).
The base plates, seen in Figure 3-5, provided both the vertical and horizontal reaction forces.
The horizontal restraint of the bottom of the leg was provided to simulate field conditions, in which
the bridge units are placed into keyed footings.
For the second ultimate load test, additional vertical load was needed to fail the bridge unit.
This was supplied by spanning two angles across the bridge on either side of the midspan
actuator. These angles were then tied to the floor using the threaded rods used previously for the
lateral resistance system. The gaged threaded rods were used to calculate the additional load
being applied to the bridge. Load was applied by tightening the bolts holding the assembly
together. This additional loading frame is shown in Figure 3-6.
Figure 3-5 Bridge Base Plate
Figure 3-6 Strain-Gaged Rods Used to Apply Additional Vertical Load
15
3.4 Testing Procedure
This section consists of the procedure used during testing. For this bridge unit, three
separate tests were performed. The first test was a service level test using the lateral resistance
frame. The second test was an ultimate strength test without the lateral resistance frame. After
being unable to achieve the ultimate load, a third test was needed. The third test was another
ultimate strength test using additional vertical loading. The second ultimate test provided the
greatest amount of information on performance of the bridge, so it will be the only test presented
in this report. More details on the service level and first ultimate test can be found in (Meadows,
2012). The service level test demonstrated that the horizontal restraint has little effect on the
service level performance of the bridge section. The first ultimate test demonstrated that the initial
estimates of strength were too low as the three actuators reached capacity without failing the
bridge.
On August 10, 2011, the second ultimate level load test was performed. This test was
performed using the actuators as well as the additional vertical loading frame consisting of angles
and instrumented threaded rods. Two additional displacement wirepots were added at a height of
48 in on the side walls of the bridge unit in order to measure the horizontal displacement. Load
was applied by pulling down on the actuators, followed by tightening the threaded rods.
Eventually, the bridge failed at an approximate total load of 182 kips.
3.5 Analysis, Results, and Discussion of Testing
This section contains the measured data as well as calculated results from the 20 ft bridge
test. For analysis purposes, the bridge is divided into five instrumented cross sections based on
the strain gage layout. Two cross sections are on the legs, two are near the corners, and one is at
midspan. The cross sections are the same as those in Figure 3-3.
Cylinder tests revealed the concrete to have a compressive strength, f’c, of 12,500 psi.
Modulus of elasticity tests show the concrete to have a modulus, Ec, of 5,950 ksi. This
compressive strength value is quite high. Typical 28-day compressive strength values are 6,000
psi to 7,000 psi. The high compressive strength value is a function of the fast setting concrete
used for this precast unit.
Strains at the same location within each cross section were approximately equal, meaning
sister bar strain gages agreed with each other and with concrete surface strain gages. This
observation indicated two very important things. First, load testing did not cause any torque in
the bridge. Second, the strain gages were functioning properly. In addition to the two sister bar
strain gages that were faulty after casting of the bridge, two other gages malfunctioned during the
course of the three tests. In such cases, those particular strain gages were neglected. At all
cross sections, at least one sister bar strain gage measured properly.

16
Very small strains were measured at the corner cross sections, locations two and four. In
some cases these cross sections measured strains opposite the anticipated sign, for example,
concrete gages in tension. It was determined that the location of these gages was further out on
the arch than intended, near the inflection points rather than at the points of maximum negative
moment.
Using the strains measured on the concrete compressive surface and within the cross section
near the steel, moments and axial forces were calculated. More detail on the calculation of
moments and axial forces can be found in Meadows (2012) as these assumptions and methods
are beyond the scope of this abbreviated report.
It was found that cross sections two and four were placed near the inflection point. They
therefore experienced relatively low strains and curvature opposite of what was expected. For
these sections, an analysis similar to what was used on the 42 ft field test was used.
Moments in the five cross sections during the second ultimate load test are shown in Figure
3-7. Note that the sign associated with the moment is relative to the position of the concrete and
sister bar strain gages. Therefore a positive sign means that the moment is such that tension is
in the sister bars and compression is in the concrete surface gages. The axial forces determined
from the tests were much higher than expected and were also very sensitive to assumptions
made during the analysis. Even though the forces were calculated to be much higher than
expected the magnitude of the forces did not affect performance and are not reported.
Figure 3-7 Moment Versus Total Load - Second Ultimate Load Test
Load cell reactions at the base of the bridge legs during the second ultimate load test are
shown in Figure 3-8. The forces in the load cells are small compared to the total load on the
bridge. This is due to the horizontal friction force between the baseplate and the bridge. In
addition to providing the vertical support of the legs, the bearing surface of the concrete bridge on
500 450 .
• Leg 1 400
350 • Corne r 2
? 300
::. 250 ....
200 C GJ E 150 0 :i!: 100
50 0
-50
-100 0 20 40 60 80 100 120 140 160 180 200
Total Load (k}
17
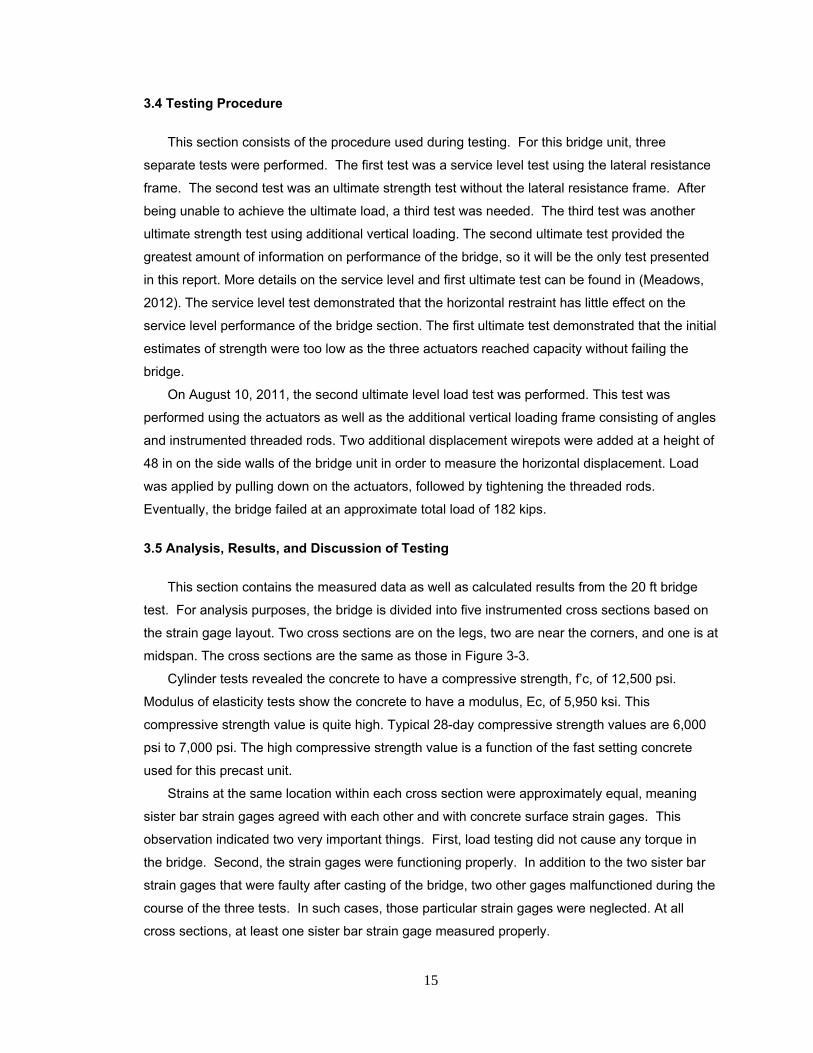
the steel baseplate resists the bridge legs sliding outward through friction. Therefore, a smaller
portion of the horizontal reaction goes into the load cells.
Figure 3-8 Load Cell Reaction - Second Ultimate Load Test
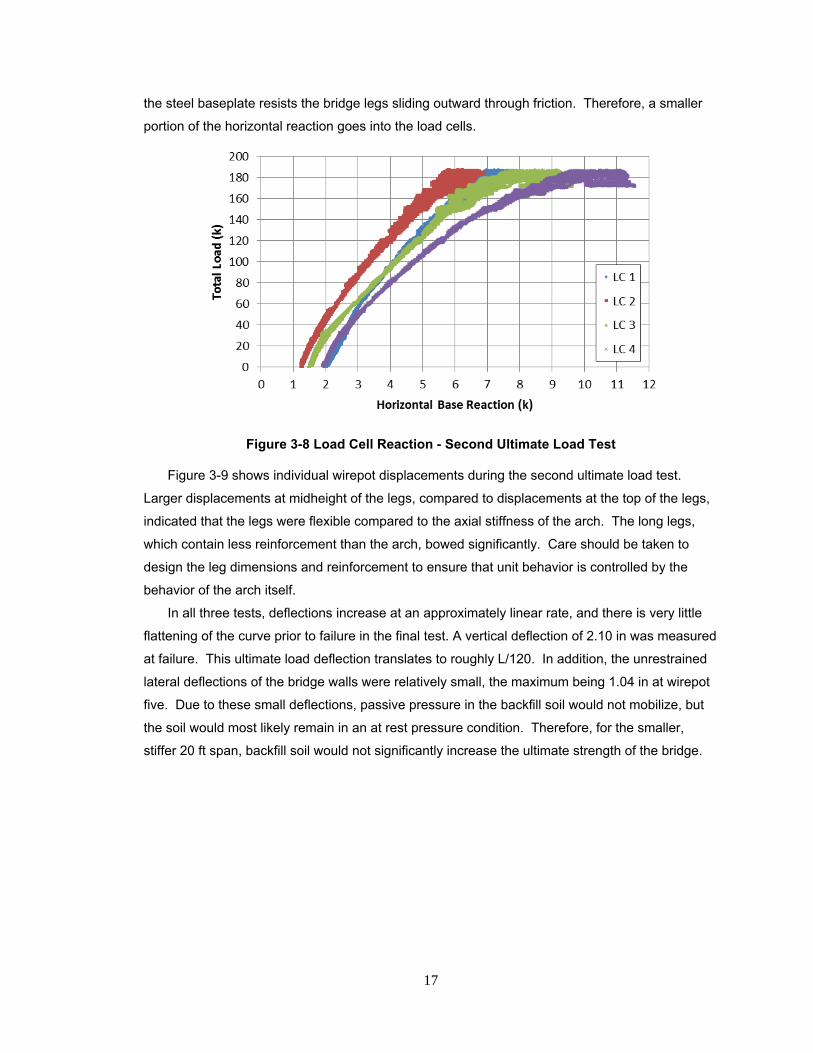
Figure 3-9 shows individual wirepot displacements during the second ultimate load test.
Larger displacements at midheight of the legs, compared to displacements at the top of the legs,
indicated that the legs were flexible compared to the axial stiffness of the arch. The long legs,
which contain less reinforcement than the arch, bowed significantly. Care should be taken to
design the leg dimensions and reinforcement to ensure that unit behavior is controlled by the
behavior of the arch itself.
In all three tests, deflections increase at an approximately linear rate, and there is very little
flattening of the curve prior to failure in the final test. A vertical deflection of 2.10 in was measured
at failure. This ultimate load deflection translates to roughly L/120. In addition, the unrestrained
lateral deflections of the bridge walls were relatively small, the maximum being 1.04 in at wirepot
five. Due to these small deflections, passive pressure in the backfill soil would not mobilize, but
the soil would most likely remain in an at rest pressure condition. Therefore, for the smaller,
stiffer 20 ft span, backfill soil would not significantly increase the ultimate strength of the bridge.
200
180
160
140 ~ ;' 120
!'Cl _g 100 iii 80 ~
60
40
20
0 0 1 2 3 4 5 6 7 8 9 10 11 12
Horizontal Base Reaction (k)
18
Figure 3-9 Deflection Versus Total Load - Second Ultimate Load Test
3.6 Observed Bridge Behavior and Failure
Initial cracking was observed around 48 kips total load, with many thin cracks opening in the
high moment areas. The initial cracking took place during the service load test was distributed in
all the high moment regions of the bridge section. However, these flexural cracks did not
significantly propagate or widen throughout testing, because the bridge redistributed the load to
the uncracked concrete. Furthermore, the lack of crack widening indicates that the reinforcement
did not yield . More hairline cracks appeared as testing progressed, but crack sizes did not
become significant until near ultimate loading.
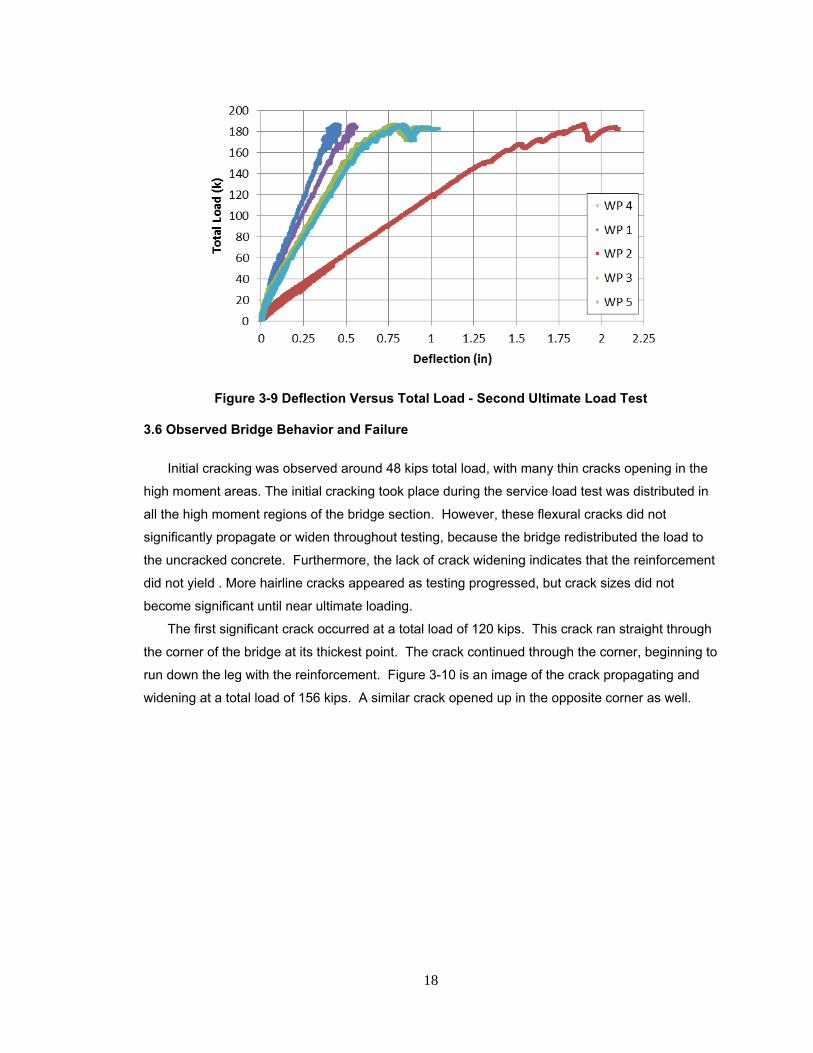
The first significant crack occurred at a total load of 120 kips. This crack ran straight through
the corner of the bridge at its thickest point. The crack continued through the corner, beginning to
run down the leg with the reinforcement. Figure 3-10 is an image of the crack propagating and
widening at a total load of 156 kips. A similar crack opened up in the opposite corner as well.
200
180
160
~ 140
:; 120
"' _g 100 iii 80 ~
60
40
20
0 0 0.25 0.5 0.75 1 1.25
Deflection (in)
1.5 1.75 2 2.25
19
Figure 3-10 Corner Crack at 156 kips Total Load
The critical shear crack that would eventually be the failure mechanism did not appear until
approximately 175 kips of total load. This crack was a shear crack running through the arch close
to the corner of the bridge. Figures 3-11 – 3-13 show the crack forming, widening immediately
prior to failure, and the failure mechanism.
, ,
\
\ {

20
Figure 3-11 Corner Crack at 175 kip Total Load
Figure 3-12 Corner Crack Immediately Prior to Failure
21
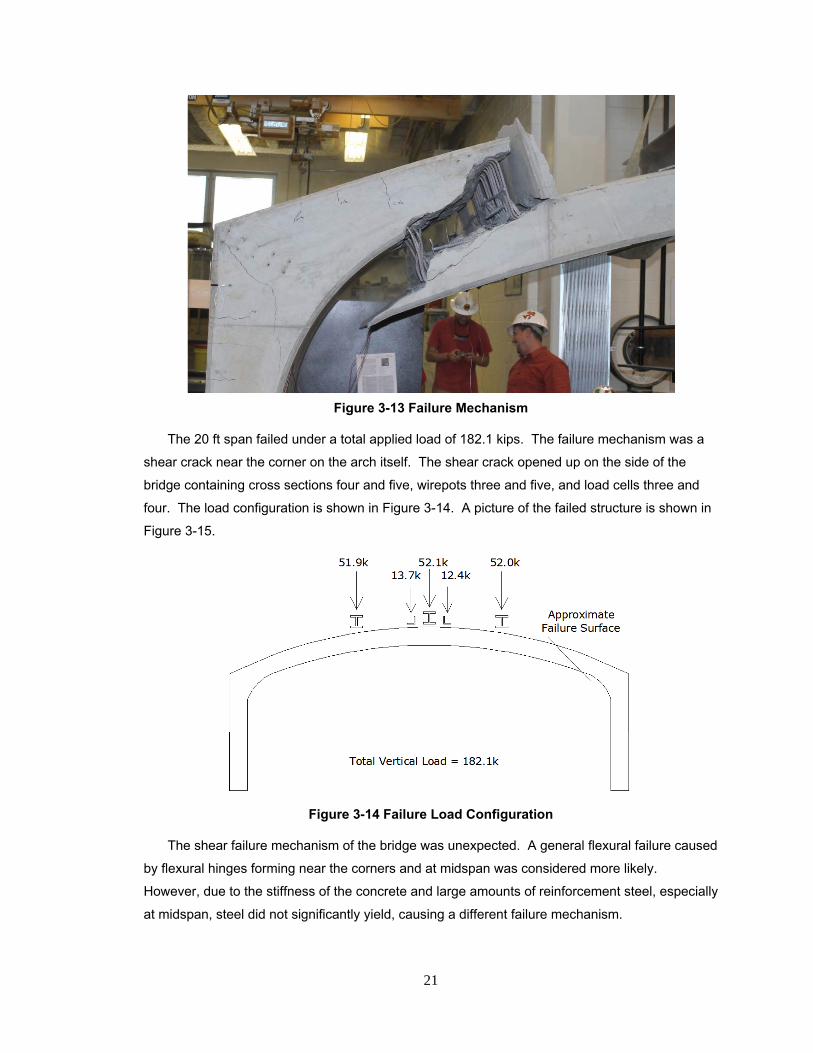
Figure 3-13 Failure Mechanism
The 20 ft span failed under a total applied load of 182.1 kips. The failure mechanism was a
shear crack near the corner on the arch itself. The shear crack opened up on the side of the
bridge containing cross sections four and five, wirepots three and five, and load cells three and
four. The load configuration is shown in Figure 3-14. A picture of the failed structure is shown in
Figure 3-15.
Figure 3-14 Failure Load Configuration
The shear failure mechanism of the bridge was unexpected. A general flexural failure caused
by flexural hinges forming near the corners and at midspan was considered more likely.
However, due to the stiffness of the concrete and large amounts of reinforcement steel, especially
at midspan, steel did not significantly yield, causing a different failure mechanism.
51.9k 52.0k
t t d1: d1:
Total Vertical Load = 182. lk

22
The failure mechanism was not ductile and developed quickly. The bridge failed rapidly and
could not carry its own dead weight after failure. While flexural cracks did develop in the walls,
corners, and midspan of the bridge, none of them opened up very much after forming, due to the
bridge redistributing the load to stiffer sections. Overall, the flexural stiffness of this shorter span
bridge forced the bridge to be controlled by shear strength of the concrete. The relatively thin
section, containing no shear reinforcement, was not large enough to resist the large shear forces
developed during the test.
Figure 3-15 Failed Bridge Section
3.7 Chapter Summary
The 20 ft bridge unit appeared to have sufficient strength, but did not fail with a ductile
mechanism. While flexural cracking did occur in the high moment areas at early loading stages,
these cracks did not significantly widen or propagate during testing, due to the bridge unit
redistributing load around the cracks and the reinforcement not yielding. The bridge unit held
182.1 kips of force before failure. Immediately prior to failure, maximum deflections were 2.1 in
downward at midspan, and 1.04 in laterally in the walls. The failure mechanism was a shear
failure of the concrete, with a shear crack running through the arch section near the corner.
23
Chapter 4
LABORATORY TEST OF 36 FT SPAN
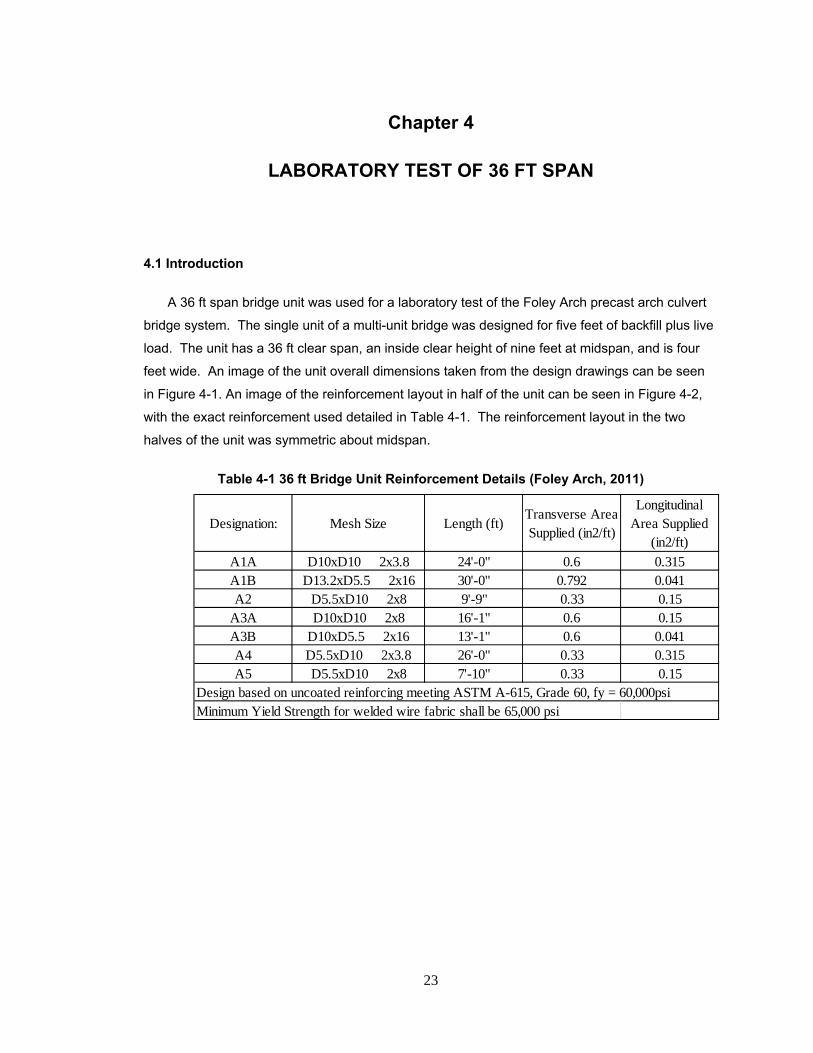
4.1 Introduction
A 36 ft span bridge unit was used for a laboratory test of the Foley Arch precast arch culvert
bridge system. The single unit of a multi-unit bridge was designed for five feet of backfill plus live
load. The unit has a 36 ft clear span, an inside clear height of nine feet at midspan, and is four
feet wide. An image of the unit overall dimensions taken from the design drawings can be seen
in Figure 4-1. An image of the reinforcement layout in half of the unit can be seen in Figure 4-2,
with the exact reinforcement used detailed in Table 4-1. The reinforcement layout in the two
halves of the unit was symmetric about midspan.
Table 4-1 36 ft Bridge Unit Reinforcement Details (Foley Arch, 2011)
Designation: Mesh Size Length (ft)Transverse Area Supplied (in2/ft)
Longitudinal Area Supplied
(in2/ft)
A1A D10xD10 2x3.8 24'-0" 0.6 0.315A1B D13.2xD5.5 2x16 30'-0" 0.792 0.041A2 D5.5xD10 2x8 9'-9" 0.33 0.15
A3A D10xD10 2x8 16'-1" 0.6 0.15A3B D10xD5.5 2x16 13'-1" 0.6 0.041A4 D5.5xD10 2x3.8 26'-0" 0.33 0.315A5 D5.5xD10 2x8 7'-10" 0.33 0.15
Design based on uncoated reinforcing meeting ASTM A-615, Grade 60, fy = 60,000psiMinimum Yield Strength for welded wire fabric shall be 65,000 psi

24
Figure 4-1 36 ft Bridge Unit Overall Dimensions (FoleyArch, 2011)
I ' -·-~-·-o~· • "' ~
0
q
I 0"
N 0: ;: ., [ "' !
l r-., 9 !
-----
' • I I
~ "I. .:~. , .I
!
• 0 ~
.0-,&
. '1/,9·,S
~-+-- • O
1 •'/,&·. .'/ ,&·.Z i.--~ •• ~;.~s--.~9----i
. ~
. ~ .... Cll&" - -1---l-; - '7
0
z Q 1-
<l > LJ..I -' w
25
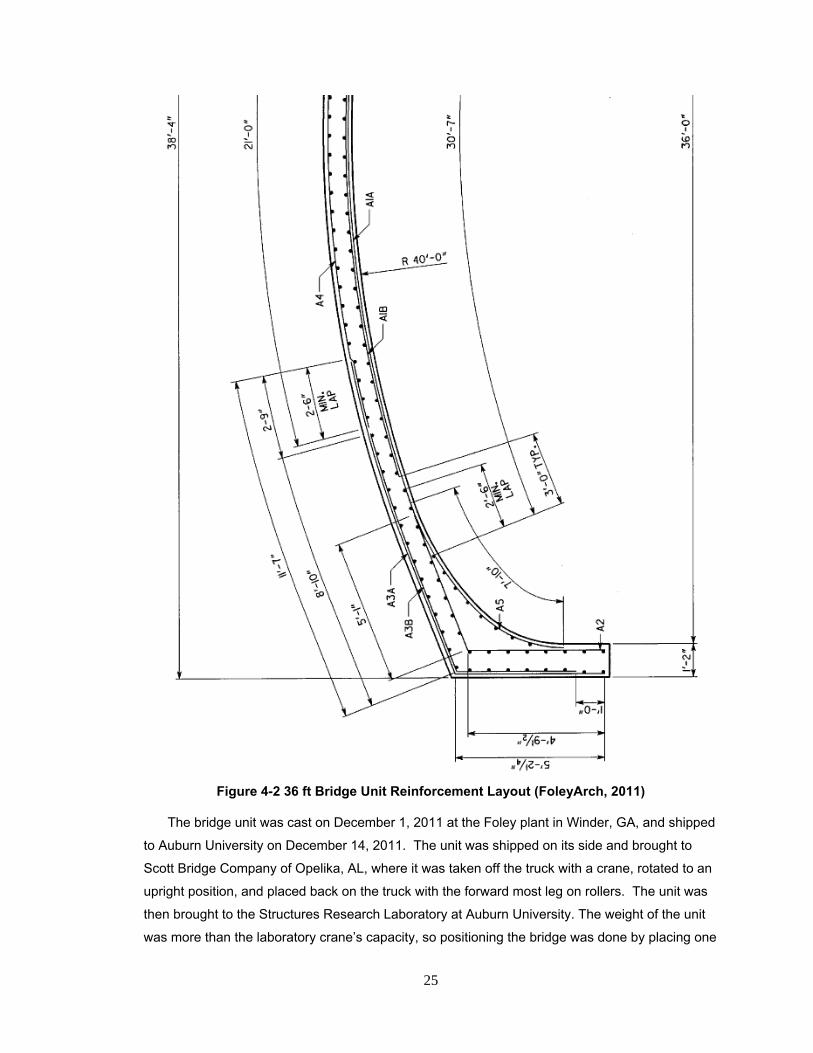
Figure 4-2 36 ft Bridge Unit Reinforcement Layout (FoleyArch, 2011)
The bridge unit was cast on December 1, 2011 at the Foley plant in Winder, GA, and shipped
to Auburn University on December 14, 2011. The unit was shipped on its side and brought to
Scott Bridge Company of Opelika, AL, where it was taken off the truck with a crane, rotated to an
upright position, and placed back on the truck with the forward most leg on rollers. The unit was
then brought to the Structures Research Laboratory at Auburn University. The weight of the unit
was more than the laboratory crane’s capacity, so positioning the bridge was done by placing one
• .,. ' "' n
• 0 _, N
.... <(
a, <(
• ,... ' 0
n
• 0 ' "' n
• N
.J...

26
end on rollers, lifting up the other end, and using the forklift to push or pull the bridge into place.
This process caused some minor cracking in the unit, as well as some slight misalignment of the
legs. A single load test was performed on the bridge on January 6, 2012. At ultimate load
conditions, the unit held more than 151 kips before failing.
This chapter details how the 36 ft unit was tested, as well as the results. It contains sections
on the instrumentation, setup, and procedure used for testing. It also contains analysis and
results from testing, followed by discussion of those results.
4.2 Instrumentation and Setup
The 36 ft clear span bridge unit was instrumented with 15 sister bar strain gages, ten
concrete surface strain gages, three displacement potentiometers, or wirepots, and four load
cells. Strain gages were placed at seven cross section locations on the bridge: at midspan, at the
corners where the arch section began to increase in thickness, within the thicker corner sections,
and on the legs where the section began to increase in thickness. The layout of the instrumented
cross sections can be seen in Figure 4-3. Two sister bar gages were placed at each location and
tied to the reinforcing cage. Three sister bar gages were used at midspan. These sister bar gages
were tied on the side of the cross section that would be the expected tension side, meaning the
inner side of the bridge at midspan, and the outer side of the bridge at the corners and legs. Two
concrete surface strain gages were placed at each cross section, at third points along the width,
on the concrete surface expected to be in compression, meaning the outer side at midspan, and
the inner side at the corners and legs.
Figure 4-3 36 ft Cross Section Locations
The three wirepots were placed in positions to measure the maximum deflections that the
bridge experienced. Therefore, one was placed vertically at midspan to measure vertical
deflection, and the other two were placed horizontally at the top of the walls to measure lateral
deflection.
In addition, four load cells were used to measure the horizontal reaction at the base of the
bridge. Two load cells were placed on the exterior side of each leg, bearing against the leg to
± 19"
Thin Corner 3
Thick Corner 2
eg 1
idspan 4 Th in Corner 5
Thick Corner 6
± Leg 7 19"
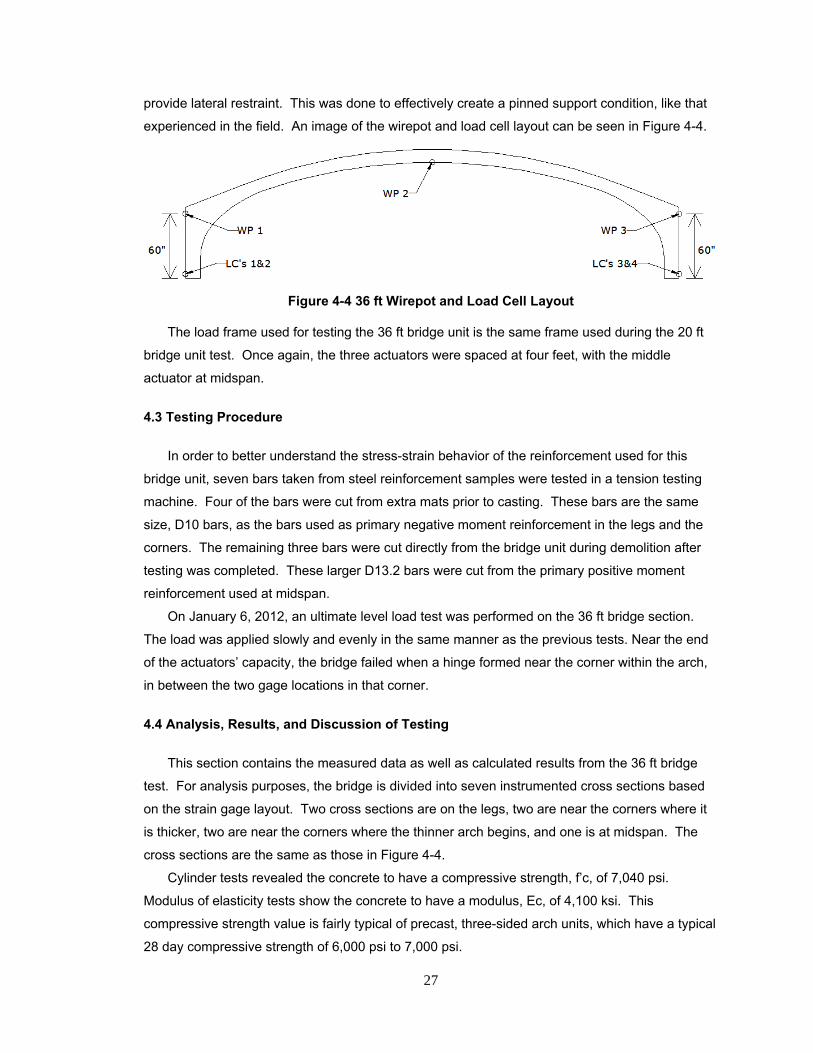
27
provide lateral restraint. This was done to effectively create a pinned support condition, like that
experienced in the field. An image of the wirepot and load cell layout can be seen in Figure 4-4.
Figure 4-4 36 ft Wirepot and Load Cell Layout
The load frame used for testing the 36 ft bridge unit is the same frame used during the 20 ft
bridge unit test. Once again, the three actuators were spaced at four feet, with the middle
actuator at midspan.
4.3 Testing Procedure
In order to better understand the stress-strain behavior of the reinforcement used for this
bridge unit, seven bars taken from steel reinforcement samples were tested in a tension testing
machine. Four of the bars were cut from extra mats prior to casting. These bars are the same
size, D10 bars, as the bars used as primary negative moment reinforcement in the legs and the
corners. The remaining three bars were cut directly from the bridge unit during demolition after
testing was completed. These larger D13.2 bars were cut from the primary positive moment
reinforcement used at midspan.
On January 6, 2012, an ultimate level load test was performed on the 36 ft bridge section.
The load was applied slowly and evenly in the same manner as the previous tests. Near the end
of the actuators’ capacity, the bridge failed when a hinge formed near the corner within the arch,
in between the two gage locations in that corner.
4.4 Analysis, Results, and Discussion of Testing
This section contains the measured data as well as calculated results from the 36 ft bridge
test. For analysis purposes, the bridge is divided into seven instrumented cross sections based
on the strain gage layout. Two cross sections are on the legs, two are near the corners where it
is thicker, two are near the corners where the thinner arch begins, and one is at midspan. The
cross sections are the same as those in Figure 4-4.
Cylinder tests revealed the concrete to have a compressive strength, f’c, of 7,040 psi.
Modulus of elasticity tests show the concrete to have a modulus, Ec, of 4,100 ksi. This
compressive strength value is fairly typical of precast, three-sided arch units, which have a typical
28 day compressive strength of 6,000 psi to 7,000 psi.
WP2

28
It was found that reinforcement had both sufficient strength as well as ductility. A graph
showing the full stress-strain curves for each of the seven steel samples can be seen in Figure 4-
5. Data showed that the modulus of elasticity was approximately 26,500 ksi, however, which is
unusual for steel. Data showed that the steel stress-strain curve increases linearly before
beginning to flatten out at a yield plateau. Specimens did not exhibit strain hardening, increasing
strength after yielding, but instead continued to deform with very little strength increase prior to
fracture. In addition to the smaller modulus of elasticity, one other anomaly was noted. It was
found that yielding of the smaller D10 bars was around 70 ksi, while the larger D13.2 bars did not
yield until roughly 90 ksi, which is very high for this steel. However, due to the range of strains
measured during testing, this anomaly did not prove to be significant.
Figure 4-5 Steel Reinforcement Testing Results
Strains measured at the same cross section location were close to each other, which
indicated two things. First, load testing did not cause any torque in the bridge. Second, the strain
gages were measuring strains properly. Other than the one sister bar strain gage that was faulty
after casting, no other strain gages became faulty during the course of the test.
The highest strains were measured in cross sections three, four, and five, as expected. Steel
strains in all three of these cross sections were high enough to cause yielding, with the maximum
strains being around 0.0035, which occurred in cross section five right before failure. Steel
strains in cross sections one, two, six, and seven did not reach yielding.
Moments and axial forces were calculated in the same way as described previously. The
primary differences were that the concrete rupture stress, fr, is 630 psi, and all cross sections
were analyzed using cracked section analysis. Another notable difference was that the test data
developed from the steel specimens was used to determine the stresses in the steel.
110000
100000
90000
80000
70000 -·;;; .e: 60000
"' "'
... ..--
~ -+-Bar 1: D10 -
- Bar 2: D10 ., 50000 ~
--...Bar 3: 010
40000 ---Bar 4: D10
30000 - Bar 5: D13.2 -
20000 --Bar 6: D13.2 -
10000 -+-Bar 7: D13.2 -
0 I
0.0000 0.0100 0.0200 0.0300 0.0400 0 .0500
Strain
29
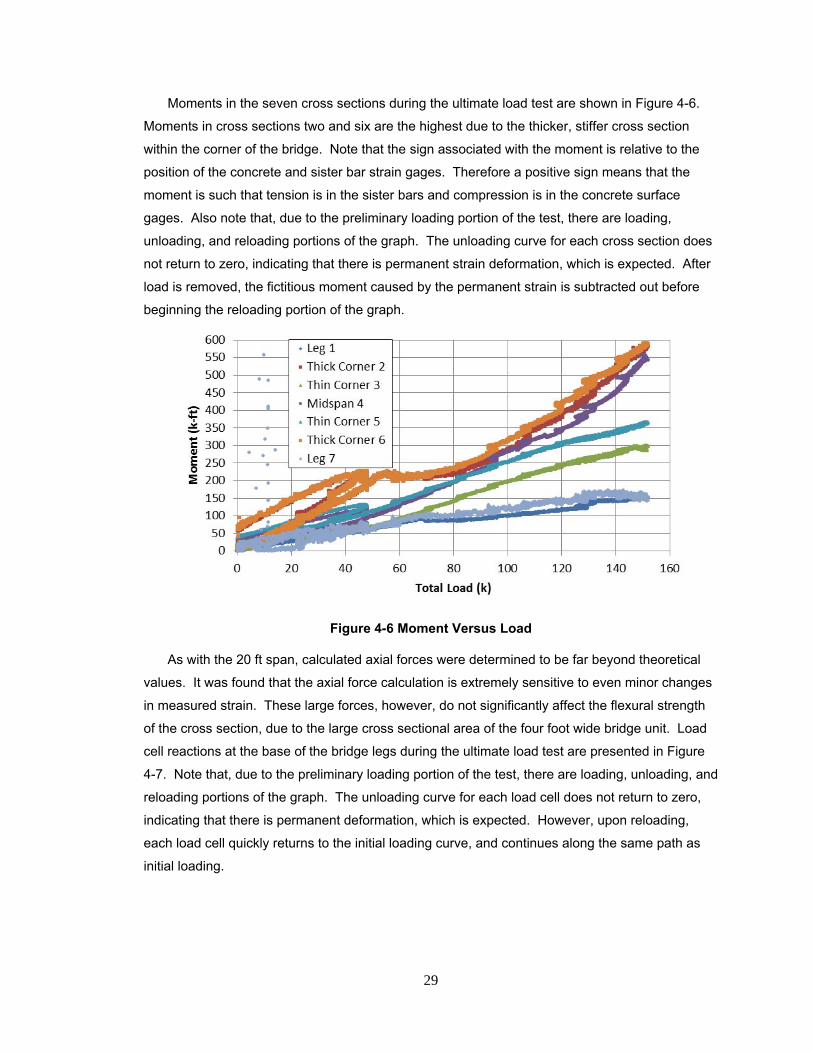
Moments in the seven cross sections during the ultimate load test are shown in Figure 4-6.
Moments in cross sections two and six are the highest due to the thicker, stiffer cross section
within the corner of the bridge. Note that the sign associated with the moment is relative to the
position of the concrete and sister bar strain gages. Therefore a positive sign means that the
moment is such that tension is in the sister bars and compression is in the concrete surface
gages. Also note that, due to the preliminary loading portion of the test, there are loading,
unloading, and reloading portions of the graph. The unloading curve for each cross section does
not return to zero, indicating that there is permanent strain deformation, which is expected. After
load is removed, the fictitious moment caused by the permanent strain is subtracted out before
beginning the reloading portion of the graph.
Figure 4-6 Moment Versus Load
As with the 20 ft span, calculated axial forces were determined to be far beyond theoretical
values. It was found that the axial force calculation is extremely sensitive to even minor changes
in measured strain. These large forces, however, do not significantly affect the flexural strength
of the cross section, due to the large cross sectional area of the four foot wide bridge unit. Load
cell reactions at the base of the bridge legs during the ultimate load test are presented in Figure
4-7. Note that, due to the preliminary loading portion of the test, there are loading, unloading, and
reloading portions of the graph. The unloading curve for each load cell does not return to zero,
indicating that there is permanent deformation, which is expected. However, upon reloading,
each load cell quickly returns to the initial loading curve, and continues along the same path as
initial loading.
600 • Leg 1
550 . • Thick Corner 2
500 .. 450
• Thin Corner 3
..-. 400 • Midspan 4
.; • Thin Corner 5 ::, 350 .. 300 • Thick Corner 6 C . GI . • E 250
0 ::: 200
150
100
50
0
0 20 40 60 80 100 120 140 160
Total Load (k}
30
Figure 4-7 Load Cell Reaction Versus Load
The forces in the load cells are much higher in the 36 ft span bridge unit compared to the 20
ft span bridge unit. This is due to the slightly angled legs. Therefore, a higher portion of the
horizontal reaction goes into the load cells. Another possible reason for the increase in load cell
forces is the relative stiffness of the 36 ft arch compared to the 20 ft arch. The 36 ft arch allowed
for much greater rotation of the corners, which would increase the amount of lateral force at the
base of the bridge unit.
Figure 4-8 shows the individual wirepot displacements during the ultimate load test. Note
that, due to the preliminary loading portion of the test, there are loading, unloading, and reloading
portions of the graph. The unloading curve for each wirepot does not return to zero, indicating
that there is permanent deformation, which is expected. However, upon reloading, each wirepot
quickly returns to the initial loading curve, and continues along the same path as initial loading.
With 5.96 in of vertical deflection at failure, the bridge was fairly flexible. This ultimate load
deflection translates to roughly L/70. However, due to the relatively short legs, the unrestrained
lateral deflections of the bridge walls were relatively small, maximum being 0.93 in at WP 3. Due
to these small deflections, passive forces in the backfill soil would not mobilize. Therefore, for the
36 ft span, backfill soil would not significantly aid the ultimate strength of the bridge with its
current leg height.
160
140
120
g 100 "Cl
"' 0 80 ..... "ia
~ 60
40
20
0
0 5 10 15 20 25 30 35 40
Horizontal Base Reaction (k}
31
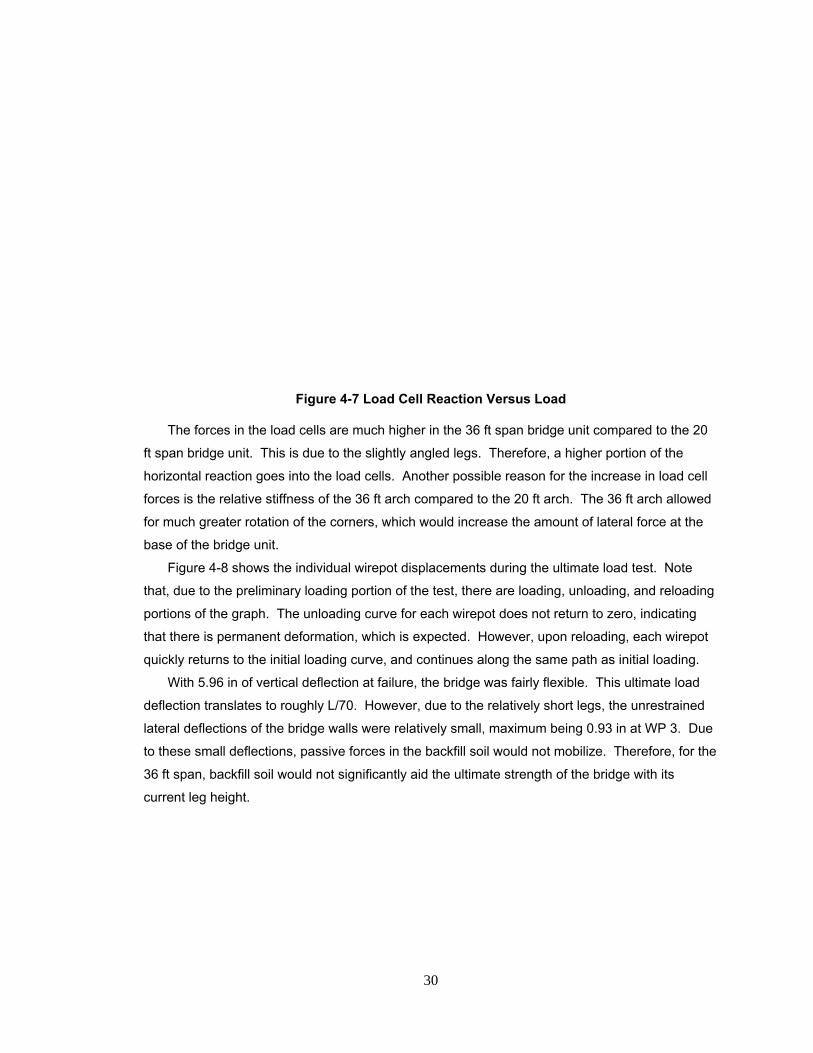
Figure 4-8 Deflection Versus Load
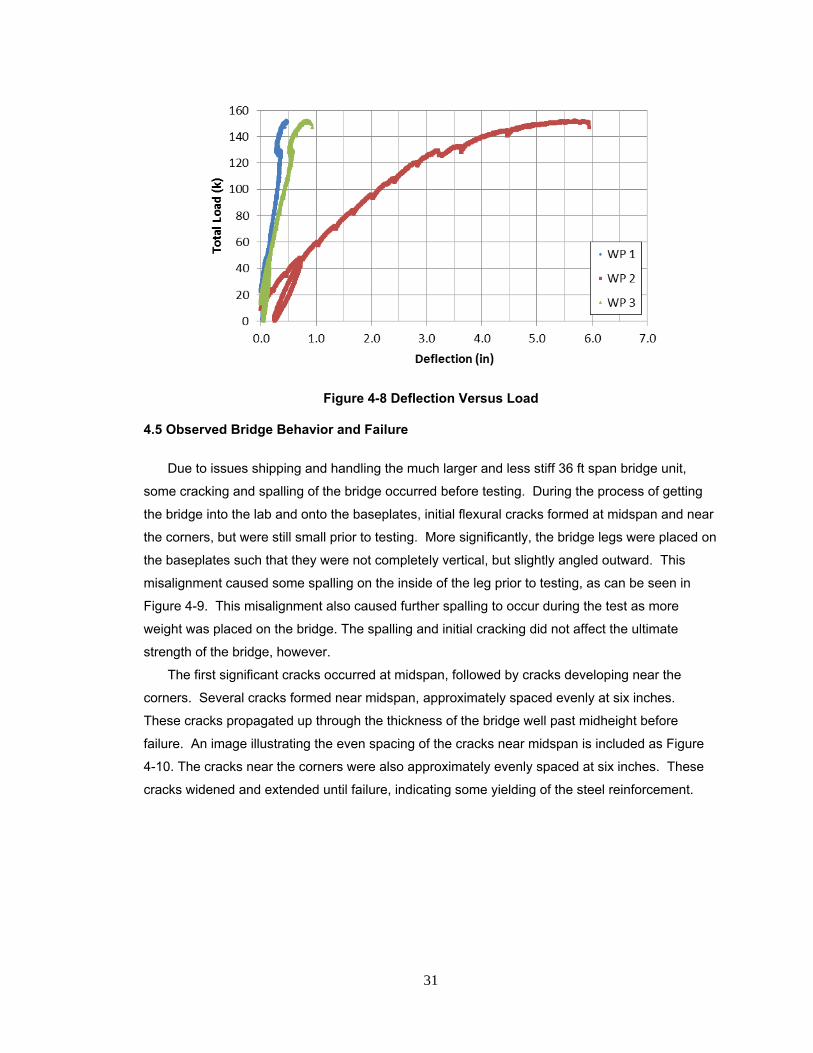
4.5 Observed Bridge Behavior and Failure
Due to issues shipping and handling the much larger and less stiff 36 ft span bridge unit,
some cracking and spalling of the bridge occurred before testing. During the process of getting
the bridge into the lab and onto the baseplates, initial flexural cracks formed at midspan and near
the corners, but were still small prior to testing. More significantly, the bridge legs were placed on
the baseplates such that they were not completely vertical, but slightly angled outward. This
misalignment caused some spalling on the inside of the leg prior to testing, as can be seen in
Figure 4-9. This misalignment also caused further spalling to occur during the test as more
weight was placed on the bridge. The spalling and initial cracking did not affect the ultimate
strength of the bridge, however.
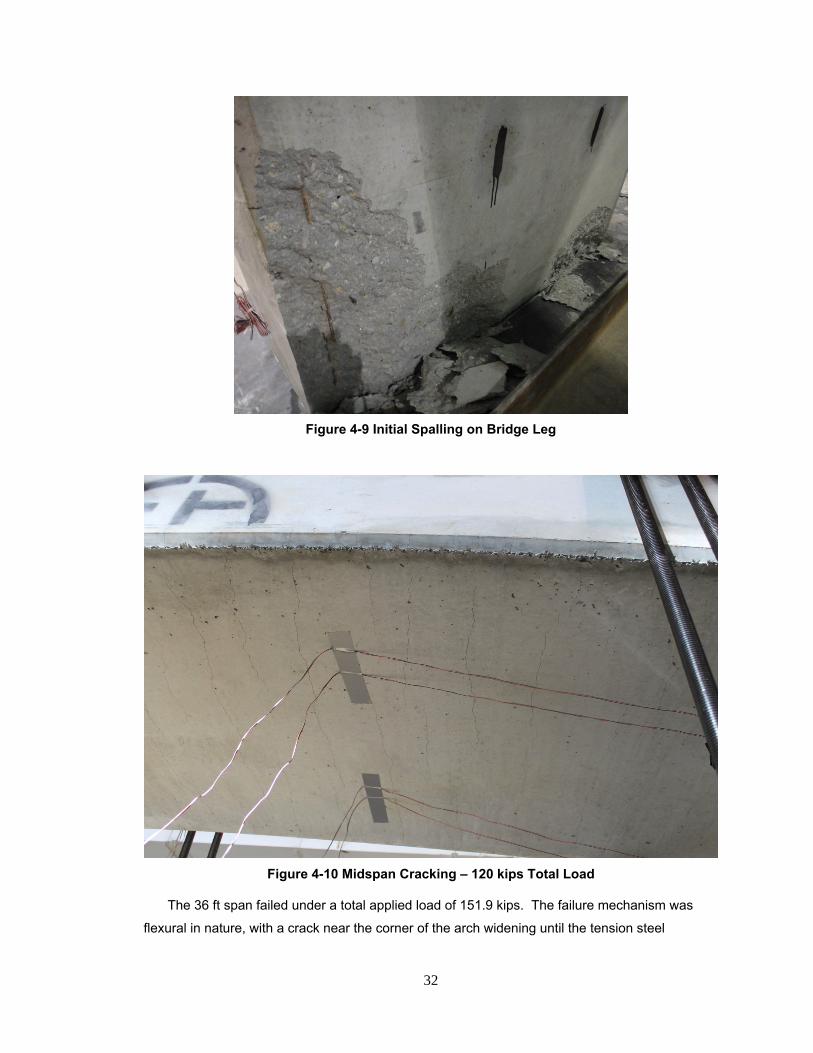
The first significant cracks occurred at midspan, followed by cracks developing near the
corners. Several cracks formed near midspan, approximately spaced evenly at six inches.
These cracks propagated up through the thickness of the bridge well past midheight before
failure. An image illustrating the even spacing of the cracks near midspan is included as Figure
4-10. The cracks near the corners were also approximately evenly spaced at six inches. These
cracks widened and extended until failure, indicating some yielding of the steel reinforcement.
160
140
120
g 100 "Cl
"' 0 80 .... iii
~ 60
40
20
0
- f'\ •
I - .... ,., _..... ,.._, -
~ ,-
J
1/1 ~ .. ~
' • WP 1
• WP2
• WP3
0.0 1.0 2.0 3.0 4.0 5.0 6.0 7.0
Deflection (in)
32
Figure 4-9 Initial Spalling on Bridge Leg
Figure 4-10 Midspan Cracking – 120 kips Total Load
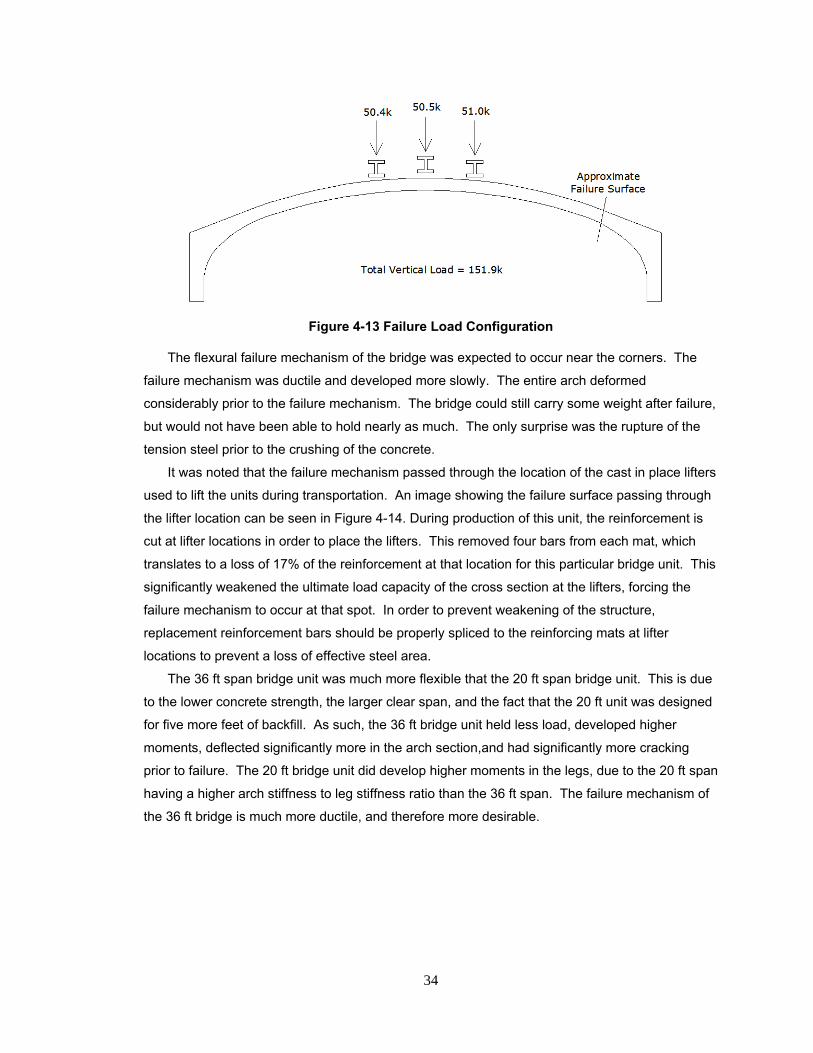
The 36 ft span failed under a total applied load of 151.9 kips. The failure mechanism was
flexural in nature, with a crack near the corner of the arch widening until the tension steel

33
ruptured, which quickly caused the concrete to crush in compression. The remaining uncrushed
concrete and compression steel allowed the bridge to continue carrying some load, but rupture of
the tension steel meant that further loading of the bridge would be futile. An image of the failure
mechanism immediately before and after failure can be seen in Figures 4-11 and 4-12,
respectively. The failure occurs between cross sections five and six, on the side of the bridge with
wirepot three and load cells three and four. The ultimate load configuration can be seen in Figure
4-13.
Figure 4-11 Bridge Cracking Immediately Prior to Failure
Figure 4-12 Bridge Section Immediately After Failure
34
Figure 4-13 Failure Load Configuration
The flexural failure mechanism of the bridge was expected to occur near the corners. The
failure mechanism was ductile and developed more slowly. The entire arch deformed
considerably prior to the failure mechanism. The bridge could still carry some weight after failure,
but would not have been able to hold nearly as much. The only surprise was the rupture of the
tension steel prior to the crushing of the concrete.
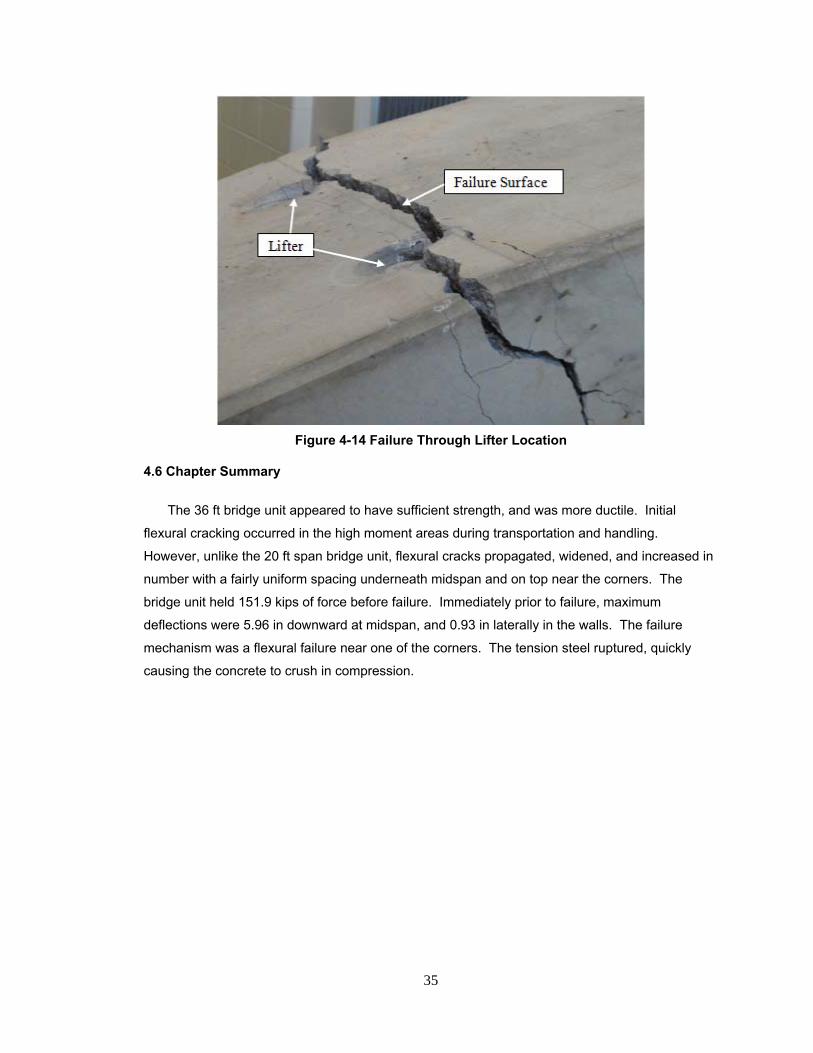
It was noted that the failure mechanism passed through the location of the cast in place lifters
used to lift the units during transportation. An image showing the failure surface passing through
the lifter location can be seen in Figure 4-14. During production of this unit, the reinforcement is
cut at lifter locations in order to place the lifters. This removed four bars from each mat, which
translates to a loss of 17% of the reinforcement at that location for this particular bridge unit. This
significantly weakened the ultimate load capacity of the cross section at the lifters, forcing the
failure mechanism to occur at that spot. In order to prevent weakening of the structure,
replacement reinforcement bars should be properly spliced to the reinforcing mats at lifter
locations to prevent a loss of effective steel area.
The 36 ft span bridge unit was much more flexible that the 20 ft span bridge unit. This is due
to the lower concrete strength, the larger clear span, and the fact that the 20 ft unit was designed
for five more feet of backfill. As such, the 36 ft bridge unit held less load, developed higher
moments, deflected significantly more in the arch section,and had significantly more cracking
prior to failure. The 20 ft bridge unit did develop higher moments in the legs, due to the 20 ft span
having a higher arch stiffness to leg stiffness ratio than the 36 ft span. The failure mechanism of
the 36 ft bridge is much more ductile, and therefore more desirable.
50.4k 50 .Sk 51.0k
t ~
Total Vertica l Load = 151.9k
35
Figure 4-14 Failure Through Lifter Location
4.6 Chapter Summary
The 36 ft bridge unit appeared to have sufficient strength, and was more ductile. Initial
flexural cracking occurred in the high moment areas during transportation and handling.
However, unlike the 20 ft span bridge unit, flexural cracks propagated, widened, and increased in
number with a fairly uniform spacing underneath midspan and on top near the corners. The
bridge unit held 151.9 kips of force before failure. Immediately prior to failure, maximum
deflections were 5.96 in downward at midspan, and 0.93 in laterally in the walls. The failure
mechanism was a flexural failure near one of the corners. The tension steel ruptured, quickly
causing the concrete to crush in compression.
Failure Surface
36
Chapter 5
Computer Modeling
5.1 Introduction
The objective in creating a structural computer model was to correlate the results of the
model to those found during the laboratory testing. The computer software program used for
development of the structural model was SAP2000. Since the structure was loaded to failure
during the laboratory tests, the model was required to simulate the linear and nonlinear behavior
of the arch. Therefore, the nonlinear capabilities of SAP2000 were of particular importance.
SAP2000 was chosen in place of other programs that offered more soil-structure interaction
capabilities due to the fact that the lab and field tests showed that the lateral restraint had minimal
effect. SAP2000’s ability to model reinforced concrete was easier to implement and researchers
on the project had previous experience.
5.2 Model Development
Geometric dimensions based on the construction documents and physical measurements
provided a reference point for which to construct the structural model. A barrel shell element with
the appropriate length, roll down angle, radius, axial divisions, and angular divisions was created.
Once the basic arch shape was created, the legs of the arch were manually drawn.
Using the concrete frame section generator within SAP2000, the cross sectional dimensions
and reinforcing details were assigned to the frame elements. While a majority of the frame
element could appropriately be assigned as uniform prismatic rectangular sections, the corner
sections of the structure were in reality much stiffer due to a non uniform section. To represent
this in the model, non-prismatic frame sections were assigned to these corner elements. The
geometric properties of these elements linearly change throughout their length to two distinctly
defined cross sections assigned at each end of the element. The prismatic and non-prismatic
sections used in the 20 ft and 36ft clear span models are conceptually shown in Figures 5-1 and
5-2, respectively.

37
Figure 5-1 20 ft Clear Span – SAP2000 Elements
Figure 5-2 36 ft Clear Span – SAP2000 Elements
The material properties used in the SAP2000 model were a combination of default material
properties built into the software and appropriate adjustments to these default properties based
on tests performed using material samples taken from the structures tested. Concrete modulus of
elasticity and compressive strength values used were those reported previously for the two
arches tested in the Auburn University laboratory. The expected yield strength and ultimate
strength of the reinforcing bars determined from the 36’ span specimen were used in the models.
5.3 Nonlinear Analysis
To simulate the behavior observed in the laboratory testing in the SAP2000 model, the
loading configuration was setup to be the same. Therefore, the point loading configuration used in
the SAP2000 structural computer model matched that of the laboratory testing load setup.
Three point loads on the 20 ft and 36 ft clear span SAP2000 structural models were set at the
locations used in the laboratory tests. The load cases incrementally increased the magnitude of
each of these three point loads by 10 kips, a 30 kip total increase per load case. The lowest
magnitude load case in both models was 20 kips per point load, 60 kips total load. The highest
z
L,
L,
38
magnitude load case for the 20 ft clear span model was 64 kips per point load, 192 kips total load.
The highest magnitude load case in the 36 ft model was 51 kips per point load, 153 kips total
load. As the laboratory testing carried out loading up to ultimate capacity of the structure, it was
necessary to include nonlinear effects in the computer analysis model. This was accomplished in
SAP2000 through the use of M3 hinges assigned to various frame elements throughout the
structure in conjunction with nonlinear load cases.
User defined M3 type hinges were decided upon after considering the benefits and data
comparison of various models with different types of hinges. M3 hinges are dependent on
moments at the assigned hinge location. User defined M3 hinges accounted for these forces well
and produced results with the best correlation those of the actual results in the laboratory. As the
cross sectional properties of the structures were known from the construction documents,
reinforcing detail specifications, and physical measurements taken in the laboratory, it was
possible to perform detailed cross sectional analysis calculations for critical cross sections to
define the needed range of data points necessary to utilize user defined M3 hinge properties.
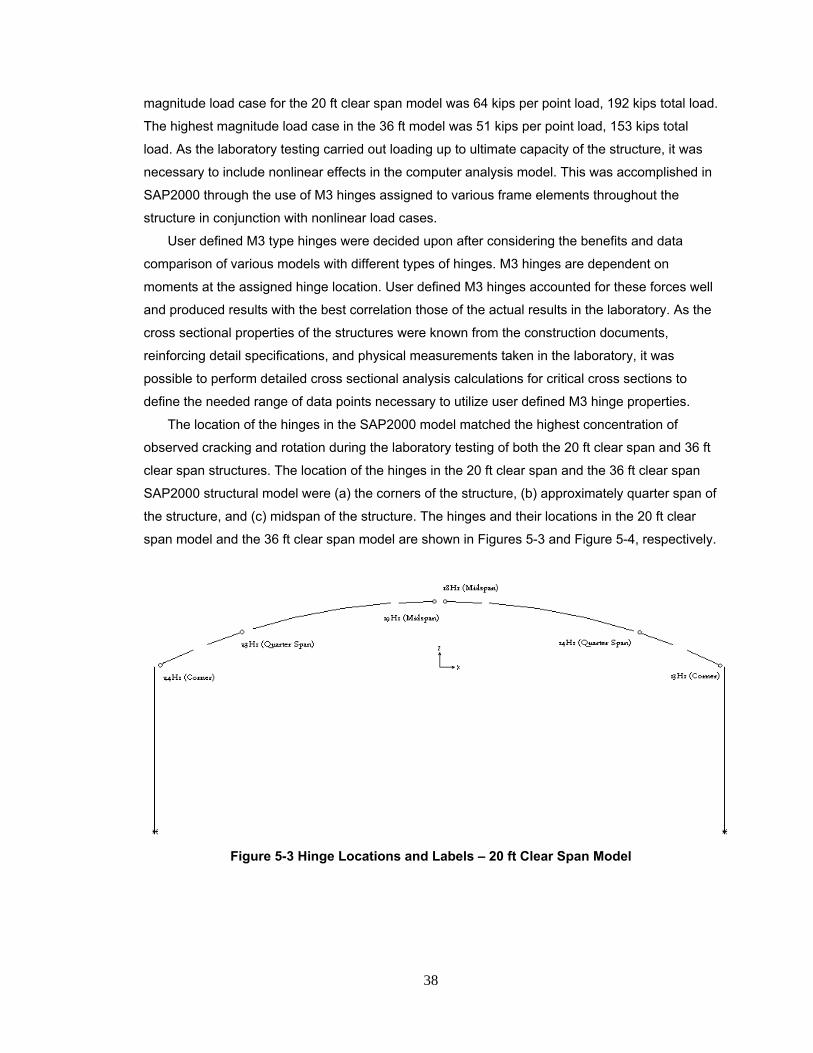
The location of the hinges in the SAP2000 model matched the highest concentration of
observed cracking and rotation during the laboratory testing of both the 20 ft clear span and 36 ft
clear span structures. The location of the hinges in the 20 ft clear span and the 36 ft clear span
SAP2000 structural model were (a) the corners of the structure, (b) approximately quarter span of
the structure, and (c) midspan of the structure. The hinges and their locations in the 20 ft clear
span model and the 36 ft clear span model are shown in Figures 5-3 and Figure 5-4, respectively.
Figure 5-3 Hinge Locations and Labels – 20 ft Clear Span Model
1
,3 H, (M.!.,p..,_)
0------
L~ ,iH,(Co...,•)

39
Figure 5-4 Hinge Locations and Labels – 36 ft Clear Span Model
Failure modes are not predicted by SAP2000. However, the “failure point” of the structure
was assumed to have occurred when a drastic, unrealistic increase in deflection occurred in the
model analysis. For the 20 ft clear span model, this drastic increase in displacement occurred
around 65 kips per loading location, 195 kips total load. This was very close to the ultimate total
load from testing, 184 kips. The deflection in the 20 ft clear span SAP2000 model increased from
1.839 in. at midspan with 192 kips total load to thousands of inches at midspan with 195 kips total
load. The ultimate load capacity of the structure could be reasonably predicted based on the
comparison of the 20 ft model capacity to laboratory specimen capacity.
For the 36 ft clear span model, the drastic increase in displacement occurred at
approximately 52 kips per loading location, or a total load of 156 kips. This was very close to the
ultimate total load in testing of the 36 ft clear span of approximately 152 kips. The deflection in the
36 ft clear span SAP2000 model drastically increased from 3.501 in. at a total load of 152 kips to
thousands of inches around a total load of 156 kips. The ultimate load capacity of the structure
was reasonably predicted based on a comparison of the 36 ft model capacity to the laboratory
specimen capacity.
As is true of most concrete structures, loading resulted in flexural cracking of the concrete.
Cracked sections have a decreased moment of inertia which directly decreases the stiffness of
the overall structure. Prior to this cracking, the moment of inertia of a given cross section is often
represented simply by the gross moment of inertia of the section. However, after cracking has
occurred, it becomes necessary to adjust the moment of inertia to an effective moment of inertia
for cross sectional analysis purposes since part of the section is cracked and therefore not
contributing to the stiffness of the section. This was accounted for in the SAP2000 model to better
represent the displacements of the midspan and the top of the walls.
5.4 Model Analysis Results
The objective of developing a SAP2000 structural model was to correlate the results of the
model with those of the laboratory testing. The primary means of comparison used to evaluate
L, !7H,(Co~
40
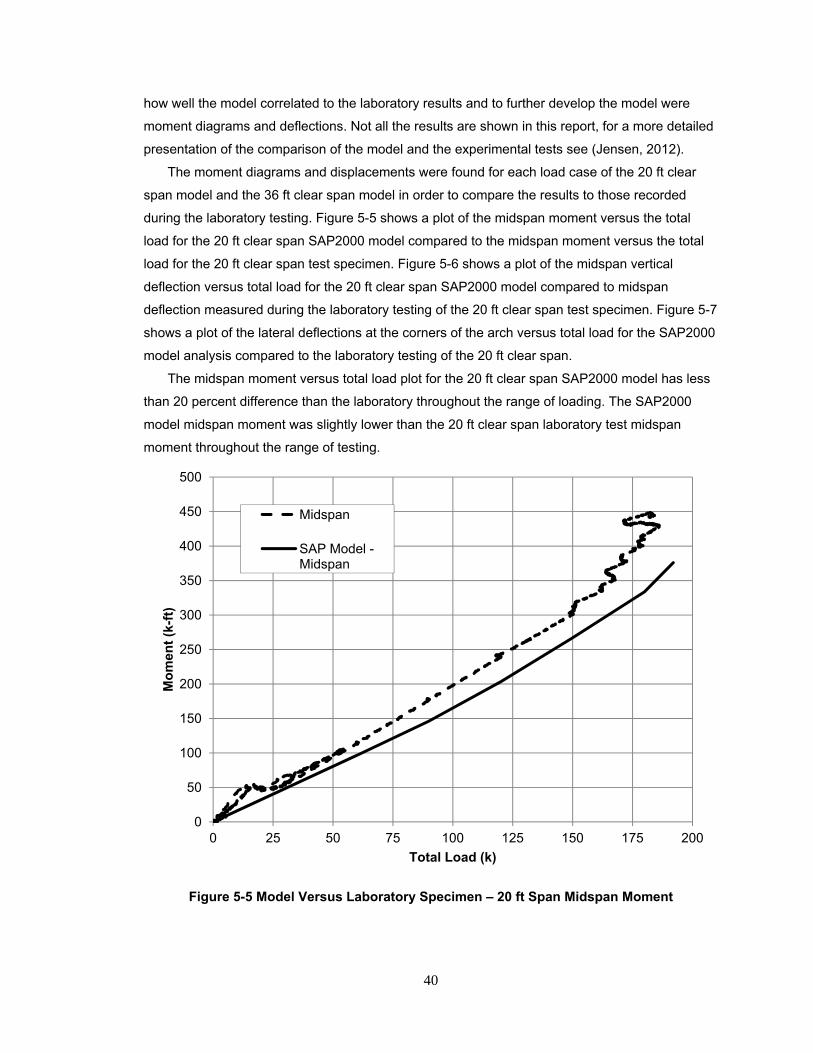
how well the model correlated to the laboratory results and to further develop the model were
moment diagrams and deflections. Not all the results are shown in this report, for a more detailed
presentation of the comparison of the model and the experimental tests see (Jensen, 2012).
The moment diagrams and displacements were found for each load case of the 20 ft clear
span model and the 36 ft clear span model in order to compare the results to those recorded
during the laboratory testing. Figure 5-5 shows a plot of the midspan moment versus the total
load for the 20 ft clear span SAP2000 model compared to the midspan moment versus the total
load for the 20 ft clear span test specimen. Figure 5-6 shows a plot of the midspan vertical
deflection versus total load for the 20 ft clear span SAP2000 model compared to midspan
deflection measured during the laboratory testing of the 20 ft clear span test specimen. Figure 5-7
shows a plot of the lateral deflections at the corners of the arch versus total load for the SAP2000
model analysis compared to the laboratory testing of the 20 ft clear span.
The midspan moment versus total load plot for the 20 ft clear span SAP2000 model has less
than 20 percent difference than the laboratory throughout the range of loading. The SAP2000
model midspan moment was slightly lower than the 20 ft clear span laboratory test midspan
moment throughout the range of testing.
Figure 5-5 Model Versus Laboratory Specimen – 20 ft Span Midspan Moment
0
50
100
150
200
250
300
350
400
450
500
0 25 50 75 100 125 150 175 200
Mo
men
t (k
-ft)
Total Load (k)
Midspan
SAP Model -Midspan
41
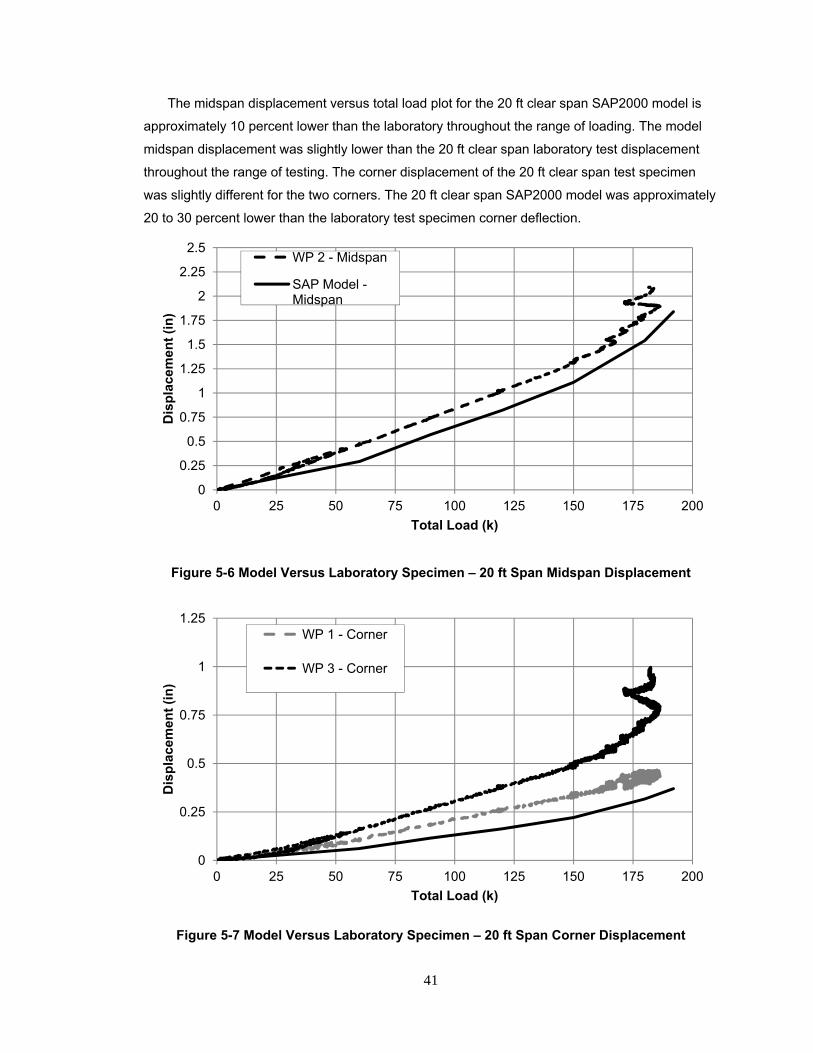
The midspan displacement versus total load plot for the 20 ft clear span SAP2000 model is
approximately 10 percent lower than the laboratory throughout the range of loading. The model
midspan displacement was slightly lower than the 20 ft clear span laboratory test displacement
throughout the range of testing. The corner displacement of the 20 ft clear span test specimen
was slightly different for the two corners. The 20 ft clear span SAP2000 model was approximately
20 to 30 percent lower than the laboratory test specimen corner deflection.
Figure 5-6 Model Versus Laboratory Specimen – 20 ft Span Midspan Displacement
Figure 5-7 Model Versus Laboratory Specimen – 20 ft Span Corner Displacement
0
0.25
0.5
0.75
1
1.25
1.5
1.75
2
2.25
2.5
0 25 50 75 100 125 150 175 200
Dis
pla
cem
ent
(in
)
Total Load (k)
WP 2 - Midspan
SAP Model -Midspan
0
0.25
0.5
0.75
1
1.25
0 25 50 75 100 125 150 175 200
Dis
pla
cem
ent
(in
)
Total Load (k)
WP 1 - Corner
WP 3 - Corner
42
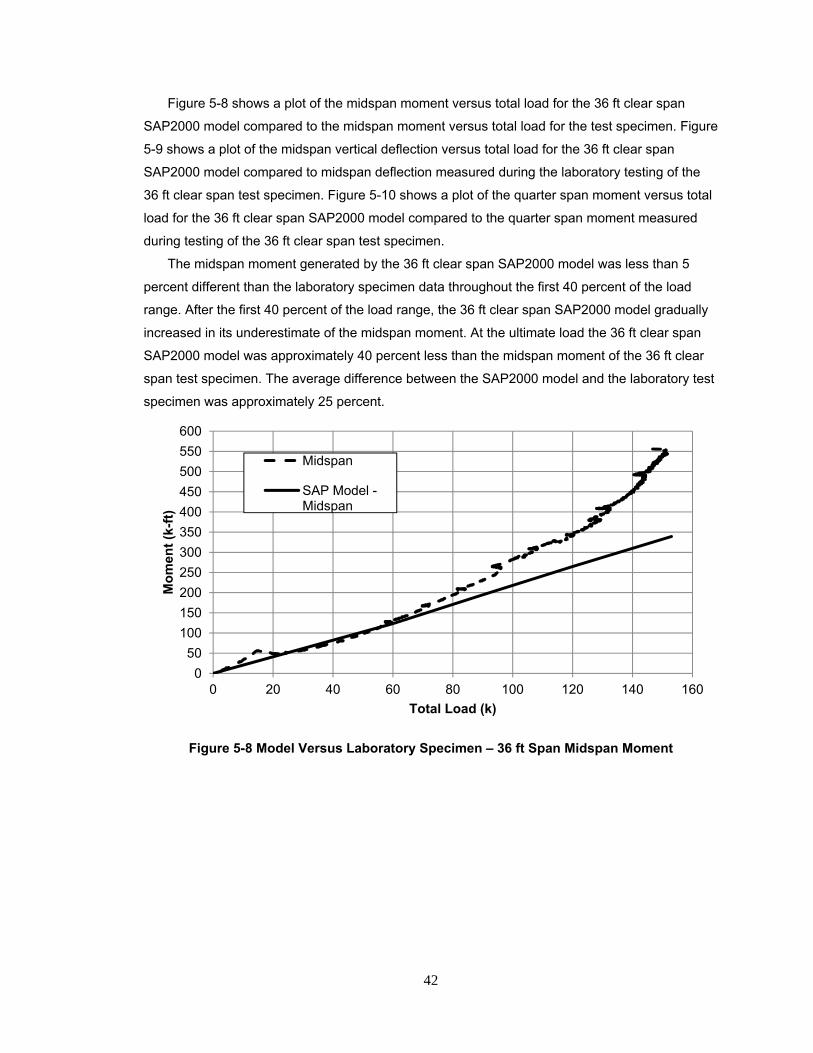
Figure 5-8 shows a plot of the midspan moment versus total load for the 36 ft clear span
SAP2000 model compared to the midspan moment versus total load for the test specimen. Figure
5-9 shows a plot of the midspan vertical deflection versus total load for the 36 ft clear span
SAP2000 model compared to midspan deflection measured during the laboratory testing of the
36 ft clear span test specimen. Figure 5-10 shows a plot of the quarter span moment versus total
load for the 36 ft clear span SAP2000 model compared to the quarter span moment measured
during testing of the 36 ft clear span test specimen.
The midspan moment generated by the 36 ft clear span SAP2000 model was less than 5
percent different than the laboratory specimen data throughout the first 40 percent of the load
range. After the first 40 percent of the load range, the 36 ft clear span SAP2000 model gradually
increased in its underestimate of the midspan moment. At the ultimate load the 36 ft clear span
SAP2000 model was approximately 40 percent less than the midspan moment of the 36 ft clear
span test specimen. The average difference between the SAP2000 model and the laboratory test
specimen was approximately 25 percent.
Figure 5-8 Model Versus Laboratory Specimen – 36 ft Span Midspan Moment
0
50
100
150
200
250
300
350
400
450
500
550
600
0 20 40 60 80 100 120 140 160
Mo
men
t (k
-ft)
Total Load (k)
Midspan
SAP Model -Midspan
I -- - , -- - '7 __,,, _, _ _,,,..,. J ...... ....--.. . II" .. ~ -----, __ --~ --~ ~
~ ~ ____, ~ -~

43
Figure 5-9 Model Versus Laboratory Specimen – 36 ft Span Midspan Displacement
Figure 5-10 Model Versus Laboratory Specimen – 36 ft Span Corner Moment
The midspan displacement generated by the 36 ft clear span SAP2000 model was
approximately 5 percent different than the laboratory specimen data throughout the first 70
percent of the load range. For the final 30 percent of the load range, the 36 ft clear span
SAP2000 model gradually increased its underestimate of the midspan displacement. At the
0
1
2
3
4
5
6
7
0 20 40 60 80 100 120 140 160
Dis
pla
cem
ent
(in
)
Total Load (k)
WP 2 - Midspan
SAP Model -Midspan
0
50
100
150
200
250
300
350
400
0 20 40 60 80 100 120 140 160
Mo
men
t (k
-ft)
Total Load (k)
Corner At Arch
Corner At Arch
SAP Model - Corner At Arch

44
ultimate load the 36 ft clear span SAP2000 model was approximately 30 percent less than the
laboratory test specimen midspan displacement. The average difference between the 36 ft clear
span SAP2000 model and 36 ft clear span laboratory test specimen for the final 30 percent of the
load range was approximately 15 percent.
The two corner at arch moments measured in on the 36 ft clear span test specimen were
different by approximately 30 to 40 percent. The corner arch moment generated in the 36 ft clear
SAP2000 model fell, in between the two different corner at arch moments measured in the
laboratory. Therefore, the SAP2000 model was approximately equal to the average of the two
laboratory measured corner at arch moments throughout the load range.
5.5 Chapter Summary
The SAP2000 structural models provided good correlation of the moments and deflections
seen during the laboratory testing. This was especially true throughout the first three quarters of
the loading range. Near the ultimate capacity of the arches, the model underpredicted, with the
exception of the model overpredicting the corner moment of the 20 ft clear span arch, the
moments and deflection by 15 to 20 percent. Based on the results, the SAP2000 structural
models provided a reasonable starting point for assessment of the design and performance of the
arches which will be discussed in the following chapter.
45
Chapter 6
Design Methodology
6.1 Introduction
Foley Products provided the design calculations generated by the engineer of record for the
bridges tested in the laboratory to evaluate the effectiveness of the arch structure design. The
designs were evaluated based upon laboratory testing and the detailed SAP2000 model.
The same methodology was used in design of both the 20 ft clear span structure and the 36 ft
clear span structure. The computer program RISA 3-D (RISA Technologies) was used to evaluate
various load combinations. The RISA model analysis indicated the highest moment in the
structure was at midspan. In the design calculations provided, this midspan moment was used to
perform standard reinforced concrete design to specify the required reinforcing.
The effectiveness of the design methodology is discussed in this chapter. Details of the
design methodology are provided. The RISA model used in design is compared to the SAP2000
model that correlated to laboratory results. An overall evaluation of the design is provided based
on a comparison to laboratory testing and the corresponding SAP model. The ratio of demand to
capacity at specific arch sections, namely midspan, was used to determine the effectiveness of
the design.
6.2 Modeling and Analysis
The expected loads on the structure were calculated to begin design. The dead load was a
function of the anticipated depth of fill. Live loads were calculated based on the 17th Edition of the
American Association of State Highway and Transportation Officials Standard Specification for
Highway Bridges HS20 design truck (AASHTO) (AASHTO, 2002). Allowance was made for
impact loading as well as its distribution through a given depth of soil medium based on AASHTO
provisions. Lateral loads, or pressures, were calculated based on the depth of fill above the point
of interest. The vertical walls of the structure were the main location of interest in calculating the
lateral soil pressure. This lateral pressure was calculated based on the unit weight of the soil
being approximated at 120 pcf. The lateral pressure is based on the active case with a coefficient
of lateral earth pressure equal to 0.3.
The analysis program RISA was used to create a structural model to determine the demand
forces. The gravity and lateral loads were incorporated in the model. The controlling moment from
the load cases, including load factors, considered in RISA was used to perform cross sectional
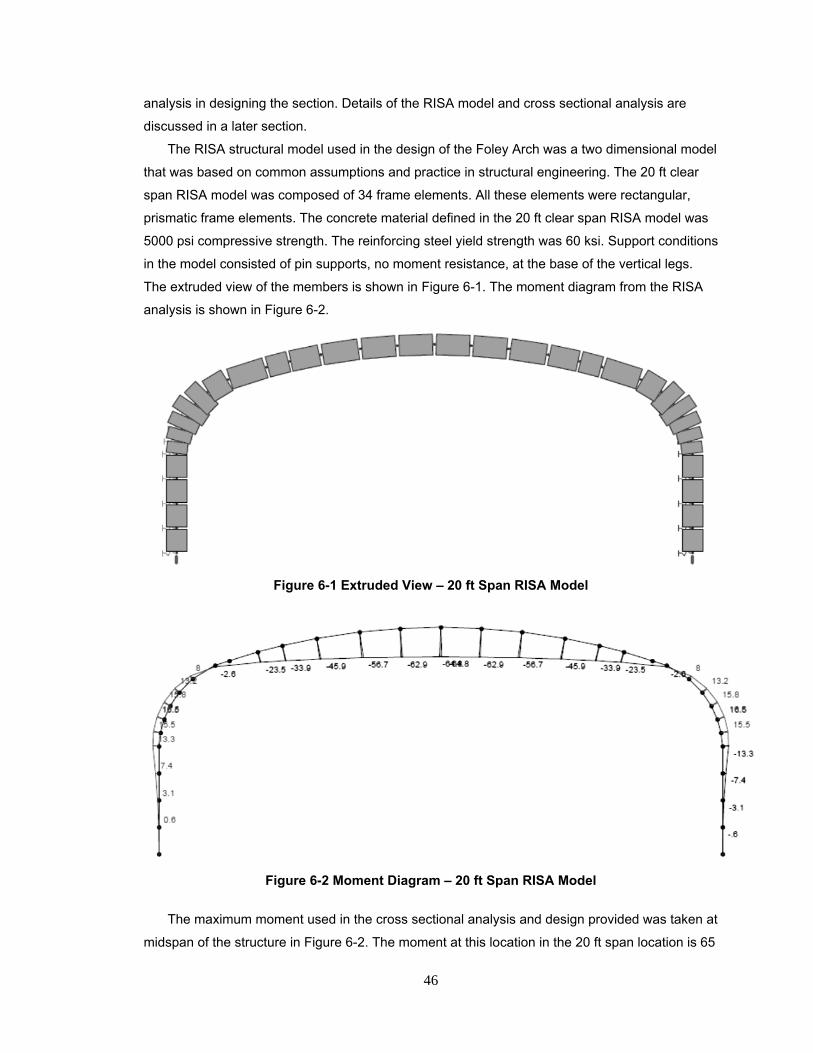
46
analysis in designing the section. Details of the RISA model and cross sectional analysis are
discussed in a later section.
The RISA structural model used in the design of the Foley Arch was a two dimensional model
that was based on common assumptions and practice in structural engineering. The 20 ft clear
span RISA model was composed of 34 frame elements. All these elements were rectangular,
prismatic frame elements. The concrete material defined in the 20 ft clear span RISA model was
5000 psi compressive strength. The reinforcing steel yield strength was 60 ksi. Support conditions
in the model consisted of pin supports, no moment resistance, at the base of the vertical legs.
The extruded view of the members is shown in Figure 6-1. The moment diagram from the RISA
analysis is shown in Figure 6-2.
Figure 6-1 Extruded View – 20 ft Span RISA Model
Figure 6-2 Moment Diagram – 20 ft Span RISA Model
The maximum moment used in the cross sectional analysis and design provided was taken at
midspan of the structure in Figure 6-2. The moment at this location in the 20 ft span location is 65
-56. 7 -62.9 -6-M.8 -62.9
15.5
3.3
-13.3 7.4
-7.4
3,1
-3.1
0.6
-.6

47
k-ft per foot of arch width. All calculations related to reinforced concrete design were in
accordance with Section 8.16 of the 17th Edition AASHTO Standard Specification for Highway
Bridges provisions. Based on the demand of 65 kip-ft, the required area of steel for a
representative 1 ft wide strip was calculated to achieve the needed capacity. The design
calculations were performed for a 1 ft width strip and therefore, to make comparisons with the test
structures, they were multiplied by 4 since the bridge tested in the laboratory and modeled in
SAP2000 was a 4 ft wide section.
Similar properties and methodology were used in the design of the 36 ft clear span structure.
A two dimensional RISA structural model was developed for design purposes. The 36 ft clear
span structure RISA model was composed of 42 frame elements. All these elements were
rectangular prismatic frame elements. The concrete material defined in the 36 ft clear span RISA
model was 6000 psi compressive strength. The reinforcing steel yield strength was 60 ksi. A view
of the 36 ft span members and the schematic division of beam elements is shown in Figure 6-3.
The moment diagram shown in Figure 6-4 is for the controlling factored load combination; this
moment diagram was generated within RISA after having run the analysis.
Figure 6-3 Beam Elements – 36 ft Span RISA Model
Figure 6-4 Moment Diagram – 36 ft Span RISA Model
The maximum moment used in the cross sectional analysis and design provided was taken at
midspan. The moment at this location in the 36 ft RISA model is 48.7 k-ft per foot of arch width.
As was the case with the 20 ft clear span design calculations, all calculations for the 36 ft clear
span related to reinforced concrete design were in accordance with the AASHTO Standard
Specification. Based on the demand, the required area of steel for a representative 1 ft wide strip
Ni N23
iB I 27.1
-~ ' -- -, ,->'-~-~
2-·•' .. , ,-20.S
2:bj,E;_J
2sz -,, ·_2t.o

48
was calculated. The design calculations were performed for a 1 ft width strip and therefore, to
make comparisons with the test structures, they were multiplied by 4.
The design calculations were used to collect and record various properties of the Foley Arch
as it was designed and modeled in RISA. The required flexural steel area at the midspan cross
section was examined; the amount provided in construction of the structure fluctuated slightly with
the steel area of actual reinforcing bars. The standard concrete and reinforcing bar yield strength
were used to calculate the nominal flexural moment capacity of the cross section under
consideration. These properties are shown in Table 6-1 and are from the design calculations
provided by Foley Arch.
Table 6-1: Design Calculation Properties
Structure
Clear
Span
Design Calculations
1 ft Width
Flexural
Steel
Area, As
(in2)
Equivalent
4 ft Width
Steel Area,
As (in2)
Compressive
Strength, f’c
(psi)
Steel
Yield
Strength,
fy (ksi)
1 ft Width
Nominal
Moment
Capacity,
Mn (k-ft)
Equivalent
4 ft Width
Nominal
Moment
Capacity,
Mn (k-ft)
20 ft 2.40 9.6 6,000 60 76.7 307
36 ft 1.22 4.88 6,000 60 54.4 218
The design moment capacity for the midspan section of the 20 ft clear span structure was
307 k-ft. The design moment capacity for the midspan section of the 36 ft clear span structure
was 218 k-ft. One of the reasons for the high design moment capacity of the 20 ft clear span
structure is the fact that it was designed for 10 ft of fill. The 36 ft clear span structure was
designed for half the fill of the 20 ft structure, 5 ft. Depending on the depth of fill, the dead load is
often the largest contributing factor. In the two structures under consideration herein, the design
loads due to the soil fill were substantially greater than the AASHTO specified live loads.
A comparison between the RISA models and the SAP2000 models was made. The factored
design loads put on the structure in the RISA model were for a 1 ft wide strip. Since the test
structures were 4 ft wide, the factored loads form the RISA models were multiplied by 4. The
resulting moment diagram for the factored loads on the 20 ft clear span in SAP2000 is shown in
Figure 6-5 which is symmetric about midspan.
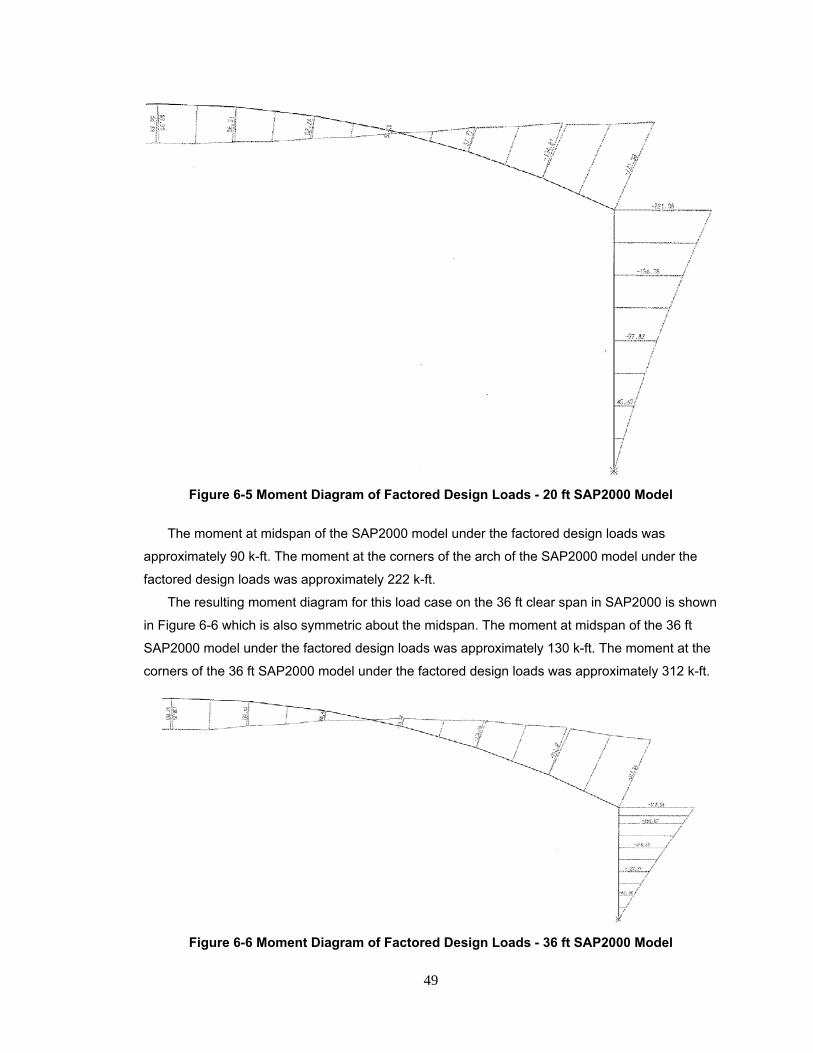
49
Figure 6-5 Moment Diagram of Factored Design Loads - 20 ft SAP2000 Model
The moment at midspan of the SAP2000 model under the factored design loads was
approximately 90 k-ft. The moment at the corners of the arch of the SAP2000 model under the
factored design loads was approximately 222 k-ft.
The resulting moment diagram for this load case on the 36 ft clear span in SAP2000 is shown
in Figure 6-6 which is also symmetric about the midspan. The moment at midspan of the 36 ft
SAP2000 model under the factored design loads was approximately 130 k-ft. The moment at the
corners of the 36 ft SAP2000 model under the factored design loads was approximately 312 k-ft.
Figure 6-6 Moment Diagram of Factored Design Loads - 36 ft SAP2000 Model
i ·- __ j__
I .• / •-:$t-.. ~
1------7,
/ ! --;
l
.!?.:.f?./
/ j
17 ! !
' ~.{
' / i
I .'
'
/
-.,,---·'-"·-"---7 ~----,;~-;1~· . ../
-1~, .!J._ ___ /~ -- -I .. ;.J.&.L; --I ",.1/t/-
~;
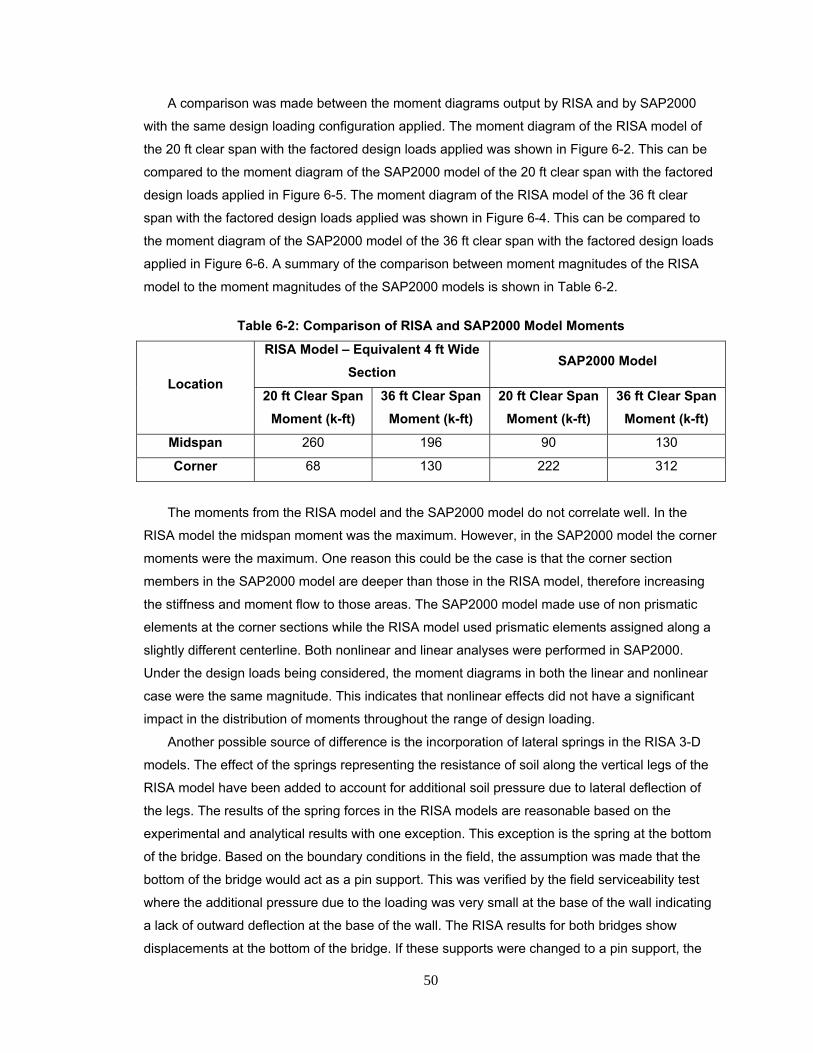
50
A comparison was made between the moment diagrams output by RISA and by SAP2000
with the same design loading configuration applied. The moment diagram of the RISA model of
the 20 ft clear span with the factored design loads applied was shown in Figure 6-2. This can be
compared to the moment diagram of the SAP2000 model of the 20 ft clear span with the factored
design loads applied in Figure 6-5. The moment diagram of the RISA model of the 36 ft clear
span with the factored design loads applied was shown in Figure 6-4. This can be compared to
the moment diagram of the SAP2000 model of the 36 ft clear span with the factored design loads
applied in Figure 6-6. A summary of the comparison between moment magnitudes of the RISA
model to the moment magnitudes of the SAP2000 models is shown in Table 6-2.
Table 6-2: Comparison of RISA and SAP2000 Model Moments
Location
RISA Model – Equivalent 4 ft Wide
Section SAP2000 Model
20 ft Clear Span
Moment (k-ft)
36 ft Clear Span
Moment (k-ft)
20 ft Clear Span
Moment (k-ft)
36 ft Clear Span
Moment (k-ft)
Midspan 260 196 90 130
Corner 68 130 222 312
The moments from the RISA model and the SAP2000 model do not correlate well. In the
RISA model the midspan moment was the maximum. However, in the SAP2000 model the corner
moments were the maximum. One reason this could be the case is that the corner section
members in the SAP2000 model are deeper than those in the RISA model, therefore increasing
the stiffness and moment flow to those areas. The SAP2000 model made use of non prismatic
elements at the corner sections while the RISA model used prismatic elements assigned along a
slightly different centerline. Both nonlinear and linear analyses were performed in SAP2000.
Under the design loads being considered, the moment diagrams in both the linear and nonlinear
case were the same magnitude. This indicates that nonlinear effects did not have a significant
impact in the distribution of moments throughout the range of design loading.
Another possible source of difference is the incorporation of lateral springs in the RISA 3-D
models. The effect of the springs representing the resistance of soil along the vertical legs of the
RISA model have been added to account for additional soil pressure due to lateral deflection of
the legs. The results of the spring forces in the RISA models are reasonable based on the
experimental and analytical results with one exception. This exception is the spring at the bottom
of the bridge. Based on the boundary conditions in the field, the assumption was made that the
bottom of the bridge would act as a pin support. This was verified by the field serviceability test
where the additional pressure due to the loading was very small at the base of the wall indicating
a lack of outward deflection at the base of the wall. The RISA results for both bridges show
displacements at the bottom of the bridge. If these supports were changed to a pin support, the
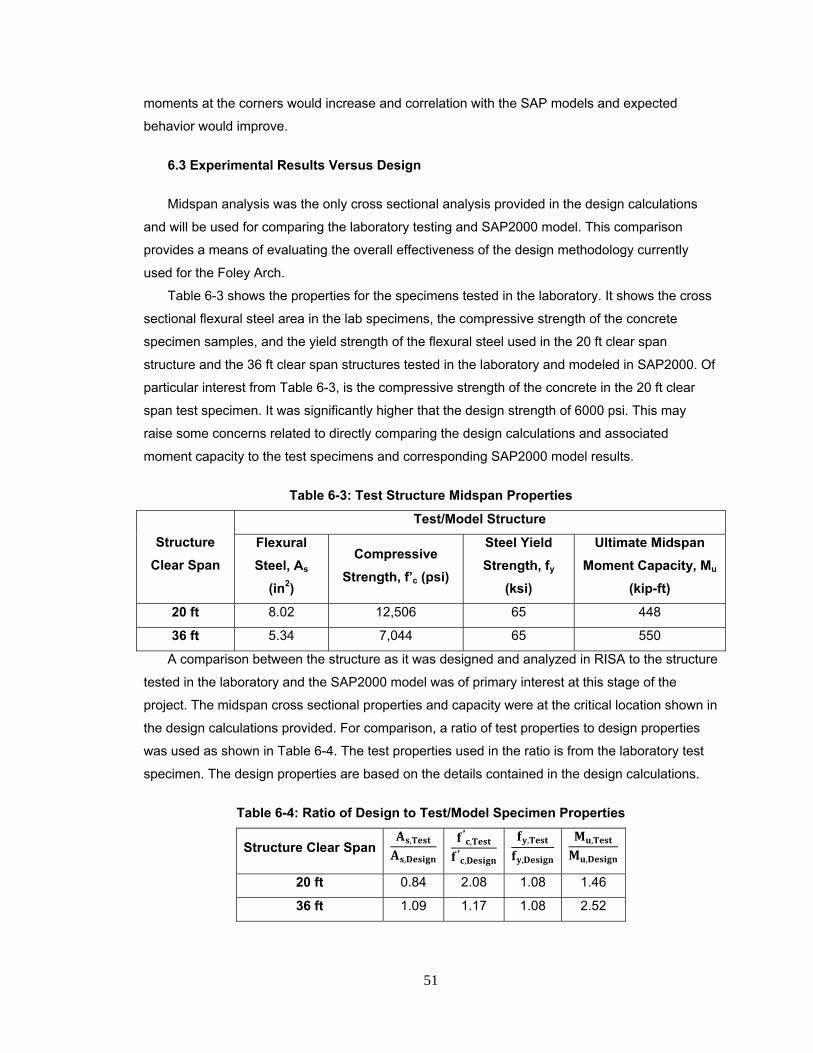
51
moments at the corners would increase and correlation with the SAP models and expected
behavior would improve.
6.3 Experimental Results Versus Design
Midspan analysis was the only cross sectional analysis provided in the design calculations
and will be used for comparing the laboratory testing and SAP2000 model. This comparison
provides a means of evaluating the overall effectiveness of the design methodology currently
used for the Foley Arch.
Table 6-3 shows the properties for the specimens tested in the laboratory. It shows the cross
sectional flexural steel area in the lab specimens, the compressive strength of the concrete
specimen samples, and the yield strength of the flexural steel used in the 20 ft clear span
structure and the 36 ft clear span structures tested in the laboratory and modeled in SAP2000. Of
particular interest from Table 6-3, is the compressive strength of the concrete in the 20 ft clear
span test specimen. It was significantly higher that the design strength of 6000 psi. This may
raise some concerns related to directly comparing the design calculations and associated
moment capacity to the test specimens and corresponding SAP2000 model results.
Table 6-3: Test Structure Midspan Properties
Structure
Clear Span
Test/Model Structure
Flexural
Steel, As
(in2)
Compressive
Strength, f’c (psi)
Steel Yield
Strength, fy
(ksi)
Ultimate Midspan
Moment Capacity, Mu
(kip-ft)
20 ft 8.02 12,506 65 448
36 ft 5.34 7,044 65 550
A comparison between the structure as it was designed and analyzed in RISA to the structure
tested in the laboratory and the SAP2000 model was of primary interest at this stage of the
project. The midspan cross sectional properties and capacity were at the critical location shown in
the design calculations provided. For comparison, a ratio of test properties to design properties
was used as shown in Table 6-4. The test properties used in the ratio is from the laboratory test
specimen. The design properties are based on the details contained in the design calculations.
Table 6-4: Ratio of Design to Test/Model Specimen Properties
Structure Clear Span,
,
′,
′,
,
,
,
,
20 ft 0.84 2.08 1.08 1.46
36 ft 1.09 1.17 1.08 2.52

52
The 20ft clear span structure and the 36ft clear span structure exceeded the required design
strength. The structures are safe as designed under the test conditions. It appears that the 20 ft
clear span test specimen had slightly less steel than called for in the reinforcement details in the
design calculations. At the time of testing the 20 ft clear span concrete had reached a much
higher compressive strength than was designed for. The effect of the small reduction in cross
sectional steel and the significant difference in compressive strength on the structure was
explored using the 20 ft clear span SAP2000 structural model. It was found that the difference in
ultimate capacity was small enough that it could be neglected for the purpose of evaluating the
design methodology. Based on the ratio of an average between the laboratory test and the model
results to the design calculations, the 20ft clear span specimen had a 30 percent higher moment
capacity at midspan than the design calculations for the same structure indicated. Based on the
ratio of an average between the laboratory test and the model results to the design calculations,
the 36ft clear span specimen had an 84 percent higher moment capacity at midspan than the
design calculations. Both designs, the 20 ft clear span and 36 ft clear span, were reasonably
effective. The 36 ft clear span is slightly higher than an ideal overstrength, but not to an exorbitant
or overly uneconomical point.
6.4 Chapter Summary
It was concluded from evaluation of the 20 ft clear span structure and the 36 ft clear span
structure that the designs were effective and the design methodology was reasonably well
representative of actual behavior of the structure when tested with the exception of the spring
support rather than the pin at the base. The designs are safe but not exceedingly overdesigned. It
was also concluded that the SAP200 models and the RISA models did not have the same
maximum moment locations under the factored design loads in the design calculations provided
by Foley due to a combination of thicker corner sections in the SAP2000 models as well as
springs incorporated into the RISA model, primarily the spring at the wall base, that were not in
the SAP2000 models. While there were slight differences in the RISA and SAP2000 models when
analyzed under approximately equivalent loads, this did not impact the determination of the
overall capacity of the structure. It was concluded that the way the design methodology is carried
out is safe and effective but the boundary conditions at the base should be modified to more
closely represent in-situ behavior.
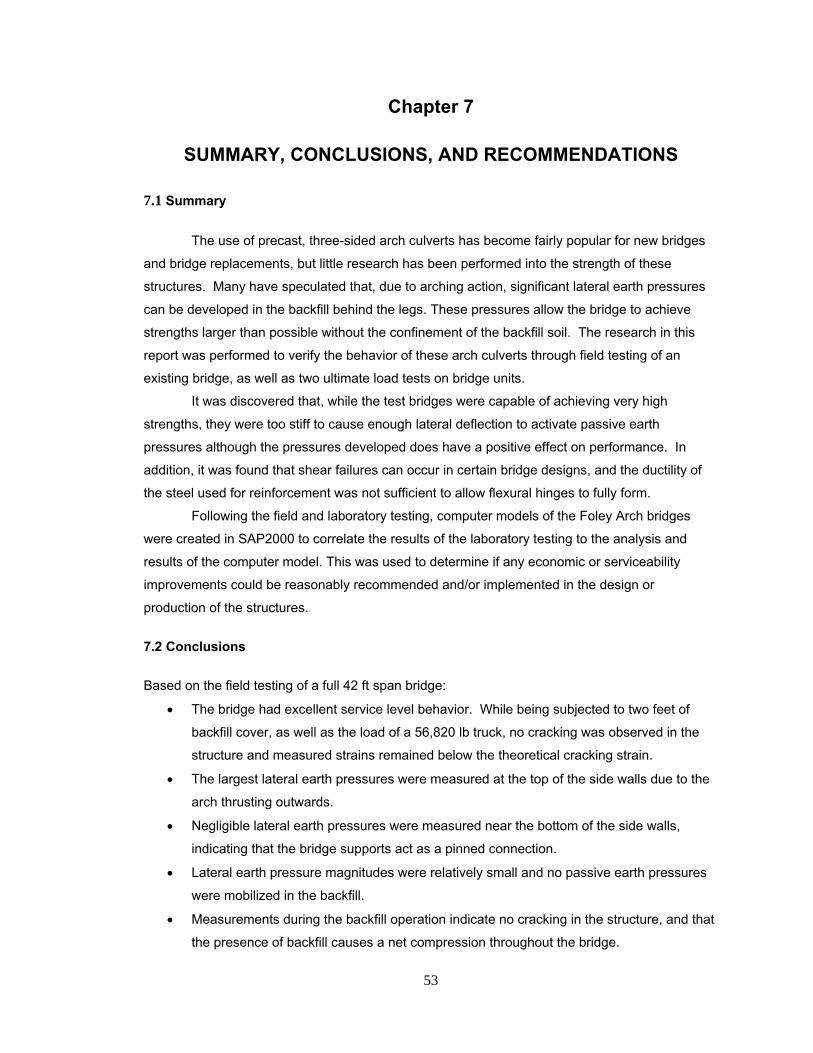
53
Chapter 7
SUMMARY, CONCLUSIONS, AND RECOMMENDATIONS
7.1 Summary
The use of precast, three-sided arch culverts has become fairly popular for new bridges
and bridge replacements, but little research has been performed into the strength of these
structures. Many have speculated that, due to arching action, significant lateral earth pressures
can be developed in the backfill behind the legs. These pressures allow the bridge to achieve
strengths larger than possible without the confinement of the backfill soil. The research in this
report was performed to verify the behavior of these arch culverts through field testing of an
existing bridge, as well as two ultimate load tests on bridge units.
It was discovered that, while the test bridges were capable of achieving very high
strengths, they were too stiff to cause enough lateral deflection to activate passive earth
pressures although the pressures developed does have a positive effect on performance. In
addition, it was found that shear failures can occur in certain bridge designs, and the ductility of
the steel used for reinforcement was not sufficient to allow flexural hinges to fully form.
Following the field and laboratory testing, computer models of the Foley Arch bridges
were created in SAP2000 to correlate the results of the laboratory testing to the analysis and
results of the computer model. This was used to determine if any economic or serviceability
improvements could be reasonably recommended and/or implemented in the design or
production of the structures.
7.2 Conclusions
Based on the field testing of a full 42 ft span bridge:
The bridge had excellent service level behavior. While being subjected to two feet of
backfill cover, as well as the load of a 56,820 lb truck, no cracking was observed in the
structure and measured strains remained below the theoretical cracking strain.
The largest lateral earth pressures were measured at the top of the side walls due to the
arch thrusting outwards.
Negligible lateral earth pressures were measured near the bottom of the side walls,
indicating that the bridge supports act as a pinned connection.
Lateral earth pressure magnitudes were relatively small and no passive earth pressures
were mobilized in the backfill.
Measurements during the backfill operation indicate no cracking in the structure, and that
the presence of backfill causes a net compression throughout the bridge.
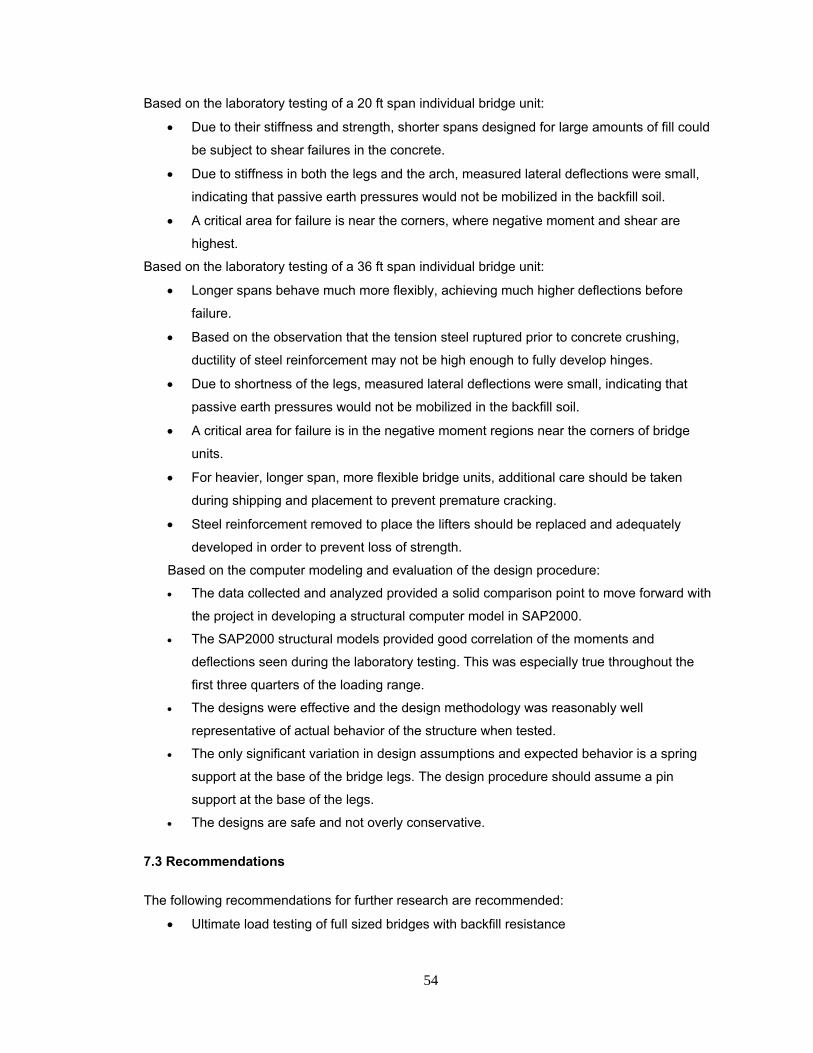
54
Based on the laboratory testing of a 20 ft span individual bridge unit:
Due to their stiffness and strength, shorter spans designed for large amounts of fill could
be subject to shear failures in the concrete.
Due to stiffness in both the legs and the arch, measured lateral deflections were small,
indicating that passive earth pressures would not be mobilized in the backfill soil.
A critical area for failure is near the corners, where negative moment and shear are
highest.
Based on the laboratory testing of a 36 ft span individual bridge unit:
Longer spans behave much more flexibly, achieving much higher deflections before
failure.
Based on the observation that the tension steel ruptured prior to concrete crushing,
ductility of steel reinforcement may not be high enough to fully develop hinges.
Due to shortness of the legs, measured lateral deflections were small, indicating that
passive earth pressures would not be mobilized in the backfill soil.
A critical area for failure is in the negative moment regions near the corners of bridge
units.
For heavier, longer span, more flexible bridge units, additional care should be taken
during shipping and placement to prevent premature cracking.
Steel reinforcement removed to place the lifters should be replaced and adequately
developed in order to prevent loss of strength.
Based on the computer modeling and evaluation of the design procedure:
The data collected and analyzed provided a solid comparison point to move forward with
the project in developing a structural computer model in SAP2000.
The SAP2000 structural models provided good correlation of the moments and
deflections seen during the laboratory testing. This was especially true throughout the
first three quarters of the loading range.
The designs were effective and the design methodology was reasonably well
representative of actual behavior of the structure when tested.
The only significant variation in design assumptions and expected behavior is a spring
support at the base of the bridge legs. The design procedure should assume a pin
support at the base of the legs.
The designs are safe and not overly conservative.
7.3 Recommendations
The following recommendations for further research are recommended:
Ultimate load testing of full sized bridges with backfill resistance

55
Testing of longer span units with taller leg heights to research effect of lateral
displacements and backfill pressure
Comparison testing of similar units in both a laboratory and field setting
56
REFERENCES
AASHTO (2002). ”AASHTO Standard Specifications for Highway Bridges, 17th Edition. Washington, D.C.
Foley Arch. (2010a). Bridge No. 145 over Wiley Branch Creek on SR 1121 (Cabarrus Station
Road). Calculations for Design of Precast Three Sided Arch Structure. Foley Arch. (2010b). S.R. 54/Jonesboro Rd. Bike and Pedestrian Underpass. Shop Drawings. Foley Arch. (2011). Auburn Test Specimen 36' Span x 9' Tall with 5 Feet of Fill. Calculations for
Design of Precast Three Sided Arch Structure. Jensen, T.J. (2012). Numerically Modeling Structural Behavior of Precast Three Sided Arch
Bridges for Design and Analysis. M.S. Thesis, Auburn University, May 2012. Meadows, R.L. (2012). Laboratory and Field Testing of Precast, Three Sided Arch Culverts. M.S.
Thesis, Auburn, University, May 2012. RISA Technologies (2012). “RISA 3-D Rapid Ineractive Structural Analysis – 3-Dimensional
User’s Guide. April 2012. http://www.risatech.com/documents/risa-3d/R3DUsers.pdf. SAP2000 (2010). SAP 2000 User’s Manual. Berkeley, CA. Computers and Structures, Inc.


