
1
Experimental study on condensation heat transfer and pressure drop of low GWP refrigerant HFO1234yf in a
horizontal tube
Linlin Wang*, Chaobin Dang, Eiji Hihara
Institute of Environmental Studies, Graduate School of Frontier Sciences, The University of Tokyo, 5-1-5
Kashiwanoha, Kashiwa-shi, Chiba, 277-8563, Japan
*Corresponding author. E-mail: [[email protected]] Tel./Fax: [+81 4 7136 4631]
Postal address: Environmental Studies Building #285, the University of Tokyo, 5-1-5 Kashiwanoha,
Kashiwa, Chiba 277-8563, Japan
Abstract
Condensation heat transfer of low GWP refrigerant HFO1234yf was measured in a horizontal tube (inner
diameter: 4 mm) at a mass flux range of 100 - 400 kg m-2 s-1 and different saturation temperatures (40, 45,
and 50 ºC), and the results were compared with that of R134a, and R32. Effects of mass flux, vapor quality,
saturation temperature, and thermophysical properties on the heat transfer coefficient were analyzed. Mass
flux and vapor quality were presented to primarily affect the heat transfer coefficient in shear-force
dominated flow regimes, whereas the thermal conductivity and density ratio are the primary parameters as
thermophysical properties influencing the heat transfer coefficient. Observed annular flow regimes agreed
with Tandon's flow pattern map. The measured pressure drop compared with that predicted by the
Lockhart-Matinelli correlation, Huang correlation and Haraguchi correlation. And, when comparing the
experimental heat transfer coefficient with four heat transfer coefficient correlations, the Haraguchi
correlation fairly agreed with the experimental data, with a 10.8 % mean deviation.
Keywords: Condensation heat transfer, HFO1234yf, R134a, R32, Heat transfer characteristic, Flow
pattern
1. Introduction
Increased attention to environmental problems has resulted in the evolution of refrigerants from
chlorofluorocarbans (CFCs), and hydrochlorofluorocarbans (HCFCs), to hydrofluorocarbans (HFCs).
Although HFC refrigerants have no ozone depletion potential (ODP), many of them have a relatively high
global warming potential (GWP). For example, R134a, having a GWP of 1300, is being used extensively in
automobile air conditioners (MACs). In order to reduce the environmental impact of MAC, HFO1234yf,
with a GWP as low as 4, has been proposed as a promising alternative refrigerant applied in MAC.
Some works (Barbara, M.,Mark, S.,2008) (SAE, 2009) have been conducted to clarify the characteristics

2
of HFO1234yf as a refrigerant, including flammability, toxicity, environmental impact, thermodynamic
properties; and material compatibility. However, few studies in the open literature have examined heat
transfer characteristics in a condenser using HFO1234yf, which is essential in the design and optimization
of HFO1234yf heat pump systems.
Many studies have proposed heat transfer models during condensation. Shah (1978) developed a
condensation heat transfer correlation based on their saturated boiling heat transfer correlation by noting
the similarity between the mechanisms of heat transfer during film condensation and boiling without
bubble nucleation. This correlation is only applicable for annular flow. Dobson (1994) and Dobson and
Chato (1998) experimentally studied the local heat transfer for in-tube condensation using R134a, R22,
R12, and near-azeotropic refrigerant blend R32/R125 in a smooth copper tube with an inner diameter (ID)
ranging from 3.14 mm to 7.04 mm. They developed two correlations based on the observed flow regimes
for wavy flow and annular flow, respectively, and utilized the Froude number as the criterion to distinguish
the transition of flow regimes. Soliman et al. (1971) and Soliman (1983, 1986) developed a theory for
correlating the mist-annular transition during condensation based on a balance of destructive and stabilizing
forces acting on the liquid film. On the basis of flow pattern observation, they proposed using the Froude
number and a modified Weber number to define the change from wavy to annular flow and annular to mist
flow, respectively. Haraguchi et al. (1994) experimentally studied the heat transfer coefficient and pressure
drop during condensation using R22, R134a, and R123 in an 8.4 mm ID horizontal smooth tube. On the
basis of the turbulent liquid film theory (Traviss et al., 1971) and Nusselt’s theory, they proposed an
empirical asymptotic equation with the power of 2 for predicting the local heat transfer coefficient. And,
they also proposed a empirical expression for predicting the local frictional pressure drop. Cavallini et al.
(2006) proposed a new simple method based on the flow pattern to determine the local heat transfer
coefficient during condensation in horizontal smooth tubes with ID > 3 mm. The proposed correlation
includes two equations for T-independent and T-dependent flow regions, respectively. Here, T refers to
the temperature difference between the saturation temperature and the wall temperature. In addition, Delcol
et al., (2010) compared the condensation heat transfer experimental results using HFO1234yf with
correlation of Cavallini et al. (2006). The study conducted by Delcol et al., (2010) is the only research
available in open literature on the condensation heat transfer of HFO1234yf. Recently, Saitoh et al. (2011)
published experimental results of the flow boiling heat transfer coefficient of HFO1234yf inside a smooth
small-diameter horizontal tube, and demonstrated that the boiling heat transfer coefficient of HFO1234yf is
approximately similar to that of R134a. Huang(2010) experimentally investigated the two-phase friction
pressure drop characteristics of R410A-oil mixture flow condensation inside 4.18mm and 1.6mm I.D.
horizontal smooth tubes. And based on the experimental results, they proposed a new correlation for the
frictional pressure drop.
In the present research, condensation heat transfer characteristics of HFO1234yf were experimentally
studies, and the results were compared to those of R134a and R32. The effects of various parameters,
including mass flux, vapor quality, saturation temperature and thermophysical properties on the
condensation heat transfer performance were discussed.
3
2. Experimental Apparatus
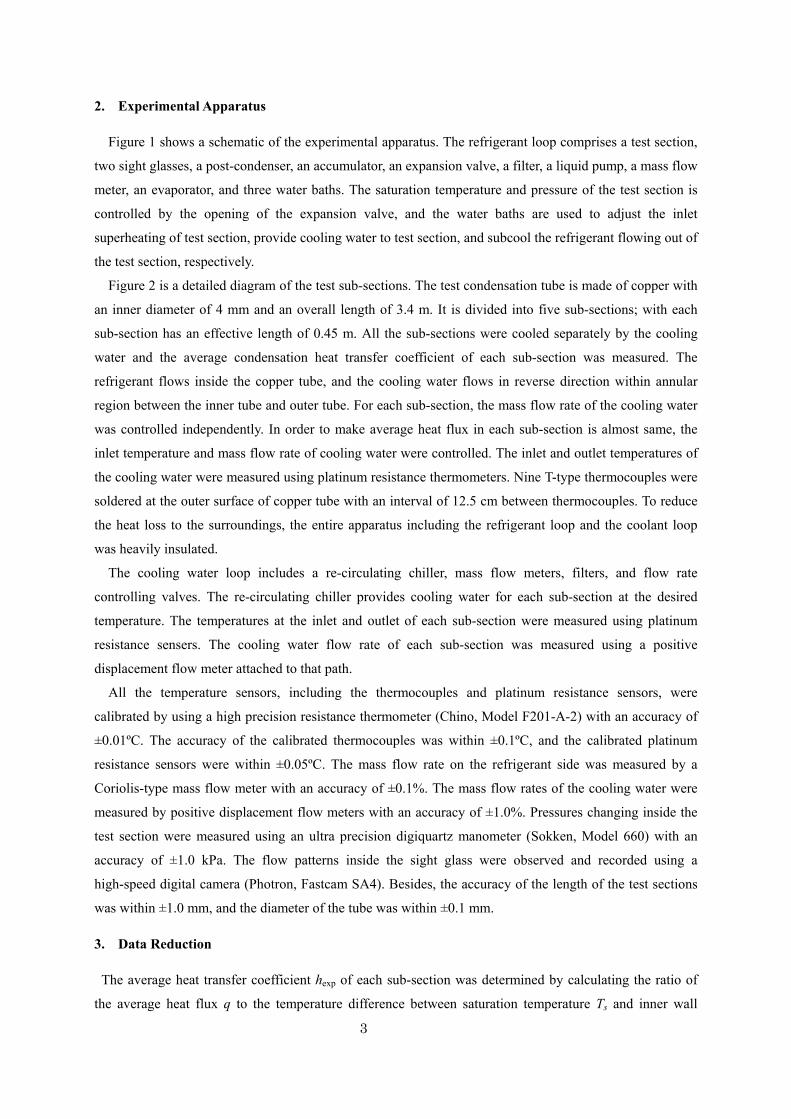
Figure 1 shows a schematic of the experimental apparatus. The refrigerant loop comprises a test section,
two sight glasses, a post-condenser, an accumulator, an expansion valve, a filter, a liquid pump, a mass flow
meter, an evaporator, and three water baths. The saturation temperature and pressure of the test section is
controlled by the opening of the expansion valve, and the water baths are used to adjust the inlet
superheating of test section, provide cooling water to test section, and subcool the refrigerant flowing out of
the test section, respectively.
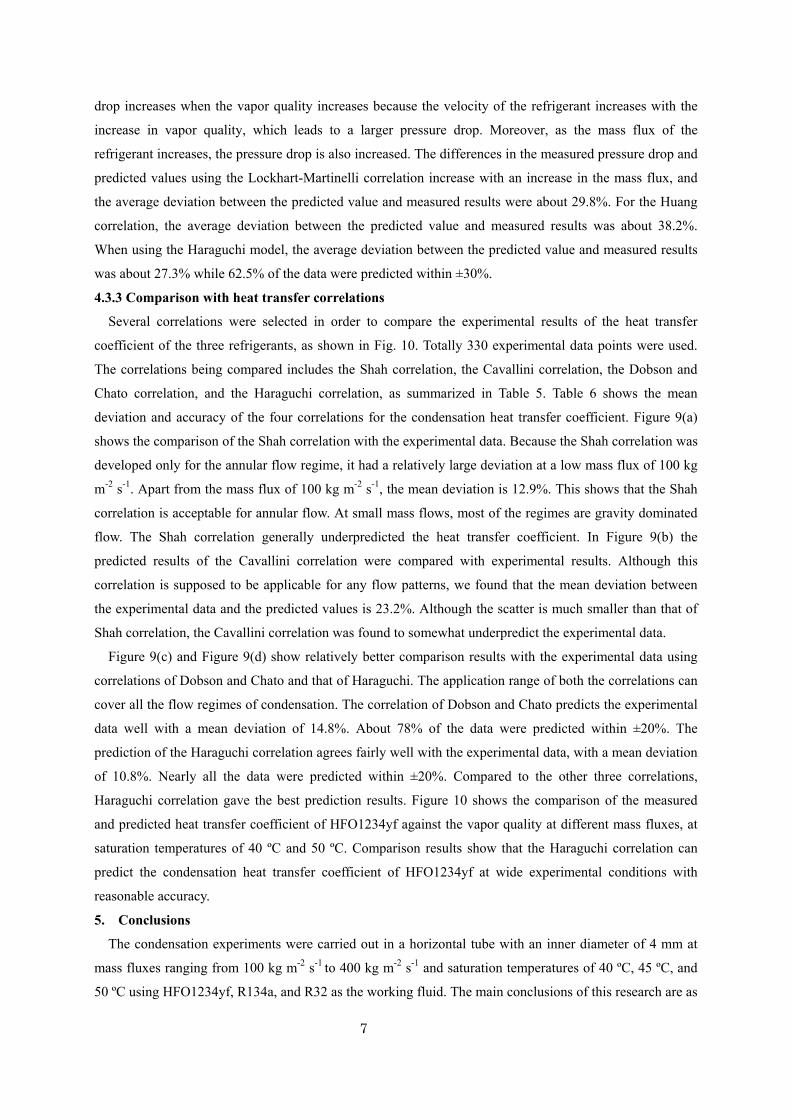
Figure 2 is a detailed diagram of the test sub-sections. The test condensation tube is made of copper with
an inner diameter of 4 mm and an overall length of 3.4 m. It is divided into five sub-sections; with each
sub-section has an effective length of 0.45 m. All the sub-sections were cooled separately by the cooling
water and the average condensation heat transfer coefficient of each sub-section was measured. The
refrigerant flows inside the copper tube, and the cooling water flows in reverse direction within annular
region between the inner tube and outer tube. For each sub-section, the mass flow rate of the cooling water
was controlled independently. In order to make average heat flux in each sub-section is almost same, the
inlet temperature and mass flow rate of cooling water were controlled. The inlet and outlet temperatures of
the cooling water were measured using platinum resistance thermometers. Nine T-type thermocouples were
soldered at the outer surface of copper tube with an interval of 12.5 cm between thermocouples. To reduce
the heat loss to the surroundings, the entire apparatus including the refrigerant loop and the coolant loop
was heavily insulated.
The cooling water loop includes a re-circulating chiller, mass flow meters, filters, and flow rate
controlling valves. The re-circulating chiller provides cooling water for each sub-section at the desired
temperature. The temperatures at the inlet and outlet of each sub-section were measured using platinum
resistance sensers. The cooling water flow rate of each sub-section was measured using a positive
displacement flow meter attached to that path.
All the temperature sensors, including the thermocouples and platinum resistance sensors, were
calibrated by using a high precision resistance thermometer (Chino, Model F201-A-2) with an accuracy of
±0.01ºC. The accuracy of the calibrated thermocouples was within ±0.1ºC, and the calibrated platinum
resistance sensors were within ±0.05ºC. The mass flow rate on the refrigerant side was measured by a
Coriolis-type mass flow meter with an accuracy of ±0.1%. The mass flow rates of the cooling water were
measured by positive displacement flow meters with an accuracy of ±1.0%. Pressures changing inside the
test section were measured using an ultra precision digiquartz manometer (Sokken, Model 660) with an
accuracy of ±1.0 kPa. The flow patterns inside the sight glass were observed and recorded using a
high-speed digital camera (Photron, Fastcam SA4). Besides, the accuracy of the length of the test sections
was within ±1.0 mm, and the diameter of the tube was within ±0.1 mm.
3. Data Reduction
The average heat transfer coefficient hexp of each sub-section was determined by calculating the ratio of
the average heat flux q to the temperature difference between saturation temperature Ts and inner wall

4
temperature Twall, as follows:
(1)
The average heat flux q was determined from the heat exchange rate Q at the cooling water side by using
the inlet and outlet temperatures (Tin, Tout) and the mass flow rate mw:
(2)
(3)
The inner wall temperature Twall of the copper tube was derived from the measured outer wall temperature
Two and the heat exchange rate Q:
(4)
The saturation temperature was calculated from the corresponding saturation pressure. The refrigerant side
pressures were measured at three locations along the entire condensation tube. The pressure at the inlet and
outlet of each sub-section was calculated by linearly interpolating the measured values.
4. Results and Discussion
4.1 Heat transfer characteristics of HFO1234yf
4.1.1 Uncertainty of the heat transfer coefficients
Figure 3 shows examples of the measured heat transfer coefficients of HFO1234yf at a saturation
temperature of 45 ºC with the mass fluxes ranging from 100 kg m-2 s-1to 400 kg m-2 s-1. The measurement
uncertainty of the heat transfer coefficient is illustrated using a vertical error bar for each experimental data.
In general, the first measured point near the condenser entrance has the largest measurement uncertainty
because the temperature difference between the saturation temperature and wall temperature is small. At a
mass flux of 100 kg m-2 s-1, the first point may have an uncertainty of up to 21%. The average measurement
uncertainty of the heat transfer coefficient at this mass flux is 14%. At mass fluxes ranging from 200 kg m-2
s-1 to 400 kg m-2 s-1, the measurement uncertainty of the heat transfer coefficient is relatively small, mostly
below 10%, and has an average value of 7.8%. The measurement uncertainties in the case of other pure
refrigerants and other saturation temperatures have similar trends and values.
4.1.2 Effects of mass flux and vapor quality
Figure 3 also shows the effects of mass flux and vapor quality on the heat transfer coefficient of
HFO1234yf at a saturation temperature of 45 ºC. The heat transfer coefficient increases with an increase in
mass flux and vapor quality, especially when the mass flux is larger than 200 kg m-2 s-1. At annular flow
regimes (force convection condensation in shear dominated flow regimes), the heat transfer coefficient is
primarily influenced by the mass flux and vapor quality. The difference in the heat transfer coefficient for
mass fluxes ranging between 100 kg m-2 s-1 and 200 kg m-2 s-1 is small because the flow patterns are
primarily gravity-dominated flow regimes. As demonstrated by Dobson and Chato (1998), during
condensation, the heat transfer mechanism can be divided into three parts: shear-dominated flow regime,
gravity-dominated flow regime and an intermediate flow region. In shear-dominated flow regime, the local
heat transfer coefficient is primarily affected by the mass flux and vapor quality. In contrast, in the
gravity-dominated flow regime, the local heat transfer coefficient is mainly affected by the temperature
( )p w out inQ c m T T
exps wall
qh
T T
dl
ln( / )( ) ( ) ( )
2o
wi wo i
d dT x T x Q x
l

5
difference between the wall and bulk refrigerant. Whereas for intermediate flow regime, both the above
mentioned heat transfer mechanisms exist in the heat transfer process. At mass fluxes of 100 kg m-2 s-1 and
200 kg m-2 s-1, when vapor quality were less than 0.5, the difference of the heat transfer coefficients is small
at these two mass flux, and the vapor quality change little, which means that the mass flux and vapor
quality have little influence on heat transfer coefficient. This is especially the case when the heat transfer is
entirely in the gravity- dominated flow regimes where the main thermal resistance is film thickness for heat
transfer.
4.1.3 Effects of saturation temperature
Figure 4 shows the effect of the saturation temperature on the heat transfer coefficient of HFO1234yf at
saturation temperatures of 40 ºC and 50 ºC, with mass fluxes ranging from 100 kg m-2 s-1 to 400 kg m-2 s-1.
The heat transfer coefficient was found to decreases slightly at same mass fluxes as the saturation
temperature increased. Table1 shows the thermodynamic properties of HFO1234yf at the saturation
temperature of 40 ºC and 50 ºC. At a saturation temperature of 40 ºC, the liquid/gas density ratio is 17.9,
and thermal conductivity of the liquid is 63.0 mW m-1K-1. At a saturation temperature of 50 ºC, the
liquid/gas density ratio is 13.1, and thermal conductivity of the liquid is 59.7 mW m-1K-1. Two main
reasons for the heat transfer coefficient to decrease as the saturation temperature increases are the decrease
in the liquid/gas density ratio and the thermal conductivity of the liquid. And, the effects of saturation
temperature show a little different in each mass flux condition. In the case of mass flux of 400 kg m-2 s-1,
there are large differences relatively. On the other hand, in the case of mass flux of 100 kg m-2 s-1, the
differences are very small. The reason of this difference may be come from the measuring error.
4.1.4 Observation of two-phase flow regimes
Figure 5 shows the recorded images of two-phase flow patterns together with the measured heat transfer
coefficients of HFO1234yf at a saturation temperature of 50 ºC. The value of vapor quality of the recorded
images is from 0.9 to 0.1 about every 0.2. At a mass flux of 100 kg m-2 s-1, the wavy flow was prevalent
over most of the vapor quality range. At a low vapor quality, the heat transfer coefficients increase slightly
with increasing vapor quality, especially at end of part due to the heat transfer is dominated mainly by
intermediate flow region and gravity-dominated flow regime.
For a mass flux of 200 kg m-2 s-1, approximately half of the vapor quality range is occupied by annular
flow regimes. The heat transfer coefficients increase gradually with increasing vapor quality. The heat
transfer is dominated by shear-dominated flow regime at the beginning of condensing, and then, fall into
intermediate flow region, at latter part of vapor quality, is entirely gravity-dominated flow regime.
At mass fluxes ranging bwteen 300 kg m-2 s-1 and 400 kg m-2 s-1, annular flow was prevalent over most
of the vapor quality range. There is a clear dependency of the heat transfer coefficient on the vapor quality
and the mass flux. As the vapor quality increases, the heat transfer coefficient also increases. The heat
transfer is primarily in the shear-dominated flow regimes.
4.2 Effects of refrigerants properties on the heat transfer coefficient
The measured heat transfer coefficients of HFO1234yf were compared to those of R134a and R32 to
analyze the effect of the thermal physical properties of the refrigerants on the heat transfer coefficient.

6
Comparisons of refrigerant properties at a saturation temperature of 40 ºC are listed in Table2. The primary
thermal-physical properties that influence the heat transfer coefficient are the density and viscosity of liquid
and vapor, and their ratio, together with the thermal conductivity.
Figure 6 shows the tendency of the heat transfer coefficient and the differences between the three
refrigerants. R32 has the highest heat transfer coefficients. While the heat transfer coefficients of
HFO1234yf are a little lower than that of R134a at the same condition because the thermal-physical
properties of HFO1234yf (density ratio, viscosity ratio of liquid and vapor, the thermal conductivity) are all
a little lower than that of R134a. The largest difference of heat transfer coefficient between HFO1234yf and
R134a is 23.8% at mass flux of 100 kg m-2 s-1.
4.3 Comparison with correlations
4.3.1 Comparison with flow regime maps
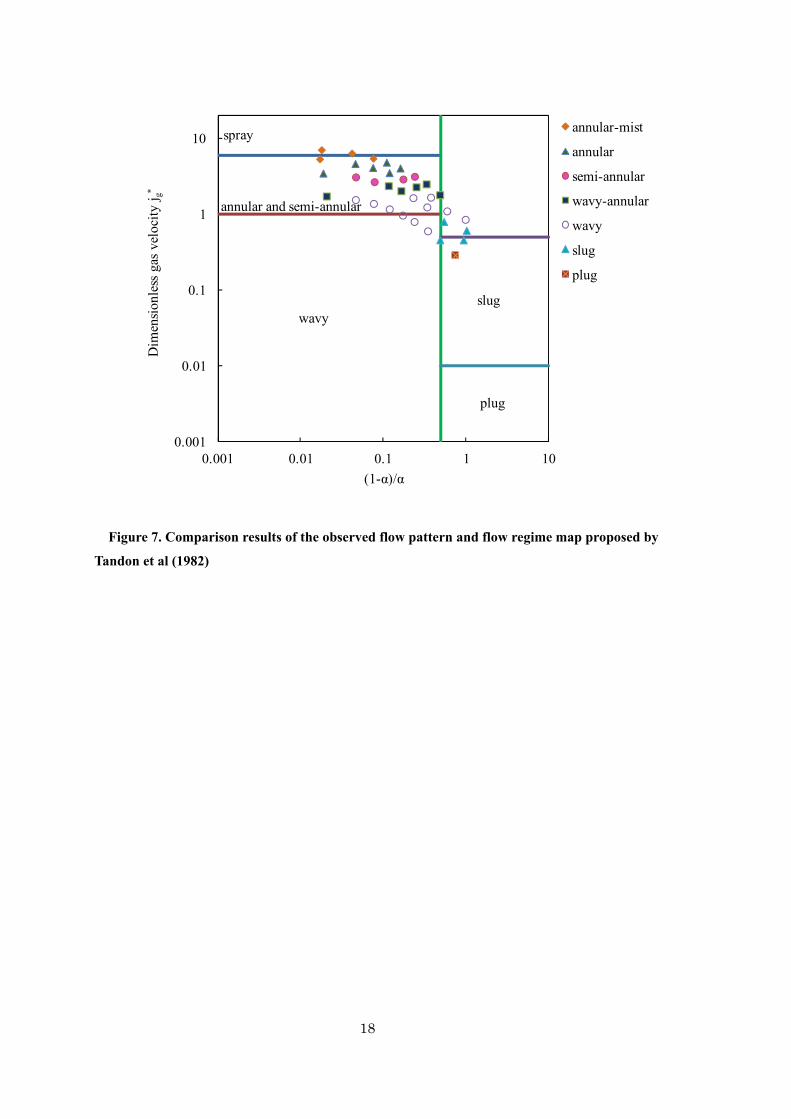
The flow regime map proposed by Tandon et al (1982) is used in this research and compared with the
flow pattern of HFO1234yf in 4mm tube observed. The map uses the dimensionless vapor superficial
velocity j*g and parameter (1-α)/α as coordinates expressed as follows. Table 3 shows the flow regimes and
parameter ranges.
(5)
(6)
Figure 7 shows the comparison between the observed flow pattern and the flow regime map proposed by
Tandon et al. As shown in this figure, almost all the observed annular flow patterns, including annular-mist,
annular, semi-annular, and wavy-annular, fall into annular and semi-annular flow regimes map proposed by
Tandon. The results show that this flow regime map can predict annular flow reliably. For the wavy flow
observed in this study, half of experimental data were plotted outside the boundary of the wavy flow regime
map and fall into annular and semi-annular flow regimes. The experimental data values resulting in
wavy-annular flow could be attributed to the observation deviation. Slug flow and plug flow patterns are
rarely observed in the flow pattern obtained experimentally, in addition, these two flow patterns cannot be
predicted accurately using this flow regime map. The flow patterns observed can be attributed to the
difference in definitions of the various flow patterns existing, which is somewhat subjective, especially for
intermittent flow.
4.3.2 Comparison with pressure drop correlations
Figure 8 shows the measured pressures drop compared with the predicted values using the
Lockhart-Martinelli correlation, Huang correlation, Haraguchi correlatoin added acceleration pressure drop
as a function of the vapor quality of HFO1234yf at mass fluxes ranging from 100 kg m-2 s-1 to 400 kg m-2
s-1, at a saturation temperature of 45 ºC. Table 4 summarizes the Lockhart-Martinelli correlation, Huang
correlation, and Haraguchi correlatoin. Both the measured and predicted results showed that the pressure
1/ 2*j /g gGx gD
1
10.4
11 / 0.4 0.6
11 0.4
L
gg L
xxxxx
x
7
drop increases when the vapor quality increases because the velocity of the refrigerant increases with the
increase in vapor quality, which leads to a larger pressure drop. Moreover, as the mass flux of the
refrigerant increases, the pressure drop is also increased. The differences in the measured pressure drop and
predicted values using the Lockhart-Martinelli correlation increase with an increase in the mass flux, and
the average deviation between the predicted value and measured results were about 29.8%. For the Huang
correlation, the average deviation between the predicted value and measured results was about 38.2%.
When using the Haraguchi model, the average deviation between the predicted value and measured results
was about 27.3% while 62.5% of the data were predicted within ±30%.
4.3.3 Comparison with heat transfer correlations
Several correlations were selected in order to compare the experimental results of the heat transfer
coefficient of the three refrigerants, as shown in Fig. 10. Totally 330 experimental data points were used.
The correlations being compared includes the Shah correlation, the Cavallini correlation, the Dobson and
Chato correlation, and the Haraguchi correlation, as summarized in Table 5. Table 6 shows the mean
deviation and accuracy of the four correlations for the condensation heat transfer coefficient. Figure 9(a)
shows the comparison of the Shah correlation with the experimental data. Because the Shah correlation was
developed only for the annular flow regime, it had a relatively large deviation at a low mass flux of 100 kg
m-2 s-1. Apart from the mass flux of 100 kg m-2 s-1, the mean deviation is 12.9%. This shows that the Shah
correlation is acceptable for annular flow. At small mass flows, most of the regimes are gravity dominated
flow. The Shah correlation generally underpredicted the heat transfer coefficient. In Figure 9(b) the
predicted results of the Cavallini correlation were compared with experimental results. Although this
correlation is supposed to be applicable for any flow patterns, we found that the mean deviation between
the experimental data and the predicted values is 23.2%. Although the scatter is much smaller than that of
Shah correlation, the Cavallini correlation was found to somewhat underpredict the experimental data.
Figure 9(c) and Figure 9(d) show relatively better comparison results with the experimental data using
correlations of Dobson and Chato and that of Haraguchi. The application range of both the correlations can
cover all the flow regimes of condensation. The correlation of Dobson and Chato predicts the experimental
data well with a mean deviation of 14.8%. About 78% of the data were predicted within ±20%. The
prediction of the Haraguchi correlation agrees fairly well with the experimental data, with a mean deviation
of 10.8%. Nearly all the data were predicted within ±20%. Compared to the other three correlations,
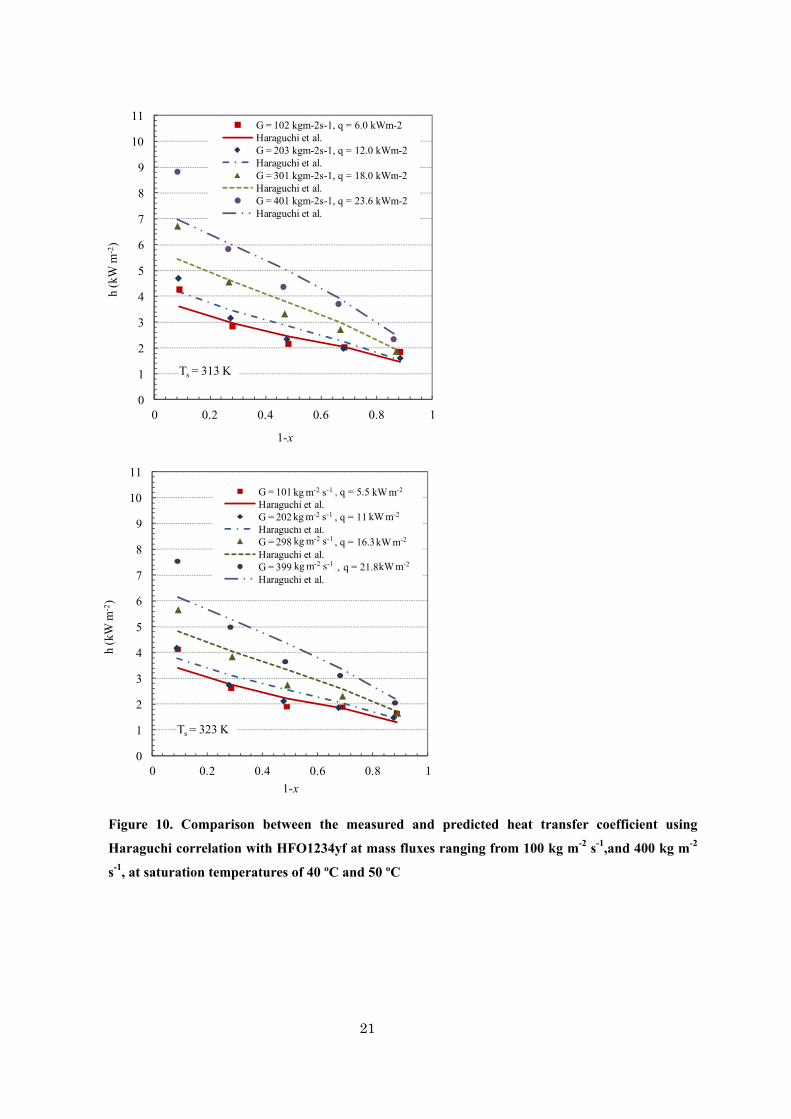
Haraguchi correlation gave the best prediction results. Figure 10 shows the comparison of the measured
and predicted heat transfer coefficient of HFO1234yf against the vapor quality at different mass fluxes, at
saturation temperatures of 40 ºC and 50 ºC. Comparison results show that the Haraguchi correlation can
predict the condensation heat transfer coefficient of HFO1234yf at wide experimental conditions with
reasonable accuracy.
5. Conclusions
The condensation experiments were carried out in a horizontal tube with an inner diameter of 4 mm at
mass fluxes ranging from 100 kg m-2 s-1 to 400 kg m-2 s-1 and saturation temperatures of 40 ºC, 45 ºC, and
50 ºC using HFO1234yf, R134a, and R32 as the working fluid. The main conclusions of this research are as
8
follows:
1. The effects of mass flux and vapor quality on the heat transfer coefficient are primarily observed in the
shear-force dominated flow regimes when the mass flux is high or the vapor quality is high.
2. The effects of thermophysical properties on the heat transfer coefficient at different saturations
temperature using different refrigerants were analyzed. The results show that the thermal conductivity,
density ratio and viscosity ratio play an important role in the variation of the heat transfer coefficient.
3. Flow patterns were also observed to help in the analysis of the changing tendency of the heat transfer
coefficient, and the tendencies were compared with the flow pattern map. The flow pattern map proposed
by Tandon et al (1982) could predict the annular flow well.
4. The Haraguchi correlation for predicting the local frictional pressure drop can predict the measured
pressure drop best compared to the Lockhart-Martinelli correlation and Huang correlation.
5. The experimental heat transfer coefficient was compared with four heat transfer coefficient correlations.
The results showed that the Haraguchi correlation agrees reasonably with the experimental data values,
with a mean deviation of 10.8%.
Nomenclature
C constant in Lockhart-Martinelli correlation
cp specific heat capacity, J kg-1 K-1
d inner diameter of tube, mm
do outer diameter of tube, mm
f fanning friction factor
Fr Froude number
Fr* modified Froude number
g acceleration of gravity, m s-2
G mass flux, kg m-2s-1
Ga Galileo number 3
2
( )l l g
l
g d
hexp experimental condensation heat transfer coefficient, kW m-2 K-1
hlg latent heat, kJ kg-1
j*g dimensionless vapor superficial velocity
Ja Jakob number c ( )p sat w
lg
T T
h
JG 0.5
/ ( )g l gxG gD
TGJ transition dimensionless gas velocity
l length of test section, m
9
mw mass flow rate of water, kg s-1
Nu Nusselt number
p pressure, kPa
Pr reduced pressure
Pr Prandtl number
q heat flux, kW m-2
Q heat exchange rate, kW
Re Reynolds number
l0l
ReGd
,
g0g
ReGd
ll
(1 )Re
G x d
, g
g
ReGxd
Tin inlet temperature, K
Tout outlet temperature, K
Ts saturation temperature, K
Twall inside-wall temperature, K
Two outer wall temperature, K
T (Ts-Twall), ºC
x vapor quality
Xtt Lockhart-Martinelli parameter
0.10.50.9g l
l g
1 x
x
z coordinate along the tube direction, m
Greek symbols
α void fraction
θl angle subtended from the top of tube to the liquid level
thermal conductivity, W m-1 K-1
viscosity, Pa·s
density, kg m-3
surface tension, N m-1
V two-phase flow multiplier for frictional pressure drop
0.75
0.351 0.5 tt
g l g
GX
gd
Subscripts
a T independent flow regime
B free convect ion
d T dependent flow regime
f frictional
F forced convection
g saturated vapor

10
g0 all mixture assumed to be gas
h homogeous
l0 all mixture assumed to be liquid
l ,L liquid phase
sat saturat ion
st ra fully stratified flow regime
Acknowledgements
This study was sponsored by the New Energy and Industrial Technology Development Organization,
Japan, for the project titled “Development of Non-fluorinated Energy-Saving Refrigeration and Air
Conditioning Systems. ”
References
Barbara, M.,Mark, S.,2008. HFO-1234yf Low GWP Refrigerant Update, International Refrigeration and
Air Conditioning Conference
SAE, 2009, Industry evaluation of low global warming potential refrigerant HFO-1234yf, SAE CRP-1234,
http://www.sae.org/standardsdev/tsb/cooperative/crp1234-3.pdf
Cavallini, A., Censi, G., Del Col, D., Doretti, L., Longo, G.A., Rossetto, L., 2003. Condensation inside and
outside smooth and enhanced tubes: a review of recent research. Int. J. Refrigeration, 26, 373-392.
Cavallini, A., Censi, G., Del Col, D., Doretti, L., Matkovic, M., Rossetto, L., Zilio, C., 2006. Condensation
in horizontal smooth tubes: a new heat transfer model for heat exchanger design. Heat Transfer Eng. 27,
31-38.
Cavallini, A., Censi, G., Del Col, D., Doretti, L., Longo, G.A., Rossetto, L., 2001. Experimental
investigation on condensation heat transfer and pressure drop of new HFC refrigerants(R134a, R125, R32,
R410A,R326ea)in a horizontal smooth tube. Int. J. Refrigeration, 24, 73-87.
Chisholm, D., 1967. A theoretical basis for the Lockhart-Martinelli correlation for two-phase flow. Int. J.
Heat Mass Transf. 10, 1767–1778.
Del Col, D., Torresin, D., Cavallini, A., 2010. Heat transfer and pressure drop during condensation of the
low GWP refrigerant R1234yf. Int. J. Refrigeration, 33, 1307-1318.
Dobson, M. K., Chato, J. C., Hinde, D.K., Wang, S.P., 1994. Experimental evaluation of internal
condensation of refrigerants R12 and R134a. ASHRAE Trans. 100, 744-754.
Dobson, M.K., Chato, J.C., 1998. Condensation in smooth horizontal tubes, Int. J. Heat Transf., 120,
193-213.
Dobson, M. K., 1994. Heat transfer and flow regimes during condensation in horizontal tubes. ACRC
TR-57.
Friedel, L., 1979. Improved pressure drop correlations for horizontal and vertical two phase pipe flow. 3R
Int., 18, 485-492.
Haraguchi, H., Koyama, S., Fujii, T., 1994. Condensation of refrigerants HCFC22, HFC134a and

11
HCFC123 in a horizontal smooth tube (1st Report, Proposals of Empirical Expressions for the Local
Frictional Pressure drop). Transactions of the Japan Society of Mechanical Engineers 60, 2117-2124.
Haraguchi, H., Koyama, S., Fujii, T., 1994. Condensation of refrigerants HCFC22, HFC134a and
HCFC123 in a horizontal smooth tube (2nd Report, Proposals of Empirical Expressions for Local Heat
Transfer Coefficient). Transactions of the Japan Society of Mechanical Engineers 60, 2117-2124.
Huang, X.C., Ding, G.L., Hu, H.T., Zhu, Y., Gao, Y.F., Deng, B.D., 2010. Two-phase frictional pressure
drop Characteristics of R410A-oil mixture flow condensation inside 4.18mm and 1.6mm I.D. horizontal
smooth tubes, HVAC&R Research 16(4),453-470.
Lockhart, R.W., Martinelli, R.C., 1949. Proposed correlation of data for isothermal two-phase,
two-component flow in a pipe. Chem. Eng. Prog., 45, 39-48.
Matkovic, M., Cavallini, A., Del Col, D., Rossetto, L., 2009. Experimental study on condensation heat
transfer inside a single circular minichannel. Int. J. Heat and Mass Transf., 52, 2311-2323.
Ghiaasiaan, S.M., 2008. Two-Phase Flow, Boiling, and Condensation in Conventional and Miniature
Systems. Cambridge University Press, Cambridge.
Saitoh, S., Dang, C., Nakamura, Y., Hihara, E., 2011. Boiling heat transfer of HFO-1234yf flowing in a
smooth small-diameter horizontal tube. Int. J. Refrigeration. “in press”
Soliman, H.M., 1983. Correlation of mist-to-annular transition during condensation,. Can. J. Chem.
Eng. 61, 178–182.
Soliman, H.M., 1986. The mist-annular transition during condensation and its influence on the heat transfer
mechanism. Int. J. Multiphase Flow, 12, 277-288.
Soliman, H.M., Azer, N.Z., 1971. Flow patterns during condensation inside a horizontal tube. ASHRAE
Trans. 77, 210-224.
Shah, M.M., 1978. A general correlation for heat transfer during film condensation insides pipes. Int. J.
Heat Mass Transf., 22, 547-556.
Smith, S.L., 1969-1970. Void fractions in two-phase flow: a correlation based upon an equal velocity heat
model. Proc. Inst. Mech. Eng., 184, 647-657.
Tandon, T.N., Varma, H.K., Gupta, G. P., 1982. A new flow regimes map for condensation inside horizontal
tubes. Int. J. Heat Transf., 104, 763-768.
Thome, J.R., El Hajal, J., Cavallini, A., 2003. Condensation in horizontal tubes, part 2: new heat transfer
model based on flow regimes. Int. J. Heat Mass Transf., 46, 3365-3378.
Traviss, D.P., Rohsenow, W.M., Baron, A.B., 1973. Forced convective condensation in tubes: a heat
transfer correlation for condenser design. ASHRAE Trans., 79, 157-165.

12
Figure 1. Schematic of the experimental apparatus
Water bath
Wat
er b
ath
Wat
er
bath
Eva
pora
tor
Pos
t-co
nden
ser
Acc
umul
ator
Sig
ht g
lass
By
pass
Test section
T
Sight glass
Mass flow meter
Expansion valve
Liquid pump
MT
P T P
T
P
T

13
Figure 2. Detailed diagram of the test sub-sections
125mm
450mm
A
A Cooling water
Refrigerant
¢ 4
mm
¢ 10
mm
A-A
Top
Bottom
Side

14
0
2
4
6
8
10
0 0.2 0.4 0.6 0.8 1
h(k
W m
-2)
1-x
G = 102 kgm-2s-1, q = 5.6 kW/m2
G = 198 kgm-2s-1, q = 11.2 kW/m2
G = 298 kgm-2s-1, q = 16.8 kW/m2
G = 398 kgm-2s-1, q = 22.5 kW/m2
kW m-2
kW m-2
kW m-2
kW m-2
kg m-2 s-1
kg m-2 s-1
kg m-2 s-1
kg m-2 s-1
Figure 3. Effects of mass flux on the heat transfer coefficient of HFO1234yf at a saturation
temperature of 45 ºC

15
0
2
4
6
8
10
0 0.2 0.4 0.6 0.8 1
h(k
W m
-2)
1-x
Ts = 313 K, G = 102 kgm-2s-1, q = 6.0 kWm-2
Ts = 323 K, G = 101 kgm-2s-1, q = 5.5 kWm-2
Ts = 313 K, G = 401 kgm-2s-1, q = 23.6 kWm-2
Ts = 323 K, G = 399 kgm-2s-1, q = 21.8 kW/m2
kg m-2 s-1 kW m-2
kW m-2
kW m-2
kW m-2
kg m-2 s-1
kg m-2 s-1
kg m-2 s-1
Figure 4. Effect of saturation temperatures at 40 ºC and 50 ºC on the heat transfer coefficient of
HFO1234yf

16
Figure 5. Observation of two-phase flow regimes of HFO1234yf at a saturation temperature of 50 ºC
0
1
2
3
4
5
6
7
8
0 0.2 0.4 0.6 0.8 1
h(k
W m
-2)
1-x
G = 101 kgm-2s-1, q = 5.5 kWm-2kW m-2kg m-2 s-1
plug wavy annular wavy wavy wavy
0.904 0.71 0.5 0.31 0.15
0
1
2
3
4
5
6
7
8
0 0.2 0.4 0.6 0.8 1
h(k
W m
-2)
1-x
G = 202 kgm-2s-1, q = 11 kWm-2kW m-2kg m-2 s-1
wavy annular annular wavy slug semi-
annular
0.91 0.705 0.52 0.32 0.11
0
1
2
3
4
5
6
7
8
0 0.2 0.4 0.6 0.8 1
h(k
W m
-2)
1-x
G = 298 kgm-2s-1, q = 16.3 kWm-2kg m-2 s-1 kW m-2
mist- annular annular wavy
slug semi- annular
0.92 0.71 0.5 0.29 0.106
0
1
2
3
4
5
6
7
8
0 0.2 0.4 0.6 0.8 1
h(k
W m
-2)
1-x
G = 399 kgm-2s-1, q = 21.8 kWm-2kg m-2 s-1 kW m-2
mist-annular annular wavy wavy-
annular mist-annular
0.916 0.71 0.52 0.32 0.11

17
Figure 6. Heat transfer coefficient of R134a, HFO1234yf, and R32 at mass fluxes ranging from 100
kg m-2 s-1 to 300 kg m-2 s-1
0
2
4
6
8
10
12
0 0.2 0.4 0.6 0.8 1
h(k
W m
-2)
1-x
R134a, G = 303 kgm-2s-1, q = 21.6 kWm-2
HFO1234yf, G = 301 kgm-2s-1, q = 18 kWm-2
R32, G = 301 kgm-2s-1, q = 31.7 kWm-2
kW m-2
kW m-2
kW m-2
kg m-2 s-1
kg m-2 s-1
kg m-2 s-1
0
2
4
6
8
10
12
0 0.2 0.4 0.6 0.8 1
h(k
W m
-2)
1-x
R134a, G = 199 kgm-2s-1, q = 14.5 kWm-2
HFO1234yf, G = 203 kgm-2s-1, q = 12.2 kWm-2
R32, G = 202 kgm-2s-1, q = 21.2 kWm-2
kg m-2 s-1
kW m-2
kW m-2
kW m-2
kg m-2 s-1
kg m-2 s-1
0
2
4
6
8
10
12
0 0.2 0.4 0.6 0.8 1
h(k
W m
-2)
1-x
R134a, G = 105 kgm-2s-1, q = 7.4 kWm-2
HFO1234yf, G = 102 kgm-2s-1, q = 6.0 kWm-2
R32, G = 100 kgm-2s-1, q = 10.6 kWm-2
kg m-2 s-1 kW m-2
kW m-2
kW m-2
kg m-2 s-1
kg m-2 s-1
18
0.001
0.01
0.1
1
10
0.001 0.01 0.1 1 10
Dim
ensi
onle
ss g
as v
eloc
ity
j g*
(1-α)/α
annular-mist
annular
semi-annular
wavy-annular
wavy
slug
plug
plug
spray
slugwavy
annular and semi-annular
Figure 7. Comparison results of the observed flow pattern and flow regime map proposed by
Tandon et al (1982)

19
1130
1135
1140
1145
1150
1155
1160
1165
1170
1175
1180
0 0.2 0.4 0.6 0.8 1
p (k
Pa)
1‐x
Experimental data, G = 100 kg/m2sLockhart-Matinelli correlationExperimental data, G = 198 kg/m2sLockhart-Matinelli correlationExperimental data, G = 298 kg/m2sLockhart-Matinelli correlationExperimental data, G = 398 kg/m2sLockhart-Matinelli correlation
kg m-2 s-1
kg m-2 s-1
kg m-2 s-1
kg m-2 s-1
1130
1135
1140
1145
1150
1155
1160
1165
1170
1175
1180
0 0.2 0.4 0.6 0.8 1
p (k
Pa)
1‐x
Experimental data, G = 100 kg/m2sHuang correlationExperimental data, G = 198 kg/m2sHuang correlationExperimental data, G = 298 kg/m2sHuang correlationExperimental data, G = 398 kg/m2sHuang correlation
kg m-2 s-1
kg m-2 s-1
kg m-2 s-1
kg m-2 s-1
1130
1135
1140
1145
1150
1155
1160
1165
1170
1175
1180
0 0.2 0.4 0.6 0.8 1
p (k
Pa)
1‐x
Experimental data, G = 100 kg/m2sHaraguchi correlationExperimental data, G = 198 kg/m2sHaraguchi correlationExperimental data, G = 298 kg/m2sHaraguchi correlationExperimental data, G = 398 kg/m2sHaraguchi correlation
Figure 8. Comparison between the measured pressure drop and predicted values using the
Lockhart - Martinelli correlation, Huang correlation, Haraguchi correlation and the acceleration
pressure drop of HFO1234yf at mass fluxes ranging from 100 kg m-2 s-1 to 400 kg m-2 s-1 and a
saturation temperature of 45 ºC

20
Figure 9. Comparison between the measured and predicted heat transfer coefficient using the Shah,
Cavallini, Dobson and Haraguchi correlation using HFO1234yf, R134a, and R32
(a) Correlation of Shah (b) Correlation of Cavallini
(c) Correlation of Dobson and Chato (d) Correlation of Haraguchi
0
2
4
6
8
10
12
0 2 4 6 8 10 12
h_ex
p W
m-2
K-1
h_cal Wm-2K-1
G = 100 kg/m2s
G = 200 kg/m2s
G = 300 kg/m2s
G = 400 kg/m2s
+20%
-20%
kg m-2 s-1
kg m-2 s-1
kg m-2 s-1
kg m-2 s-1
0
2
4
6
8
10
12
0 2 4 6 8 10 12
h_ex
p W
m-2
K-1
h_cal Wm-2K-1
G = 100 kg/m2sG = 200 kg/m2sG = 300 kg/m2sG = 400 kg/m2s
+20%
-20%
kg m-2 s-1
kg m-2 s-1
kg m-2 s-1
kg m-2 s-1
0
2
4
6
8
10
12
0 2 4 6 8 10 12
h_ex
p W
m-2
K-1
h_cal Wm-2K-1
G = 100 kg/m2s
G = 200 kg/m2s
G = 300 kg/m2s
G = 400 kg/m2s
+20%
-20%
kg m-2 s-1
kg m-2 s-1
kg m-2 s-1
kg m-2 s-1
0
2
4
6
8
10
12
0 2 4 6 8 10 12
h_ex
p W
m-2
K-1
h_cal Wm-2K-1
G = 100 kg/m2s
G = 200 kg/m2s
G = 300 kg/m2s
G = 400 kg/m2s
+20%
-20%
kg m-2 s-1
kg m-2 s-1
kg m-2 s-1
kg m-2 s-1
21
0
1
2
3
4
5
6
7
8
9
10
11
0 0.2 0.4 0.6 0.8 1
h (k
W m
-2)
1-x
G = 102 kgm-2s-1, q = 6.0 kWm-2Haraguchi et al.G = 203 kgm-2s-1, q = 12.0 kWm-2Haraguchi et al.G = 301 kgm-2s-1, q = 18.0 kWm-2Haraguchi et al.G = 401 kgm-2s-1, q = 23.6 kWm-2Haraguchi et al.
Ts = 313 K
0
1
2
3
4
5
6
7
8
9
10
11
0 0.2 0.4 0.6 0.8 1
h (k
W m
-2)
1-x
G = 101 kgm-2s-1, q = 5.5 kWm-2Haraguchi et al.G = 202 kgm-2s-1, q = 11 kWm-2Haraguchi et al.G = 298 kgm-2s-1, q = 16.3 kWm-2Haraguchi et al.G = 399 kg/m-2s-1, q = 21.8 kWm-2Haraguchi et al.
Ts = 323 K
kW m-2
kg m-2 s-1
kg m-2 s-1
kg m-2 s-1
kg m-2 s-1
kW m-2
kW m-2
kW m-2
Figure 10. Comparison between the measured and predicted heat transfer coefficient using
Haraguchi correlation with HFO1234yf at mass fluxes ranging from 100 kg m-2 s-1,and 400 kg m-2
s-1, at saturation temperatures of 40 ºC and 50 ºC

22
Table 1. Properties of HFO1234yf at saturation temperatures of 40 ºC and 50 ºC
Properties of HFO1234yf Ts = 313 K Ts = 323 K
Pressure [Mpa] 1.018 1.302
Reduced pressure[-] 0.301 0.385
Liquid Density [kg m-3] 1033.5 989.8
Vapor Density [kg m-3] 57.7 75.7
Density Ratio[-] 17.9 13.1
Liquid Viscosity [g cm-1s-1] 0.00129 0.00115
Vapor Viscosity [g cm-1s-1] 0.000132 0.000139
Thermal Conductivity [mW m-1K-1] 62.98 59.73
Table 2. Comparison between the properties of R134a, HFO1234yf, and R32 at a saturation temperature of
40 ºC
Properties HFO1234yf R134a R32
Pressure [Mpa] 1.018 1.017 2.478
Reduced pressure[-] 0.301 0.251 0.429
Liquid Density [kg m-3] 1033.5 1146.7 893
Vapor Density [kg m-3] 57.7 50.09 73.3
Density Ratio[-] 17.9 22.9 12.2
Liquid Viscosity [kg m-1s-1] 0.00129 0.00161 0.000949
Vapor Viscosity [kg m-1s-1] 0.000132 0.000124 0.000138
Viscosity Ratio[-] 9.77 13.3 6.88
Thermal Conductivity [mW m-1K-1] 62.98 74.7 114.58

23
Table 3. The flow regimes and parameter ranges of the flow regime map proposed by Tandon et al (1982)
*
*
*
*
*
1-Spray flow: j 6 and 0.5
1-Annular and Semi-annular flow: 1.0 j 6 and 0.5
1-Wavy flow: j 1 and 0.5
1-Slug flow: 0.01 j 0.5 and 0.5
1-Plug flow: j 0.01 and 0.5
g
g
g
g
g

24
Table 4. Correlations for pressure drop
2 2l g
l g
2 2l
2 2g
2
l g
2
l g
Lockhart - Martinelli correlation for pressure drop
1 / 1/
1
/
2 ( (1 )),
tt tt
tt tt
tt
l
l
dp dp dp
dz dz dz
C X X
CX X
dp dpX
dz dz
f G xdp dp
dz d dz
:
2
0.25
0.25
2 ( )
Re 2300, 0.079 Re , Re 2300, 16 / Re ,
Re 2300, 0.079 Re , Re 2300, 16 / Re ,
, 20;
, 12;
, 10;
g
g
l l l l l l
g g g g g g
f Gx
d
f f
f f
turbulent turbulent flow C
viscous turbulent flow C
turbulent viscous flow C
v
0.561
0.2
2 22
0.75
0.35
0.2
2 22
, 5
Huang correlation:
1.0 1.777
0.046 / Re
2dP
dz
Haraguchi model
1 0.5
0.046 / Re
2dP
dz
V tt
g g
gV
f g
V tt
g l g
g g
gV
f g
iscous viscous flow C
X
f
f G x
d
GX
gd
f
f G x
d
:

25
Table 5. Correlations for the condensation heat transfer
Shah ;
Cavallini et al.,;
Dobson and Chato ;
Haraguchi et al.,;
0.76 0.040.8
0.380
0.8 0.40
3.8 (1 )(1 )
/ 0.023( / ) Pr
l r
l l l l
h x xx
h P
h d Gd
0.5
1/331.111 3
0.817 0.3685 0.2363 2.144 0.10
/ ( )
7.5 /(4.3 1) 2.6
T independent flow regime
1 1.128 ( / ) ( / ) (1 / ) Pr
T dependent flow regime
G g l g
TG tt
TG G
a l l g l g g l L
G G
J xG gD
J X
J J
h h x
J J
0.8
1 0.250.3321 3 0.087lg 0
( / ) ( / )
0.725 1 0.741 1 / ( ) /( ) (1 )
T
T Td stra a G G stra G G
stra l l l g l l
h h h J J h J J
h x x gh D T x h
2
* 0.8 0.40.89
1/ 40.120* 0.8 0.4 1
0.58
1
2 /3
2.22Fr 20( ) : 0.023Re Pr 1
0.23Re PrFr 20 : (1 ) 0.0195Re Pr 1.376
1 1.1 Ja
cos (2 1)
(1 )1 ( )
l ltt
g l ll l c
tt l tt
l
g
l
Annularflow NuX
Ga cNu
X X
x
x
1
2 2l0
21 l0 0
2 l0
l0 1 2
1.50.0391.59
*
1.50.0391.04
/ 0.7 :
4.172 5.48 1.564
1.733 0.169
0.7 : 7.242, 1.655
1 1.09 10.025Re Re 1250
Fr1 1.09 1
1.26Re Re 1250
l
l
ttl l
tt
ttl l
tt
Fr G gD
c Fr Fr
c Fr
Fr c c
Xfor
X Ga
Xfor
X Ga
1/ 22 2
0.8 0.77
1/ 4
0.1 40
Nu
0.0152 1 0.6 Pr / Re
Pr0.725
Ja
10 1 1 1.7 10 Re 1
10.4
11 0.4 0.6
11 0.4
F B
F l V tt l
lB
l
l
l
g g
l
Nu Nu
Nu X
GaNu H
H
xxxxx
x
1

26
Table 6. Mean deviation and accuracy of the four correlations for the condensation heat transfer coefficient
Correlation Mean deviation (%) Accuracy defined as fraction of
data within ±20% error(%)
Shah 21.4 54.5
Cavallini et al., 23.2 53.3
Dobson and Chato 14.8 72.7
Haraguchi et al., 10.8 90.6
exp, cal,i
exp,1
1100%
i
i
n
i
h hMean deviation
n h


