
EXPERIMENTAL EVALUATION OF SUBGRADE MODULUS AND ITS APPLICATION IN SMALL-DIMENSION SLAB STUDIES
by
Qaiser S. Siddiqi W. Ronald Hudson
Research Report Number 56-16
Development of Methods for Computer Simulation of Beam-Columns and Grid-Beam and Slab Systems
Research Project 3-5-63-56
conducted for
The Texas Highway Department Interagency Contract No. 4613-1007
in cooperation with the U.S. Department of Transportation
Federal Highway Administration
by the
CENTER FOR HIGHWAY RE SEARCH
THE UNIVERSITY OF TEXAS AT AUSTIN
April 1970
The op~n~ons. findings, and conclusions expressed in this publication are those of the authors and not necessarily those of the Federal Highway Administration.
ii
PREFACE
This report describes an experimental program developed in the laboratory
for the evaluation of the coefficient of subgrade reaction for use in the dis
crete-element solution of small-dimension slabs on layered foundations (Ref
42). These discrete-element solutions are compared with the experimental slab
test described herein, the testing program for the slab having been developed
earlier (Ref 1).
This is the sixteenth in a series of reports that describe the work in
Research Project No. 3-5-63-56, entitled "Development of Methods for Computer
Simulation of Beam-Columns and Grid-Beam and Slab System." The project is
divided into two parts, one concerned primarily with bridge structures, and
the other with pavement slabs. The reader may find it particularly advanta
geous to review Research Report No. 56-15 (see List of Reports) to gain further
information in the application of k-va1ue in the discrete-element solution of
slabs on clay soil.
This report is a product of the combined efforts of many people. The
advice and assistance of Messrs. S. L. Agarwal, B. F. MCCullough, and Harold
H. Dalrymple are greatly appreciated. The entire staff of the Center for
Highway Research at The University of Texas must be thanked for the coopera
tion and contribution they provided in the preparation of this report. Thanks
are due to Art Frakes, Joye Linkous, Polly Kitchen, and others who assisted
with the manuscript.
The support of the Federal Highway Administration and the Texas Highway
Department is gratefully acknowledged.
iii
Qaiser S. Siddiqi
w. Ronald Hudson

!!!!!!!!!!!!!!!!!!!"#$%!&'()!*)&+',)%!'-!$-.)-.$/-'++0!1+'-2!&'()!$-!.#)!/*$($-'+3!
44!5"6!7$1*'*0!8$($.$9'.$/-!")':!

LIST OF REPORTS
Report No. 56-1, "A Finite-Element Method of Solution for Linearly Elastic Beam-Columns" by Hudson Matlock and T. Allan Haliburton, presents a finiteelement solution for beam-columns that is a basic tool in subsequent reports.
Report No. 56-2, "A Computer Program to Analyze Bending of Bent Caps" by Hudson Matlock and Wayne B. Ingram, describes the application of the beamcolumn solution to the particular problem of bent caps.
Report No. 56-3, "A Finite-Element Method of Solution for Structural Frames" by Hudson Matlock and Berry Ray Grubbs, describes a solution for frames with no sway.
Report No. 56-4, "A Computer Program to Analyze Beam-Columns under Movable Loads" by Hudson Matlock and Thomas P. Taylor, describes the application of the beam-column solution to problems with any configuration of movable nondynamic load s •
Report No. 56-5, "A Finite-Element Method for Bending Analysis of Layered Structural Systems" by Wayne B. Ingram and Hudson Matlock, describes an alternating-direction iteration method for solving two-dimensional systems of layered grids-over-beams and plates-over-beams.
Report No. 56-6, "Discontinuous Orthotropic Plates and Pavement Slabs" by W. Ronald Hudson and Hudson Matlock, describes an alternating-direction iteration method for solving complex two-dimensional plate and slab problems with emphasis on pavement slabs.
Report No. 56-7, "A Finite-Element Analysis of Structural Frames" by T. Allan Haliburton and Hudson Matlock, describes a method of analysis for rectangular plane frames with three degrees of freedom at each joint.
Report No. 56-8, "A Finite-Element Method for Transverse Vibrations of Beams and Plates" by Harold Salani and Hudson Matlock, describes an implicit procedure for determining the transient and steady-state vibrations of beams and plates, including pavement slabs.
Report No. 56-9, "A Direct Computer Solution for Plates and Pavement Slabs" by C. Fred Stelzer, Jr., and W. Ronald Hudson, describes a direct method for solving complex two-dimensional plate and slab problems.
Report No. 56-10, "A Finite-Element Method of Analysis for Composite Beams ll
by Thomas P. Taylor and Hudson Matlock, describes a method of analysis for composite beams with any degree of horizontal shear interaction.
v
vi
Report No. 56-11, "A Discrete-Element Solution of Plates and Pavement Slabs Using a Variable-Increment-Length Model" by Charles M. Pearre, III, and W. Ronald Hudson, presents a method of solving for the deflected shape of freely discontinuous plates and pavement slabs subjected to a variety of loads.
Report No. 56-12, "A Discrete-Element Method of Analysis for Combined Bending and Shear Deformations of a Beam" by David F. Tankersley and William P. Dawkins, presents a method of analysis for the combined effects of bending and shear deformations.
Report No. 56-13, "A Discrete-Element Method of Multiple-Loading Analysis for Two-Way Bridge Floor Slabs" by John J. Panak and Hudson Matlock, includes a procedure for analysis of two-way bridge floor slabs continuous over many supports.
Report No. 56-14, "A Direct Computer Solution for Plane Frames" by William P. Dawkins and John R. Ruser, Jr., presents a direct method of solution for the computer analysis of plane frame structures.
Report No. 56-15, "Experimental Verification of Discrete-Element Solutions for Plates and Slabs" by Sohan L. Agarwal and W. Ronald Hudson, presents a comparison of discrete-element solutions with the small-dimension test results for plates and slabs, along with some cyclic data on the slab.
Report No. 56-16, "Experimental Evaluation of Subgrade Modulus and Its Application in Model Slab Studies" by Qaiser S. Siddiqi and W. Ronald Hudson, describes an experimental program developed in the laboratory for the evaluation of the coefficient of subgrade reaction for use in the solution of small dimension slabs on layered foundations based on the discrete-element method.

ABSTRACT
In this report available theories of subgrade reaction are briefly re
viewed, and a testing program is developed to evaluate the value of soil sup
port k from small plate load tests used in the discrete-element solution of
small-dimension slab-on-foundation problems.
The results confirm that the k-value of soil depends not only upon the
diameter of the plate, but also on the amount of soil deformation.
A small dimension slab was tested on a thin asphalt-stabilized layer
under a center load up to 200 pounds. Deflections and stresses were measured
for each solution based on the k-value determined from plate load tests on the
layered system. The agreement between the two solutions is within 5 percent
in the interior of the slab near the point of load application. The effect
of cyclic loading to a constant deflection produce some permanent deformation
in the layered foundation. By the tenth cycle the applied load appeared to
start stabilizing.
The prediction of the load-deflection characteristics for a layered sys
tem based on Burmister's theory by the use of El ' the ~odulus of elasticity
of the asphaltic material in the layer determined from the split tensile
tests on asphalt concrete specimens, did not provide as effective a solution
as the plate load tests on the layered system itself.
The provision of a thin layer of asphalt concrete over clay subgrade in
creased the composite k-value by 40 percent as compared to clay alone.
A small side study showed that temperature significantly affected the
stiffness of the asphalt concrete which in turn affected the composite k-value
of the two-layered system investigated.
KEY WORDS: clay (Taylor marl), deflection and stress, discrete-element solu
tion, subgrade support, modulus of subgrade reaction k ,plate load tests,
small-dimension slab, static and cyclic load tests, temperature, two-layered
system, experimental.
vii

!!!!!!!!!!!!!!!!!!!"#$%!&'()!*)&+',)%!'-!$-.)-.$/-'++0!1+'-2!&'()!$-!.#)!/*$($-'+3!
44!5"6!7$1*'*0!8$($.$9'.$/-!")':!

SUMMARY
This report briefly examines existing theories of subgrade reaction. A
testing program was used to evaluate the sub grade reaction k-values utilizing
small-dimension plate load tests on a clay subgrade and on clay with an asphalt
stabilized subbase layer. The relationship between pressure and deflection
was found to be linear for small initial deflections of the plate and nonlinear
for higher deflections of the plate.
By placing a thin layer of asphalt concrete on the clay subgrade, the
k-value of the subgrade was improved by 40 percent, and thus for the same
load the slab was less deformed on the layered foundation than on clay alone.
A small-dimension slab was placed on the thin asphalt-stabilized layer
and tested under a center load up to 200 pounds. Deflections and stresses
were measured at selected points on the slab. Discrete-element slab solutions
were run for the experimental setup. The computed deflections and stresses
in the slab were within 5 percent of the measured values in the interior of
the slab near the point of loading. The major discrepancy in the comparison
was found in deflections at the corners of the slab. Computed deflections
were 20 to 23 percent higher than the measured deflections at the corners of
the slab, showing that a constant value of k is probably not fully repre
sentative of the actual subgrade conditions existing at any point beneath
the slab.
In the test, the temperature of the asphalt layer significantly affected
the stiffness of the composite system being investigated. This effect was
used to provide support at various stiffness factors. This fact, however,
illstrates the variability of composite support available to a rigid pavement
over its life due to variation in the environment. Such variations must be
taken into account in some way if proper pavement design is to be evolved.
ix

!!!!!!!!!!!!!!!!!!!"#$%!&'()!*)&+',)%!'-!$-.)-.$/-'++0!1+'-2!&'()!$-!.#)!/*$($-'+3!
44!5"6!7$1*'*0!8$($.$9'.$/-!")':!
IMPLEMENTATION STATEMENT
This report describes part of an experimental program to study the
parameters which affect the support value available to pavement slabs on
stabilized subbase layers on clay subgrades. In the past, it has been very
difficult to evaluate these so-called composite k-va1ues for use in analysis
and design. The results of this study provide additional information for
estimating these composite support values. The results will be implemented
by providing estimates of k-va1ue for use in discrete-element slab analysis
methods and in providing basic information for more complete and definitive
studies of the problem in the future. Composite k-va1ues such as this are
absolutely essential in the rational design of rigid pavement systems which,
according to modern design practice, almost always utilize layered support,
usually involving a stabilized layer on a subgrade.
The data from this study are also being used in Research Project 3-8-66-98
to provide experimental data with which to evaluate a pavement design pro
cedure that is being developed. The procedure is based on evaluation of ma
terial properties by indirect tensile testing. Such data are important to
provide preliminary checks for theories such as these and are also important
in designing subsequent, more comprehensive experiments.
xi

!!!!!!!!!!!!!!!!!!!"#$%!&'()!*)&+',)%!'-!$-.)-.$/-'++0!1+'-2!&'()!$-!.#)!/*$($-'+3!
44!5"6!7$1*'*0!8$($.$9'.$/-!")':!

TABLE OF CONTENTS
PREFACE iii
LIST OF REPORTS v
ABSTRACT AND KEY WORDS vii
SUMMARY ix
IMPLEMENTATION STATEMENT xi
CHAPTER 1. INTRODUCTION........................ 1
CHAPTER 2. CURRENT STATUS OF KNOWLEDGE
Theoretical Background •••• • • • • Winkler's Foundation •• • • • • • • • • • ••••••••• Elastic Isotropic Solid Theory • • • • • • • • • • • • • • • • Elastic-Layered Theory • • • • • • • • • • • • • • • • Methods for Determining the k-Value Methods of Approach for Finding k-Value from
Load-Deflection Curves . • • • • • • • • • •
CHAPTER 3. DEVELOPMENT OF TEST PROGRAM
Details of Test Setup • Load Application Deflection Measurement Strain Measurement Preparation of the Soil .
Mixing Procedure • • . Extrusion and Placement in the Box
Preparation of the Asphalt Concrete Mix • . . . . . .
Selection of the Aggregate •• ••••• • • • Optimum Asphalt Content • • • • • • • Preparation and Laying of the Mix ••• • • • • • •
Testing Procedure • • . • • • • ••• • • Plate Load Tests • • • • • • • • • • • • Slab Test •••••••••
xiii
. . .
. . . . .
3 3 5 7 8
10
13 13 15 17 17 17 17 19 19 19 20 25 25 25
xiv
CHAPTER 4. ANALYSIS OF PLATE LOAD TESTS DATA
Plate Load Tests on Clay . • • • • Plate Load Tests on Layered System • • • • • Application of Elastic-Layered Theory • . • • • . Determination of E2 •••. • • • • • • • • • Determination of E1 ••••••••• • • • •
CHAPTER 5. EFFECT OF STIFFNESS OF ASPHALT-STABILIZED LAYER
Development of Test Program • Test Results Calculation of E1 k versus E1 •
CHAPTER 6. ANALYSIS OF SLAB TEST DATA
· . . .
. . . . . .
Load-Deflection Curves • • • • • • • • • III • • • • • • • • • •
Comparison of Experimental and Analytical Solutions for Deflections •••••••••••
Comparison of Experimental and Analytical Solutions for Principal Stresses • • •
Comparison of Load-Deflection Curves for the Slab Tests on Clay and on Layered System • • • • • • • •
Cyclic Load Test •••••••.•••••••
CHAPTER 7. CONCLUSIONS, RECOMMENDATIONS, AND APPLICATIONS
Recommendations Applications
· . . .
29 35 42 42 42
49 49 51 53
57
60
67
71 71
76 77
REFERENCES III • • • • • • • • • • • • • • • • • • • • • • • • • • • • •• 79
APPENDICES
Appendix 1. Appendix 2. Appendix 3.
Properties of Materials Used in the Experiments Data of Plate Load Tests • • • • • Data of Slab Test ••••• • • · .
87 93
101
THE AUTHORS. .. • • • • • • • • • . • • • • • • • • • • • • • • • • • •• 109

CHAPTER 1. INTRODUCTION
Highway and airport pavements are complex structures supported on founda
tions of soil. During the useful life of a pavement, materials in and soils
beneath the pavement structure are subjected to different intensities of loads
by the wheels of moving vehicles. The weight of this traffic is finally car
ried by the subgrade itself, which in turn provides support to the pavement
structure. The behavior of subgrade soils under different loading conditions
must be more fully investigated before a rational design for pavements is
achieved.
It is important that the soil support for the pavement structure be deter
mined and represented as accurately as possible for any theoretical or experi
mental approach to the problem.
Pavements or slabs-on-foundation can be represented by a physical model
consisting of bars, springs, and torsion bars grouped in a system of
orthogonal beams, as described by Hudson and Matlock (Ref 25) and Stelzer and
Hudson (Ref 42). In the discrete-element model representation of slabs-on
foundation, the modulus of support k is based on the Winkler foundation and
the method is capable of representing the modulus of support by a linear spring
(initial tangent modulus) or by a nonlinear spring. Subgrade support for
use as a linear k can be directly determined by conventional plate load
tests as demonstrated by several investigators (Refs 23, 31, 33, and 47), but
the evaluation of nonlinear foundation support needs further investigation.
Agarwal and Hudson (Ref 1) have used a linear value of k for clay, deter
mined from the plate load tests on clay, in obtaining a satisfactory analytical
solution for deflections and stresses in a small-dimension slab on clay. They
verified the analytical method with the results of a small-dimension slab on
clay.
The use of a cement or lime-stabilized layer or an asphaltic concrete
layer over the clay soil can provide an increase in the subgrade support, and
this increased value of k for the layered system provides more resistance
to deformation of the slab as compared to clay alone.
I

2
A testing program was developed to determine k-values for a clay soil
subgrade; a layered foundation for use in the discrete-element solutions for
deflections and stresses in slabs on the clay subgrade and on the layered sys
tem. The latter consists of an asphalt-stabilized layer over the clay sub
grade.
The purpose of this study is to evaluate a k-value for the layered system
from the load-deflection data of the plate tests in order to investigate the
use of discrete-element analytical methods. These methods would determine de
flections and stresses at various points in a slab-on-layer foundation and
verify the analytical solution with the results of a small-dimension slab test
on the layered system.
A side study was conducted to investigate the effect of temperature on
the stiffness of the asphalt-stabilized layer since the k-value of the layered
system is directly influenced by the stiffness of the asphaltic material in
the layer.
Chapter 2 presents a brief review of the theories of the subgrade reac
tion, the contributions of many investigators, and methods for determining
the subgrade reaction k
Chapter 3 describes the development of a test program mainly for the
plate load tests including the tests conducted, instruments used for measure
ments of load, deflection, strains, materials used and their preparation, and
testing procedures.
Chapter 4 presents the analysis of the plate load test data and values
of k for the soil subgrade and the layered system. The chapter describes
the prediction of load-deflection curves for layered systems based on Burmis
ter's elastic-layered theory, and a comparison with the test data.
Chapter 5 describes the effects of the stiffness of the asphalt-stabi
lized layer due to change in temperature.
Chapter 6 presents an analysis of the slab test, including a comparison
of the experimental deflections and principal stresses and the analytical solu
tions. Some observations from the cyclic test are included.
Chapter 7 presents conclusions and some recommendations suggested for
future study.
Appendices include data from tests conducted in this study.
CHAPTER 2. THEORIES OF SUBGRADE SUPPORT
A review of the various theories involved in the behavior of subgrade
soils acting as foundation support to the pavement structure is presented in
this chapter. Various methods are described to determine the modulus of sub
grade reaction k .
Theoretical Background
Subgrade soil is usually represented by one of three theories, the
Winkler foundation theory, the elastic isotropic half-space theory, or a varia
tion of the latter, the elastic-layered theory.
Winkler's Foundation
To study the behavior of subgrade under an application of load, Winkler
(Ref 51) introduced a simplified assumption in 1867. His hypothesis assumes
the subgrade to be a dense liquid represented by a bed of closely-spaced dis
crete springs. A loaded beam or slab resting on subgrade is supported by
localized forces, each of which is proportional to the deflection of the
spring at that point. By distributing these forces over a unit area, the
sub grade support is represented as a unit pressure p , which is equal to a
constant times the deflection w :
p k X w
The constant k is called modulus of subgrade reaction. In the ex
pression Hertz, Murphy, Westergaard, Winkler, and Zimmerman (Refs 16, 35, 50,
51, and 52, respectively) assumed that the modulus is constant at every point,
independent of the deflection, and the same at all points within the area of
consideration. This theory thus assumes a linear relationship between pres
sure and deflection.
3

4
Westergaard (Ref 50) has used the dense liquid concept for represent-
ing the subgrade in the development of his equations for the determination
of deflection and stresses in concrete pavements. The deflection of a pave
ment depends not only on its flexural rigidity but also on the stiffness of
the support. To facilitate the mathematical treatment, Westergaard intro
duced the term "radius of relative stiffness," which has a lineal dimension
and is a function of subgrade support in the form of modulus of subgrade reac
tion known as k. The radius of relative stiffness is expressed as
where
1, =
1, =
E
\! =
h =
2 12(1 - \! )k
radius of relative stiffness, inches;
modulus of elasticity of slab, psi;
Poisson's ratio of slab;
thickness of slab, inches;
k modulus of subgrade reaction, lb/cu in.
(2)
The Westergaard formulas have certain limitations particularly in view
of the difficulties experienced in determining the value of k.
It has been shown by Terzaghi (Ref 44) that a linear pressure-deflection
relationship holds good in some soils up to one-half of their ultimate bearing
capacities. Based on experimental observations, Terzaghi formulated an
empirical expression for the coefficient of subgrade reaction ksb for a beam
of width B resting on sand:
= ( 2B )2
ksl B + 1 (3)
wherein ksl is the coefficient of subgrade reaction for a beam with a width
of one foot. This expression is valid for contact pressure smaller than one-
half of the ultimate bearing capacity of the subgrade.
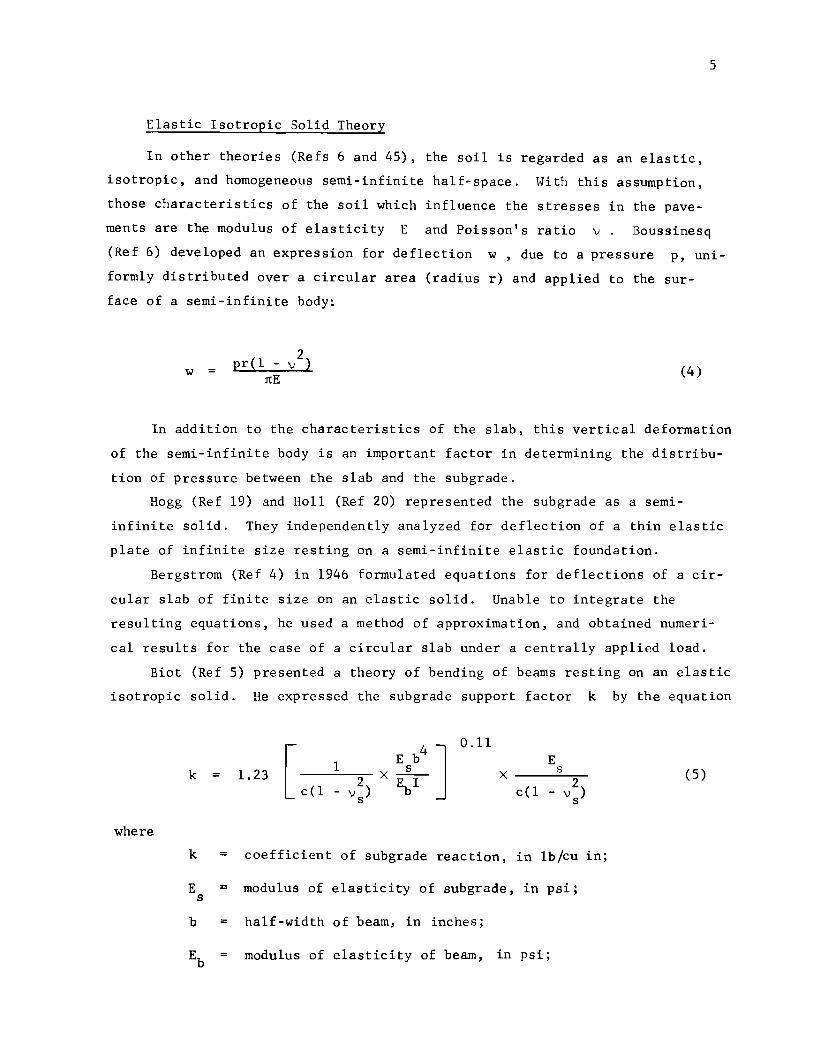
Elastic Isotropic Solid Theory
In other theories (Refs 6 and 45), the soil is regarded as an elastic,
isotropic, and homogeneous semi-infinite half-space. With this assumption,
those characteristics of the soil which influence the stresses in the pave-
5
ments are the modulus of elasticity E and Poisson's ratio v Boussinesq
(Ref 6) developed an expression for deflection w, due to a pressure p, uni
formly distributed over a circular area (radius r) and applied to the sur
face of a semi-infinite body~
w 2
pr( 1 - v ) rcE
(4 )
In addition to the characteristics of the slab, this vertical deformation
of the semi-infinite body is an important factor in determining the distribu
tion of pressure between the slab and the subgrade.
Hogg (Ref 19) and Holl (Ref 20) represented the subgrade as a semi
infinite solid. They independently analyzed for deflection of a thin elastic
plate of infinite size resting on a semi-infinite elastic foundation.
Bergstrom (Ref 4) in 1946 formulated equations for deflections of a cir
cular slab of finite size on an elastic solid. Unable to integrate the
resulting equations, he used a method of approximation, and obtained numeri
cal results for the case of a circular slab under a centrally applied load.
Biot (Ref 5) presented a theory of bending of beams resting on an elastic
isotropic solid. He expressed the subgrade support factor k by the equation
where
k
k
E s
b
=
=
=
=
1.23
4 ] 0.11 E b s
X EbI X
E s
2 c(l - v )
s
coefficient of subgrade reaction, in Ib/cu in;
modulus of elasticity of subgrade, in psi;
half-width of beam, in inches;
Eb modulus of elasticity of beam, in psi;
(5)
6
I = f · . f b .. 4 moment 0 1nert1a 0 earn, 1n 1n. ;
c = fundamental length of beam, inches;
Vs = Poisson's ratio of subgrade.
Vesic (Ref 49) extended the well-known Biot solution to include an infinite
beam resting on a semi-infinite elastic solid and approximately evaluated the
integrals appearing in the resulting equations for the bending of beams on
elastic solid. He showed that the Winkler hypothesis is practically satisfied
for any determined beam of infinite length resting on a semi-infinite elastic
subgrade. He concluded that any problem of bending of an infinite beam having
a stiffness EbI and a width B and resting on a semi-infinite subgrade de
fined by a Young's modulus Es and a Poisson's ratio vs can be treated with
reasonable accuracy by the conventional analysis using a coefficient of sub
grade reaction k given by the following expression where the terms are de
fined in Eq 5:
k B (l)
= K (l)
= 0.65 (6)
where
k = coefficient of subgrade reaction per unit width of beam (l)
of infinite length,
K coefficient of subgrade reaction of beam (width B ) (l)
of infinite length.
Similar empirical equations have been formulated by Benscoter, DeBeer,
Habel, and Hetenyni (Refs 3, 11, 13, and 17, respectively) to represent support
factor k for a semi-infinite elastic foundation.
Skempton (Ref 40) has developed a procedure for predicting the load-deflec
tion curve in a plate load test on a saturated clay from the results of a labo
ratory compression test on the same material. He has expressed the equation
based on elastic theory for determining the mean settlement of the plate as
w = pBi P
2 1 - vs
E s
(7)

7
where
w settlement of plate, inches;
p foundation pressure, psi;
B = breadth of foundation (diameter for circular footing), inches;
i influence value depending upon the shape and rigidity of plate; p
v Poisson's ratio of soil; s
E = modulus of elasticity of soil, psi. s
Based on Eq 7, Skempton related the stress a and strain € of soil
in a triaxial compression test to the pressure-deflection curve of soil ob
tained from plate load tests under the same loading conditions by the expres-
sions:
p 0.290 (8)
w 2B& (9)
Seed (Ref 39) has used these correlations to predict successfully the
deflection of circular plates on subgrade soils under static and repetitive
applications of load.
Elastic-Layered Theory
The theories described previously dealt with the assumption that the sub
grade is a homogeneous, isotropic elastic half-space. The thin plate theory
used by Westergaard, Hogg, and others neglects normal and shearing stresses in
the plate. In reality the subgrade consists of many layers of soil of finite
depth and even the pavements are made up of layers of different materials.
In 1943 Burmister (Ref 7) published the first fundamental calculation of
deflections due to a uniformly distributed circular and vertical load on
the surface of an elastic two-layered system. He assumed that each layer
acts as a continuous, isotropic, homogeneous, linearly elastic medium which
is infinite in horizontal extent, and is continuously supported by the layer
beneath, with the interface conditions between layers either perfectly smooth
or extremely rough. Deformations throughout the system are small.
8
With these assumptions Burmister formulated the following equations for
calculating the deflection in an elastic mass of a two-layered system.
where
Using a flexible plate, the equation for deflection is:
w 1.5 ¥ F 2
Using a rigid plate, the equation becomes:
w
w
p
E2
a
F -=
1 18 ~ F . E 2
deflection of the plate, inches;
unit load on a circular plate, psi;
modulus of elasticity of lower layer, psi;
radius of the plate, inches;
deflection factor, which is a function of the ratio of thickness of layer/radius of plate and the modular ratio of the materials in two layers E
l/E
2 .
(10)
(11)
In addition to the charts prepared by Burmister (Refs 7 and 8), tables
and charts have also been developed by Hank and Scrivner (Ref 15), Fox
(Ref 12), and Jones (Ref 26) for the determination of deflection and stresses
in a two-layered system.
Methods for Determining the k-Value
It is noted from the theoretical background that the modulus of subgrade
reaction plays an important role in the evaluation of deflections and stresses
in pavement slabs and plates resting on soil. The modulus k is used in the
Westergaard formulas for the deflections of the pavements and has a marked
influence on the value of deflection. The modulus of subgrade reaction can
be determined by both field tests and laboratory tests. The most common tests
used are plate load tests and triaxial tests; however, correlations have been
developed for California bearing ratio (CBR) tests and cone penetration tests
with plate load tests.

9
Field plate load tests representing actual field conditions are
quite reliable ways of determining k ,but the data are only applicable to
the conditions existing in the subgrade at the time of the test. Moreover,
field tests are cumbersome, expensive, and time-consuming. McLeod (Ref 31)
carried out an extensive testing program of plate bearing tests on the sub
grade, base courses, and flexible surfaces of the runways at ten Canadian air
ports. He correlated the field load test data with cone bearing, Housel
penetrometer, field California bearing ratio, and triaxial compression tests,
and thus developed methods for predicting k-value from these other tests.
Plate load tests are the most frequently used tests for finding the value
of k. Numerous investigators and highway agencies recommended these tests
for the design of pavements, both rigid and flexible. In the light of the
Westergaard analysis of stress conditions in concrete pavements, Teller and
Sutherland (Ref 43) described the following three methods to measure the
modulus of subgrade reaction under field conditions:
(1) Load-deflection tests in which loads are applied at the center of rigid circular plates of relatively small size, the pressure intensity being uniform over the entire area of the plate. The value of k is determined by the rati.o of the applied pressure p and its corresponding mean vertical plate deflection w (same as Eq 1):
k 2 w
(2) Load-deflection tests in which the load is applied at the center of a slightly flexible rectangular or circular plate of relatively large dimensions. In this case some bending of the plate occurs and the pressure intensity under the plate is not uniform throughout the area of its contact with the soil. The load and the vertical deflection of various points throughout the area of the plate are measured. The shape of the deflected plate must be determined precisely and its vertical displacement measured in order to be able to estimate accurately the volumetric displacement of the soil that is affected by the application of the test load on the plate. The modulus of subgrade reaction is then computed by dividing the total applied load (in pounds) by the volume of the displaced soil (in cubic inches).
(3) Load-deflection tests on full size pavement slabs in which the loaddeflection data are obtained by measurement and used in Westergaard deflection formulas to predict a value for the modulus of subgrade reaction, where all other factors must be known.
10
In plate load tests the rigidity and the size of the plate are important
factors. It has been shown by various investigators (Refs 9, 31, and 43), that,
within limits, the area of the plate had a marked effect on the value of the
modulus k as determined from the plate bearing tests. The minimum size of
plate that will give satisfactory data depends upon the soil structure being
tested. It is important, therefore, to select carefully the size of the plate
to be used in the determination of the k-value since plate size has a marked
effect on k.
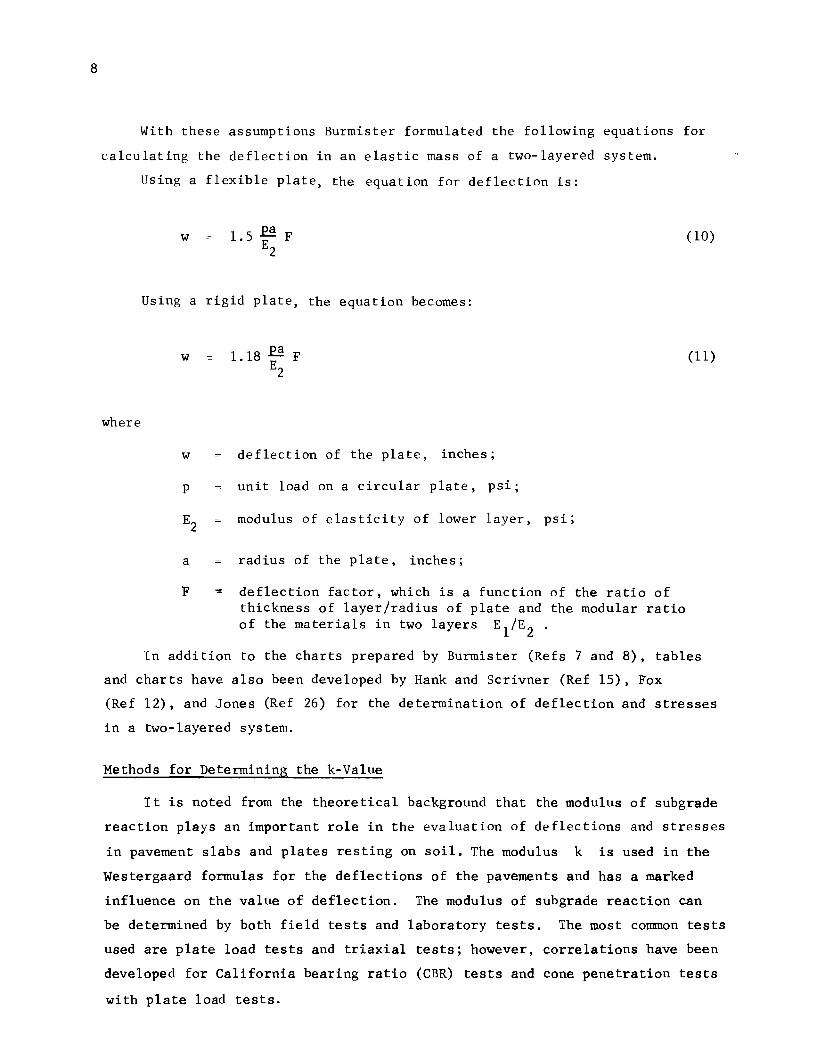
Methods of Approach for Finding k-Value from Load-Deflection Curves
Several approaches may be used to find the k-value from rigid plate tests
data. The initial straight-line portion of the load-deflection curve is some
times used to evaluate the value of k A tangent is drawn to the initial
part of the curve (Fig 1) which gives the value of k as a tangent modulus.
It is a linear estimate of the load-deflection relationship identical to
Winkler's assumption. This approach is probably realistic for small loads
and deflections. Terzaghi (Ref 44) suggests that this approach may be approx
imately true for values of contact pressures up to one-half the ultimate bear
ing capacity of the soil.
Another approach uses the secant modulus. Points on a load-deflection
curve beyond the initial straight position are selected, depending upon the
deflection criteria considered. The ratio of load and deflection at each
point gives an estimate of k This value is always less than the value
obtained from the tangent modulus approach because of the increase in deflec
tion with respect to load, which is a nonlinear characteristic of the load
deflection curve, as typified in Fig 1. The secant modulus approach may be
useful when the anticipated deflections in the slabs are relatively high with
regard to the changing conditions existing in the foundation beneath the pave
ment and also when the repetitive application of load is being considered.
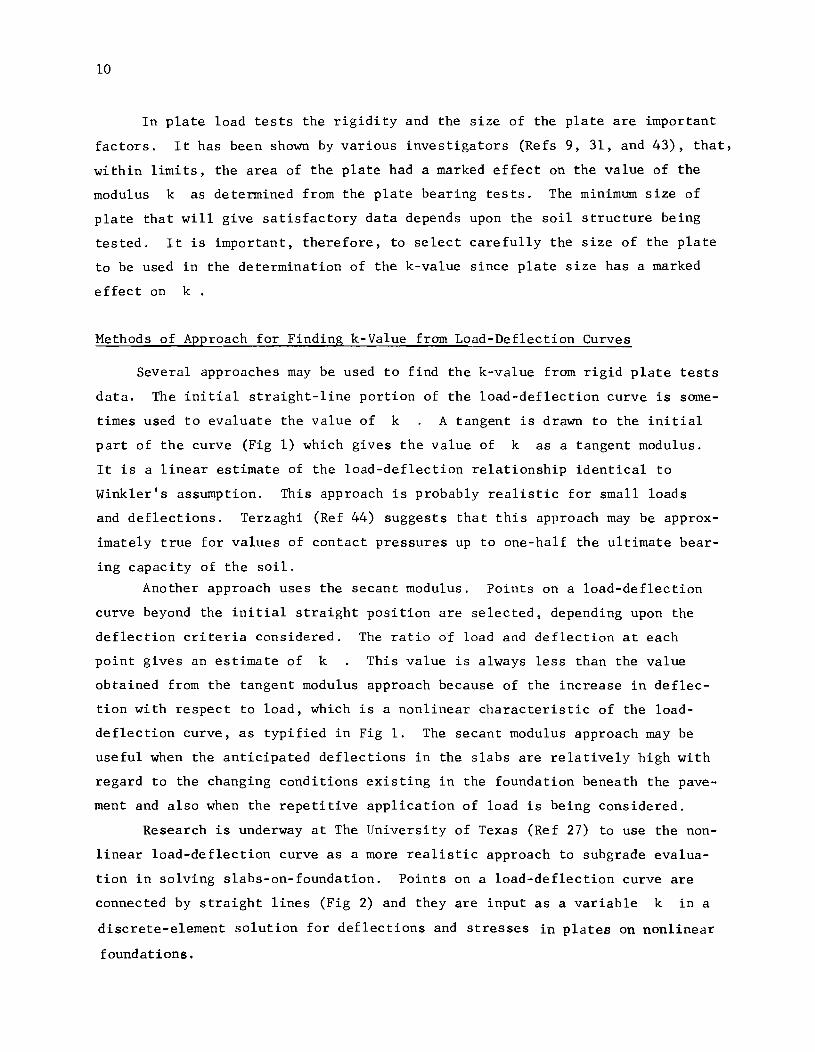
Research is underway at The University of Texas (Ref 27) to use the non
linear load-deflection curve as a more realistic approach to subgrade evalua
tion in solving slabs-on-foundation. Points on a load-deflection curve are
connected by straight lines (Fig 2) and they are input as a variable k in a
discrete-element solution for deflections and stresses in plates on nonlinear
foundations.
k (Secont Modulus)
k (Tangent Modulus)
Deflection, W
Fig 1. Tangent and secant moduli approaches for finding k-value.
Points on q-w Curve
Deflection, W
II ~
~ 1/1 1/1 II) ~
Q.
Fig 2. Use of load-deflection curve of soil to represent the soil support.
11

!!!!!!!!!!!!!!!!!!!"#$%!&'()!*)&+',)%!'-!$-.)-.$/-'++0!1+'-2!&'()!$-!.#)!/*$($-'+3!
44!5"6!7$1*'*0!8$($.$9'.$/-!")':!

CHAPTER 3. DEVELOPMENT OF TEST PROGRAM
A testing program was developed to evaluate the k-value of a clay subgrade
from small-scale plate load tests using circular rigid plates of diameters
ranging from 2 to 9 inches. The k-va1ue thus obtained was used in the discrete
element solution for deflections and principal stresses in a small dimension slab
resting on the same clay subgrade and the solution was compared with the experi
mental results of slab tests on clay under static loads as reported by Agarwal
and Hudson (Ref 1). Plate load tests were also conducted on the surface of an
asphalt-stabilized layer over the clay to evaluate the k-va1ue of the layered
system. The small-dimension slab tested On clay (Ref 1) was subsequently test-
ed on the same asphalt-stabilized layered system and results were compared with
the analytical solutions using the k-va1ue as determined from the plate load tests.
In this study, the following tests were conducted using local soil (Taylor
marl clay) and a thin stabilized layer of asphalt over the clay subgrade:
(1) slab test on asphalt concrete layer with clay subgrade,
(2) plate load tests on clay, and
(3) plate load tests on asphalt-stabilized layer over clay subgrade.
The slab tests on clay are reported in detail by Agarwal and Hudson (Ref 1).
Details of Test Setup
The tests were conducted in a wooden box with inside dimensions of 24 by
24 inches and a height of 21 inches. The box was constructed of 3/4-inch plywood
and was securely braced on all sides by five 1-1/2 by 4-inch wood sections.
The inside of the box was coated with a waterproof paint. The top and bottom
covers of the box were made detachable. Two steel straps with hooks were
fixed to the sides of the box to facilitate lifting and overturning. A photo
graph of the box is shown in Fig 3.
Load Application
The loads were applied through a mechanical screw jack and were measured
by a proving ring in the plate load tests and by a load cell in the slab test.
13

14
Fig J. Arrangement for plate load test on clay.
15
One proving ring, having a capacity of 500 pounds, was used for the first series
of experiments. A second proving ring, having a capacity of 1,500 pounds, was
required for measuring loads on top of the asphalt-stabilized layer. Both
proving rings were calibrated before use. The proving rings could measure the
loads to an accuracy of one pound. In the plate load tests on clay, the plates
were first seated by applying a load equivalent to one psi and releasing it
after a few seconds. In case of plate load tests on the asphaltic layer, a
seating load was applied to produce a deflection of .02 inch. The load was
repeated several times (4 to 6) until this deflection was stabilized. The
plates were then loaded to a limiting deflection of .25 inch.
For the slab test on a layered system, load was applied through a screw
jack, measured by a load cell, and recorded automatically on a digital volt
meter. The capacity of the load cell was 5,000 pounds with a resolution of two
pounds. The load was applied through the screw jack at a constant rate of
strain of .001 in/min.
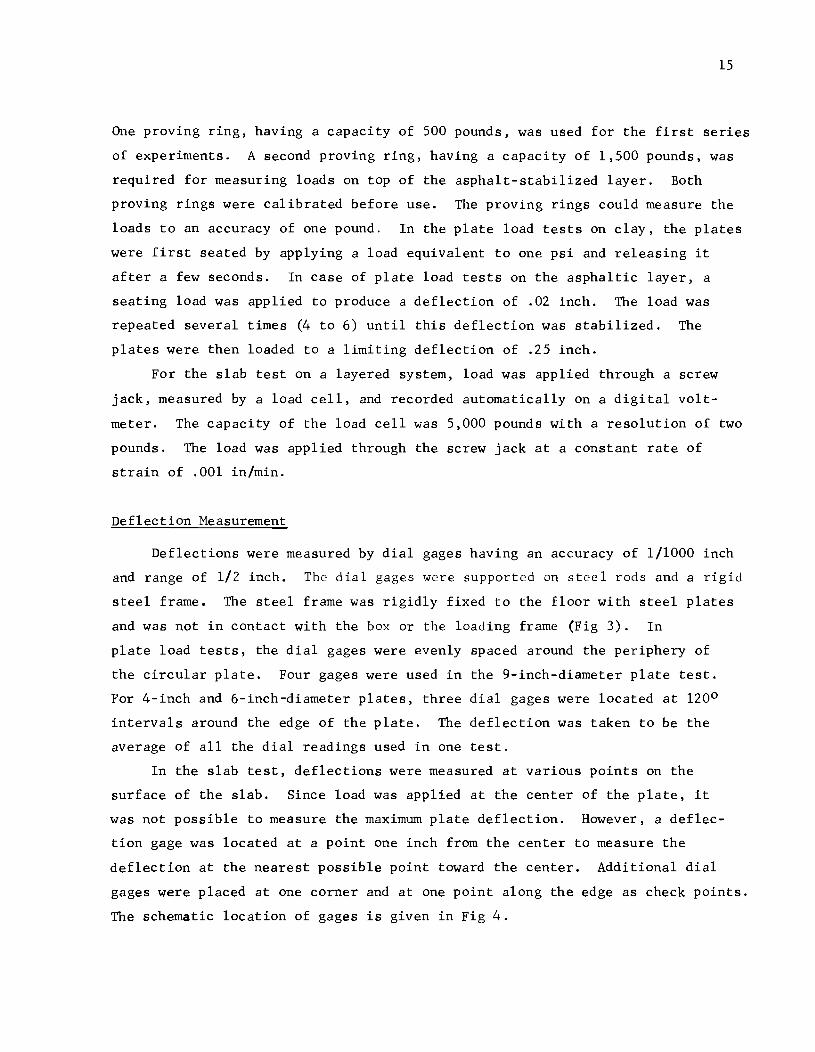
Deflection Measurement
Deflections were measured by dial gages having an accuracy of 1/1000 inch
and range of 1/2 inch. The dial gages were supported on steel rods and a rigid
steel frame. The steel frame was rigidly fixed to the floor with steel plates
and was not in contact with the box or the loading frame (Fig 3). In
plate load tests, the dial gages were evenly spaced around the periphery of
the circular plate. Four gages were used in the 9-inch-diameter plate test.
For 4-inch and 6-inch-diameter plates, three dial gages were located at 1200
intervals around the edge of the plate. The deflection was taken to be the
average of all the dial readings used in one test.
In the slab test, deflections were measured at various points on the
surface of the slab. Since load was applied at the center of the plate, it
was not possible to measure the maximum plate deflection. However, a deflec
tion gage was located at a point one inch from the center to measure the
deflection at the nearest possible point toward the center. Additional dial
gages were placed at one corner and at one point along the edge as check points.
The schematic location of gages is given in Fig 4.

16
7 6
°5
°4
c: ---1 'Y' o.z /1-~- ,~-~
8'
Point of ~ Looding R, R3
I£:::
RI / R4 ....
(~
I
I. 9 in. .1
Diol Goge Distance from Center
I-in. on Center Line
2 2.5-in. on Center Line
3 4.51n. on Center Line
4 1.4-in. on Diagonal
5 3.5-in on Diagonal
6 6 !4-in. on Diagonal
7 6A--in. on Diagonal
e 4.5-in. on Center Line
Rosettes
RI I-in. on Center Line
Rz 3·in on Center Line
R3 1.4-in. on Diagonal
R4 35-in. on Diagonal
Fig 4. Schematic location of dial gages and rosettes on aluminum slab.
Strain Measurement
Strains were measured in the slab test only. Four rosettes, each with
gages oriented at 00 , 45 0 , and 900 , were fixed at four locations (Fig 4)
on the slab surface to measure strains near the loaded area.
17
Data from the slab tests were recorded in digital form using a Honeywell
data logging system. The system, described in detail by Agarwal and Hudson
(Ref 1), recorded strains and the corresponding load in close time proximity
on the 40-channel digital logging system. One example of typical data print
out is given in Appendix 3.
Preparation of the Soil
The clay used in the experiments is geologically classified as Taylor
marl I and was obtained near Manor, Texas. A number of tests were performed
to investigate its properties and workability. The Atterberg limits and
other properties for this material are given in Table A1.1, Appendix 1.
Mixing Procedure
The clay was thoroughly dried in the oven at about 2400 F, crushed to
small pieces in a chipmunk crusher, and finally pulverized. The clay was then
mixed with water, in a mechanical mixer, to a moisture content of 38 + 1 per
cent. The mixed soil was placed in cans in plastic bags and stored in a 100
percent humidity room to maintain a fairly uniform moisture content in soil.
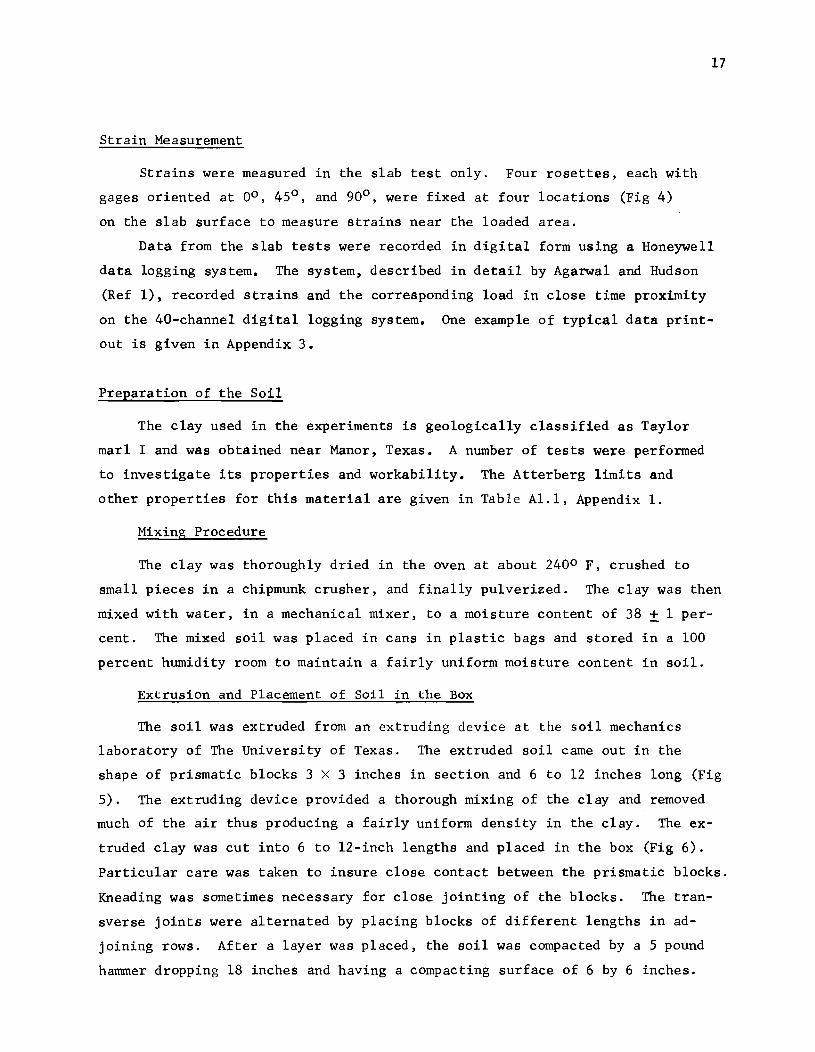
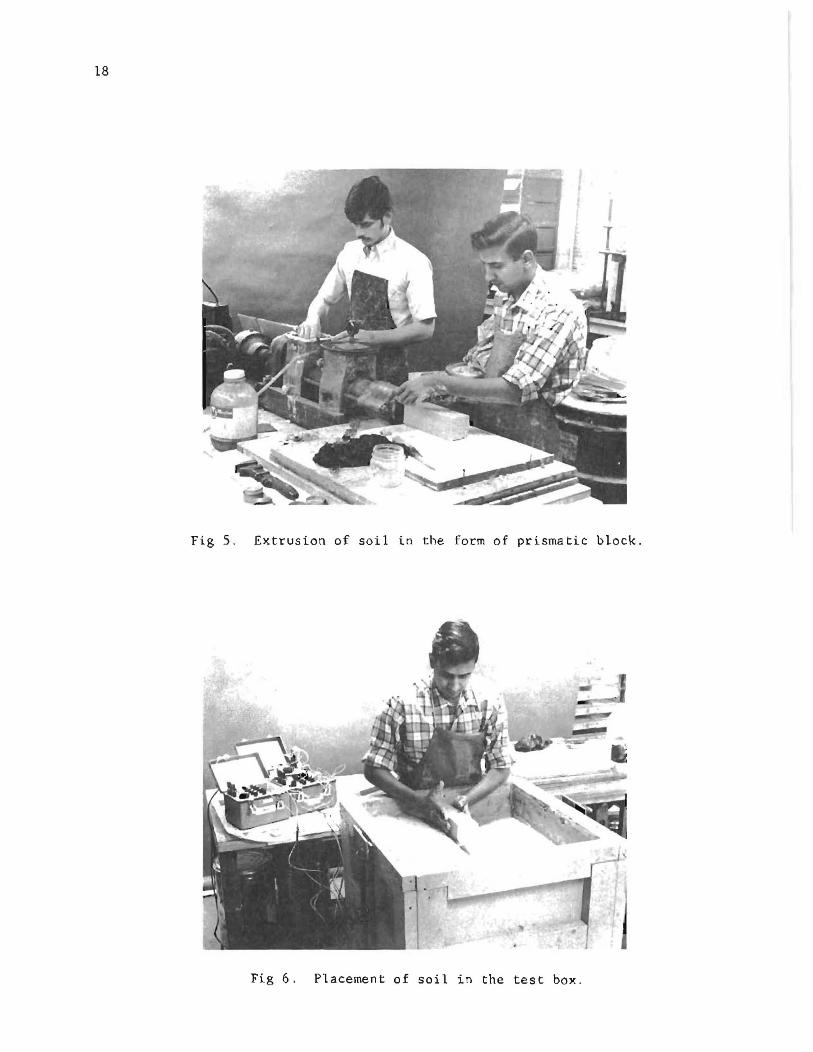
Extrusion and Placement of Soil in the Box
The soil was extruded from an extruding device at the soil mechanics
laboratory of The University of Texas. The extruded soil came out in the
shape of prismatic blocks 3 X 3 inches in section and 6 to 12 inches long (Fig
5). The extruding device provided a thorough mixing of the clay and removed
much of the air thus producing a fairly uniform density in the clay. The ex
truded clay was cut into 6 to 12-inch lengths and placed in the box (Fig 6).
Particular care was taken to insure close contact between the prismatic blocks.
Kneading was sometimes necessary for close jointing of the blocks. The tran
sverse joints were alternated by placing blocks of different lengths in ad
joining rows. After a layer was placed, the soil was compacted by a 5 pound
hammer dropping 18 inches and having a compacting surface of 6 by 6 inches.
18
Fig S. Extrusion of soil in the form of prismatic block.
Fig 6. Placement of soil in the test box .
The surface was evenly compacted by two blows of the hammer, and this extra
effort provided further consistency within the soil. Alternate layers were
rotated 900 . The procedure was repeated after each layer was placed, until
the box was filled to its entire depth.
The box was then covered with two polyethylene sheets to prevent
moisture evaporation and tightly secured at the top with a wooden cover. On
the day before the plate load tests, the surface of the soil in the box was
carefully worked with a sharp steel straight edge to make it level. Special
care was taken to accurately level the surface where the rigid plate rested.
The leveling could be done within a very short time because of the excellent
molding properties of clay.
Samples of soil for moisture content determination were taken from each
layer of soil placed in the box during the extrusion of soil.
Preparation of the Asphalt Concrete Mix
19
To study the behavior of a small-dimension slab on a layered system, a
thin asphalt-stabilized layer was used over the clay which was used in
earlier tests. A slab test was performed on the asphalt-stabilized layer in
the same way as the slab test on clay (Ref 1). The k-value for the system
was evaluated from the plate load test results reported herein. Experimental
results of the slab test conducted in this study were compared with the
analytical solution based on the k-value evaluated earlier. Experimental
results of the slab tests on clay and on the layered system were also com-
pared for the point of the maximum measured deflections of slab (see Chapter 6).
Selection of the Aggregate
An aggregate with fine gradation was chosen so that a thin layer of the
mix could be prepared relative to the thin slab being tested. A crushed lime
stone aggregate with gradation similar to Texas Highway Department specifications
for Type E (Ref 41), fine-graded surface course, was used. The gradations
selected are shown in Table Al.3, Appendix I, along with the Texas Highway
Department specifications.
Optimum Asphalt Content
In general the strength of a stabilized mixture increases with the addition
of asphalt until a maximum stability value is obtained. The asphalt content

20
at the maximum stability value is generally considered to be the optimum
asphalt content.
To find optimum asphalt content for use in this study, specimens were
prepared using four different asphalt contents, i.e., 7, 8, 9, and 10 percent
by weight of the aggregate. The range of asphalt content was obtained from
Texas Highway Department specifications (Ref 41). Asphalt AC-10 was selected.
It is readily available and is widely used in hot mix asphalt mixtures. Its
properties are given in Table 3, Appendix I.
The procedure for the preparation and testing of asphalt concrete speci
mens, briefly described in Appendix I, is the same as that recommended by
Hudson and Kennedy (Refs 24 and 28) with slight modifications (Ref 14) and is
presently in use as a standard procedure at The University of Texas.
Plots of density versus percent asphalt content and stress at failure
versus percent asphalt content (Fig 7) gave an optimum asphalt content of 9
percent by weight of aggregate.
Preparation and Laying of the Mix
The properly graded aggregate and 9 percent AC-10 asphalt by weight of
aggregate were preheated separately in an oven at 2500 F ± 50 F for 2 to 4
hours and then mixed at 2500 F + 50 F for a period of 3 minutes in an auto
matic Hobart mixer (Fig 8). This procedure provided a thorough mixing of
aggregate and asphalt.
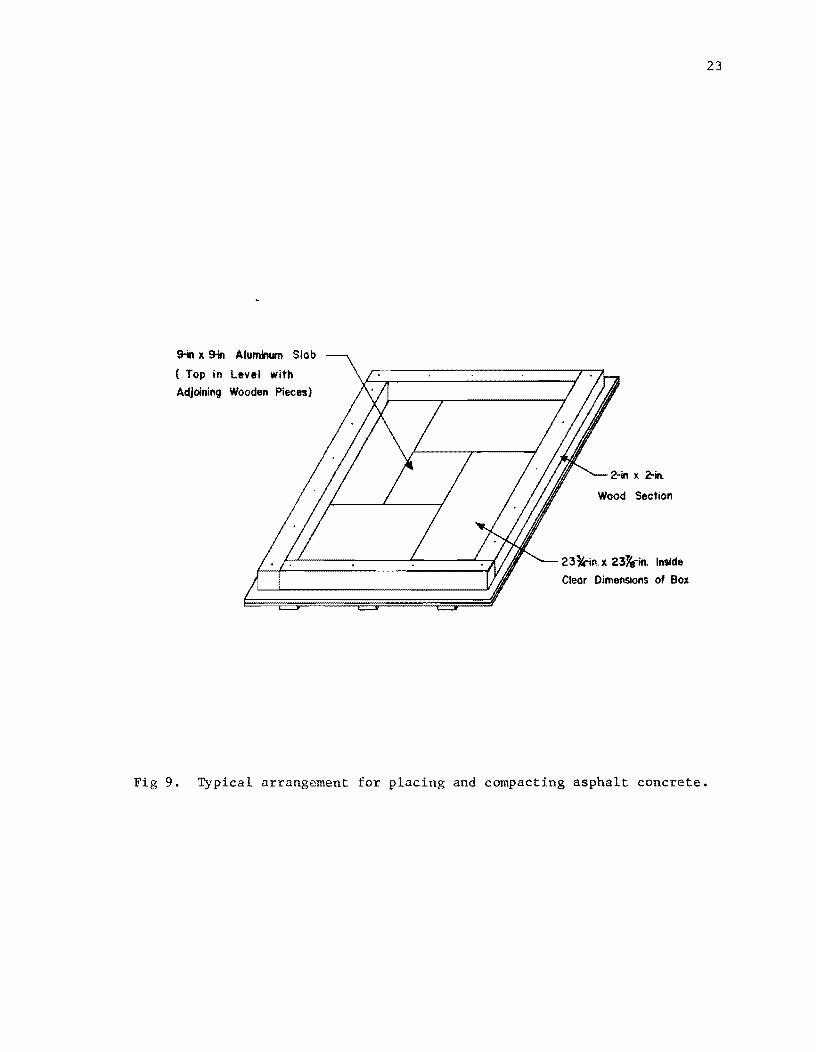
To provide a better workability for the placement and compaction of
asphalt concrete, the surface of the wooden cover of the test box was tempo
porari1y bounded by 2 by 2-inch wood sections as shown in Fig 9. An aluminum
slab was placed in the center and level with the surface of the bottom cover.
This procedure helped not only in achieving a uniform contact of slab with as
phalt concrete, but also provided a better compaction of the mix. The hot mix
was laid down immediately over the entire surface of the bottom cover of the
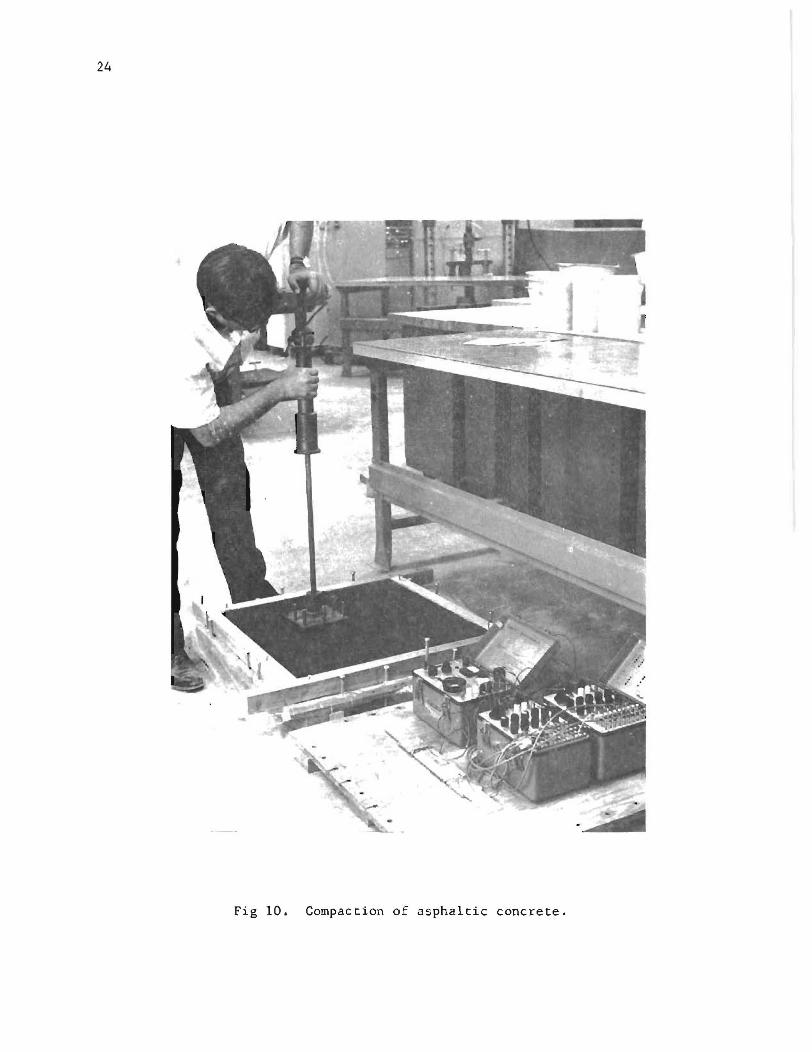
test box and was compacted uniformly by a 6-inch-square compacting foot (Fig 10).
Two layers of the mix were used to achieve the desired 2-inch thickness of the
asphalt concrete. Special care was taken to keep the finished surface of the
asphalt concrete as level as possible. This prepared layer of asphalt concrete
was then cured for two days to gain the required strength. After two days, the
wood sections were removed, and the box was placed on the cover with its open

.... (J Q.
ISO
149
148
~ 147 OIl
;; :!:: c: 146
::::>
145
144 -+-------I-------I------+--7 8 9
% Asphalt Content by Weight of Mix
(a) Effect of asphalt content on unit weight of mix.
120 -----------~oQ-__ "iii Q.
'0 80 .. .. Q;> .... -en
60 .!? ";;
~
10
40+-----+-----+--------+--7 8 9 10
% Alpholt Content by Weight of Mix
(b) Effect of asphalt content on tensile strength of asphalt concrete.
Fig 7. Determination of optimum asphalt content.
21

22
Fig 8. Hobart mixer used for asphalt concrete.
9-in x Sin Aluminum Slab
( Top in Level with
Adjoining Wooden Pieces)
Wood Section
23*"in. x 23~-in. Inside
Clear Dimensions of Box
Fig 9. Typical arrangement for placing and compacting asphalt concrete.
23
24
Fig 10. Compaction of asphaltic concrete.

25
bottom encasing the asphalt concrete layer. The box was then filled with soil
in the manner described previously, The box was turned over for the slab test
on the surface of the asphalt-stabilized layer and then plate load tests were
conducted on the layer to determine a k-va1ue for the layered system.
Testing Procedure
Plate Load Tests
A series of plate load tests was conducted on the surface of both the clay
and the asphalt-stabilized layer using circular steel plates of 2, 4, 6, and
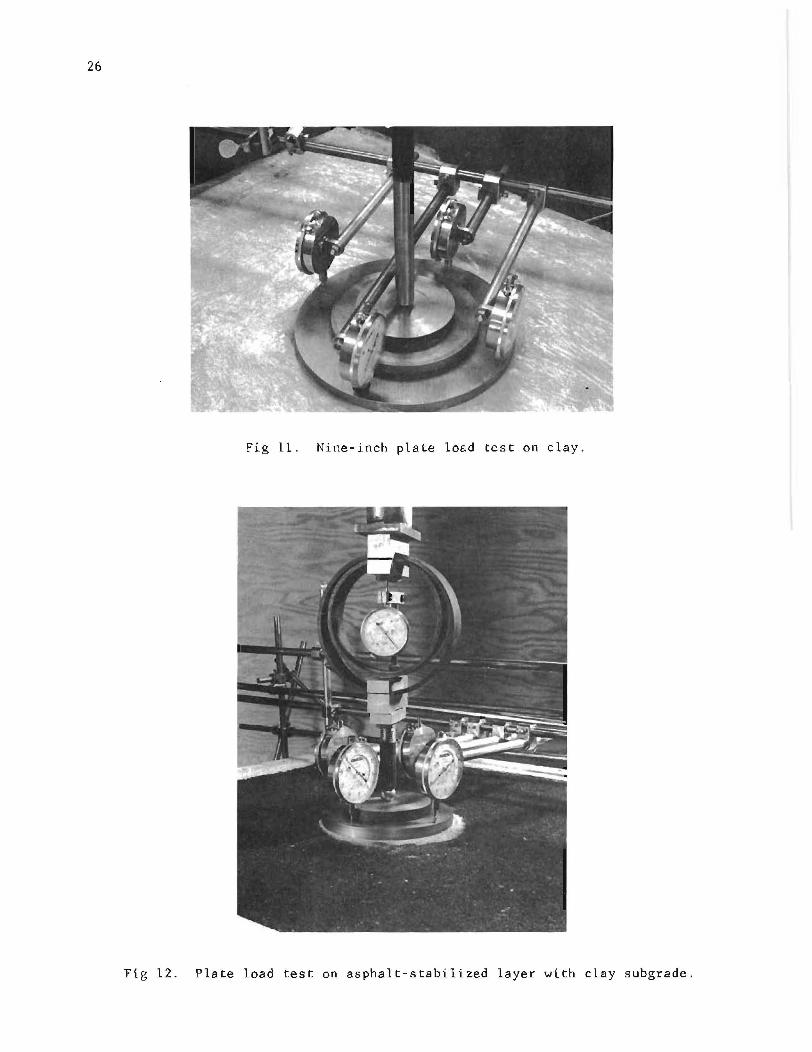
9-inch diameters (see Figs 11 and 12). A thin layer of fine sand was placed
over the leveled surface of clay and asphalt concrete to insure uniform contact
with the plate surface. Loads were applied under a controlled rate of strain
of .001 inch per minute. The loads were applied to the plate through a ball
to insure that they acted vertically. Plates were stiffened by placing sma11-
diameter plates over the bigger plates. This arrangement gives a better dis
tribution of pressure over the entire surface of the plate. It was assumed
that the deflection under the rigid footing plate was equal to the average de
flection of a uniformly-loaded, flexible circular area (Ref 46). In plate load
tests on clay, each plate was loaded until the soil reached bearing capacity
failure. The soil was considered to fail when there were large increases in
deflection without increase in load. The plate was unloaded and the rebound
recorded. For plate load test on an asphalt concrete layer, a limiting deflec
tion of .25 inch was established. Each plate was tested at different locations
on the surface of the clay at a distance at least the diameter of the plate from
the sides of the box. The detachable top and bottom covers of the box made it
possible to use both surfaces of the soil after turning the box over. Proving
ring readings were taken at close intervals of time and corresponding dial gage
readings were recorded.
Slab Test
Static and cyclic load tests were conducted on a thin aluminum with
an applied load-acting at the center of the slab (Figs 13 and 14). In order
to achieve a uniform contact of the slab with the asphalt concrete, the slab
was placed over the cover of the box (Fig 9) and asphalt concrete was laid.
The surface of the aluminum slab was lightly greased to break continuity with
the asphalt concrete surface.
26
fig 11. Nine-inch plate load test on clay.
Fig 12. Plate load test on asphalt-stabilized layer with clay subgrade.
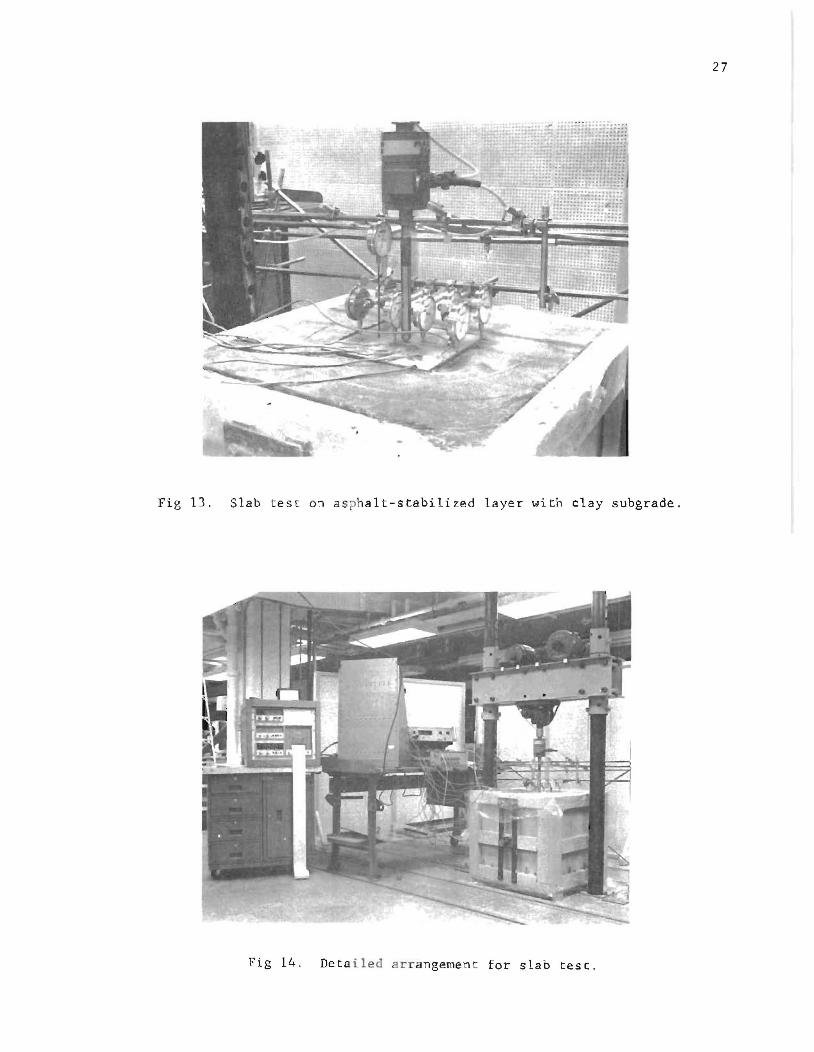
27
Fig 13. Slab test on a s phalt-stabilized layer with clay subgrade.
Fig 14. Deta iled arr angement for slab test.
28
Loads were applied at a controlled rate of strain of .001 inch per minute.
The plate was loaded to a maximum load of 200 pounds. Readings of dial gages
were recorded at intervals along with measurements of the load immediately
preceding each of the strain measurements. Load readings were also given by a
digital voltmeter to an accuracy of one pound. When a peak load of 200 pounds
was reached, the plate was unloaded, and readings were recorded on the unload
ing cycle in the same manner. Maximum recorded deflection at gage No. 1 was
noted for the first cycle (static case). Load was again applied to produce
the maximum deflection of the slab recorded in the first cycle. Readings of
loads and strains were recorded accordingly. The slab was loaded and unloaded
ten times in cyclic fashion, with repetition of the maximum recorded deflection.
During the first, fifth, and tenth c1~les of loading and unloading, reading of
dial gages, load, and strain data were recorded at close intervals of time.

CHAPTER 4. ANALYSIS OF PLATE LOAD TESTS DATA
Plate Load Tests on Clay
Three series of tests, A, E, and C, were conducted using the same type of
soil. They were preceded by the slab tests conducted by Agarwal and Hudson
(Ref 1). Load-deflection data from the plate tests were used in determining a
k-value for the soil. Series A provided a k-value for the soil used in the
analytical solution for comparison with the preliminary slab tests. Test Se
ries Band C provided k-values for analytical solutions for comparison with the
results of slab tests for center and two-point corner loading, respectively
(Ref 1). Unit load-deflection data for 9-inch, 6-inch, 4-inch and 2-inch plate
tests, for Series A, ~, and C, are given in Appendix 2, Tables A2.l to A2.4,
respectively. Unit load versus deflection curves are plotted as shown in Figs
15, 16, and 17. The average data for the three series of tests are plotted
in Fig IS.
The data obtained in these three series of tests afforded two significant
comparisons. They showed first the reproducibility of the data. For this
comparison, the data showed that for a given plate size (within the 2 to 9-inch
diameter range) essentially the same load-deflection curve for soil was recog
nized in each of the three tests performed on the Taylor marl clay. To illus
trate the similarity, pressure-deflection curves for 9-inch-diameter plate are
given in Fig 19 for the three tests.
The second significant observation from the data was the important effect
of plate area on the pressure intensity required to produce a given plate
deflection on the soil in question. For the same unit load, the deflection
increased as the plate diameter increased (Fig IS). The significance of this
observation was that since tire footprint area decreases as tire pressure in
creases, greater deflection under a given load with a relatively high tire
pressure might be expected than with a relatively low tire pressure. From the
pressure-deflection curves, it is also observed that ultimate soil pressure
varied under different plates tested. The variation in failure pressure is
not significant.
29
10
9
8
7
6
CjI
5 Q.
., ... :::I en 4 en ., ...
0..
3
2
Series A
Numbers Denote Plate
Diameter in Inches
0.04 0.08 0.12 0.16 0.20
Deflection, inch
Fig 15. Pressure versus deflection curves for rigid plate tests of the clay subgrade, Series A.
w 0
0.24
9.0
8.0
7.0
6.0
5.0
'iii Q.
'" 4.0 ... ::J .. '" ;.
3.0 .
2.0
1.0
o
Series B
0.04 0.08
9
~Numbers Denote Plate
Diameter in Inches
0.12 0.16
Deflection. inch
0.20
Fig 16. Pressure versus deflection curves for rigid plate tests of the clay subgrade, Series B.
0.24

9.0
8.0
7.0
6.0
5.0
iii CL
CD 4.0 !; III ... CD ~
Q.. 3.0
2.
1.0
o
Series C
0.04 0.08
9
'----Numbers Denote Plate
Diameter in Inches
0.12 0.16
Deflection I inch
0.20
Fig 17. Pressure versus deflection curves for rigid plate tests of the clay subgrade, Series C.
0.24
9
8
7
6
5 ., Q.
! 4 ::I ., ., l! I:L
3
2
o
Numbers Denote Plate
Diameter in Inches
0.04 0.08 0.12 0.16 0.20
Deflection • inch
Fig 18. Average pressure versus deflection curves for plate load tests on clay, Series A, B, and C.
0.24
9
8
7
6
5 '. Ct.
e 4 i III • ... 0-
3 x: Series A
A: Series B
2 o =Series C
0.04 0.08 0.12 0.16 0.20 0.24
Deflection , inch
Fig 19. Pressure versus deflection curves for 9-inch plate load tests on clay.

35
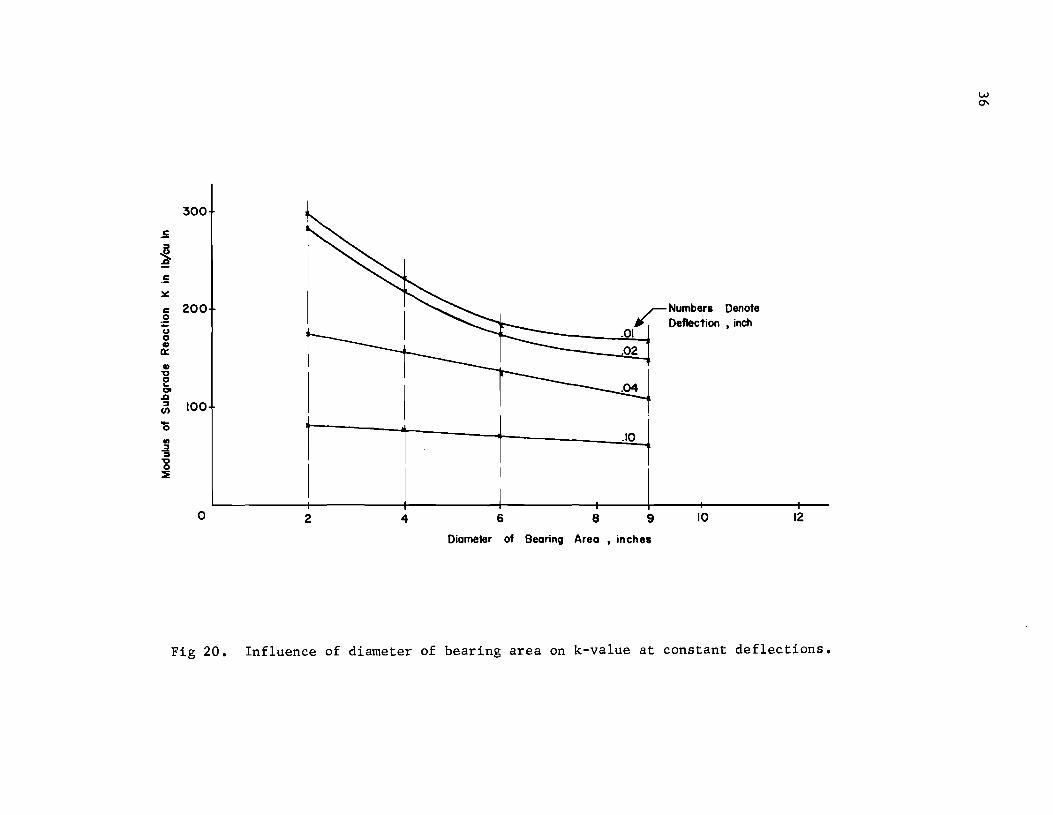
Using the data shown on Fig 18 and the tangent modulus and secant modulus
approaches, the value of k was calculated. The influence of the loaded area
on k is shown in Fig 20. It is noted that in using the tangent modulus ap
proach, k-value increases with the decrease in plate size. At higher deflec
tions the effect of plate area on the k-value (secant modulus) ceases.
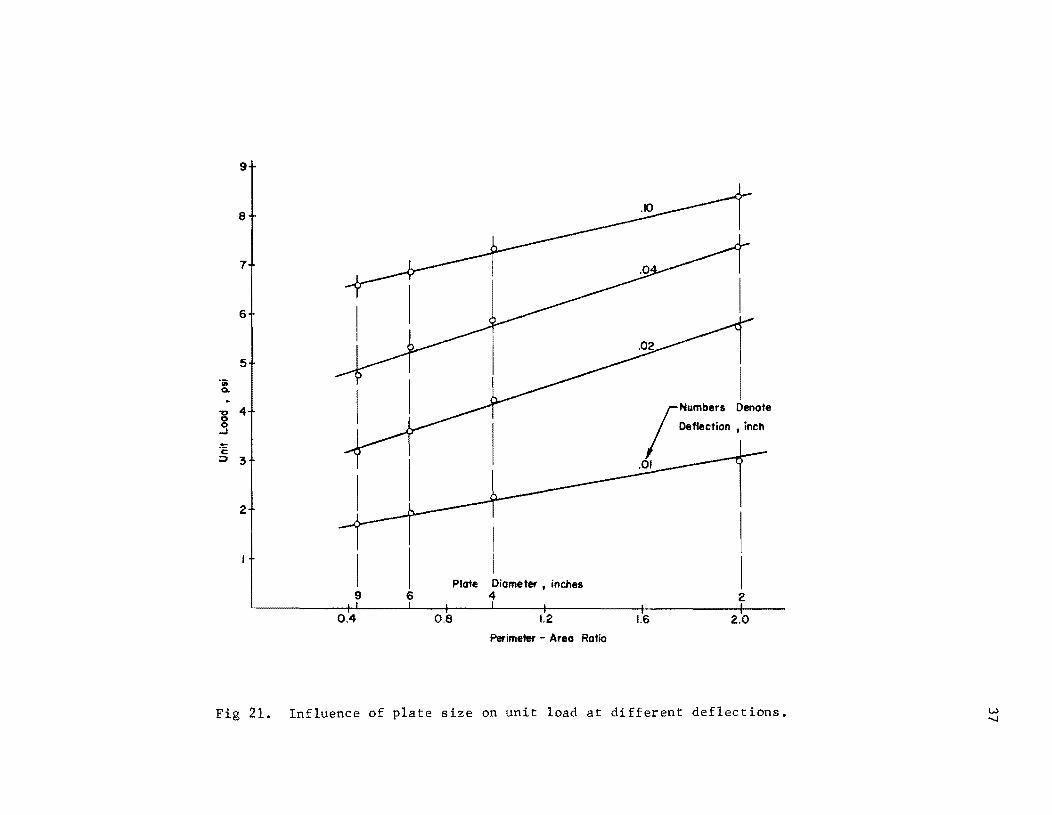
By plotting unit-load versus perimeter-area ratios for the plates at con
stant deflections of .01, .02, .04, and .10 inch, it is observed (Fig 21) that
a linear relationship holds good for the two parameters, as previously demon
strated by several investigators, including Housel (Ref 22), Hubbard and
Field (Ref 23), Campen and Smith (Ref 9), Teller and Sutherland (Ref 43),
Middlebrook and Bertram (Ref 33), McLeod (Ref 31), and others.
Attempts to linearize the load-deflection data of the plate load tests on
semi-log and log-log plots using various parameters, including a dimensionless
parameter, were unsuccessful. The plot of pressure versus the deflection to
diameter ratio related all the data, as shown in Fig 22. The data from all
the tests fell reasonably close together on a straight line for deflections
as low as .01 inch. At higher unit loads and higher deflections, the data
fell on the curve shown. This method of plotting deflection to diameter ratio,
on a log scale, reduces the scatter of the data, making it possible to predict
load-deflections of any size plate within the range of plate sizes used in this
study. The data in Fig 20 indicate that when tests to determine the value of soil
modulus or soil stiffness coefficient k are made, the deformation must be limit
ed to a magnitude within the range of pavement deflection, and that, therefore
it is important to use a bearing plate of adequate size (as large as possible).
Agarwal and Hudson (Ref 1) chose the load-deflection data from the 9-inch-
diameter plate load test to determine the soil modulus k They used this
value of k in their comparison of calculated and measured values of deflec
tions and stresses in a test of a small slab (9 X 9 inches) resting on Taylor
marl. Their report provides detailed information on these comparisons and the
use of the pressure deflection curves of the clay.
Plate Load Tests on Layered System
To evaluate a representative k-value for a two-layered system, a series of
load tests was performed on the surface of an asphalt-stabilized layer using
rigid circular plates of 2, 4, 6, and 9-inch diameters. The load-deflection
data are summarized in Appendix 2, Table A2.5. The procedure for plotting the
300
£ :::I
~ ,g
.~
~
r:: 200 ~ Numbers Denote 0 :; Deflection • inch u .01 0 CD 0::
CD "0
I
0 ~
011 ,g :I 100 (/)
0
1 j ~1 at ..:z :::I "0 0
I ::It
0 2 4 6 8 9 10 12
Diameter of Bearing Area • inches
Fig 20. Influence of diameter of bearing area on k-value at constant deflections.
9
8
7
6
5
'iii 0..
"CI 4 101 101 -' :!:: c:
::;:) 3
2
9 6
0.4 0.8
Plate Diameter I inches 4
1.2
Perimeter - Area Ratio
Deflection I inch (N"m .. " O,"ote
.01
2
1.6 2.0
Fig 21. Influence of plate size on unit load at different deflections. W -....I

10 x - 9-m. - Diameter Plate Data
I>. l!.
0- 6-in. - Diameter Plate Result 6
c- 4-in. - Diameter Plate Result
A - 2-in. - Diameter Plate Result Higher Deflection
5
.001 .01 0.1
Deflection/Diameter. log scale
Fig 22. Pressure versus ratio of deflection to diameter of plate for plate tests on clay.
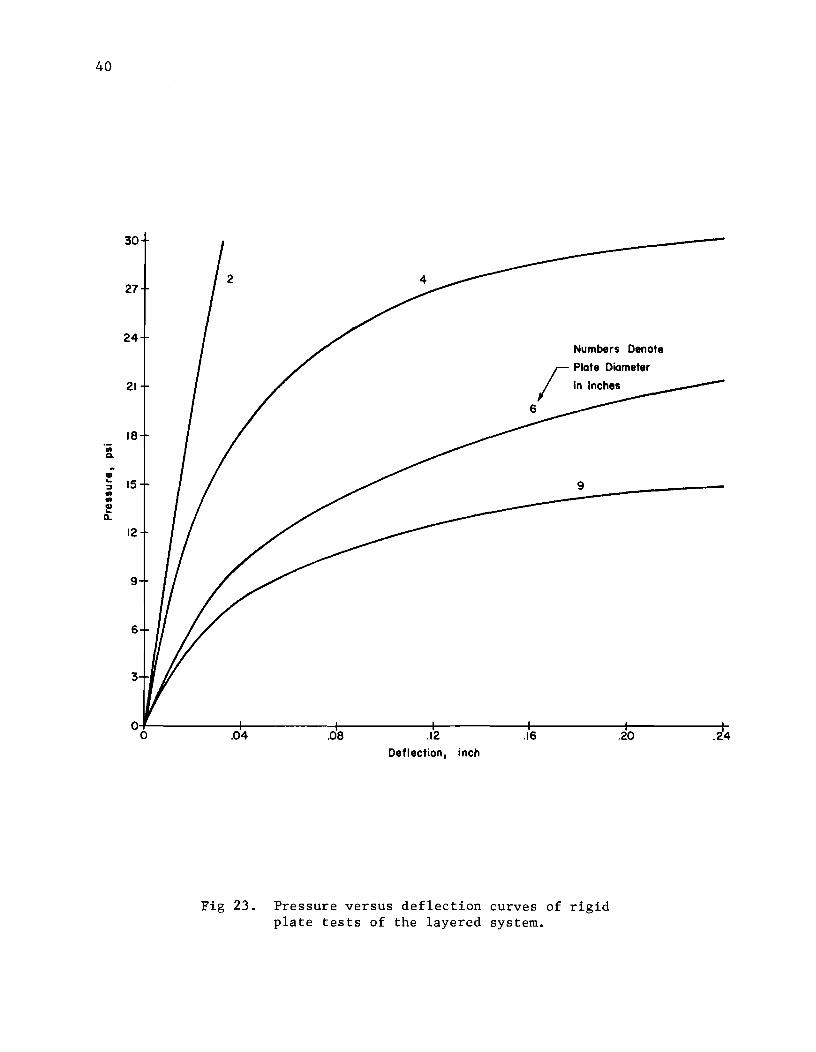
data was the same as used for the load-deflection data for plates tested on
clay. In Fig 23 the unit load is plotted against the deflection. The max
imum deflection was limited to .25 inch in tests. Almost the same conc1u-
39
sions were derived from these tests as from tests on clay mentioned previously;
namely, for the same pressure the deflection increased with plate diameter.
One of the objectives of this study was to compare load-deflection sup
port characteristics of the two systems, i.e., clay subgrade alone, and
asphalt-stabilized layer over the clay subgrade, and thus evaluate the in
crease in the value of k resulting from the addition of the asphalt-stabilized
layer. Figure 24 demonstrates the load-deflection curves for clay (average of
the three tests) and for the asphalt-stabilized layer for load tests on the 9-
inch-diameter plate. Table 1 shows the increase in k-va1ue at several levels
of deflection. It is noted that the use of the asphalt-stabilized layer in
creased the initial tangent modulus value of k by 41 percent. Other values
of modulus are increased accordingly. Thus the composite action of the asphalt
concrete layer and the clay subgrade provided a significant increase in the
supporting strength at a given deformation level.
TABLE 1. IMPROVEMENT OF k-VALUE BY STIFFENING CLAY SUBGRADE WITH A LAYER OF ASPHALT CONCRETE FOR THE 9-INCH PLATE TEST
Clay sub grade
Layered system
(Asphalt con-crete layer on clay)
Tangent Modulus
k
in 1b/in
170
240
at 0.02-inch 3 Deflection
150
235
Secant Moduli in 1b/in 3
at at at 0.04-inch 0.08-inch o .lO-inch Deflection Deflection Deflection
110 75 63
200 135 108
40
30
27
24
21
18 at Q.
• ... 15 ::J .. .. <II ... a.
12
9
6
3
0 0 .04 .08 .12
Deflection, inch
6
.16
Numbers Denote
r Plate Diameter
I in Inches
9
.20
Fig 23. Pressure versus deflection curves of rigid plate tests of the layered system.
.24
15.0
13.5
12.0
10.5
9.0
". Q.
oi 7.5 .. ::I 1/1 1/1 ., ..
CL 6.0
4.5
3.0
1.5
0 0
Asphalt Stabilized Layer
.04 .08 .12 .16 .20
Deflection. inch
Fig 24. Pressure versus deflection for 9-inch plate tests on the clay subgrade and on the layered system.
41
.22
42
Application of Elastic-Layered Theory
Burmister's theory for a two-layered system was investigated for use in
predicting the load-deflection characteristics of the asphalt-stabilized layer
and its solution was compared with the plate load test data.
The deflection of a rigid plate on the surface of a two-layered system is
determined from Eq 11, Chapter 2 (terms are defined on page 8):
w = 1 18 ~ F . E 2
The factor F is a function of the modular ratios of materials in two
layers, E1/E 2 • Thus, to predict deflection from any size of plate, the
values of E1 and E2 are required.
Determination of E2
The modulus of elasticity of subgrade soil E2 is obtained from conven
tional plate load test data on the subgrade soil (Fig 18) by the use of Eq 12,
which is the same as Eq 11, except for the factor F which becomes unity
when only the soil mass is under consideration.
= 1.18 ~ w
(12)
From plate load data (Fig 18) for different values of deflection w,
and corresponding values of pressure p, values of E2 were calculated for
9-inch, 6-inch, and 4-inch-diameter plates, using Eq 12. Since the calculated
value of E2 (Fig 25) varies not only with the size of the plate, but also
with the amount of deflection, it is not possible to specify a constant value
of E2 for the soil mass.
Determination of El
The modulus of elasticity of the asphaltic material, El , used in the
tests can be found by various methods, including the indirect tensile test
(Ref 37), the plate bearing test, and the methods suggested by Van der Poel
(Ref 48). In this study, El is determined from the indirect tensile test
and a crude estimate is obtained, using Van der Poel's method.
900
800
700 iii c:r.
is' 600
• '0
i 500
::00. .!i! u
400 '0 • .2
1 300 :::E
200
100
o
o - 9-in.- Diameter PIote
11.- 6-1n.-Diameter Plote
o - 4-in.- Diameter Plate
04 .08 .12 .16 .20
Deflection , Inches
Fig 25. Influence of plate diameter and deflection on the modulus of elasticity of clay soil.
44
For the indirect tensile test, cylindrical specimens of asphalt concrete
were prepared and tested as described in Appendix 1. Vertical and horizontal
deformations of specimens were measured. The theoretical treatment of the test
data is based on linear elastic equations derived by Hondros (Ref 21). The to
tal deformation in either direction in terms of modulus of elasticity and Pois
son's ratio equals the sum of the strains of all individual elements along the
principal axes. These total strain equations are then set equal to the total
measured deformation in the two principal directions, leaving two equations and
two unknowns. Formulas for E and v are then obtained by solving the two
equations simultaneously. The technique (Ref 37) used for estimating the mod
ulus value involved a closed-form solution of each equation by complicated mathe
matical integrals through the use of a computer. The value of E1 was thus
computed to be 34,000 psi at 770
F. Asphalt was recovered from a specimen of
the asphalt concrete layer and measurements were made for the penetration at
770 F and for the ring and ball softening point temperature. With these data
and from the knowledge of the volume concentration of the aggregate used, the
stiffness modulus E1 of asphalt concrete was computed using the method in a
nomograph prepared by Heuke10m and Klomp (Ref 18). The value of E1 was com
puted to be 20,000 psi, which is lower than the value obtained from the in
direct tensile tests of the asphalt concrete specimen.
Thus with known values of E1 and E2 and the ratio of thickness of the
layer to the radius of the plate, the deflection factor F is obtained with
the assistance of an influence chart (Fig 26) developed by Burrnister (Ref 7).
Now, for any value of deflection, the corresponding pressure on any size of
plate is calculated from Eq 11, which can be rewritten as
p = 1.18 aF
(Definitions of terms may be found on page 8.)
A comparison of the measured and predicted pressure deflection values
for the range of conditions investigated is shown in Fig 27. It is noted that
for small deflections the corresponding measured values of pressures follow
more closely the predicted values based on E1 = 34,000 psi than the values
of pressures obtained by using E1 = 20,000 psi. At higher deflections the
variation in the two curves tends to increase. The computed values for pressure
1.0
0.9
0.8
L&.. 0.7
-c:: 0.6 G
'u --G 0.5 0 (.)
-c:: OA G E .!! - 0.3 -CD (/)
0.2
0.1
0 0
ModulUS of subQrode -
+ h +
20 ----l
Modulus - EI ReinforcinQ Loyer - I
Ratio . f On" Loyer
"'Modulus of Rein orca .. Modulus - Ez SUbQrocle Loyer - 2
2 3 4 5 6 7 8 Ratio of the Radius of the Flexible Beorino Area to the Thickness of the Reinforcino Loyer
Fig 26. Influence curves of the settlement coefficient -F for the two-layered system (after Burmister, Ref 7).
9 a h
10

46
26
24
22
20
18
16
.. Q.
~ ., 14 ... ~ .. lit ., ... a.. 12
10
8
6
4
2
0 0 .02
/ J.:
r
.04 .06
Deflection, inch
4. in. - Diameter Plate
"
~ /
/
- Measured
6-in~ Diameter
Plate
}
9-in.-Diameter
Plate
.-. Predicted (Based on E. = 20,000 psi)
.-. Predicted (Based on E. = ~4,OOO psi)
.08 .10
Fig 27. Comparison of pressure deflection data from plate load tests with predictions according to Burmister's theory for two-layered system.

47
are lower than the measured values for the 9" diameter plate and higher than
the measured values obtained from the 4" and 6" plate load tests.
Since it has been shown previously that the value of E2 is dependent
on plate size and amount of deflection, it is quite probable that the same
analogy applies to the value of El
, and further studies are warranted to
investigate this relationship.

!!!!!!!!!!!!!!!!!!!"#$%!&'()!*)&+',)%!'-!$-.)-.$/-'++0!1+'-2!&'()!$-!.#)!/*$($-'+3!
44!5"6!7$1*'*0!8$($.$9'.$/-!")':!

CHAPTER 5. EFFECT OF STIFFNESS OF ASPHALT-STABILIZED IAYER
A limited study was conducted to investigate the effect of increasing
the stiffness of the asphalt-stabilized layer on the load-deflection char
acteristics of the layered system. This provided an easy method of evalu
ating the effect of E of the stabilized layer on the improved k-va1ue of
the two-layered system investigated herein.
Asphalt is a thermoplastic material and any change in temperature af
fects the stiffness of the asphaltic material. Recently, extensive investi
gations (Refs 10, 29, 32, 34, and 38) have been conducted to measure the
stiffness of asphalt concrete with time-temperature dependencies. Hudson and
Kennedy (Ref 24) showed that temperature and variation of the loading rate
have a significant effect on the indirect tensile strength and failure deform
ations of asphaltic materials.
Development of Test Program
With the test set-up described in Chapter 3, it was relatively simple to
conduct a series of plate load tests on the surface of the thin asphalt con
crete layer (2.0-inches thick) at temperatures of 400, 77 0
, and 1000 F, using
a 6-inch-diameter plate. This provided a range of stiffness values in the
asphaltic layer. The tests were conducted in one of the controlled environ
ment chambers at The University of Texas. This chamber is capable of achiev
ing temperatures ranging from _200 F to +1400 F, ±2° F, and maintaining them
for long periods of time. The chamber was first cooled down to 40 0 F and
stabilized for 36 hours. Then the plate load tests at this temperature were
performed. In a similar manner the temperatures were stabilized for nearly
three days at 77 0 F and 1000 F, respectively, to conduct subsequent tests.
Test Results
o 0 Unit load-deflection data for the three tests conducted at 40 , 77 , and
1000
F are plotted in Fig 28. The plots show that for the same applied load
49
50
'iii Q,
~
II ~
~
'" .. .. ~ n.
Testing Temperature, of
12.0
110
10.0
9.0
8.0
70
6.0
5.0
4.0
3.0
2.0
1.0
0~---------1-----------r----------~---------+----------+-----~o .01 .02 .03
Deflection, inch
.04 .05
Fig 28. Pressure versus deflection for a 6-inch plate tested on layered system at different temperatures.
.055

51
the deflection of the plate increases with the increase of testing tempera
ture. In other words, the asphalt-stabilized layer withstood greater loads
at low temperatures than at high temperatures within the range of 400 and
1000
F.
From the load-deflection data, the value of k, which is a composite
measure of stiffness and pavement support, was obtained for each testing tem
perature using tangent and secant moduli approaches. In Fig 29, the value of
k is plotted versus temperature at constant deflections. It can be seen
that the k-value of the system decreases with the increase in temperature,
and the range of variation in k-value is larger at lower deflections than at
higher deflections as shown in the following table.
TABLE 2. EFFECT OF TEMPERATURE ON k-VALUE AT VARIOUS LEVELS OF DEFLECTION
Temperature, of Value of k at Constant Deflection of
.005 in. • 01 in. .02 in. .05 in •
40 550 430 340 240
77 425 340 280 210
100 310 280 245 180
Calculation of El
The Burmister theory for the two-layered system was used in calculating
the modulus of asphalt-stabilized layer El from plate load tests on clay
and on the asphalt-stabilized layer at temperatures of 400, 77
0, and 100
0 F.
There were two different methods used to calculate the modulus, El , of the
asphalt-stabilized layer. The first method assumed that the load-deflection
characteristics of the clay were insignificantly changed during plate tests
while the second method allowed for changes in both the asphalt and clay
layers. The results of these two methods should provide limits within which
the actual modulus value, E , would fall.
The modulus of elastici ty of the clay subgrade, E2 ' was computed from
the load-deflection data from the 6-inch plate test on clay by the use of
Eq 12. The settlement factor F was computed with the ca lcu la ted value of
500
_ 400 u Q,
:.::
c: 0 ;: u 0
" 300 a::
" 'tI 0 ... 0>
.Q :s
U)
'8 200 .,. :s :; 'tI 0 ~
100
0 20 40 60 1780 100
Temperature • 0 F
Fig 29. Influence of temperature on composite k-value of layered systems at various levels of deflection.
Denote
• inch
VI N

53
E2 and the data from the 6-inch plate test on an asphalt-stabilized layer by
using Eq II.
Fig 26.
With the known values of F and a h '
was determined from
In this manner, values of El at different temperatures were determined
(Fig 30). Thus, it was observed that variations in temperature had a consider-
able influence on the pavement modulus El •
k versus El
It was observed that the modulus of the asphaltic material of layer El
directly affected the load-deflection characteristics of the asphaltic layer;
or, in other words, k-value, which is a ratio of pressure and deflection
(k = .E) w
is directly related to El
• For use in studying the influence of
El on k, Table 3 was prepared. It shows the corresponding values of El
and k for the different levels of deflection and at the different tempera
tures considered in this study. It can be noted that with the increase in
temperature from 400 F to 1000 F, the value of El for a constant value of
E2 = 575 was reduced from 76,500 psi to 9950 psi (87 percent reduction) while
the k-value decreased from 550 psi to 310 psi (44 percent reduction) at a
constant deflection of .005 inch. Similarly the value of El for a varying
value E2 for the clay was reduced from 93,000 psi to 13,000 psi (86 percent
reduction) for an increase in temperature from 400
F to 1000
F. For each level
of deflection, the value of El decreased more rapidly than the k-value as
temperature increased.
Thus, k-value, which is a measure of pavement deformation, depends upon
the modulus of the asphalt-stabilized layer investigated herein. This cursory
study shows the variation of supporting capacity of the system with changes in
the El value of the reinforcing layer as indicated by the k-value. No firm
conclusions are drawn from this preliminary study, but the wide variations of
pavement support observed point out the complexity of the problem and warrant
further study.

90
•• Go 70 ..
.01
.02-.-__ _
OL-_____ ·04-4: ________ ~I------_+--20 40 60 80
Temperature, of
(a) Constant modulus E2 assumed for clay layer.
... • ~60 ..J
" ~ 50 J:I o u; I
:!: 40 .2 a. l1li
! 30 o !l ~ 20 o :15
10
OL-______ ~--------+-------_+-------~~I---ro ~ 60 00 ~
Temperature, of
(b) Varying modulus E2 assumed for clay layer.
Fig 30. Effect of temperature on El ' the modulus of elasticity
of asphaltic material layer.
N ~
.j.J
c:: to
.j.J CI)
c:: 0 t.)
N ~
00 c::
..-I >. I-< to :>
TABLE 3. VALUES OF E AND k AT CONSTANT TEMPERATURES AND DEFLECTIONS*
0 Temperature, F 40 0 nO 100 0
Def1ec tion, in. .005 .01 .02 .04 .005 .01 .02 .04 .005 .01 .02
Modulus of Subgrade E2 ' psi ** 575 575 575 575 575 575 575 575 575 575 575
Modulus of Asphalt Stabilized Layer
E1 ' psi 76500 34500 13000 5200 31000 11500 7900 4200 9950 5750 4100
Modulus of Subgrade E2 ' psi 525 500 425 335 525 500 425 335 525 500 425
Modulus of Asphalt Stabilized Layer
E1 ' psi 93000 46500 31000 23500 41000 20500 18000 16750 13000 8700 8700
k-Va1ue for the layer, pci 550 425 335 260 425 340 290 235 310 275 235
*Computed from the results of the 6-inch plate test on an asphalt-stabilized layer and clay subgrade.
**Average value of E2 is used.
.04
575
1800
335
8700
200
V1 V1

!!!!!!!!!!!!!!!!!!!"#$%!&'()!*)&+',)%!'-!$-.)-.$/-'++0!1+'-2!&'()!$-!.#)!/*$($-'+3!
44!5"6!7$1*'*0!8$($.$9'.$/-!")':!
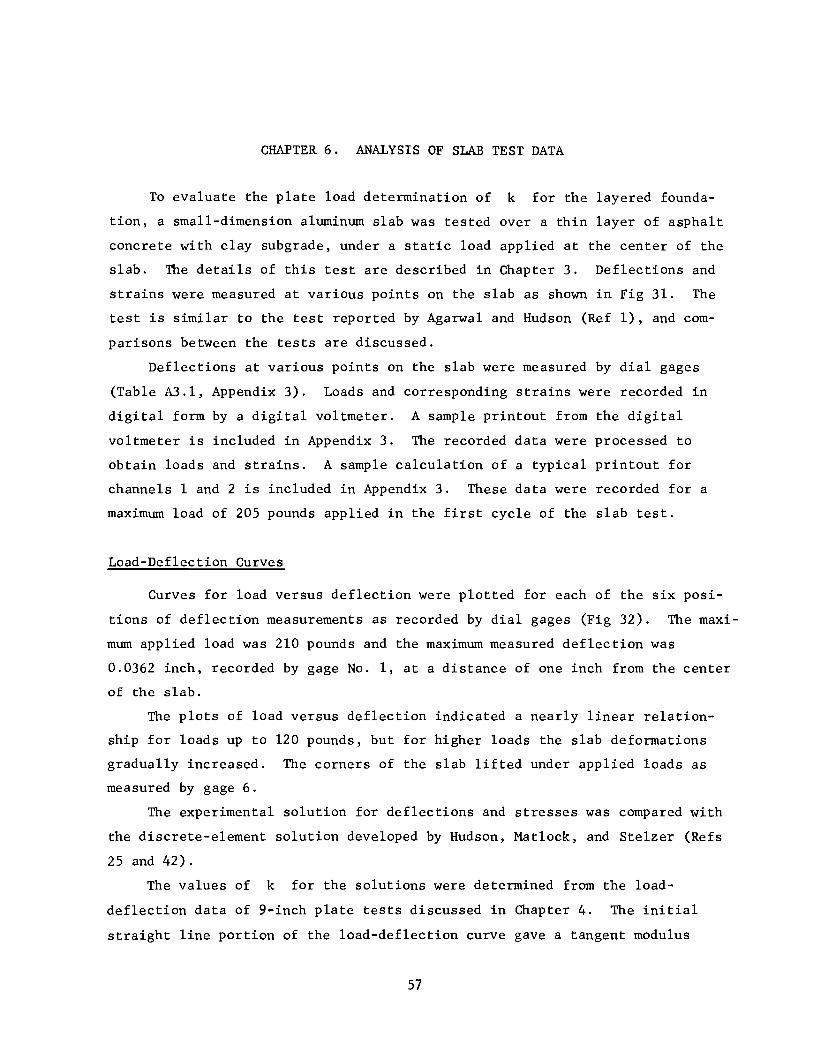
CHAPTER 6. ANALYSIS OF SLAB TEST DATA
To evaluate the plate load determination of k for the layered founda
tion, a small-dimension aluminum slab was tested over a thin layer of asphalt
concrete with clay subgrade, under a static load applied at the center of the
slab. The details of this test are described in Chapter 3. Deflections and
strains were measured at various points on the slab as shown in Fig 31. The
test is similar to the test reported by Agarwal and Hudson (Ref 1), and com
parisons between the tests are discussed.
Deflections at various points on the slab were measured by dial gages
(Table A3.1, Appendix 3). Loads and corresponding strains were recorded in
digital form by a digital voltmeter. A sample printout from the digital
voltmeter is included in Appendix 3. The recorded data were processed to
obtain loads and strains. A sample calculation of a typical printout for
channels 1 and 2 is included in Appendix 3. These data were recorded for a
maximum load of 205 pounds applied in the first cycle of the slab test.
Load-Deflection Curves
Curves for load versus deflection were plotted for each of the six posi
tions of deflection measurements as recorded by dial gages (Fig 32). The maxi
mum applied load was 210 pounds and the maximum measured deflection was
0.0362 inch, recorded by gage No.1, at a distance of one inch from the center
of the slab.
The plots of load versus deflection indicated a nearly linear relation
ship for loads up to 120 pounds, but for higher loads the slab deformations
gradually increased. The corners of the slab lifted under applied loads as
measured by gage 6.
The experimental solution for deflections and stresses was compared with
the discrete-element solution developed by Hudson, Matlock, and Stelzer (Refs
25 and 42).
The values of k for the solutions were determined from the load
deflection data of 9-inch plate tests discussed in Chapter 4. The initial
straight line portion of the load-deflection curve gave a tangent modulus
57
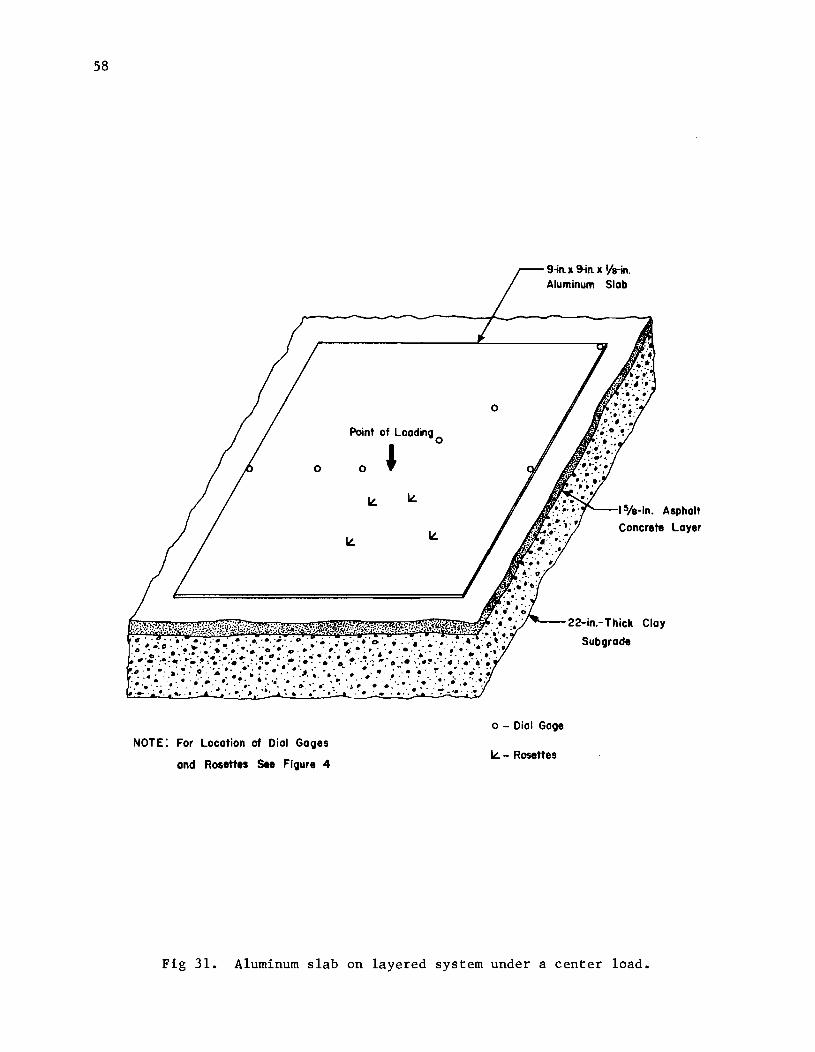
58
NOTE: For Location of Dial GaQes
and Rosettes See FIQure 4
Point of LoadinQ
J 0
o
9-in It 9-in It Va-in. Aluminum Slab
Concrete Layer
Clay
Subgrade
o - Dial Gage
k:. - Rosettes
Fig 31. Aluminum slab on layered system under a center load.
200
f 1 f ! I / /
160 I I 1/ I / /
/0/ t 120 ~/ I
:!! /:/ . 1 ;// 'a 0
j 80
I 0- Gage I
/ /::: •• Gage 2
/l. - Gage 3
/ // .to - Gage 4
40 // D - Gage 5
j / /;;/ • - Gage 6, (Uplift)
?~/ 0 .005 .01 DIS .02 .025 .03 .035 .04
Deflection , inch
Fig 32. Load versus deflection for gage points located on slab.
60
value of k equal to 240 lb/cu in. This k-value was used as a linear spring
value for the solution of the test slab. A nonlinear q-w curve, developed
directly from load-deflection data, was used for the solution of the slab
based on nonlinear support.
Comparison of Experimental and Analytical Solutions for Deflections
The experimental and analytical solutions for deflection in slabs are
compared in Figs 33, 34, 35, and 36. These figures show the comparison of
the solutions for deflections of the slab on points along its center line
and the diagonal for loads of 100 and 200 pounds, respectively.
The two solutions were compared and the percentage errors were cal
culated. The calculation of percentage error was based on the maximum measured
deflection in the slab test and was taken equal to:
where
% error = x 100
wE = measured deflection of any point in slab,
Wc = corresponding computed deflection of the point in slab,
= maximum measured deflection in slab (measured to be 0.0325 inch for a point 1.0 inch away from the center of the slab).
Tables 4 and 5 show the comparison of deflections of the slab as obtained
from the experimental and the analytical solutions. The comparison was good
in the interior two-thirds of the slab around the point of application, where
the experimental data were within 6 percent of the analytical solution.
The analytical solutions with linear and nonlinear springs gave similar results.
The similarity of results may be due to the fact that the load-deflection curve
of gage 1 which measured the maximum deflection appeared to be linear up to
200 pounds. For 100 pound load, the solutions showed less percentage error
on the whole than for the load of 200 pounds.
For deflections at the corner and the edge of the slab, the two solutions,
experimental and analytical, differed considerably. Computed deflections were
lower than the measured deflection by 12 to 15 percent for points on edge, and
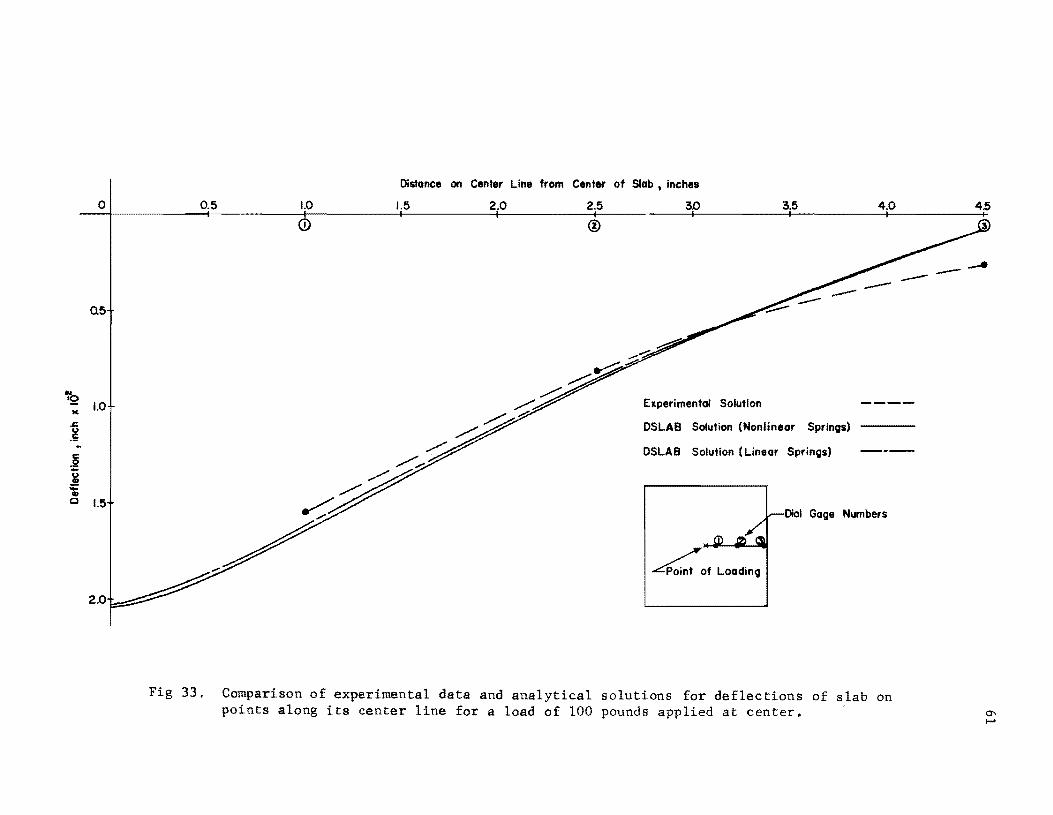
~ K
.c
.~ c .l2 -¥ ;;::: \1)
o
0.5
1.0
o 1.5
0.5 1.0
Distance on Center Line from Center of Slab, inches
1.5 2.0 2.5 3.0 3.5
Elperimental Solution
DSLAB Solution (Nonlinear Springs)
DSLAB Solution (Linear Springs)
4.0
Dial Gage Numbers
.LOf Loading
Fig 33. Comparison of experimental data and analytical solutions for deflections of slab on points along its center line for a load of 100 pounds applied at center.
4.5
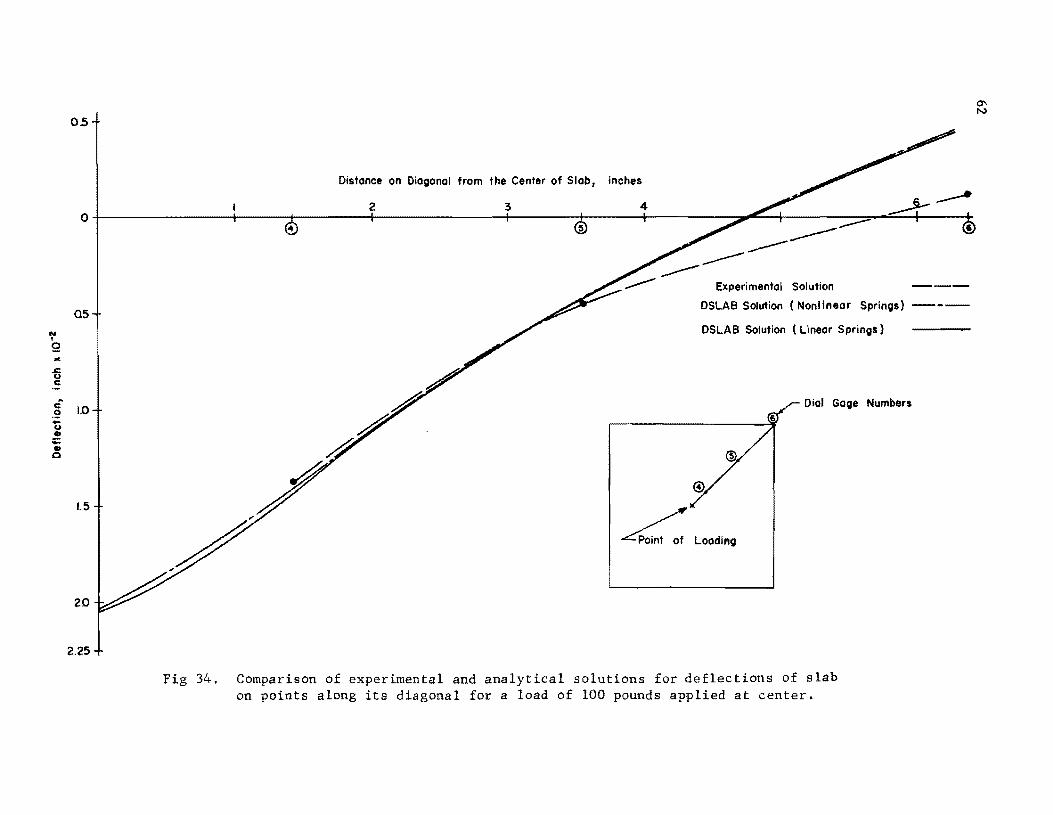
N I g
'" s::. u c:
,£ .9 -u .. ;:: .. 0
05
Distance on Diagonal from the Center of Slab. inches
2 4 ~----0+-------------~------r_------~--------------r_------+_----_+--------~ __ ~4_--------=_~~~--~ @
as
1.0
1.5
2.0
2.25
Experimental Solution ---
DSLAB Solution (Nonlinear Springs) -----
DSLAB Solution (Linear Springs)
Dial Gage Numbers
4. Loading
Fig 34. Comparison of experimental and analytical solutions for deflections of slab on points along its diagonal for a load of 100 pounds applied at center.
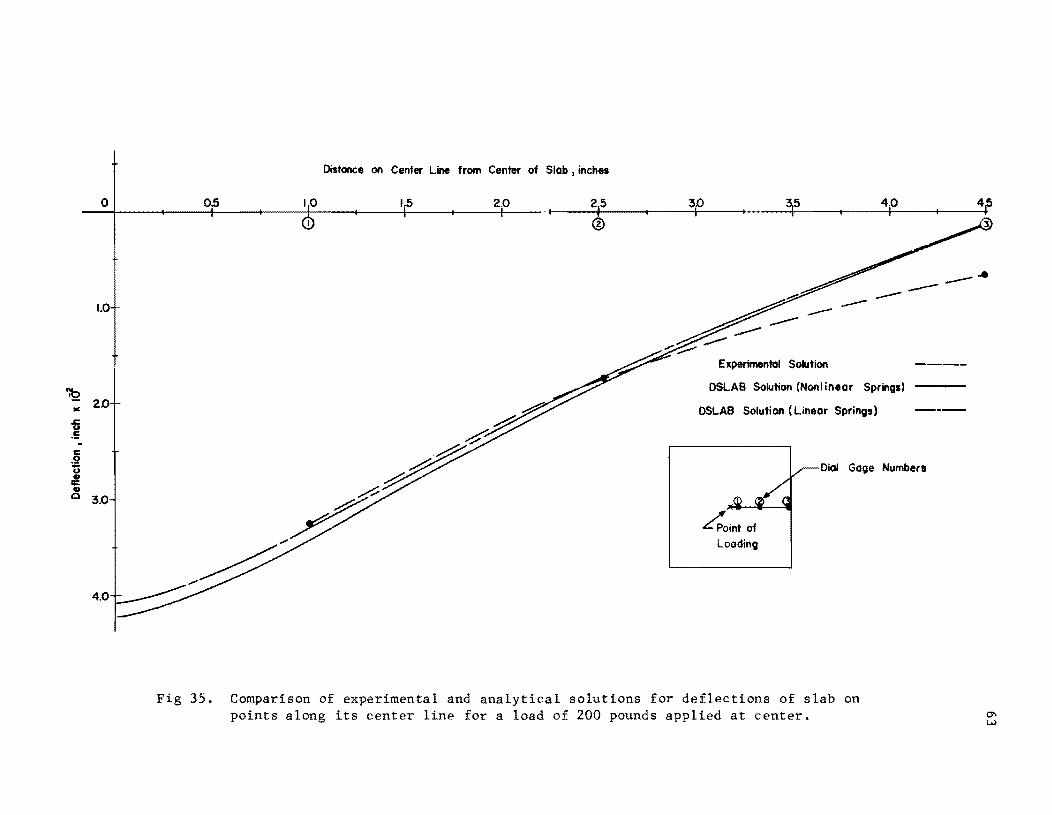
o
I.
'lQ J( 2D .: u .5
4.0
Distance on Center Line from Center of Slab I inches
0.5 1.0 1.5 2.0 25 30
~--"-:::::;;.- ---
Experimental Solution
4.0
__ .e ----DSLAB Solution (Nonlinear Springs)
DSLAB Solution (Linear Springs)
/POint of Looding
Dial Gage Numbers
Fig 35. Comparison of experimental and analytical solutions for deflections of slab on points along its center line for a load of 200 pounds applied at center.

-1.0
o
1.0
N
'Q
- 2.0 I: o :;: u .!! -• Q
3.0
Distance on Diagonal from the Center of Slab t inches
10 40
------.----
~ ~---~ Experimental Solution
h /~ DSLAB Solution (Nonlineor Springs' p/ DSL'. Solut ... (Lo- ....... )
/. Y Dial Gage Numbers
/ /~
~LOoding
4DV' Fig 36. Comparison of experimental and analytical solutions for deflections of slab
on points along its diagonal for a load of 200 pounds applied at center.

TABLE 4. COMPARISON OF EXPERIMENTAL AND ANALYTICAL SOLUTIONS FOR DEFLECTIONS FOR SLAB TEST
Solutions
Experimental
Linear springs % Error
Nonlinear springs % Error
1
1 inch
0.01550
0.01649 - 6 .38
0.01633 -5.35
Load: 100 1b at center
Programs: DSLAB 30 (linear springs) DSLAB 26 (nonlinear springs)
(18 X 18 increments)
Dial Gages (Deflections measured in inches)
2 3 4
2.5 4.5 l.41 inches inches inches
0.00825 0.00275 0.01375
0.00872 0.00082 0.01423 -3.03 12.45 -3.09
0.00862 0.00080 0.01408 -2.39 12.58 -2.12
Note: Plot along the center line is shown in Fig 33.
5 6
3.54 6.36 inches inches
0.00450 -0.00l20
0.00421 -0.00481 1.87 -23.2
0.00415 -0.00467 2.26 -22.4

TABLE 5. COMPARISON OF EXPERIMENTAL AND ANALYTICAL SOLUTIONS FOR DEFLECTIONS FOR SLAB TEST
Solutions
Experimental
Linear springs % Error
Nonlinear springs % Error
1
1 inch
0.03250
0.03299 -1. 51
0.03424 -5.36
Load: 200 1b at center
Programs: DSLAB 30 (linear springs) DSLAB 26 (nonlinear springs)
(18 X IS increments)
Dial Gages (Deflections measured in inches)
2
2.5 incffis
0.01750
0.01743 0.21
O.OlS11 -1.S8
3
4.5 inches
0.00650
0.00164 14.95
0.00170 14.76
4
1.41 inches
0.02985
0.02845 4.31
0.02956 -0.S9
rote: plot along the center line is shown in Fig 35.
5
3.54 inches
0.01100
0.00841 7.96
0.00874 6.95
6
6.36 inches
-0.00250
-0.00963 - 21. 93
-0.01002 -23.13
67
deflections were higher by 22 to 23 percent in case of corner deflection of
the slab. The use of the nonlinear q-w curve in the analytical solution did
not provide significant improvements in the comparison of corner deflections
with experimental solution of the slab. In the real problem the adjoining
soil may be giving an additional restraint to the slab around the edges.
Moreover, the absence of shear connections in the discrete spring representa
tion of the foundation may result in unrealistically high computed
deflections.
Comparison of Experimental and Analytical Solutions for Principal Stresses
The largest principal stress for a given load on the slab was calculated
from the corresponding strains measured by the rosettes during the slab test,
as described in Appendix 3. Fig 37 shows the plot of load versus measured
principal stresses for the rosettes points Rl , R2
, R3 , and R4 on the slab.
The measured principal stresses thus obtained correspond to the top of
the slab, whereas the stresses obtained from the analytical solutions
(DSLAB 26 and 30) correspond to the bottom of the slab. Keeping this in mind,
a comparison of the measured and the DSLAB largest principal stress was made
for the loads of 100 and 200 pounds, and the percentage errors were calculated
as a function of the measured largest principal stress, as given below:
where
a - a Percentage error ~
m c
a~ x 100
a m measured largest principal stress,
DSLAB largest principal stress,
maximum measured principal stress for the load under consideration.
Tables 6 and 7 show the comparison of experimental and analytical
solutions for principal stresses in the slab for loads of 100 and 200
pounds, respectively.
From the comparison, it is observed that the computed stresses are in
good agreement with the measured stresses in the slab near the loaded area.
The maximum measured principal stress is within 3 percent of the computed
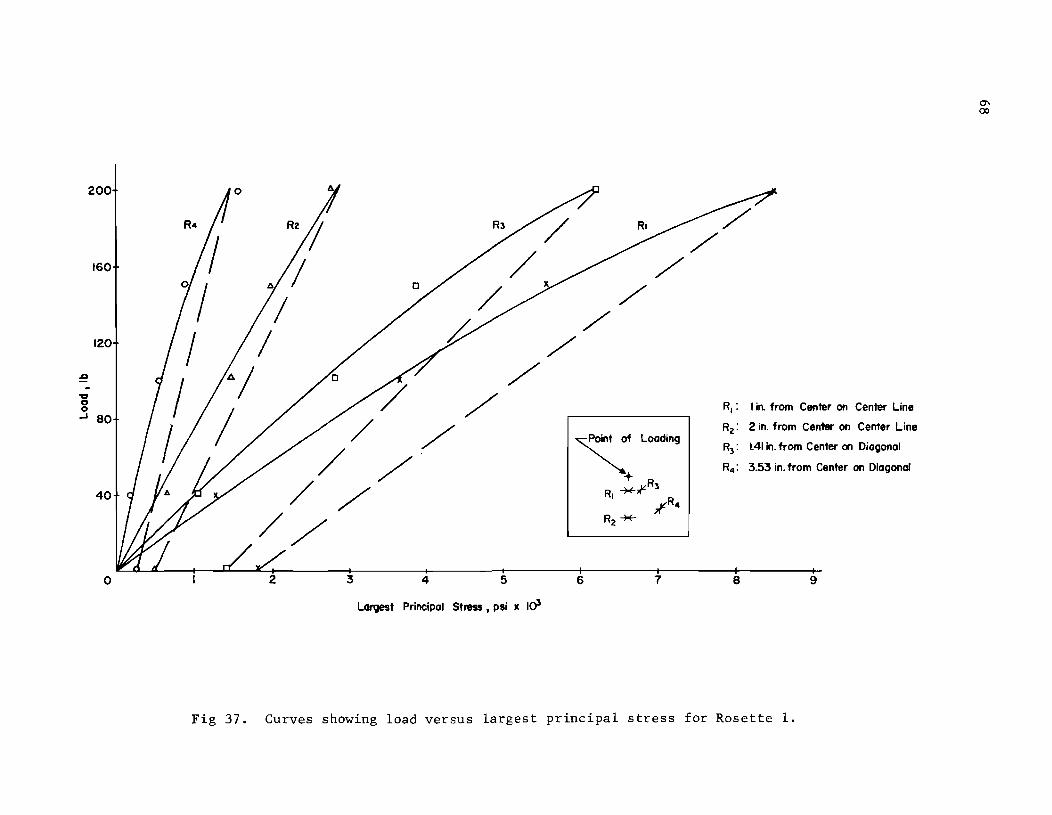
~ ItJ o
200
160
120
J 80
40
o 2 3
/ /
4 5
/' /
Largest Principal Stress, psi x 103
/" /"
6 7
R.: I in. from Center on Center Line
R2 : 2 in. from Cen1er on Center Line
R3: l41 in. from Center on Diagonal
R4 : 3.53 in. from Center on Diagonal
8 9
Fig 37. Curves showing load versus largest principal stress for Rosette 1.
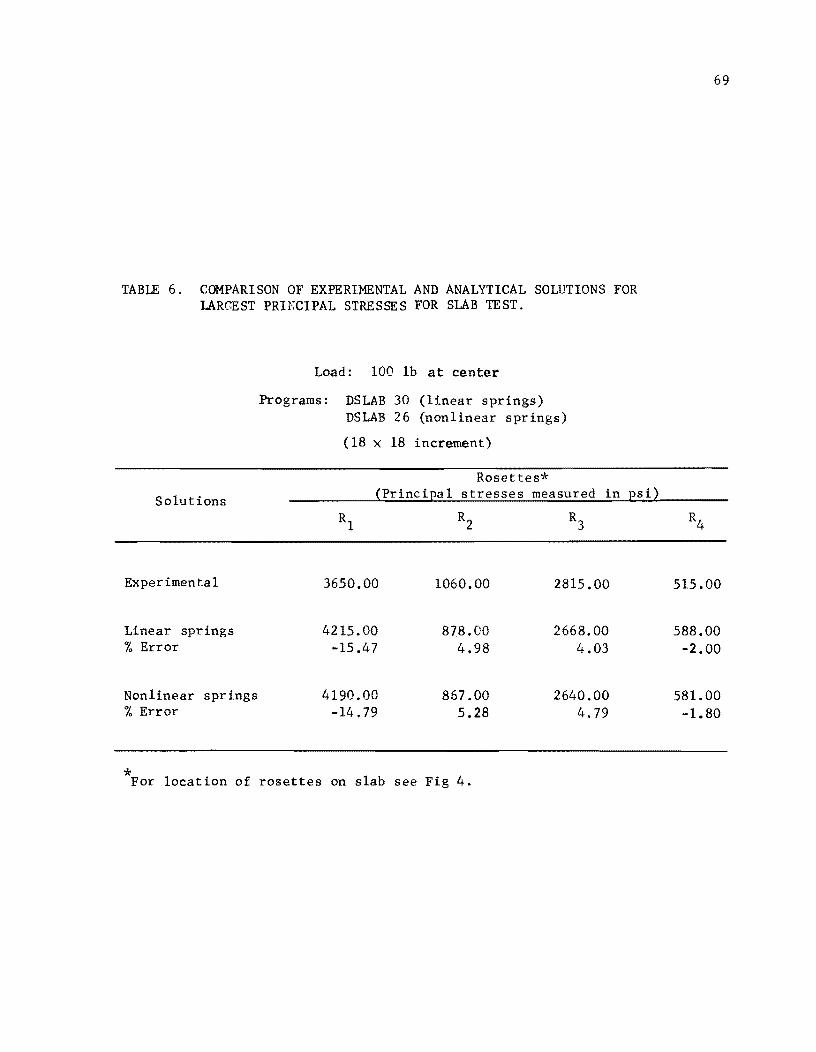
TABLE 6. COMPARISON OF EXPERIMENTAL AND ANALYTICAL SOLUTIONS FOR LARGEST PRINCIPAL STRESSES FOR SLAB TEST.
Solutions
Experimental
Linear springs % Error
Nonlinear springs % Error
*
Load: 100 lb at center
Programs: DSLAB 30 (linear springs) DSLAB 26 (nonlinear springs)
(18 X 18 increment)
Rosettes* (Principal stresses measured in psi)
3650.00 1060.00 2815.00
4215.00 878.00 2668.00 -15.47 4.98 4.03
4190.00 867.00 2640.00 -14.79 5.28 4.79
For location of rosettes on slab see Fig 4.
69
515.00
588.00 -2.00
581.00 -1.80
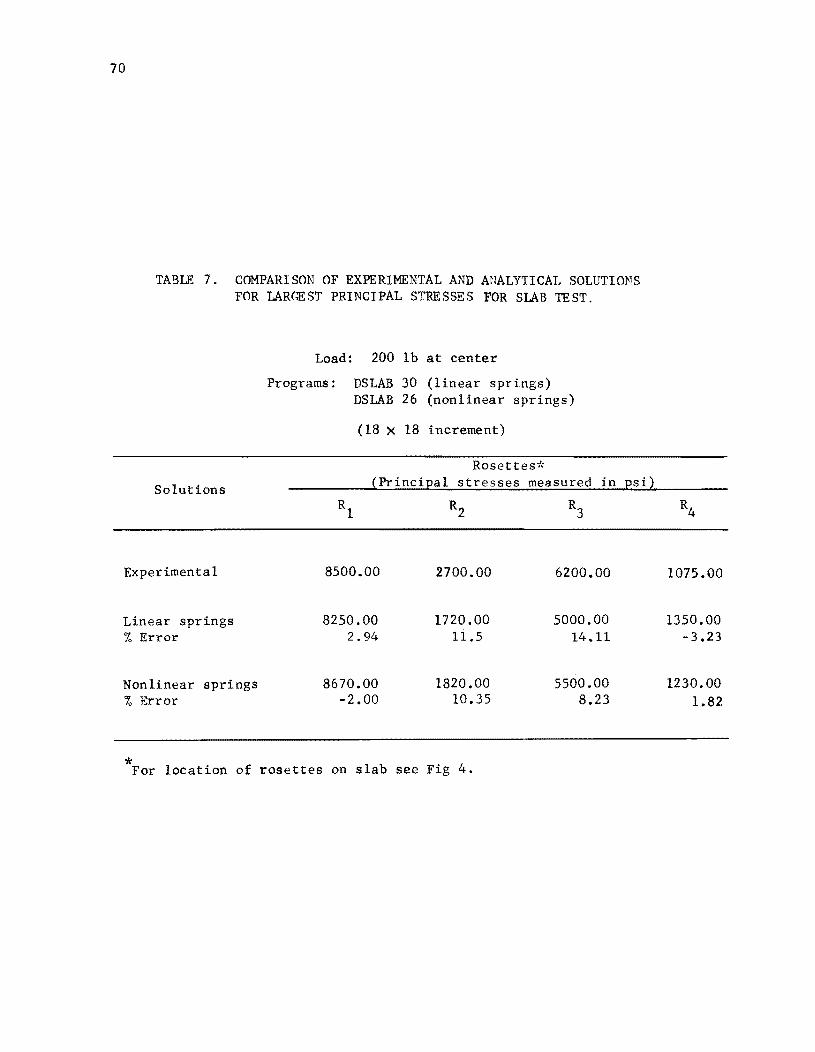
70
TABLE 7. COMPARISON OF EXPERIMENTAL AND ANALYTICAL SOLUTIONS FOR LARGEST PRINCIPAL STRESSES FOR SLAB TEST.
Solutions
Experimental
Linear springs % Error
Nonlinear springs % Error
Load: 200 lb at center
Programs: DSLAB 30 (linear springs) DSLAB 26 (nonlinear springs)
(18 X 18 increment)
Rosettes"': (Principal stresses measured in psi)
8500.00 2700.00 6200.00
8250.00 1720.00 5000.00 2.94 11.5 14.11
8670.00 1820.00 5500.00 -2.00 10.35 8.23
* For location of rosettes on slab see Fig 4.
1075.00
1350.00 -3.23
1230.00 1.82

71
stress. At the other points in the slab, the two solutions for principal
stresses differed considerably, particularly for the load of 200 pounds. The
maximum percentage error is noted at load of 100 pounds for the stresses in the
slab at 1.0 inch from its center where the computed stresses are 15 percent
higher than the measured ones. The use of nonlinear springs did not provide
results which were significantly better than those derived from the use of
linear springs.
Comparison of Load-Deflection Curves for the Slab Tests on Clay and on Layered System
The load-deflection data were compared with the load-deflection data for
the same slab tested on clay as reported by Agarwal and Hudson (Ref 1). The
comparison was made possible by conducting the two tests under similar loading
conditions and test set up, i.e., the measurement of deflections at the same
points and over the same range of loads.
For a case study, maximum measured deflection in the two tests were com
pared (Fig 38). These points were located at a distance of 1.0 inch from the
center of the slabs. It is noted that by providing a thin layer of asphaltic
material over clay, the maximum measured deflection at a load of 200 pounds de
creased from 0.0607 inch to 0.0325 inch (46 percent reduction).
Cyclic Load Test
In order to have a cursory look at the behavior of a slab on layered
foundation under cyclic loading, the static slab test described earlier was
continued for ten repetitions of load. The load was governed by the maximum
measured deflection (.0362 inch) recorded in the static load test (first cycle).
In each cycle, the slab loading was stopped at the governing deflection of
0.0362 inch.
Figure 39 shows the load-deflection curve for the point of maximum mea
sured deflection (dial gage 1 located at 1.0 inch from point of application
of load) for the first, fifth, and tenth cycles of loading and unloading.
It is observed that the curves for the fifth and tenth cycle follow
quite closely the slope of the curve for the first cycle. The effect of
cyclic loading of the slab to the maximum measured deflection of 0.0362 inch
is to reduce the load from 208 .pounds for the first cycle to 189 pounds and
182 pounds for the fifth and tenth cycles, respectively. Presumably, by the
tenth cycle the load has begun to stabilize.

200
160
120
:e
~80
40
0
/ /
/ / / / /
/ / / / /
/ 02 .03 04 05
Deflection • inch
Fig 38. Comparison of load versus deflection curves for Gage 1 for slab test on clay and on layered system.
...... N
/ /
/
.06 07
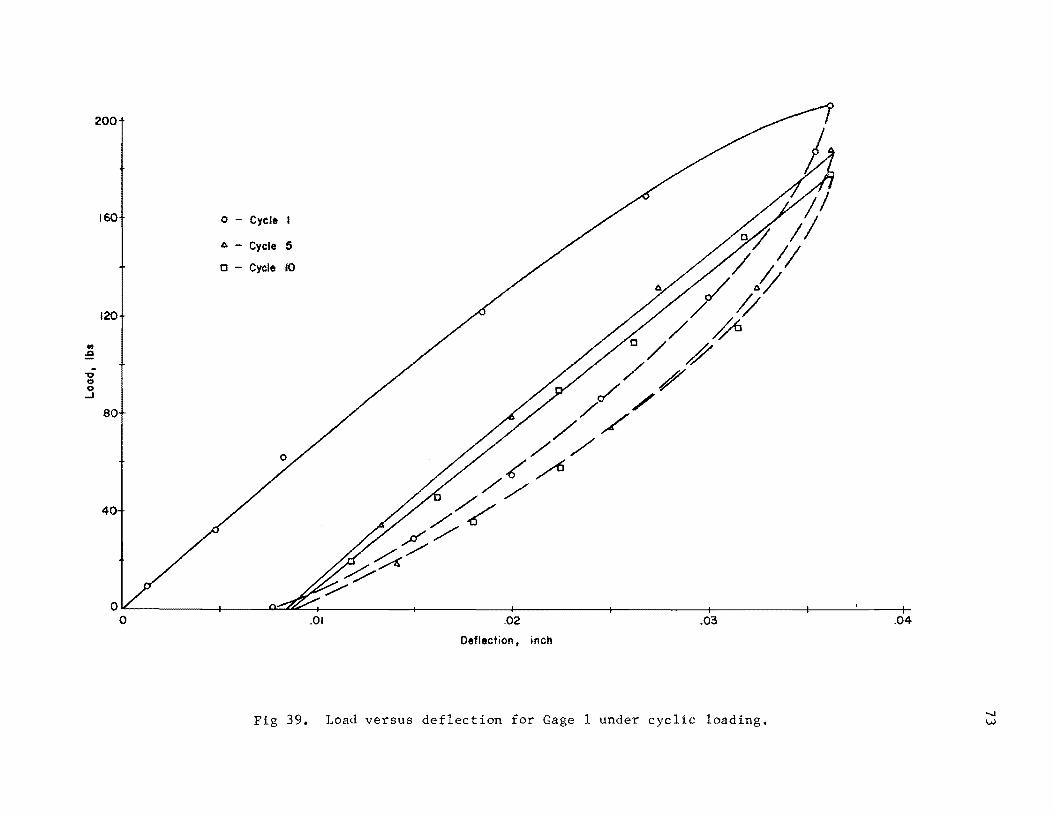
200
160 o - Cycle I
A - Cycle 5
o - Cycle 10
120
.., :!
"0 c::I c::I ...J
80
40
o~-------+----~~~ ________ ~ ________ ~ ______ ~ ________ -+ ________ ~ __ ~~ __ + o .01 .02 .03 .04
Deflection. inch
Fig 39. Load versus deflection for Gage 1 under cyclic loading.

74
In general, deflections after cycling appeared to be greater than those
for the first cycle, except for the observation point one inch from the point
of load application. This exception was the point of maximum measured deflec
tion which was kept at a constant deflection.
CHAPTER 7. CONCLUSIONS, RECOMMENDATIONS, AND APPLICATIONS
Load-deflection data of the plate load tests described in this study were
used in the evaluation of a practical and a representative value of the modu
lus of subgrade reaction k This value of k was utilized in the solution
of a two-dimensional slab-on-foundation model using the discrete-element
method (Refs 27 and 36). The analytical solutions were compared with the
experimental results of the slab test conducted in this study using the same
method of comparison as Agarwal and Hudson (Ref 1). The following conclusions
are drawn:
(1) The relationship between pressure and deflection is linear for a
small initial deflection of the plate and nonlinear for higher de
flections of the plate; the latter differs from the assumption of
the theory of linear elasticity.
(2) The value of soil modulus k varies inversely with the size of the
plate used in the load tests and with the magnitude of the soil
deformation.
(3) Putting a thin layer of asphalt concrete on the clay subgrade im
proved the k-va1ue of the system by 40 percent, and thus for the
same load the slab deformed less on the layered foundation than on
clay alone.
(4) The initial tangent modulus value of k obtained from the pressure
deflection data of the 9-inch plate test provided a good analytical
solution of slab-on-1ayered-foundation for comparison with the
experimental solution of the slab test.
(5) Computed deflections and stresses in the slab were within 5 percent
of the measured values in the interior of the slab near the point of
loading. The major discrepancy in the comparison was found in
deflections at the corners of the slab. Computed deflections were
20 to 23 percent higher than the measured deflections at the corners
of the slab, showing that a constant value of k is probably not
75
76
fully representative of the actual conditions of subgrade existing at
any point beneath the slab.
(6) On the slab, the cycling of the load to 10 cycles to a constant de
flection produced some permanent deformation, and by the tenth
cycle, the load appeared to be stabilizing. Moreover, it may be
observed that the curves for the fifth and tenth cycles followed
the slope of the curve quite closely for the first cycle of loading.
The same pattern was noticed for measured strains in slabs.
(7) The value of E1 ' the modulus of elasticity of the asphaltic
material in the layered system determined from the split tensile
test, predicted the load-deflection curve for a two-layered system.
It was based on Burmister's theory which compared reasonably well
with the load-deflection data from the plate load tests for small
deflections.
(8) Temperature significantly affected the modulus of elasticity of
asphalt concrete which in turn affected the composite k-va1ue of
the two-layered system investigated in this study. For a change
in temperature from 400
F to 1000
F, the modulus of elasticity of
asphalt concrete reduced from 76,500 psi to 9,950 psi (87 percent
reduction) while the k-va1ue (initial tangent modulus) was de
creased from 550 1b/cu in to 310 1b/cu in (44 percent decrease).
Recommendations
The following recommendations are suggested for further research into the
study described in this report:
(1) In the determination of a k-va1ue for a soil from the plate load
tests, the size of the plate should be carefully selected, since
the value of k is influenced by the size of the plate used; and
it is also advisable to limit the deformation of the plate to a
magnitude within the range of pavement deflection.
(2) Plate load tests should also be investigated under cyclic loading to
take into account the repetitions of loads on pavement due to moving
vehicles. This may simulate the actual loading conditions of
pavement.
77
(3) Further studies on the deformation of the layered subbases are
needed to correlate El , the modulus of elasticity of the subbase
material and E2 ' the modulus of elasticity of subgrade material
with the value of k for the layered system. This will be a signi
ficant step in the evaluation of k from inexpensive laboratory
tests on the material in the layered system.
(4) For loads up to 200 pounds applied at the center of the slab, the
use of linear or nonlinear values of k provides a satisfactory
analytical solution in the interior of the slab for comparison with
the experimental solution, but for larger loads, the use of non
linear q-w curve for the soil may yield a satisfactory solution.
(5) The effect of cyclic loading on a slab should be more fully investi
gated in order to study the behavior of pavement slabs under repe
titive loading.
Applications
The research reported herein is an experimental look at parameters affect
ing the subgrade support of pavement slabs on stabilized subbase layers on
clay subgrades. The results of the study are not applicable immediately to
highway practice, but will be very useful data in correlating work from Re
search Project No. 3-8-66-98, entitled "Evaluation of Tensile Properties of
Subbases for Use in New Rigid Pavement Design" for use with slab analysis pro
grams developed in Research Project No. 3-5-63-56, entitled "Development of
Methods for Computer Simulation of Beam-Columns and Grid-Beam and Slab Systems."
The findings of the study are also quite useful in verifying the discrete
element analysis of slab-on-foundation problems and will ultimately lead to im
proved pavement design methods for the Texas Highway Department.

!!!!!!!!!!!!!!!!!!!"#$%!&'()!*)&+',)%!'-!$-.)-.$/-'++0!1+'-2!&'()!$-!.#)!/*$($-'+3!
44!5"6!7$1*'*0!8$($.$9'.$/-!")':!

REFERENCES
1. Agarwal, Sohan L., and W. Ronald Hudson, "Experimental Verification of Discrete-Element Solutions for Two-Dimensional Soil-Structure Problems," Research Report No. 56-15, Center for Highway Research, The University of Texas at Austin, April 1970.
2. Barber, E. S., "Application of Triaxial Compression Test Results to the Calculation of Flexible Pavement Thickness," Proceedings, Vol 26, Highway Research Board, 1946.
3. Benscoter, S. U., "A Symmetrically Loaded Base Slab on an Elastic Foundation," Proceedings, Vol 109, American Society of Civil Engineers, 1944.
4. Bergstrom, S. G., "Circular Plates with Concentrated Load on an Elastic Foundation," Bulletin No.6, Swedish Cement and Concrete Research Institute, Stockholm, 1946.
5. Biot, M. A., "Bending of an Infinite Beam on an Elastic Foundation," Journal of Applied Mechanics, Vol 4, 1937.
6. Boussinesq, J., Application des Potentiels, Paris, 1885.
7.
8.
Burmister, D. M., "The Theory Systems and Applications Vol 23, Highway Research
Burmister, D. M., "Stress and Rigid Base Soil System: tions," Proceedings, Vol
of Stresses and Displacements in Layered to Design of Airport Runways," Proceedings, Board, 1943.
Displacement Characteristics of a Two-Layered Influence Diagrams and Practical Applica-36, Highway Research Board, 1956.
9. Campen, W. H., and J. R. Smith, "An Analysis of Field Load Bearing Tests Using Plates," Proceedings, Vol 24, Highway Research Board, 1944.
10. Coffman, B. S., D. C. Kraft, and J. Tamayo, "A Comparison of Calculated and Measured Deflections for the AASHO Road Test," Proceedings of the Association of Asphalt Paving Technologists, Vol 33, 1964.
11. De Beer, E. E., "Computation of Beams Resting on Soil," Proceedings, Second International Conference on Soil Mechanics and Foundation Engineering, Rotterdam, 1948.
12. Fox, L., "Computation of Traffic Stresses in Simple Road Structures," Proceedings, Vol 2, Second International Conference on Soil Mechanics and Foundation Engineering, 1948.
79
80
13. Habel, A., "Naherungsberechnung des auf dem elastisch-isotropen Halbraum aufliegenden elastischen Balkens," (An Approximate Calculation of Elastic Beams in an Elastic Isotropic Hemisphere), Der Bauingenieur 19, 1938.
14. Hadley, William 0., W. Ronald Hudson, and Thomas W. Kennedy, "An Evaluation of Factors Affecting the Tensile Properties of Asphalt-Treated Materials," Research Report 98-2, Center for Highway Research, The University of Texas at Austin, March 1969.
15. Hank, R. J., and F. H. Scrivner, "Some Numerical Solutions of Stresses in Two and Three-Layered Systems," Proceedings, Vol 28, Highway Research Board, 1948.
16. Hertz, H., "Uber das Gleichgewicht Schwimmender Elasticher Platten," Weidemannls Annalen der Physik und Chemie, Vol 22, 1884.
17. Heteyni, M., "Beams on Elastic Foundations, II University of Michigan Press, Ann Arbor, 1946.
18. Heukelom, W., and A. J. G. Klomp, "Road Design and Dynamic Loading," Proceedings of the Association of Asphalt Paving Technologists, Vol 33,1964.
19. Hogg, A. H. A., "Equilibrium of a Thin Plate, Symmetrically Loaded, Resting on an Elastic Foundation of Infinite Depth," Philosophical Magazine, Series 7, Vol 25, 1938.
20. Holl, D. L., "Thin Plates on Elastic Foundation, II Proceedings, Vol 1, Fifth International Conference on Soil Mechanics and Foundation Engineering, 1961.
21. Hondros, G., I~he Evaluation of Poissonls Ratio and the Modulus of Materials of a Low Tensile Resistance by the Brazilian (Indirect Tensile) Test with Particular Reference to Concrete," Australian Journal of Applied Science, Vol 10, No.3.
22. Housel, W. S., "A Practical Method for the Selection of Foundations Based on Fundamental Research in Soil Mechanics," Engineering Research Bulletin No. 13, Department of Engineering Research, University of Michigan, Ann Arbor, October 1929.
23. Hubbard, P., and F. R. Field, Research Series No.8, The Asphalt Institute.
24. Hudson, W. Ronald, and Thomas W. Kennedy, "An Indirect Tensile Test for Stabilized Materials," Research Report No. 98-1, Center for Highway Research, The University of Texas at Austin, 1968.
25. Hudson, W. Ronald, and Hudson Matlock, "Discontinuous Orthotropic Plates and Pavement Slabs," Research Report No. 56-6, Center for Highway Research, The University of Texas, Austin, 1965.
26. Jones, A., "Calculation of Stresses, Strains, and Displacements in Layered Systems Having Constant and Variable Elastic Parameters,"
81
a paper submitted to Second International Conference on the Structural Design of Asphalt Pavements, University of Michigan, Ann Arbor, 1967.
27. Kelly, Allan E., "Dynamic Analysis of Discrete- Element Plates on Nonlinear Foundation," (DSLAB 26), Ph.D. Dissertation, The University of Texas at Austin, January 1970.
28. Kennedy, Thomas W., and W. Ronald Hudson, "Application of the Indirect Tensile Test to Stabilized Materials," Highway Research Record, No. 235, Highway Research Board, January 1968.
29. Ku, A. B., "Stress-Strain Law for Visco-Elastic Flexible Pavement Under Temperature Variations," Proceedings, Second International Conference on the Structural Design of Asphalt Pavements, University of Michigan, Ann Arbor, 1967.
30. Lee, C. E., '~he Determination of Pavement Deflections Under Repeated Load Applications," Ph.D. Dissertation, University of California, Berkeley, 1961.
31. McLeod, N. W., "A Canadian Investigation of Load Testing Applied to Pavement Design," Symposium on Load Tests of Bearing Capacity of Soils, Special Technical Publication No. 79, American Society for Testing Materials, 1947.
32. Metcalf, C. T., '~ield Measurements of Dynamic Elastic Moduli of Materials in Flexible Pavement Structures," Proceedings, Second International Conference on the Structural Design of Asphalt Pavements, University of Michigan, Ann Arbor, 1967.
33. Middlebrook, T. A., and G. E. Bertram, '~ield Investigation for Flexible Pavement Design," Proceedings, Vol 21, Highway Research Board, 1941.
34. Monismith, C. L., G. A. Secor, and K. E. Secor, "Temperature Induced Stresses and Deformations in Asphalt Concrete," Proceedings of the Association of Asphalt Paving Technologists, Vol 34, 1965.
35. Murphy, G., "Stresses and Deflections in Loaded Rectangular Plates on Elastic Foundations," Iowa Engineering Experiment Station Bulletin, No. 135, 1937.
36. Panak, John J., and Hudson Matlock, "A Discrete-Element Method for Multiple-Loading Analysis for Two-Way Bridge Floor Slabs," Research Report No. 56-13, Center for Highway Research, The University of Texas at Austin, August 1968.
37. Hadley, William 0., W. Ronald Hudson, and Thomas W. Kennedy, "A Method of Estimating Tensile Properties of Materials Tested in Indirect Tension," Research Report 98-7, Center for Highway Research, The University of Texas at Austin, July 1970.
82
38. Secor, K. E., and C. L. Monismith, "Analysis and Interrelation of Stress-Strain-Time Data for Asphalt Concrete," Transactions, Vol 8, Society of Rhelology, 1964.
39. Seed, H. B., F. G. Mitry, C. L. Monismith, and C. K. Chan, "Prediction of Pavement Deflections from Laboratory Repeated Load Tests," Report Number TE 65-6, University of California, Berkeley, 1965.
40. Skempton, A. W., "The Bearing Capacity of Clays," Building Research Congress, London, 1951.
41. "Standard Specifications for Road and Bridge Construction," Texas Highway Department, 1962.
42. Stelzer, C. Fred, Jr., and W. Ronald Hudson, "A Direct Computer Solution for Plates and Pavement Slabs, ,. Research Report No. 56- 9, Center for Highway Research, The University of Texas, Austin, October 1967.
43. Teller, L. W., and E. C. Sutherland, "The Structural Design of Concrete Pavements. V. An Experimental Study of the Westergaard Analysis of Stress Conditions in Concrete Pavement Slabs of Uniform Thickness," Public Roads, Vol 23, 1942.
44. Terzaghi, K., "Evaluation of Coefficients of Sub grade Reaction," Geotechnique, Vol 5, 1955.
45. Timoshenko, S., Theory of Elasticity, McGraw-Hill, New York, 1934.
46. Timoshenko, S., and J. N. Goodier, Theory of Elasticity, 2nd Edition, McGraw-Hill, New York, 1951.
47. Ueshita, K., and G. G. Meyerhof, "Deflection of Multilayer Soil Systems," Journal of the Soil Mechanics and Foundations Division, Vol 93, No. SM5, Proceedings of the American Society of Civil Engineers, September 1967.
48. Van der Poel, C., "Road Asphalts in Building Materials, Their Elasticity and Inelasticity," edited by M. Reiner, Interscience Publishers, New York, 1954.
49. Vesic, A. B., "Beams on Elastic Subgrade and the Winkler's Hypothesis," Proceedings, Vol 1, Fifth International Conference on Soil Mechanics and Foundation Engineering, 1961.
50. Westergaard, H. M., "Stresses in Concrete Pavements Computed by Theoretical Analysis," Public Roads, Vol 7, No.2, 1926.
51. Winkler, E., "Die Lehre von Elasticitaet und Festigkeit" (On Elasticity and Fixity), Prague, 1867.
52. Zinunermann, H., "Die Berechnung des Eisenbahn Oberbaues" (The Calculation of Railway Superstructures), Berlin, 1888.

APPENDICES

!!!!!!!!!!!!!!!!!!!"#$%!&'()!*)&+',)%!'-!$-.)-.$/-'++0!1+'-2!&'()!$-!.#)!/*$($-'+3!
44!5"6!7$1*'*0!8$($.$9'.$/-!")':!
APPENDIX 1
PROPERTIES OF MATERIALS USED IN THE EXPERIMENTS

!!!!!!!!!!!!!!!!!!!"#$%!&'()!*)&+',)%!'-!$-.)-.$/-'++0!1+'-2!&'()!$-!.#)!/*$($-'+3!
44!5"6!7$1*'*0!8$($.$9'.$/-!")':!

TABLE Al.l PROPERTIES OF CLAY
Type: Taylor marl I
Liquid Limit (L.L.) = 53.8
Plastic Limit (P.L.) = 24.5
Plasticity Index (P.I.) = 29.3
Optimum Moisture Content = 17.5%
Maximum Dry Density = 106.5 lb/cu ft
In situ Properties of Clay in the Test Box:
Type:
Average Density = 116 lb/cu ft
Average Moisture Content = 38%
Average Degree of Saturation = 96%
Average Shear Strength = 180 lb/sq ft
TABLE Al.2 PROPERTIES OF ASPHALT
AC-lO
Optimum Asphalt
Water, %
Content 9% by weight of the aggregate
Nil
Viscosity at 2750 F, Stokes
Viscosity at 1400 F, Stokes
Solubility in CCL4 , %
Flash Point C.O.C., of
Ductility, 770 F, 5 cm/min, cm.
Viscosities Determined at 770 F, Centistokes
o Penetration at 77 F, 100 g, 5 sec
Specific Gravity at 770 F
2.6
1088
99.7+
570
141+
4.0
92
1.006
87
88
TABLE Al.3 GRADATION USED IN THE EXPERIMENT
Texas Highway Department Sieve Size Specification* Gradation used
Percent by weight Percent by weight
Passing No. 4 Retained on No. 10 o - 5 0
Passing No. 10 Retained on No. 40 15 - 40 30
Passing No. 40 Retained on No. 80 20 - 45 35
Passing No. 80 Retained on No. 200 12 - 32 25
Passing No. 200 7 - 20 10
100
*Reference 41
MIX DESIGN AND SAMPLE PREPARATION PROCEDURE FOR ASPHALT CONCRETE
Aggregate: Crushed Limestone
Asphalt: AC-lO
Design: Asphalt Contents: 7%, 8%, 9%, and 10% Gradation: same as given in Table Al.3
Specimen size: 4" diameter X 2" height
Sample Preparation:
89
(1) Mixed at 2750 F ± 50 F for 3 minutes in an automatic l2-quart capacity Hobart food mixer at 107 rpm.
(2) Cured at 1400 F ± 50 F for 18 to 24 hours.
(3) Compacted at 2500 F ± 50 F.
Compaction:
Gyratory shear compaction performed according to Texas Highway Department Standard 206-F, Part II.
Testing Procedure:
(1) Preheat at 1800 F for 18 to 24 hours.
(2) Cool at 750 F for 18 to 24 hours.
(3) Hold at testing temperature for 18 to 24 hours prior to testing.
The basic testing equipment consists of an adjustable loading frame, a
closed loop electrohydraulic loading system, and a loading gear which is a
modified, commercially-available shoe-die with upper and lower platens con
strained to remain parallel during tests.
Another piece of equipment, a device for measuring the transverse
strain in a specimen, was used to obtain a measure of specimen deformation
in the direction of the tensile stresses causing failure. This measuring
device consisted of two cantilever arms with attached strain gages.
Vertical deformations were measured by a DC linear variable differen
tial transformer which also was used to control the rate of load application

90
providing an electrical signal related to the relative movements of the
upper and lower platens. All measurements were recorded on two x-y
plotters.
The maximum load needed for the tensile strength calculation was obtained
from the load versus vertical deformation plot. The maximum horizontal de
formation value was taken from the load versus horizontal deformation plot and
is the deformation recorded at maximum load. These values of horizontal and
vertical deformations and loads were input into a computer program developed
at The University of Texas (Ref 37) for the calculation of modulus of elas
ticity and tensile strength of specimens.

APPENDIX 2
DATA OF PLATE LOAD TESTS

!!!!!!!!!!!!!!!!!!!"#$%!&'()!*)&+',)%!'-!$-.)-.$/-'++0!1+'-2!&'()!$-!.#)!/*$($-'+3!
44!5"6!7$1*'*0!8$($.$9'.$/-!")':!

TABLE A2.1. PRESSURE VERSUS DEFLECTION DATA OF 9-INCH PLATE LOAD TESTS ON CLAY
Series A Series B Series C
Pressure (p) Deflection (w) Pressure (p) Deflection (w) Pressure (p) Deflection (w) psi inch psi inch psi inch
0 0 0 0 0 0
0.33 .0014 0.08 .0002 0.49 .0018
1.00 .0060 0.36 .0012 0.84 .0040
2.00 .0130 0.52 .0030 1.94 .0110
2.46 .0160 1.21 .0068 2.75 .0153
3.00 .0210 1. 97 .0125 3.00 .0230
3.80 .0290 2.65 .0068 3.87 .0331
4.28 .0360 3.71 .0320 4.45 .0534
4.65 .0425 4.82 .0640 5.00 .0710
5.00 .0495 5.50 .0930 5.40 .0890
5.64 .0635 5.90 .1225 5.80 .1040
6.20 .0840 6.05 .1370 6.20 .1306
6.52 .1000 6.35 .1480 6.35 .1400
6.84 .1200 6.48 .1590 6.55 .1360
7.05 .1406 6.82 .1740 6.75 .1481
7.24 .1603 7.10 .1880 7.05 .1695
7.31 .1809 7.30 .2030 7.20 .1950
7.40 .2012 7.40 .2160 7.40 .2240
7.46 .2310 \.0 w
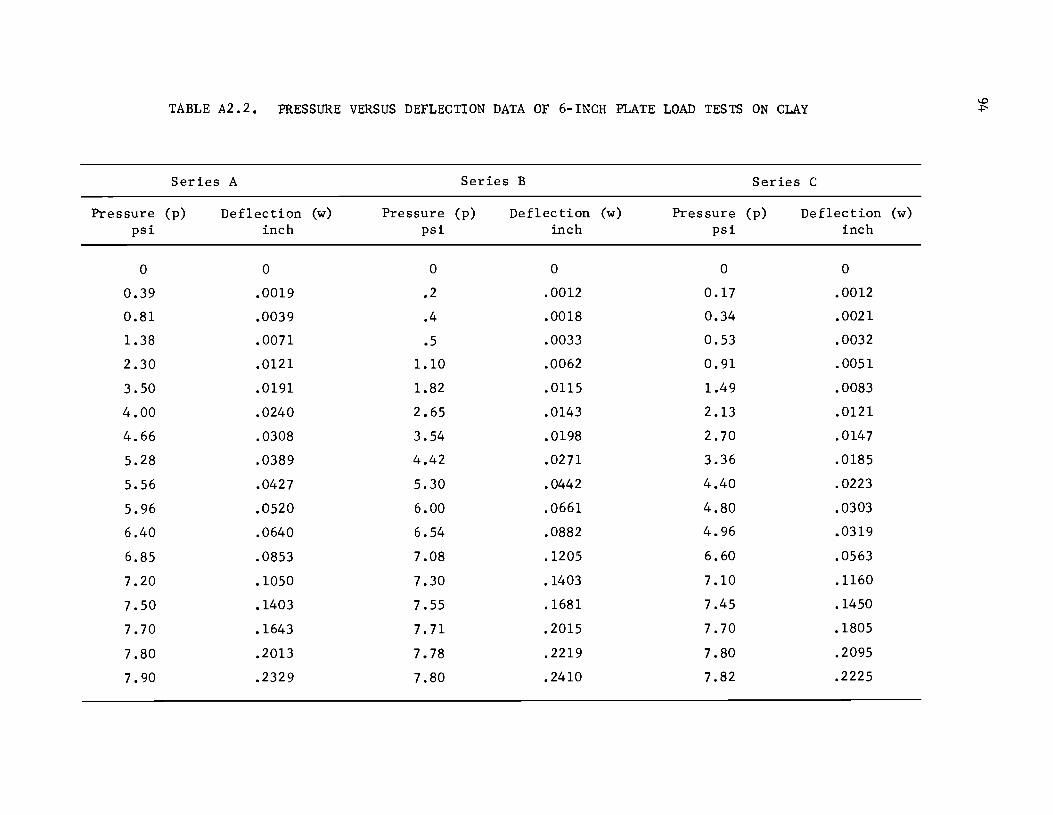
TABLE A2.2. PRESSURE VERSUS DEFLECTION DATA OF 6-INCH PLATE LOAD TESTS ON CLAY
Series A Series B Series C
Pressure (p) Deflection (w) Pressure (p) Deflec tion (w) Pressure (p) Deflection (w) psi inch psi inch psi inch
0 0 0 0 0 0
0.39 .0019 .2 .0012 0.17 .0012
0.81 .0039 .4 .0018 0.34 .0021
1.38 .0071 .5 .0033 0.53 .0032
2.30 .0121 1.10 .0062 0.91 .0051
3.50 .0191 1.82 .0115 1.49 .0083
4.00 .0240 2.65 .0143 2.13 .0121
4.66 .0308 3.54 .0198 2.70 .0147
5.28 .0389 4.42 .0271 3.36 .0185
5.56 .0427 5.30 .0442 4.40 .0223
5.96 .0520 6.00 .0661 4.80 .0303
6.40 .0640 6.54 .0882 4.96 .0319
6.85 .0853 7.08 .1205 6.60 .0563
7.20 .1050 7.30 .1403 7.10 .1160
7.50 .1403 7.55 .1681 7.45 .1450
7.70 .1643 7.71 .2015 7.70 .1805
7.80 .2013 7.78 .2219 7.80 .2095
7.90 .2329 7.80 .2410 7.82 .2225
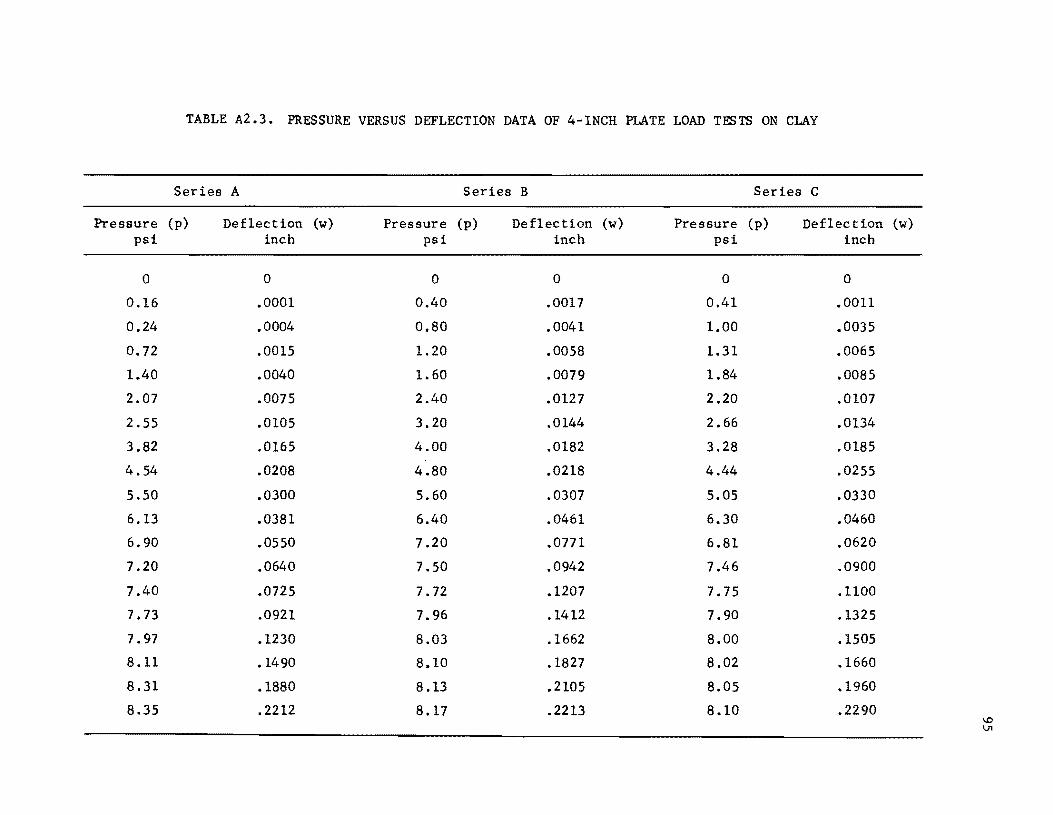
TABLE A2.3. PRESSURE VERSUS DEFLECTION DATA OF 4-INCH PLATE LOAD TESTS ON CLAY
Series A Series B Series C
Pressure (p) Deflection (w) Pressure (p) Deflection (w) Pressure (p) Deflection (w) psi inch psi inch psi inch
0 0 0 0 0 0
0.16 .0001 0.40 .0017 0.41 .001l
0.24 .0004 0.80 .0041 1.00 .0035
0.72 .0015 1.20 .0058 1.31 .0065
1.40 .0040 1.60 .0079 1.84 .0085
2.07 .0075 2.40 .0127 2.20 .0107
2.55 .0105 3.20 .0144 2.66 .0134
3.82 .0165 4.00 .0182 3.28 .0185
4.54 .0208 4.80 .0218 4.44 .0255
5.50 .0300 5.60 .0307 5.05 .0330
6.13 .0381 6.40 .0461 6.30 .0460
6.90 .0550 7.20 .0771 6.81 .0620
7.20 .0640 7.50 .0942 7.46 .0900
7.40 .0725 7.72 .1207 7.75 .1100
7.73 .0921 7.96 .1412 7.90 .1325
7.97 .1230 8.03 .1662 8.00 .1505
8.ll .1490 8.10 .1827 8.02 .1660
8.31 .1880 8.13 .2105 8.05 .1960
8.35 .2212 8.17 .2213 8.10 .2290 \0 \J1

TABLE A2.4. PRESSURE VERSUS DEFLECTION DATA OF 2-INCH PLATE LOAD TESTS ON CLAY
Series A Series B Series C
Pressure (p) Deflection (w) Pressure (p) Deflection (w) Pressure (p) Deflect ion (w)
psi inch psi inch psi inch
0 0 0 0 0 0
0.32 .0010 0.83 .0017 0.40 .0155
1.27 .0031 1.64 .0057 0.75 .0212
1. 91 .0051 2.45 .0091 1.30 .0350
2.55 .0078 3.30 .0121 1.50 .0554
3.00 .0100 4.90 .0180 2.01 .0761
3.66 .0121 5.74 .0213 2.81 .0102
4.30 .0139 6.05 .0231 3.31 .0121
5.10 .0163 6.30 .0262 4.15 .0153
5.57 .0184 6.75 .0332 5.10 .0186
6.05 .0220 7.20 .0481 6.10 .0245
7.00 .0375 7.66 .0665 6.95 .0407
7.65 .0573 7.80 .0805 7.52 .0610
7.96 .0718 8.00 .0952 7.80 .0801
8.27 .0959 8.23 .1207 8.00 .1019
8.43 .1203 8.41 .1610 8.19 .1314
8.55 .1412 8.50 .1813 8.30 .1601
8.70 .1822 8.55 .2102 8.36 .1911
8.80 .2310 8.61 .2307 8.41 .2307
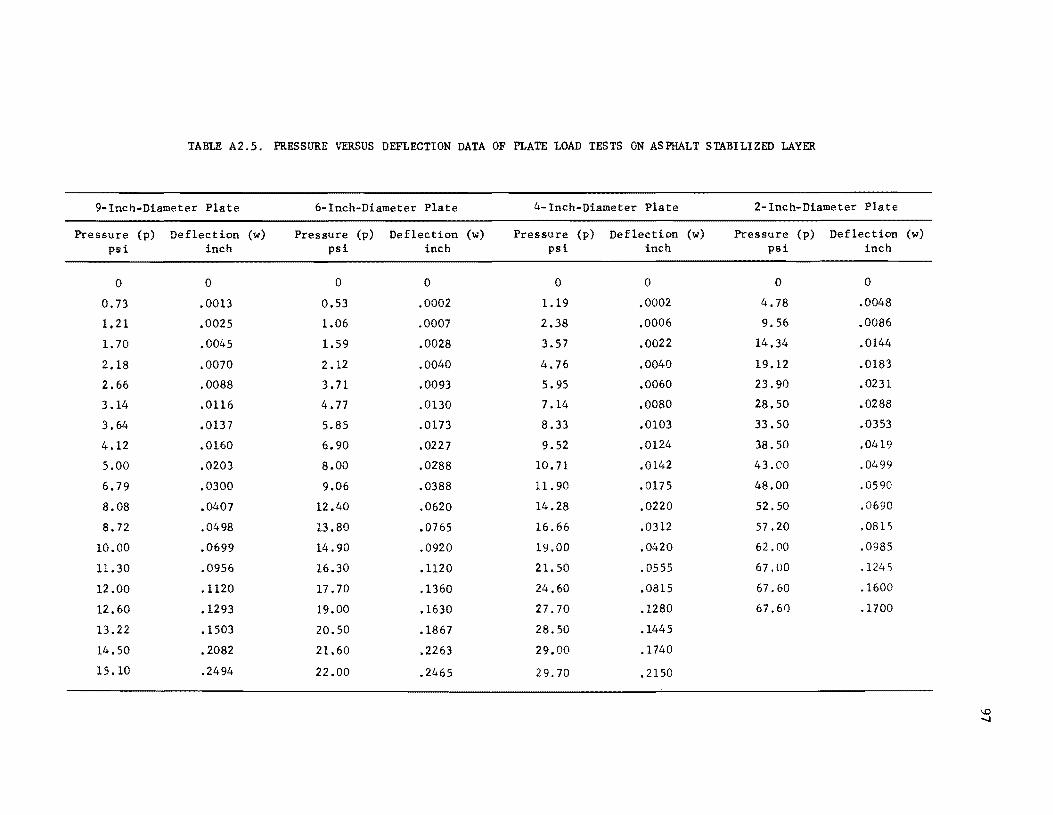
TABLE A2.5. PRESSURE VERSUS DEFLECTION DATA OF PLATE LOAD TESTS ON ASPHALT STABILIZED LAYER
9-lnch-Diameter Plate 6-Inch-Diameter Plate 4-Inch-Diameter Plate 2-Inch-Diameter Plate
Pressure (p) Deflection (w) Pressure (p) Deflection (w) Pressure (p) Deflection (w) Pressure (p) Deflection (w) psi inch psi inch psi inch psi inch
0 0 0 0 0 0 0 0
0.73 .0013 0.53 .0002 1.19 .0002 4.78 .0048
1.21 .0025 1.06 .0007 2.38 .0006 9.56 .0086
1. 70 .0045 1.59 .0028 3.57 .0022 14.34 .0144
2.18 .0070 2.12 .0040 4.76 .0040 19.12 .0183
2.66 .0088 3.71 .0093 5.95 .0060 23.90 .0231
3.14 .Oll6 4.77 .0130 7.14 .0080 28.50 .0288
3.64 .0137 5.85 .0173 8.33 .0103 33.50 .0353
4.12 .0160 6.90 .0227 9.52 .0124 38.50 .0419
5.00 .0203 8.00 .0288 10.71 .0142 43.00 .0499
6.79 .0300 9.06 .0388 11.90 .0175 48.00 .0590
8.08 .0407 12.40 .0620 14.28 .0220 52.50 .0690
8.72 .0498 13.80 .0765 16.66 .0312 57.20 .0815
10.00 .0699 14.90 .0920 19.00 .0420 62.00 .0985
11.30 .0956 16.30 .1120 21.50 .0555 67.00 .1245
12.00 .ll20 17.70 .1360 24.60 .0815 67.60 .1600
12.60 .1293 19.00 .1630 27.70 .1280 67.60 .1700
13.22 .1503 20.50 .1867 28.50 .1445
14.50 .2082 21.60 .2263 29.00 .1740
15.10 .2494 22.00 .2465 29.70 .2150
...0 ......

This page replaces an intentionally blank page in the original --- CTR Library Digitization Team

APPENDIX 3
DATA OF SLAB TEST

!!!!!!!!!!!!!!!!!!!"#$%!&'()!*)&+',)%!'-!$-.)-.$/-'++0!1+'-2!&'()!$-!.#)!/*$($-'+3!
44!5"6!7$1*'*0!8$($.$9'.$/-!")':!
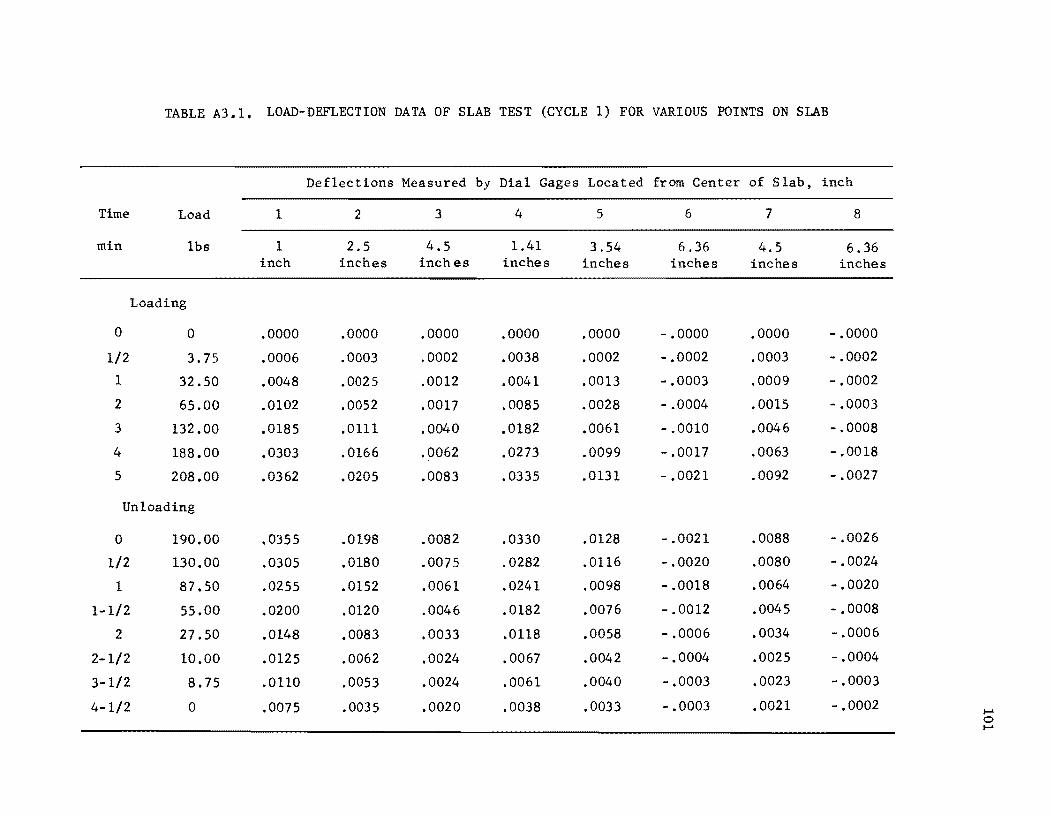
TABLE A3.1. LOAD-DEFLECTION DATA OF SLAB TEST (CYCLE 1) FOR VARIOUS POINTS ON SLAB
Deflections Measured by Dial Gages Located from Center of Slab, inch
Time Load 1 2 3 4 5 6 7 8
min Ibs 1 2.5 4.5 1.41 3.54 6.36 4.5 6.36 inch inches inches inches inches inches inches inches
Loading
0 0 .0000 .0000 .0000 .0000 .0000 -.0000 .0000 -.0000
1/2 3.75 .0006 .0003 .0002 .0038 .0002 -.0002 .0003 -.0002
1 32.50 .0048 .0025 .0012 .0041 .0013 -.0003 .0009 -.0002
2 65.00 .0102 .0052 .0017 .0085 .0028 -.0004 .0015 -.0003
3 132.00 .0185 .0111 .0040 .0182 .0061 -.0010 .0046 -.0008
4 188.00 .0303 .0166 .0062 .0273 .0099 - .0017 .0063 - .0018
5 208.00 .0362 .0205 .0083 .0335 .0131 -.0021 .0092 -.0027
Unloading
0 190.00 .0355 .0198 .0082 .0330 .0128 -.0021 .0088 -.0026
1/2 130.00 .0305 .0180 .0075 .0282 .0116 -.0020 .0080 -.0024
1 87.50 .0255 .0152 .006l .0241 .0098 -.0018 .0064 -.0020
1-1/2 55.00 .0200 .0120 .0046 .0182 .0076 -.0012 .0045 -.0008
2 27.50 .0148 .0083 .0033 .0118 .0058 -.0006 .0034 -.0006
2-1/2 10.00 .0125 .0062 .0024 .0067 .0042 -.0004 .0025 -.0004
3-1/2 8.75 .0110 .0053 .0024 .0061 .0040 -.0003 .0023 -.0003
4-1/2 0 .0075 .0035 .0020 .0038 .0033 -.0003 .0021 -.0002 I-' 0 I-'
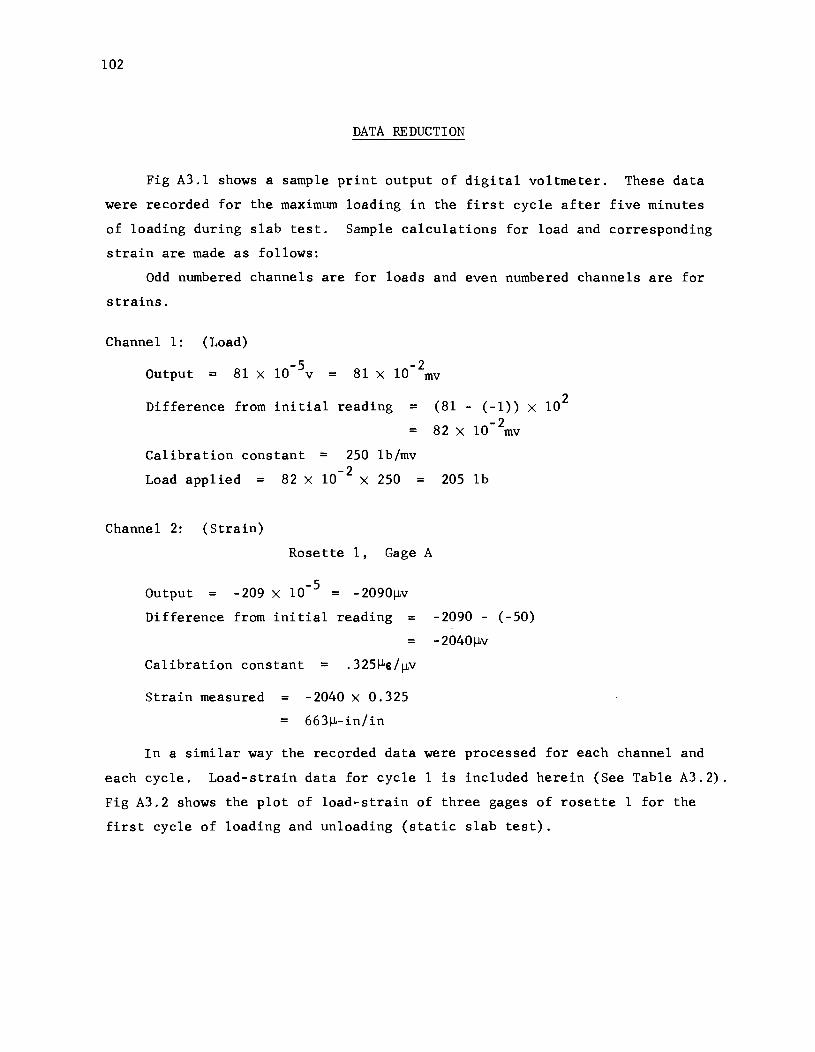
102
DATA REDUCTION
Fig A3.l shows a sample print output of digital voltmeter. These data
were recorded for the maximum loading in the first cycle after five minutes
of loading during slab test. Sample calculations for load and corresponding
strain are made as follows:
Odd numbered channels are for loads and even numbered channels are for
strains.
Channell: (Load)
Output = 81 X 10-5v = -2 81 X 10 mv
Difference from initial reading = =
Calibration constant = 250 lb/mv
Load applied = 82 X 10- 2 X 250
Channel 2: (Strain)
=
Rosette 1, Gage A
Output = -209 X 10-5 = -2090l-Lv
(81 - (-1)) X 102
82 X 10-2mv
205 lb
Difference from initial reading = -2090 - (-50)
= -20401-Lv
Calibration constant = . 3251-Le/l-Lv
Strain measured = -2040 X 0.325
= 6631-L-in/in
In a similar way the recorded data were processed for each channel and
each cycle. Load-strain data for cycle 1 is included herein (See Table A3.2).
Fig A3.2 shows the plot of load-strain of three gages of rosette 1 for the
first cycle of loading and unloading (static slab test).

I 0 + · o 003 3 5 o 9 + · o 007 9 5 o 8 - '00066 5 o 7 + · o 008 0 5 o 6 - · o 004 5 5 o 5 + · 0 008 0 5 o 4 - · 0 0 I I 5 5 o 3 + · 0 008 I 5
Channel 2 o 2 - · 0 o 2 0 9 5 Channel I o I + · 0 008 I 5
o 0 - · 0 000 I 5
Fig A3.l. A sample of printout by digital voltmeter for load cycle 1 during the slab test.
103
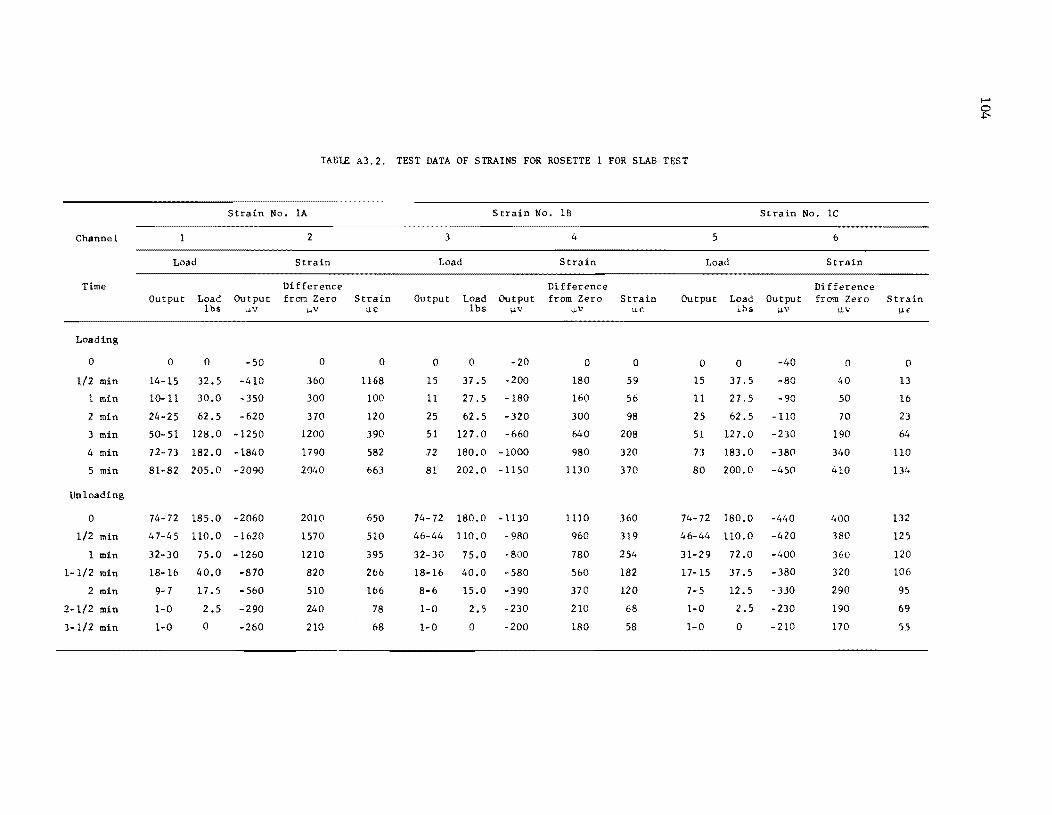
Channel
Time
Loading
o 1/2 min
1 min
2 min
3 min
4 min
5 min
Unloading
o 1/2 min
1 min
1-1/2 min
2 min
2-1/2 min
3-1/2 min
TABLE A3.2. TEST DATA OF STRAINS FOR ROSETTE 1 FOR SLAB TEST
Strain No. lA
2
Load Strain
Difference Output Load Output fram Zero Strain
1hs uv ;J,V UE:
o 14-15
10-11
24-25
50-51
72-73
o -50
32.5 -410
30.0 -350
62.5 -620
128.0 -1250
182.0 -1840
81-82 205.0 -2090
74-72
47-45
32-30
18-16
9-7
1-0
1-0
185.0 -2060
110.0 -1620
75.0 -1260
40.0 -870
17.5 - 560
2.5 -290
o -260
o 360
300
370
1200
1790
2040
2010
1570
1210
820
510
240
210
o 1168
100
120
390
582
663
650
510
395
266
166
78
68
Strain No. IB
3 4
Load Strain
Difference Output Load Output from Zero Strain
o 15
11
25
51
72
81
74-72
46-44
32-30
18-16
8-6
1-0
1-0
Ibs IJ.V UV u"
o -20
37.5 -200
27.5 -180
62.5 -320
127.0 -660
180.0 -1000
202.0 -1150
180.0 -1130
110.0 -980
75.0 -800
40.0 -580
15.0 -390
2.5 -230
o -200
o 180
160
300
640
980
1130
1110
960
780
560
370
210
180
o 59
56
98
208
320
370
360
319
254
182
120
68
58
Strain No. 1C
5 6
Load Strain
Difference Output Load Output from Zero Strain
lbs u.v ltV Uf
o 15
11
25
51
73
o 37.5
27.5
62.5
127.0
183.0
-40
-80
- 90
-110
-230
-380
80 200.0 -450
74-72
46-44
31-29
17-15
7- 5
1-0
1-0
180.0
110.0
72.0
37.5
12.5
2.5
o
-440
-420
-400
-380
-330
-230
-210
o 40
50
70
190
340
410
400
380
360
320
290
190
170
o 13
16
23
64
110
134
132
125
120
106
95
69
55

200
I I / 160
I / /
/ / 120
/; / I 0
/ :2 1 '1;1 I / a 0
80 A oJ
! o - Gage
0
/' o - Gage a
/ 6. - Gage C
/ ~~ 40 / 0/
/' Rlit
~c /' R.: I in. from Center on Center Line
0 100 200 300 400 500 600 700
Strain • in Jl 106
Fig A3.2. Load versus strain for Rosette 1.
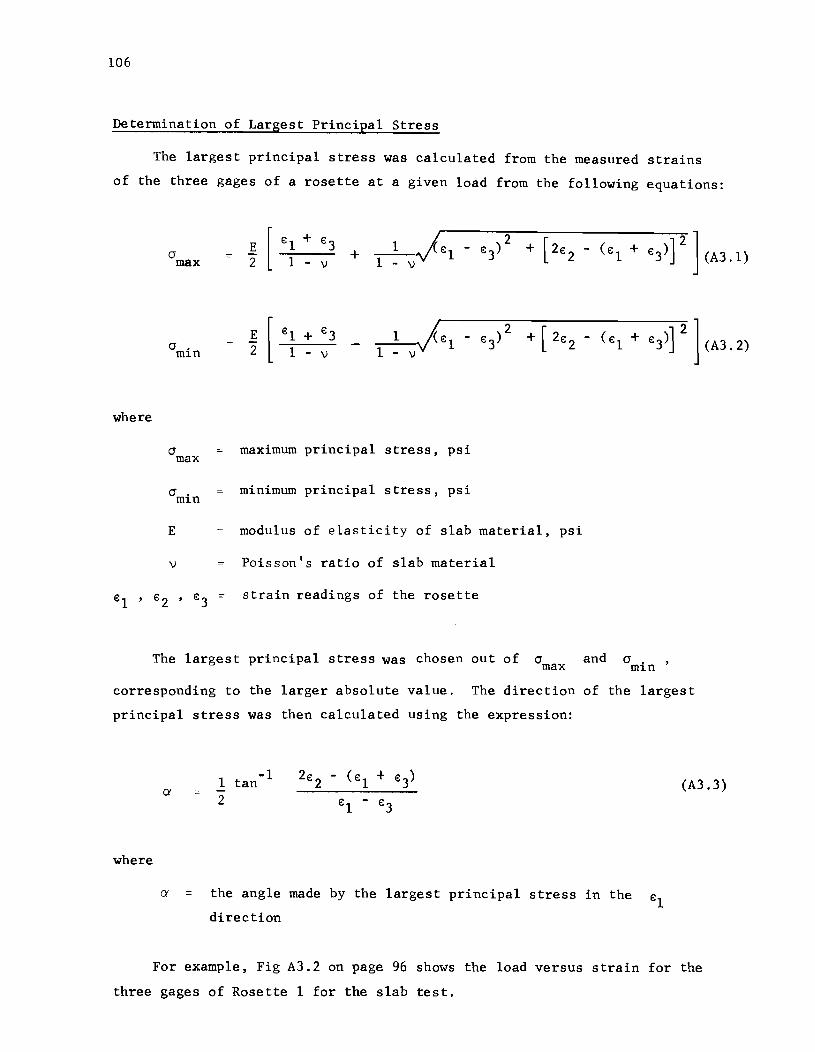
106
Determination of Largest Principal Stress
The largest principal stress was calculated from the measured strains
of the three gages of a rosette at a given load from the following equations:
where
€l , €2
a max
a . m1n
° max
°min
E
\i
, €3
+
maximum principal stress, psi
minimum principal stress, psi
modulus of elasticity of slab material, psi
Poisson's ratio of slab material
strain readings of the rosette
The largest principal stress was chosen out of 0max and a. m1n
corresponding to the larger absolute value. The direction of the largest
principal stress was then calculated using the expression:
where
Ct
-1 1 tan 2
2€2 - (€l + €3)
€l - €3
Ct = the angle made by the largest principal stress in the €l
direction
(A3.3)
For example, Fig A3.2 on page 96 shows the load versus strain for the
three gages of Rosette 1 for the slab test.

107
For a load of 200 pounds
e 1 - 640 IJ._. in/in
e3 -135 ~-in/in
Using Eq A3.l and A3.2, the largest principal stress is calculated to be
8500 psi. The difference between the direction of stress and strain (el
) is
10.
Similar calculations were made for different loads both during loading and
unloading. Load versus largest principal stress thus obtained is shown in Fig
37. For the other rosettes, the largest principal stresses were obtained in
the same way.

!!!!!!!!!!!!!!!!!!!"#$%!&'()!*)&+',)%!'-!$-.)-.$/-'++0!1+'-2!&'()!$-!.#)!/*$($-'+3!
44!5"6!7$1*'*0!8$($.$9'.$/-!")':!
THE AUTHORS
Qaiser S. Siddiqi is currently an engineer wieh Brown and Root Engineers,
Houston, Texas. While at The University of Texas at Austin (1967-1969), he
was a Research Engineer Assistant at ehe Center for Highway Research, where
his research dealt with the development of computer methods of simulating
beam columns and slab systems.
W. Ronald Hudson is an Associate Professor of Civil
Engineering and Associate Dean of the College of Engineering
at The University of Texas at Austin. He has had a wide
variety of experience as a research engineer with the Texas
Highway Department and the Center for Highway Research at
The University of Texas at Austin and was Assistant Chief of
the Rigid Pavement Research Branch of the AASHO Road Test. He is ehc author
of numerous publications and was the recipient of the 1967 ASCE J. James R.
Croes Medal. He is presently concerned with research in the areas of
(1) analysis and design of pavement management systems, (2) measurement of
pavement roughness performance, (3) slab analysiS and deSign, and (4) tensile
strength of stabilized subbase materials.
109


