Executive Division
207 FY2016
Mission Statement The Mission Statement of the Executive Division is to plan, execute, and manage the efficient, effective, and safe delivery of quality public transportation services tot the residents of Greater Cleveland.
Division Summary Joseph A. Calabrese, CEO/General Manager
And Secretary/Treasurer The Executive Division is responsible for the overall management of the organization, including strategic leadership, finance, operations, human resources, marketing, media and government relations, planning, project management, and engineering. The focus of RTA’s business plan was to enhance customer service, improve our image, strengthen financial resources, and execute a 2014 Budget that would result in a balanced budget without service reductions, fare increases, or employee layoffs.
2015 Achievements Strong Fiscal Management
Finished year $12 million better than budget, with an ending balance of $25 million Renewed three-year contract with Amalgamated Transit Union, tying future wages to
revenue Continued efforts of Environmental & Sustainability Management System (ESMS) to
improve sustainability efforts and reduce costs Deployed 90 CNG buses, reducing per vehicle fuel costs by 50% Awarded funding from ODOT for 12 replacement Trolleys and Rail infrastructure work Received Auditor of State – Award with Distinction Received GFOA Award for CAFR for 27th consecutive year
Infrastructure Upgrades and Improvements
Opened Little Italy Station Opened Lee Van Aken Station Continued on-going construction projects at the Brookpark Station and Green
Road/Warrensville Station Began design work on East 116th Street Station and East 34th Street Station Began design of rail work at Tower City Station and replacement of Station escalators Continued to work with City of Cleveland and NOACA on Red Line Art Project Deployed 90 new CNG buses and completed work on Hayden CNG fueling station Deployed 20 propane powered Paratransit buses Improved Rail Crossings in Shaker Heights and in the Flats Installed 3-position bike racks on all buses Continued interior mid-life upgrades of Red Line rail cars
Executive Division
208 FY2016
Staff Development Hosted US Dept. of Labor Secy. Tom Perez, who honored RTA’s achievements with
its front-line apprenticeship programs and promoted employment opportunities for bus and rail vehicle maintenance technicians and signal technicians.
Received FTA Grant for Apprenticeship with Tri-C Received FTA Grant for Transit Academy Leadership training at CSU Honored Flounsay Caver, who received the CSU 2015 Distinguished Alumni Award Honored Jose Feliciano, who received Crain’s Cleveland Business’ 40 Under 40
Award
Strong Corporate and Civic Image and Partnership Development Continued positive relationship with local media including:
o Smart Business Magazine, Joe Calabrese honored with Smart 50 Award for corporate successes
o Crain’s Cleveland Business, Joe Calabrese featured in “Source Lunch” profile o Governing Magazine, Joe Calabrese honored with Public Official of the Year
Award Continued involvement in RNC 2016 Convention planning Continued involvement with NOACA, serving on Board of Directors, Transportation
committee and External Affairs Committee Continued involvement on the City/County Workforce Development Board &
Executive Committee Continued involvement as co-chair of University Circle Transportation and Parking
Committee Promoted ODOT Transit Needs Study, calling for increased funding for public
transportation Spoke at several Federal and State hearings, advocating for increased funding Enhanced partnerships with University Circle Incorporated, receiving Building the
Circle Award Addressed numerous civic and corporate groups, such as the GCP Board of Directors Elected Chair of the Downtown Cleveland Investment Corporation, comprised of
major Downtown property owners Elected Chair of the Metropolitan Rail Operators Group
Ridership Increase
Cedar/University Station – increased ridership more than 30% Little Italy Station – increased ridership more than 100% vs the E. 120 station it
replaced The Cleveland State Line – increased ridership more than 30% Targeted Millennials in several key Marketing campaigns Implemented U-Pass with Notre Dame College
System and Operator Safety Improvements
Reduced crime on RTA vehicles and on RTA property Entered into Mutual Aid agreement with CPD enforcement along Clifton Avenue to
support the Cleveland State Line Implemented new driving simulator, to aid in pre-employment and retraining activities Awarded Operation Lifesaver Grant Saluted operators who had a combined total of 575 years of accident-free driving at
RTA Annual Awards Banquet. Sponsored and promoted Human Trafficking awareness program
Executive Division
209 FY2016
Established Community Policing at Districts Completed camera installation on buses and trains Installed “Drive Cam” units on all buses and trains Conducted conflict resolution training for operators Began training on “self-defense from a seated position” for operators
Recognition and Awards
Joe Calabrese named Governing Magazine’s Public Official of the Year, the only transit manager to ever receive this prestigious award
Joe Calabrese received Smart Business Smart 50 Award, presented to top executives in recognition of ability and talent to effectively build and lead innovative and “smart” organizations
RTA received The Partnership for Excellence’s Silver Award for Commitment to Excellence, as part of RTA’s pursuit of the Malcolm Baldrige Award
RTA awarded Metro Magazine and Bus Con’s 2015 Innovation Solutions Award for RTA’s partnership with Lytx and its innovative implementation of DriveCam
RTA received two honors from the Commission on Economic Inclusion o 2015 Commission 50, awarded to 50 organizations with the highest combined
scores on board, senior management, workforce and supplier diversity o Best in Class – Workforce Diversity Nonprofit/Govt.
RTA awarded University Circle Incorporated Building the Circle Award for the Little Italy-University Circle Station
RTA received Earth Day Coalition’s Community Works Program Award: Clean Transportation as Hydrogen Fuel Cell Bus Demo Project Collaborator
RTA received Merit/Ohio Landscape Architecture Award from the Ohio Chapter of the American Society of Landscape Architects for RTA’s accomplishments in contributing to the quality of life in Ohio, for implementation of the HealthLine BRT and the Cleveland State Line
2016 Objectives Support the Mission, Vision and Values of RTA Continue to improve service quality for all RTA customers including:
o On-time performance o Reliability o Customer Satisfaction o Safety
Investigate additional strategies to increase our productivity and reduce costs. Identify additional funding for infrastructure needs. Deliver a creative marketing plan to promote the RTA and maximize ridership. Continue our positive relationship with civic leaders, elected officials, and the
media. Continue to educate about the benefits of public transit and RTA. Increase the cleanliness of RTA facilities and vehicles. Work to maximize the value of RTA to tourism and visitors, especially in light
of the 2016 RNC. Encourage Transit Supportive Developments. Focus on Employee Development and Succession Planning programs.
Executive Division
210 FY2016
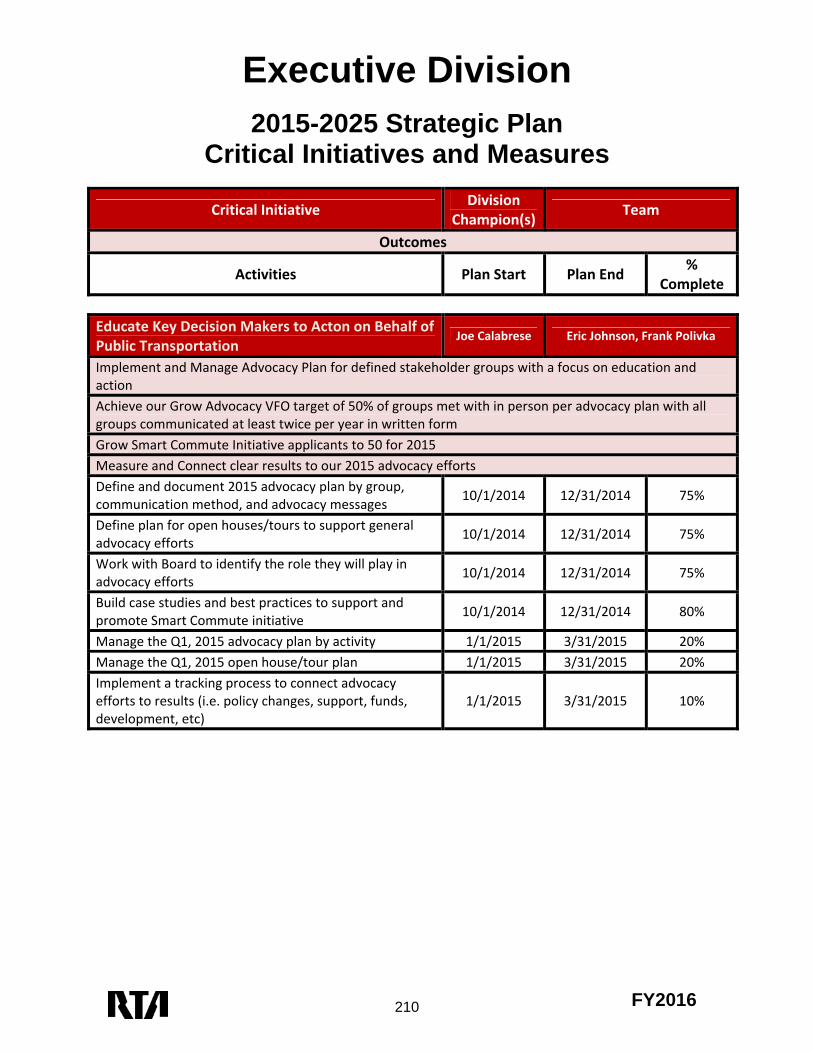
2015-2025 Strategic Plan Critical Initiatives and Measures
Critical Initiative Division
Champion(s)Team
Outcomes
Activities Plan Start Plan End %
Complete
Educate Key Decision Makers to Acton on Behalf of Public Transportation
Joe Calabrese Eric Johnson, Frank Polivka
Implement and Manage Advocacy Plan for defined stakeholder groups with a focus on education and action
Achieve our Grow Advocacy VFO target of 50% of groups met with in person per advocacy plan with all groups communicated at least twice per year in written form
Grow Smart Commute Initiative applicants to 50 for 2015
Measure and Connect clear results to our 2015 advocacy efforts
Define and document 2015 advocacy plan by group, communication method, and advocacy messages
10/1/2014 12/31/2014 75%
Define plan for open houses/tours to support general advocacy efforts
10/1/2014 12/31/2014 75%
Work with Board to identify the role they will play in advocacy efforts
10/1/2014 12/31/2014 75%
Build case studies and best practices to support and promote Smart Commute initiative
10/1/2014 12/31/2014 80%
Manage the Q1, 2015 advocacy plan by activity 1/1/2015 3/31/2015 20%
Manage the Q1, 2015 open house/tour plan 1/1/2015 3/31/2015 20%
Implement a tracking process to connect advocacy efforts to results (i.e. policy changes, support, funds, development, etc)
1/1/2015 3/31/2015 10%
Executive Division
211 FY2016
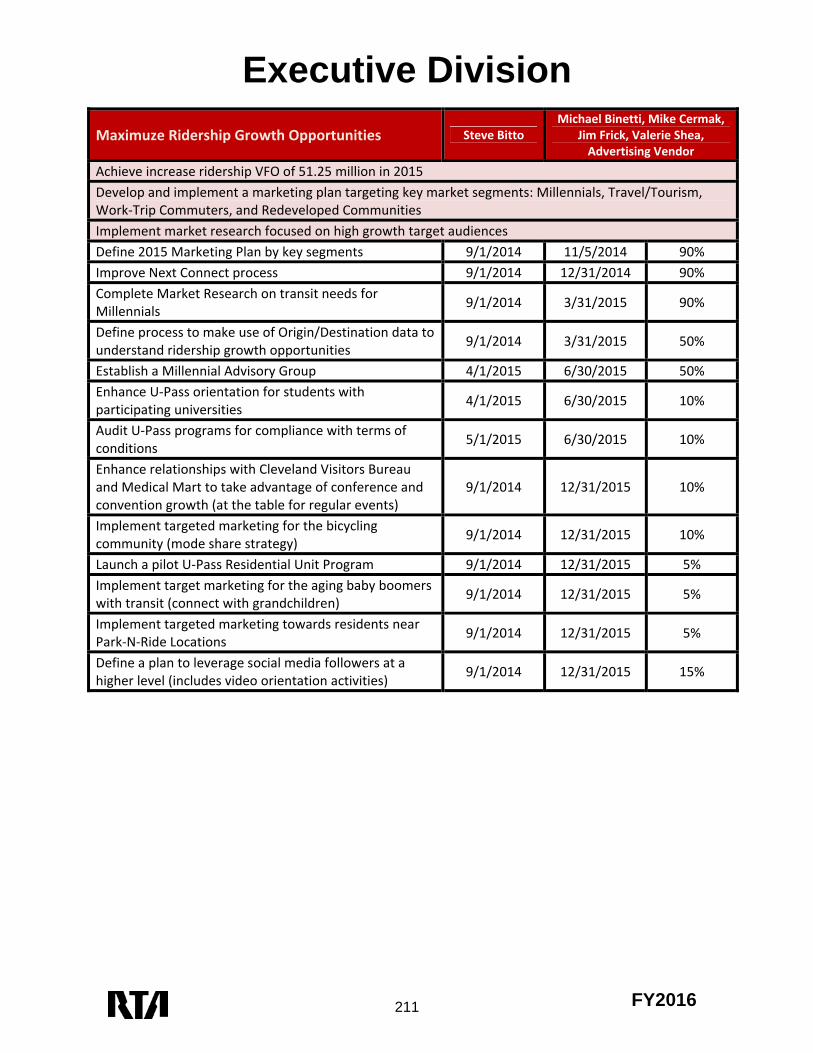
Maximuze Ridership Growth Opportunities Steve Bitto Michael Binetti, Mike Cermak,
Jim Frick, Valerie Shea, Advertising Vendor
Achieve increase ridership VFO of 51.25 million in 2015
Develop and implement a marketing plan targeting key market segments: Millennials, Travel/Tourism, Work‐Trip Commuters, and Redeveloped Communities
Implement market research focused on high growth target audiences
Define 2015 Marketing Plan by key segments 9/1/2014 11/5/2014 90%
Improve Next Connect process 9/1/2014 12/31/2014 90%
Complete Market Research on transit needs for Millennials
9/1/2014 3/31/2015 90%
Define process to make use of Origin/Destination data to understand ridership growth opportunities
9/1/2014 3/31/2015 50%
Establish a Millennial Advisory Group 4/1/2015 6/30/2015 50%
Enhance U‐Pass orientation for students with participating universities
4/1/2015 6/30/2015 10%
Audit U‐Pass programs for compliance with terms of conditions
5/1/2015 6/30/2015 10%
Enhance relationships with Cleveland Visitors Bureau and Medical Mart to take advantage of conference and convention growth (at the table for regular events)
9/1/2014 12/31/2015 10%
Implement targeted marketing for the bicycling community (mode share strategy)
9/1/2014 12/31/2015 10%
Launch a pilot U‐Pass Residential Unit Program 9/1/2014 12/31/2015 5%
Implement target marketing for the aging baby boomers with transit (connect with grandchildren)
9/1/2014 12/31/2015 5%
Implement targeted marketing towards residents near Park‐N‐Ride Locations
9/1/2014 12/31/2015 5%
Define a plan to leverage social media followers at a higher level (includes video orientation activities)
9/1/2014 12/31/2015 15%
Executive Division
212 FY2016
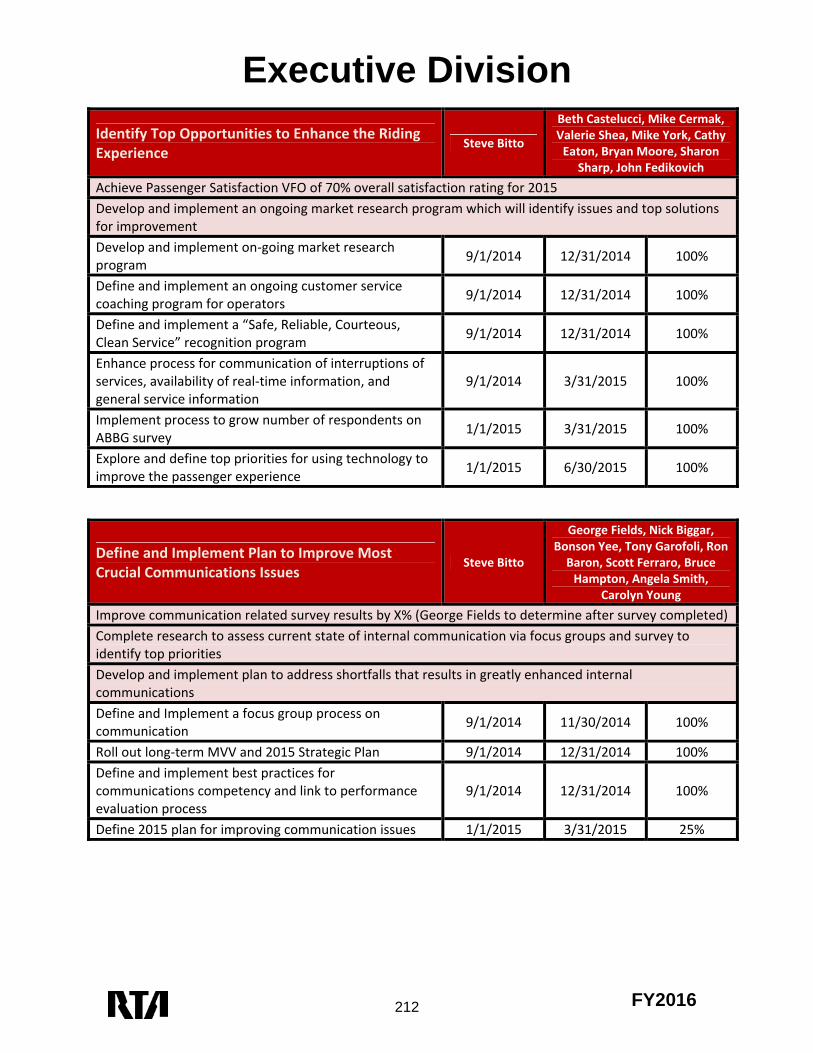
Identify Top Opportunities to Enhance the Riding Experience
Steve Bitto
Beth Castelucci, Mike Cermak, Valerie Shea, Mike York, Cathy Eaton, Bryan Moore, Sharon
Sharp, John Fedikovich
Achieve Passenger Satisfaction VFO of 70% overall satisfaction rating for 2015
Develop and implement an ongoing market research program which will identify issues and top solutions for improvement
Develop and implement on‐going market research program
9/1/2014 12/31/2014 100%
Define and implement an ongoing customer service coaching program for operators
9/1/2014 12/31/2014 100%
Define and implement a “Safe, Reliable, Courteous, Clean Service” recognition program
9/1/2014 12/31/2014 100%
Enhance process for communication of interruptions of services, availability of real‐time information, and general service information
9/1/2014 3/31/2015 100%
Implement process to grow number of respondents on ABBG survey
1/1/2015 3/31/2015 100%
Explore and define top priorities for using technology to improve the passenger experience
1/1/2015 6/30/2015 100%
Define and Implement Plan to Improve Most Crucial Communications Issues
Steve Bitto
George Fields, Nick Biggar, Bonson Yee, Tony Garofoli, Ron Baron, Scott Ferraro, Bruce Hampton, Angela Smith,
Carolyn Young
Improve communication related survey results by X% (George Fields to determine after survey completed)
Complete research to assess current state of internal communication via focus groups and survey to identify top priorities
Develop and implement plan to address shortfalls that results in greatly enhanced internal communications
Define and Implement a focus group process on communication
9/1/2014 11/30/2014 100%
Roll out long‐term MVV and 2015 Strategic Plan 9/1/2014 12/31/2014 100%
Define and implement best practices for communications competency and link to performance evaluation process
9/1/2014 12/31/2014 100%
Define 2015 plan for improving communication issues 1/1/2015 3/31/2015 25%
Executive Division
213 FY2016
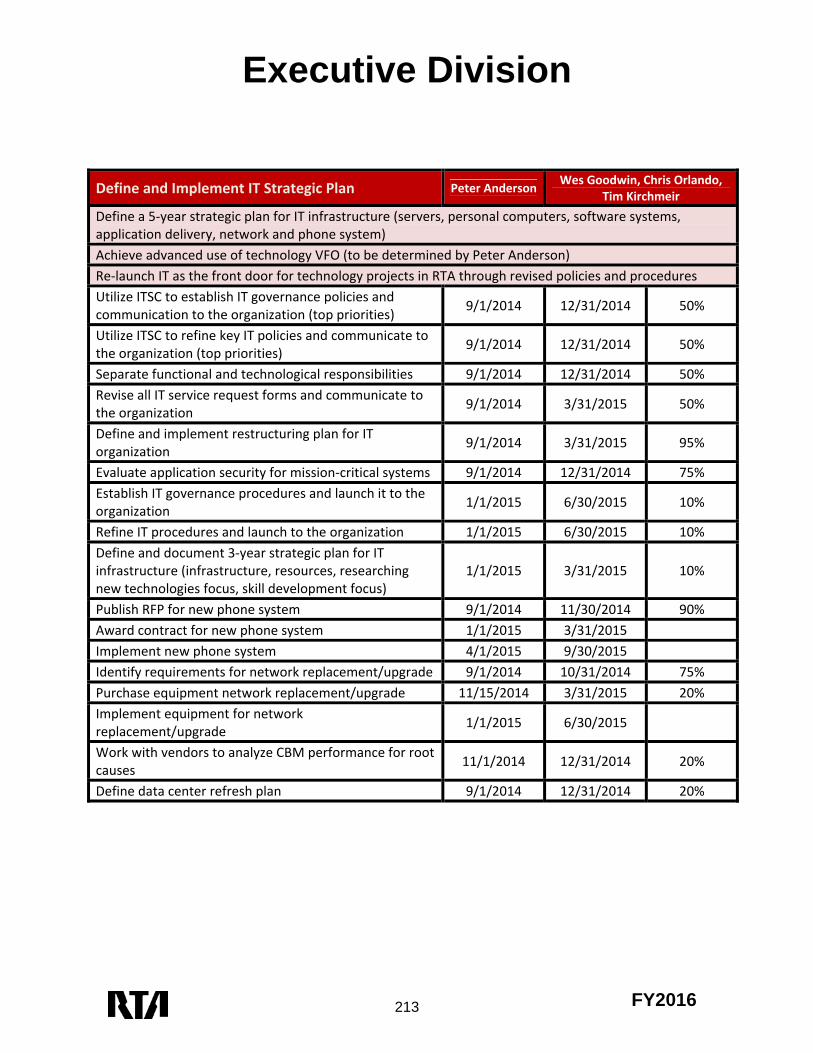
Define and Implement IT Strategic Plan Peter Anderson
Wes Goodwin, Chris Orlando, Tim Kirchmeir
Define a 5‐year strategic plan for IT infrastructure (servers, personal computers, software systems, application delivery, network and phone system)
Achieve advanced use of technology VFO (to be determined by Peter Anderson)
Re‐launch IT as the front door for technology projects in RTA through revised policies and procedures
Utilize ITSC to establish IT governance policies and communication to the organization (top priorities)
9/1/2014 12/31/2014 50%
Utilize ITSC to refine key IT policies and communicate to the organization (top priorities)
9/1/2014 12/31/2014 50%
Separate functional and technological responsibilities 9/1/2014 12/31/2014 50%
Revise all IT service request forms and communicate to the organization
9/1/2014 3/31/2015 50%
Define and implement restructuring plan for IT organization
9/1/2014 3/31/2015 95%
Evaluate application security for mission‐critical systems 9/1/2014 12/31/2014 75%
Establish IT governance procedures and launch it to the organization
1/1/2015 6/30/2015 10%
Refine IT procedures and launch to the organization 1/1/2015 6/30/2015 10%
Define and document 3‐year strategic plan for IT infrastructure (infrastructure, resources, researching new technologies focus, skill development focus)
1/1/2015 3/31/2015 10%
Publish RFP for new phone system 9/1/2014 11/30/2014 90%
Award contract for new phone system 1/1/2015 3/31/2015
Implement new phone system 4/1/2015 9/30/2015
Identify requirements for network replacement/upgrade 9/1/2014 10/31/2014 75%
Purchase equipment network replacement/upgrade 11/15/2014 3/31/2015 20%
Implement equipment for network replacement/upgrade
1/1/2015 6/30/2015
Work with vendors to analyze CBM performance for root causes
11/1/2014 12/31/2014 20%
Define data center refresh plan 9/1/2014 12/31/2014 20%
Executive Division
214 FY2016
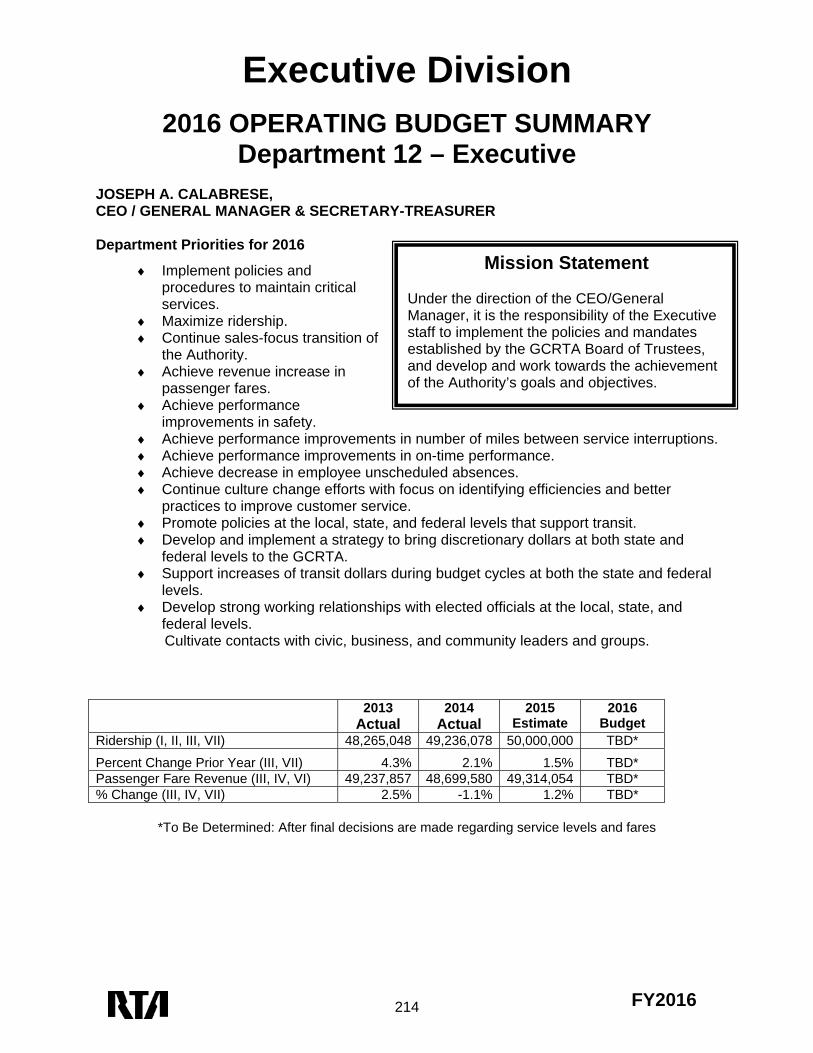
Mission Statement Under the direction of the CEO/General Manager, it is the responsibility of the Executive staff to implement the policies and mandates established by the GCRTA Board of Trustees, and develop and work towards the achievement of the Authority’s goals and objectives.
2016 OPERATING BUDGET SUMMARY Department 12 – Executive
JOSEPH A. CALABRESE, CEO / GENERAL MANAGER & SECRETARY-TREASURER Department Priorities for 2016
Implement policies and procedures to maintain critical services.
Maximize ridership. Continue sales-focus transition of
the Authority. Achieve revenue increase in
passenger fares. Achieve performance
improvements in safety. Achieve performance improvements in number of miles between service interruptions. Achieve performance improvements in on-time performance. Achieve decrease in employee unscheduled absences. Continue culture change efforts with focus on identifying efficiencies and better
practices to improve customer service. Promote policies at the local, state, and federal levels that support transit. Develop and implement a strategy to bring discretionary dollars at both state and
federal levels to the GCRTA. Support increases of transit dollars during budget cycles at both the state and federal
levels. Develop strong working relationships with elected officials at the local, state, and
federal levels. Cultivate contacts with civic, business, and community leaders and groups.
2013 Actual
2014 Actual
2015 Estimate
2016 Budget
Ridership (I, II, III, VII) 48,265,048 49,236,078 50,000,000 TBD*
Percent Change Prior Year (III, VII) 4.3% 2.1% 1.5% TBD* Passenger Fare Revenue (III, IV, VI) 49,237,857 48,699,580 49,314,054 TBD* % Change (III, IV, VII) 2.5% -1.1% 1.2% TBD*
*To Be Determined: After final decisions are made regarding service levels and fares
Executive Division
215 FY2016
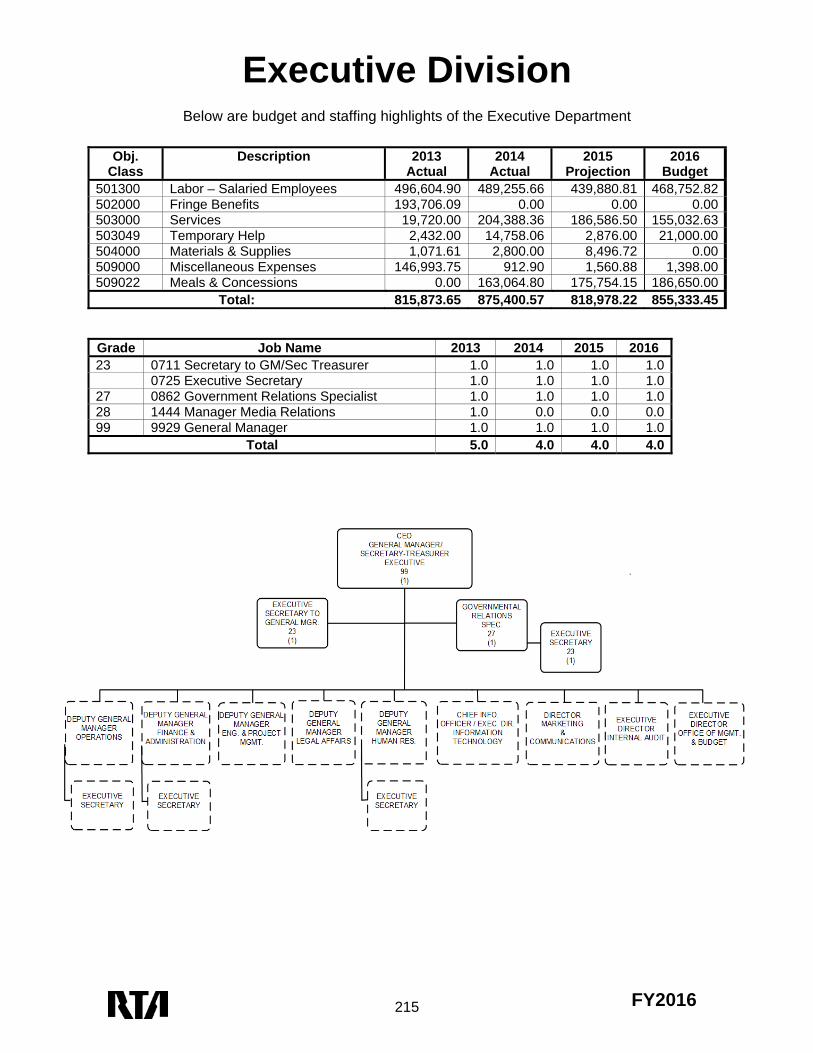
Below are budget and staffing highlights of the Executive Department
Obj. Class
Description 2013 Actual
2014 Actual
2015 Projection
2016 Budget
501300 Labor – Salaried Employees 496,604.90 489,255.66 439,880.81 468,752.82 502000 Fringe Benefits 193,706.09 0.00 0.00 0.00 503000 Services 19,720.00 204,388.36 186,586.50 155,032.63 503049 Temporary Help 2,432.00 14,758.06 2,876.00 21,000.00 504000 Materials & Supplies 1,071.61 2,800.00 8,496.72 0.00 509000 Miscellaneous Expenses 146,993.75 912.90 1,560.88 1,398.00 509022 Meals & Concessions 0.00 163,064.80 175,754.15 186,650.00
Total: 815,873.65 875,400.57 818,978.22 855,333.45
Grade Job Name 2013 2014 2015 2016 23 0711 Secretary to GM/Sec Treasurer 1.0 1.0 1.0 1.0 0725 Executive Secretary 1.0 1.0 1.0 1.027 0862 Government Relations Specialist 1.0 1.0 1.0 1.028 1444 Manager Media Relations 1.0 0.0 0.0 0.099 9929 General Manager 1.0 1.0 1.0 1.0
Total 5.0 4.0 4.0 4.0
Executive Division
216 FY2016
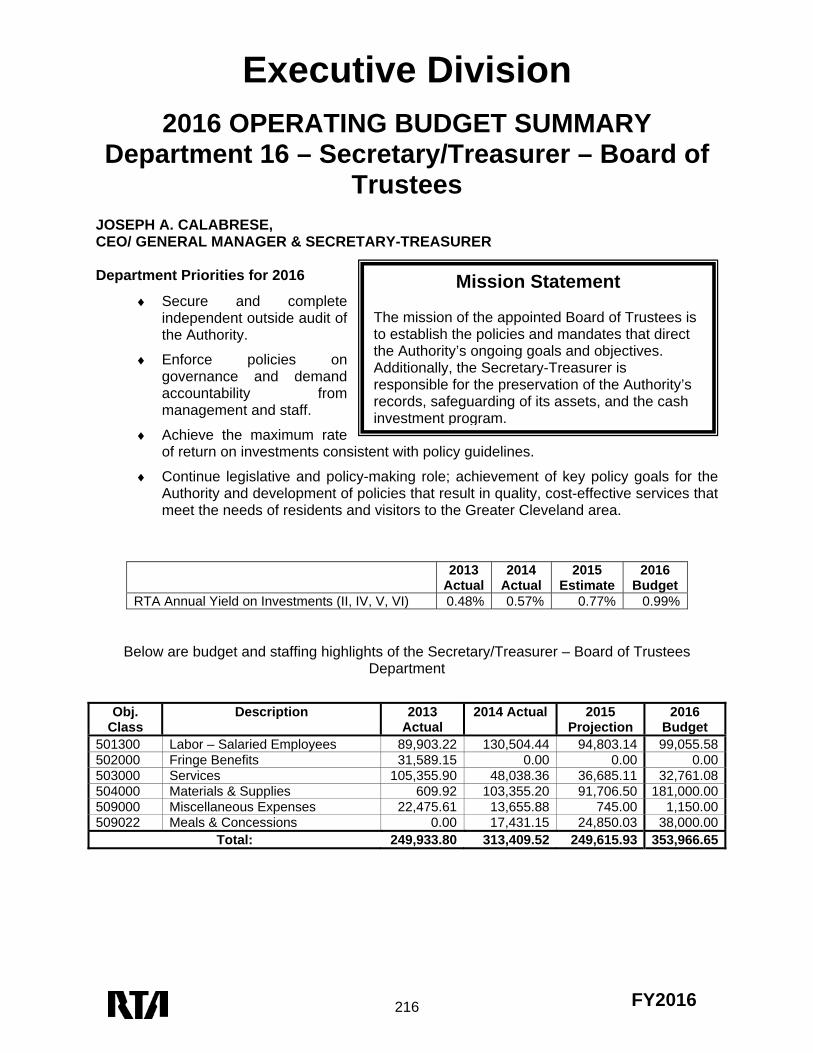
Mission Statement The mission of the appointed Board of Trustees is to establish the policies and mandates that direct the Authority’s ongoing goals and objectives. Additionally, the Secretary-Treasurer is responsible for the preservation of the Authority’s records, safeguarding of its assets, and the cash investment program.
2016 OPERATING BUDGET SUMMARY Department 16 – Secretary/Treasurer – Board of
Trustees JOSEPH A. CALABRESE, CEO/ GENERAL MANAGER & SECRETARY-TREASURER Department Priorities for 2016
Secure and complete independent outside audit of the Authority.
Enforce policies on governance and demand accountability from management and staff.
Achieve the maximum rate of return on investments consistent with policy guidelines.
Continue legislative and policy-making role; achievement of key policy goals for the Authority and development of policies that result in quality, cost-effective services that meet the needs of residents and visitors to the Greater Cleveland area.
2013 Actual
2014 Actual
2015 Estimate
2016 Budget
RTA Annual Yield on Investments (II, IV, V, VI) 0.48% 0.57% 0.77% 0.99%
Below are budget and staffing highlights of the Secretary/Treasurer – Board of Trustees Department
Obj. Class
Description 2013 Actual
2014 Actual 2015 Projection
2016 Budget
501300 Labor – Salaried Employees 89,903.22 130,504.44 94,803.14 99,055.58 502000 Fringe Benefits 31,589.15 0.00 0.00 0.00 503000 Services 105,355.90 48,038.36 36,685.11 32,761.08 504000 Materials & Supplies 609.92 103,355.20 91,706.50 181,000.00 509000 Miscellaneous Expenses 22,475.61 13,655.88 745.00 1,150.00 509022 Meals & Concessions 0.00 17,431.15 24,850.03 38,000.00
Total: 249,933.80 313,409.52 249,615.93 353,966.65
Executive Division
217 FY2016
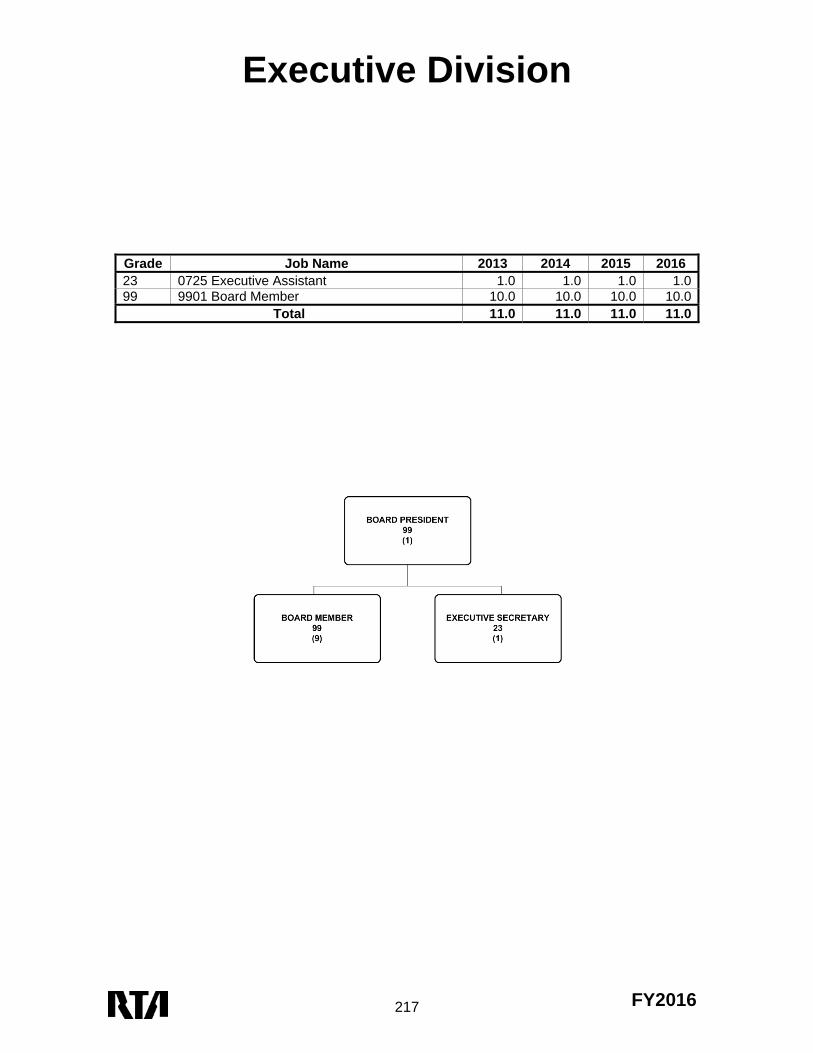
Grade Job Name 2013 2014 2015 2016 23 0725 Executive Assistant 1.0 1.0 1.0 1.099 9901 Board Member 10.0 10.0 10.0 10.0
Total 11.0 11.0 11.0 11.0
Executive Division
218 FY2016
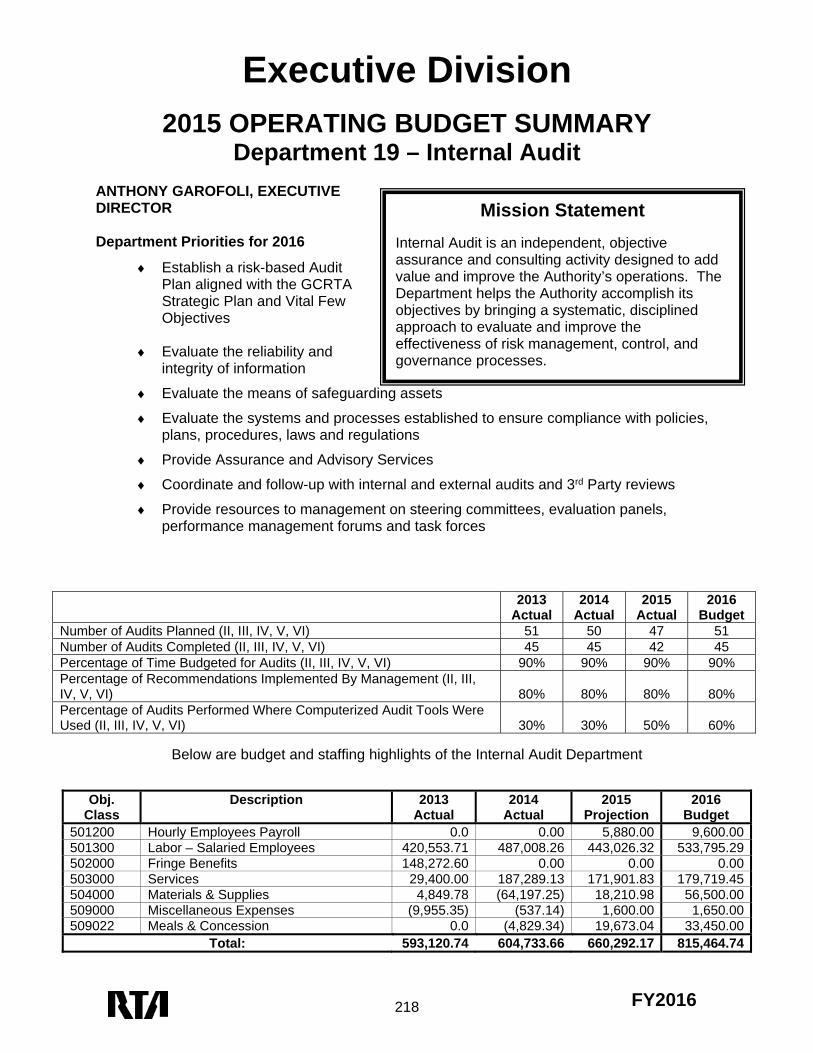
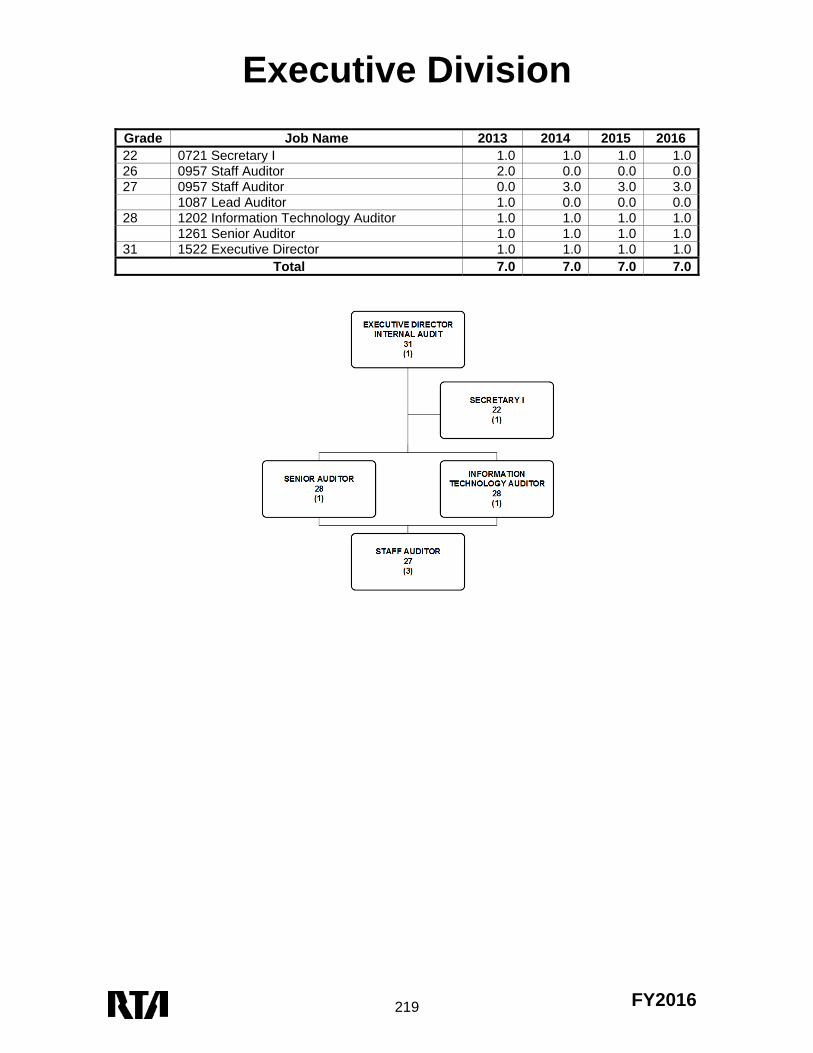
Mission Statement Internal Audit is an independent, objective assurance and consulting activity designed to add value and improve the Authority’s operations. The Department helps the Authority accomplish its objectives by bringing a systematic, disciplined approach to evaluate and improve the effectiveness of risk management, control, and governance processes.
2015 OPERATING BUDGET SUMMARY
Department 19 – Internal Audit ANTHONY GAROFOLI, EXECUTIVE DIRECTOR Department Priorities for 2016
Establish a risk-based Audit Plan aligned with the GCRTA Strategic Plan and Vital Few Objectives
Evaluate the reliability and integrity of information
Evaluate the means of safeguarding assets
Evaluate the systems and processes established to ensure compliance with policies, plans, procedures, laws and regulations
Provide Assurance and Advisory Services
Coordinate and follow-up with internal and external audits and 3rd Party reviews
Provide resources to management on steering committees, evaluation panels, performance management forums and task forces
2013 Actual
2014 Actual
2015 Actual
2016 Budget
Number of Audits Planned (II, III, IV, V, VI) 51 50 47 51 Number of Audits Completed (II, III, IV, V, VI) 45 45 42 45 Percentage of Time Budgeted for Audits (II, III, IV, V, VI) 90% 90% 90% 90% Percentage of Recommendations Implemented By Management (II, III, IV, V, VI) 80% 80%
80%
80%
Percentage of Audits Performed Where Computerized Audit Tools Were Used (II, III, IV, V, VI) 30% 30%
50%
60%
Below are budget and staffing highlights of the Internal Audit Department
Obj. Class
Description 2013 Actual
2014 Actual
2015 Projection
2016 Budget
501200 Hourly Employees Payroll 0.0 0.00 5,880.00 9,600.00 501300 Labor – Salaried Employees 420,553.71 487,008.26 443,026.32 533,795.29 502000 Fringe Benefits 148,272.60 0.00 0.00 0.00 503000 Services 29,400.00 187,289.13 171,901.83 179,719.45 504000 Materials & Supplies 4,849.78 (64,197.25) 18,210.98 56,500.00 509000 Miscellaneous Expenses (9,955.35) (537.14) 1,600.00 1,650.00 509022 Meals & Concession 0.0 (4,829.34) 19,673.04 33,450.00
Total: 593,120.74 604,733.66 660,292.17 815,464.74
Executive Division
219 FY2016
Grade Job Name 2013 2014 2015 2016 22 0721 Secretary I 1.0 1.0 1.0 1.026 0957 Staff Auditor 2.0 0.0 0.0 0.027 0957 Staff Auditor 0.0 3.0 3.0 3.0 1087 Lead Auditor 1.0 0.0 0.0 0.028 1202 Information Technology Auditor 1.0 1.0 1.0 1.0 1261 Senior Auditor 1.0 1.0 1.0 1.031 1522 Executive Director 1.0 1.0 1.0 1.0
Total 7.0 7.0 7.0 7.0
Executive Division
220 FY2016
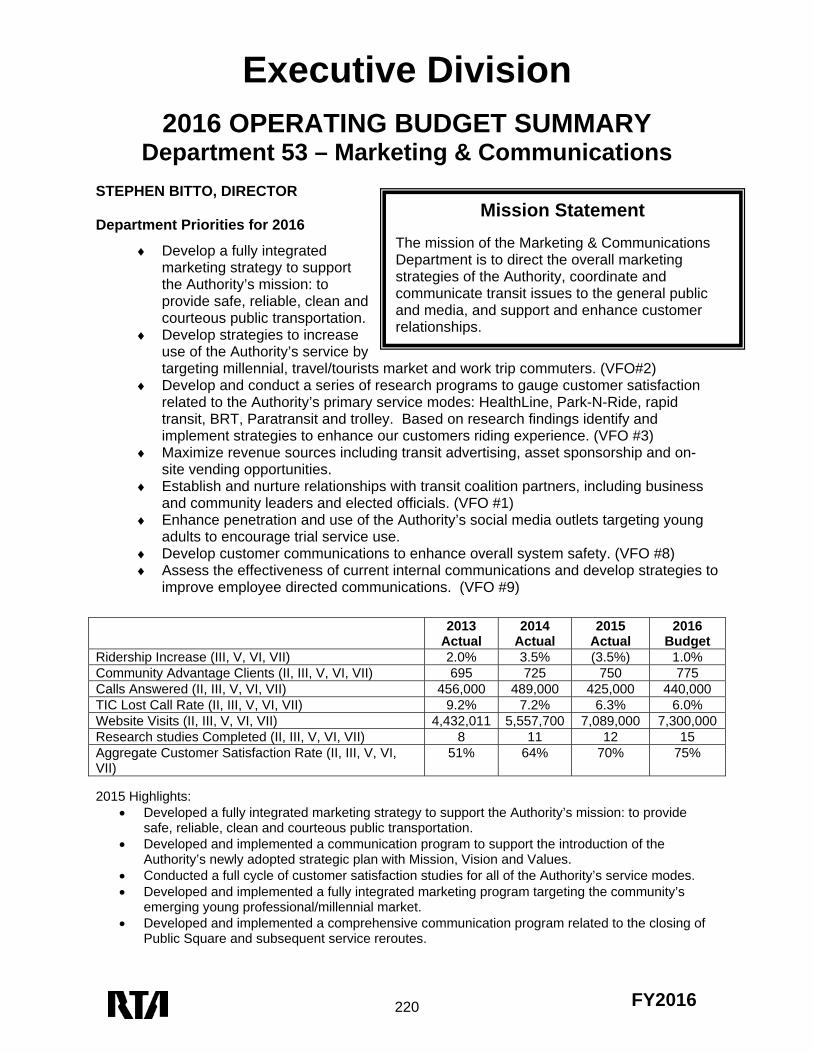
Mission Statement The mission of the Marketing & Communications Department is to direct the overall marketing strategies of the Authority, coordinate and communicate transit issues to the general public and media, and support and enhance customer relationships.
2016 OPERATING BUDGET SUMMARY
Department 53 – Marketing & Communications STEPHEN BITTO, DIRECTOR Department Priorities for 2016
Develop a fully integrated marketing strategy to support the Authority’s mission: to provide safe, reliable, clean and courteous public transportation.
Develop strategies to increase use of the Authority’s service by targeting millennial, travel/tourists market and work trip commuters. (VFO#2)
Develop and conduct a series of research programs to gauge customer satisfaction related to the Authority’s primary service modes: HealthLine, Park-N-Ride, rapid transit, BRT, Paratransit and trolley. Based on research findings identify and implement strategies to enhance our customers riding experience. (VFO #3)
Maximize revenue sources including transit advertising, asset sponsorship and on-site vending opportunities.
Establish and nurture relationships with transit coalition partners, including business and community leaders and elected officials. (VFO #1)
Enhance penetration and use of the Authority’s social media outlets targeting young adults to encourage trial service use.
Develop customer communications to enhance overall system safety. (VFO #8) Assess the effectiveness of current internal communications and develop strategies to
improve employee directed communications. (VFO #9)
2015 Highlights:
Developed a fully integrated marketing strategy to support the Authority’s mission: to provide safe, reliable, clean and courteous public transportation.
Developed and implemented a communication program to support the introduction of the Authority’s newly adopted strategic plan with Mission, Vision and Values.
Conducted a full cycle of customer satisfaction studies for all of the Authority’s service modes. Developed and implemented a fully integrated marketing program targeting the community’s
emerging young professional/millennial market. Developed and implemented a comprehensive communication program related to the closing of
Public Square and subsequent service reroutes.
2013 Actual
2014 Actual
2015 Actual
2016 Budget
Ridership Increase (III, V, VI, VII) 2.0% 3.5% (3.5%) 1.0% Community Advantage Clients (II, III, V, VI, VII) 695 725 750 775 Calls Answered (II, III, V, VI, VII) 456,000 489,000 425,000 440,000 TIC Lost Call Rate (II, III, V, VI, VII) 9.2% 7.2% 6.3% 6.0% Website Visits (II, III, V, VI, VII) 4,432,011 5,557,700 7,089,000 7,300,000 Research studies Completed (II, III, V, VI, VII) 8 11 12 15 Aggregate Customer Satisfaction Rate (II, III, V, VI, VII)
51% 64% 70% 75%
Executive Division
221 FY2016
Obj. Class
Description 2013 Actual 2014 Actual 2015 Projection
2016 Budget
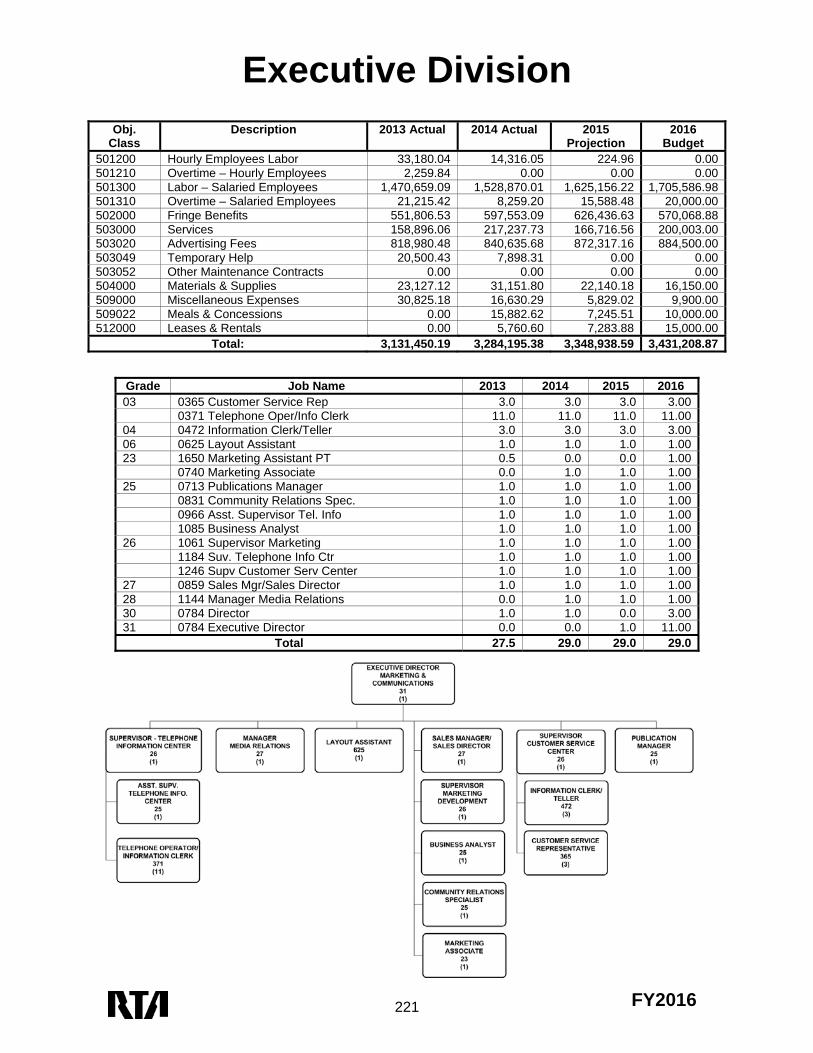
501200 Hourly Employees Labor 33,180.04 14,316.05 224.96 0.00 501210 Overtime – Hourly Employees 2,259.84 0.00 0.00 0.00 501300 Labor – Salaried Employees 1,470,659.09 1,528,870.01 1,625,156.22 1,705,586.98 501310 Overtime – Salaried Employees 21,215.42 8,259.20 15,588.48 20,000.00 502000 Fringe Benefits 551,806.53 597,553.09 626,436.63 570,068.88 503000 Services 158,896.06 217,237.73 166,716.56 200,003.00 503020 Advertising Fees 818,980.48 840,635.68 872,317.16 884,500.00 503049 Temporary Help 20,500.43 7,898.31 0.00 0.00 503052 Other Maintenance Contracts 0.00 0.00 0.00 0.00 504000 Materials & Supplies 23,127.12 31,151.80 22,140.18 16,150.00 509000 Miscellaneous Expenses 30,825.18 16,630.29 5,829.02 9,900.00 509022 Meals & Concessions 0.00 15,882.62 7,245.51 10,000.00 512000 Leases & Rentals 0.00 5,760.60 7,283.88 15,000.00
Total: 3,131,450.19 3,284,195.38 3,348,938.59 3,431,208.87
Grade Job Name 2013 2014 2015 201603 0365 Customer Service Rep 3.0 3.0 3.0 3.00 0371 Telephone Oper/Info Clerk 11.0 11.0 11.0 11.0004 0472 Information Clerk/Teller 3.0 3.0 3.0 3.0006 0625 Layout Assistant 1.0 1.0 1.0 1.0023 1650 Marketing Assistant PT 0.5 0.0 0.0 1.00 0740 Marketing Associate 0.0 1.0 1.0 1.0025 0713 Publications Manager 1.0 1.0 1.0 1.00 0831 Community Relations Spec. 1.0 1.0 1.0 1.00 0966 Asst. Supervisor Tel. Info 1.0 1.0 1.0 1.00 1085 Business Analyst 1.0 1.0 1.0 1.0026 1061 Supervisor Marketing 1.0 1.0 1.0 1.00 1184 Suv. Telephone Info Ctr 1.0 1.0 1.0 1.00 1246 Supv Customer Serv Center 1.0 1.0 1.0 1.0027 0859 Sales Mgr/Sales Director 1.0 1.0 1.0 1.0028 1144 Manager Media Relations 0.0 1.0 1.0 1.0030 0784 Director 1.0 1.0 0.0 3.0031 0784 Executive Director 0.0 0.0 1.0 11.00
Total 27.5 29.0 29.0 29.0
Executive Division
222 FY2016
Mission Statement The mission of the Information Technology Department is to partner with all internal divisions to enhance the efficiency and reliability of GCRTA’s services to its employees and ridership through innovative, quality technology solutions.
2016 OPERATING BUDGET SUMMARY
Department 61 – Information Technology PETER ANDERSON, EXECUTIVE DIRECTOR – CIO During 2015, following the expansion and reorganization of the Information Technology Department and its move to the Executive Division, most of the recently approved additional positions have been filled and IT keeps expanding its services. These new hires have made it possible for IT to enhance the support it can provide to the departments, from direct customer support to more systems improvements behind the scenes and enabling better use of current IT systems. The Strategic Plan and IT Steering Committee efforts have improved our focus on the most critical items and has enhanced our communications to the departments about changes. Department Priorities for 2016
Complete the replace phone system Continue with the upgrades to the GCRTA network infrastructure Complete the enhancement of data storage capacity for numerous projects Roll-out the GroupWise expansion project to provide email accounts to the entire
employee base for improved communications Complete a pilot for the Virtual Desktop Upgrade Implement SQL server upgrade and Citrix farm replacement Initiate and complete first phase of IT Security project (funding in 2016) Implement the Service Desk Incident Management System Identify funding and complete the TransitMaster NextConnect Upgrade Complete Trapeze module upgrades Create Service and Operating Level Agreements Document Incident Management Processes and COOP for IT Educate IT and End User customer base on ITIL methodologies and best practices Create, Document and publish a minimum of five core service management metrics Improve processes related to planning, procurement, implementation, and support of
IT technologies. Continue to reduce the number of personal printers in private offices Reduce the number of networked printers by 33% Complete Phase 1 of the Mobile Device Management Project
2015 Highlights:
Hired a Database Administrator, a two Senior Application Analysts, an Application Analyst and a User Support Analyst, to answer the Help Desk phones and provide End User Support
Completed the replacement of the remaining 50 six+ year old Multi-Function Printers with new MFP's, which significantly improved the high volume printing environment and significantly lowered overall printing costs
Provided revisions to IT portions of the Code changes for GCRTA as they relate to the IT Department
Executive Division
223 FY2016
Continue to collaborate on the Report Writer software replacement project-nearly completed Actively engaged with Finance in the project to design and build a new process to manage
records retention, with only two departments remaining Researched, evaluated and installed various patches in support of business and operational
applications Assisted with implementation of Purchasing application and associated business process
improvement-nearly complete Deployed 161 new desktop PC's across the Authority Deployed 69 new laptops across the Authority Designed, Implemented, and Maintained Servers and Network Infrastructure to support
Major System Implementations and Upgrades Planning a project to address the results of the DHS/TSA cybersecurity Evaluation Completed Multiple IT Audits with agencies from Ohio AoS, to the American Public Transit
Association Completed Teammate software upgrade for Internal Audit Completed first phase of latest TransitMaster software upgrade Replaced all Windows XP machines Conducted monthly IT Steering Committee meetings
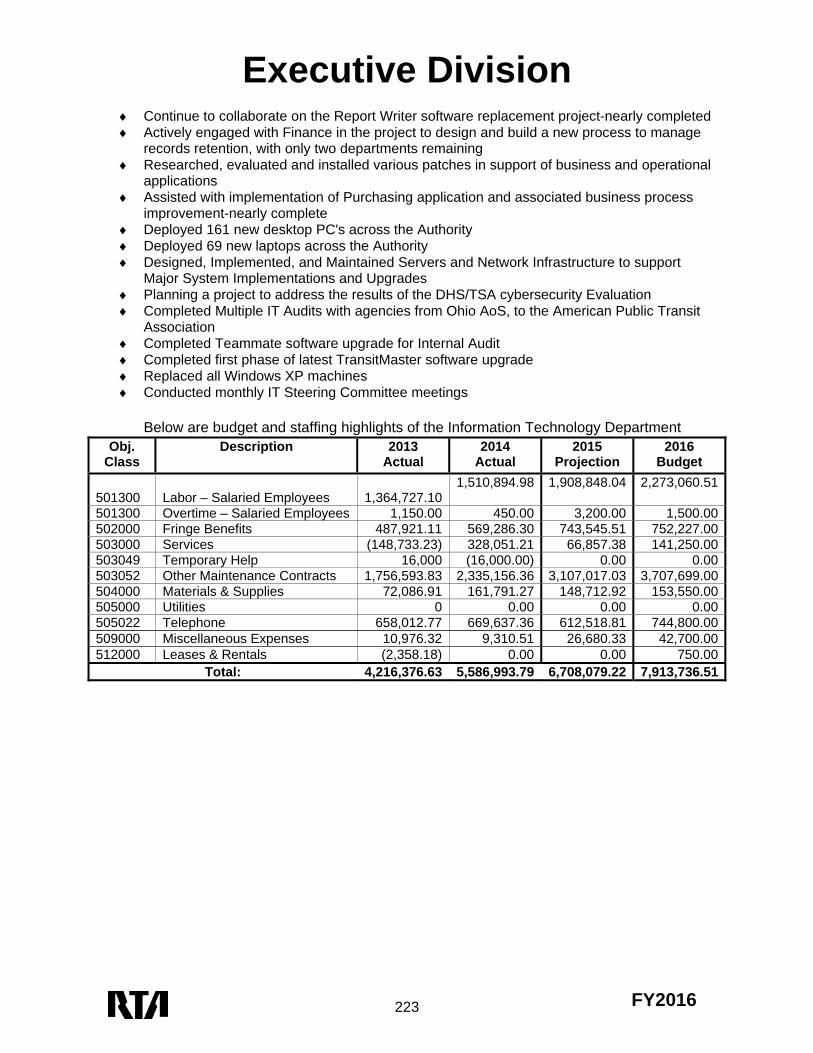
Below are budget and staffing highlights of the Information Technology Department
Obj. Class
Description 2013 Actual
2014 Actual
2015 Projection
2016 Budget
501300
Labor – Salaried Employees
1,364,727.10
1,510,894.98 1,908,848.04 2,273,060.51
501300 Overtime – Salaried Employees 1,150.00 450.00 3,200.00 1,500.00 502000 Fringe Benefits 487,921.11 569,286.30 743,545.51 752,227.00 503000 Services (148,733.23) 328,051.21 66,857.38 141,250.00 503049 Temporary Help 16,000 (16,000.00) 0.00 0.00 503052 Other Maintenance Contracts 1,756,593.83 2,335,156.36 3,107,017.03 3,707,699.00 504000 Materials & Supplies 72,086.91 161,791.27 148,712.92 153,550.00 505000 Utilities 0 0.00 0.00 0.00 505022 Telephone 658,012.77 669,637.36 612,518.81 744,800.00 509000 Miscellaneous Expenses 10,976.32 9,310.51 26,680.33 42,700.00 512000 Leases & Rentals (2,358.18) 0.00 0.00 750.00
Total: 4,216,376.63 5,586,993.79 6,708,079.22 7,913,736.51
Executive Division
224 FY2016
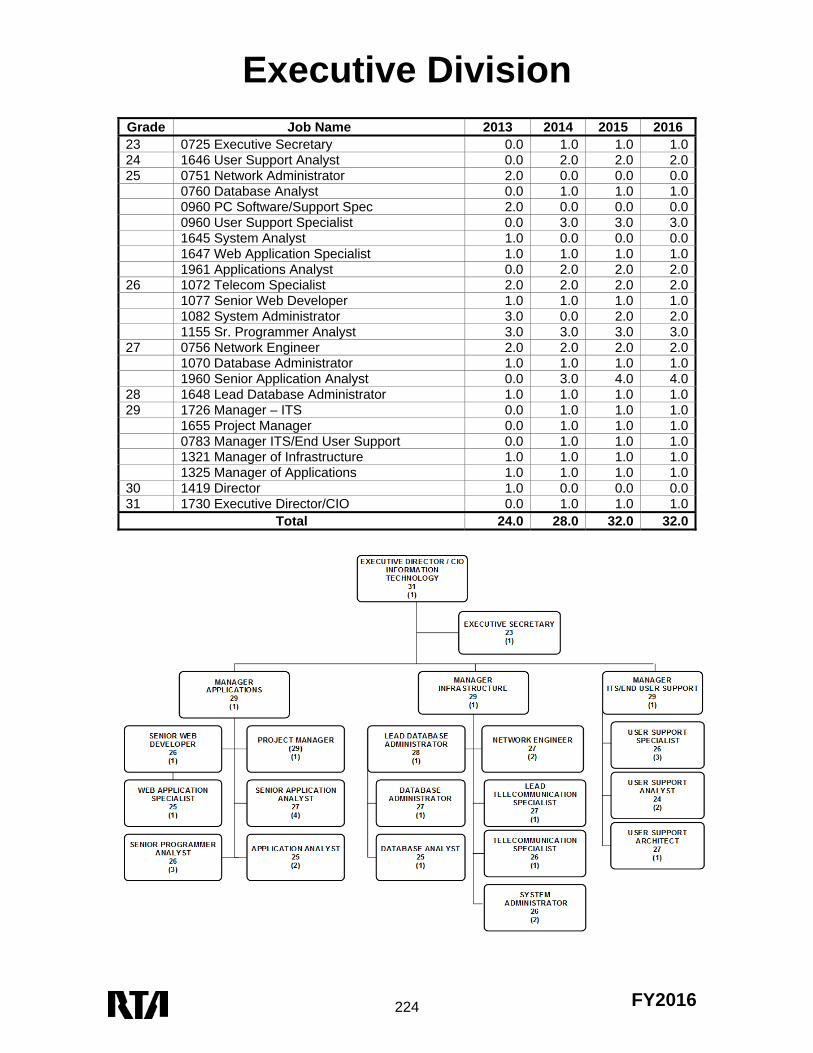
Grade Job Name 2013 2014 2015 2016 23 0725 Executive Secretary 0.0 1.0 1.0 1.024 1646 User Support Analyst 0.0 2.0 2.0 2.025 0751 Network Administrator 2.0 0.0 0.0 0.0 0760 Database Analyst 0.0 1.0 1.0 1.0 0960 PC Software/Support Spec 2.0 0.0 0.0 0.0 0960 User Support Specialist 0.0 3.0 3.0 3.0 1645 System Analyst 1.0 0.0 0.0 0.0 1647 Web Application Specialist 1.0 1.0 1.0 1.0 1961 Applications Analyst 0.0 2.0 2.0 2.026 1072 Telecom Specialist 2.0 2.0 2.0 2.0 1077 Senior Web Developer 1.0 1.0 1.0 1.0 1082 System Administrator 3.0 0.0 2.0 2.0 1155 Sr. Programmer Analyst 3.0 3.0 3.0 3.027 0756 Network Engineer 2.0 2.0 2.0 2.0 1070 Database Administrator 1.0 1.0 1.0 1.0 1960 Senior Application Analyst 0.0 3.0 4.0 4.028 1648 Lead Database Administrator 1.0 1.0 1.0 1.029 1726 Manager – ITS 0.0 1.0 1.0 1.0 1655 Project Manager 0.0 1.0 1.0 1.0 0783 Manager ITS/End User Support 0.0 1.0 1.0 1.0 1321 Manager of Infrastructure 1.0 1.0 1.0 1.0 1325 Manager of Applications 1.0 1.0 1.0 1.030 1419 Director 1.0 0.0 0.0 0.031 1730 Executive Director/CIO 0.0 1.0 1.0 1.0
Total 24.0 28.0 32.0 32.0
Executive Division
225 FY2016
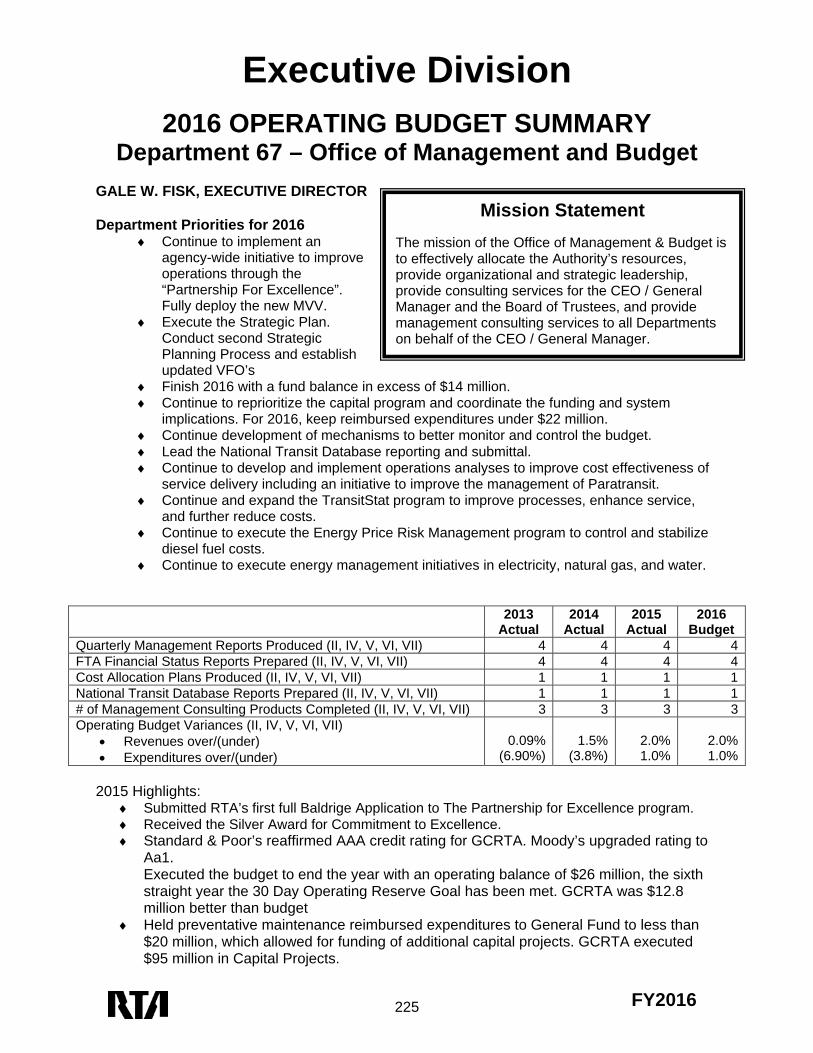
Mission Statement The mission of the Office of Management & Budget is to effectively allocate the Authority’s resources, provide organizational and strategic leadership, provide consulting services for the CEO / General Manager and the Board of Trustees, and provide management consulting services to all Departments on behalf of the CEO / General Manager.
2016 OPERATING BUDGET SUMMARY
Department 67 – Office of Management and Budget GALE W. FISK, EXECUTIVE DIRECTOR Department Priorities for 2016
Continue to implement an agency-wide initiative to improve operations through the “Partnership For Excellence”. Fully deploy the new MVV.
Execute the Strategic Plan. Conduct second Strategic Planning Process and establish updated VFO’s
Finish 2016 with a fund balance in excess of $14 million. Continue to reprioritize the capital program and coordinate the funding and system
implications. For 2016, keep reimbursed expenditures under $22 million. Continue development of mechanisms to better monitor and control the budget. Lead the National Transit Database reporting and submittal. Continue to develop and implement operations analyses to improve cost effectiveness of
service delivery including an initiative to improve the management of Paratransit. Continue and expand the TransitStat program to improve processes, enhance service,
and further reduce costs. Continue to execute the Energy Price Risk Management program to control and stabilize
diesel fuel costs. Continue to execute energy management initiatives in electricity, natural gas, and water.
2013
Actual 2014
Actual 2015
Actual 2016
Budget Quarterly Management Reports Produced (II, IV, V, VI, VII) 4 4 4 4FTA Financial Status Reports Prepared (II, IV, V, VI, VII) 4 4 4 4Cost Allocation Plans Produced (II, IV, V, VI, VII) 1 1 1 1National Transit Database Reports Prepared (II, IV, V, VI, VII) 1 1 1 1# of Management Consulting Products Completed (II, IV, V, VI, VII) 3 3 3 3Operating Budget Variances (II, IV, V, VI, VII)
Revenues over/(under) Expenditures over/(under)
0.09%(6.90%)
1.5%
(3.8%) 2.0%1.0%
2.0%1.0%
2015 Highlights:
Submitted RTA’s first full Baldrige Application to The Partnership for Excellence program. Received the Silver Award for Commitment to Excellence. Standard & Poor’s reaffirmed AAA credit rating for GCRTA. Moody’s upgraded rating to
Aa1. Executed the budget to end the year with an operating balance of $26 million, the sixth straight year the 30 Day Operating Reserve Goal has been met. GCRTA was $12.8 million better than budget
Held preventative maintenance reimbursed expenditures to General Fund to less than $20 million, which allowed for funding of additional capital projects. GCRTA executed $95 million in Capital Projects.
Executive Division
226 FY2016
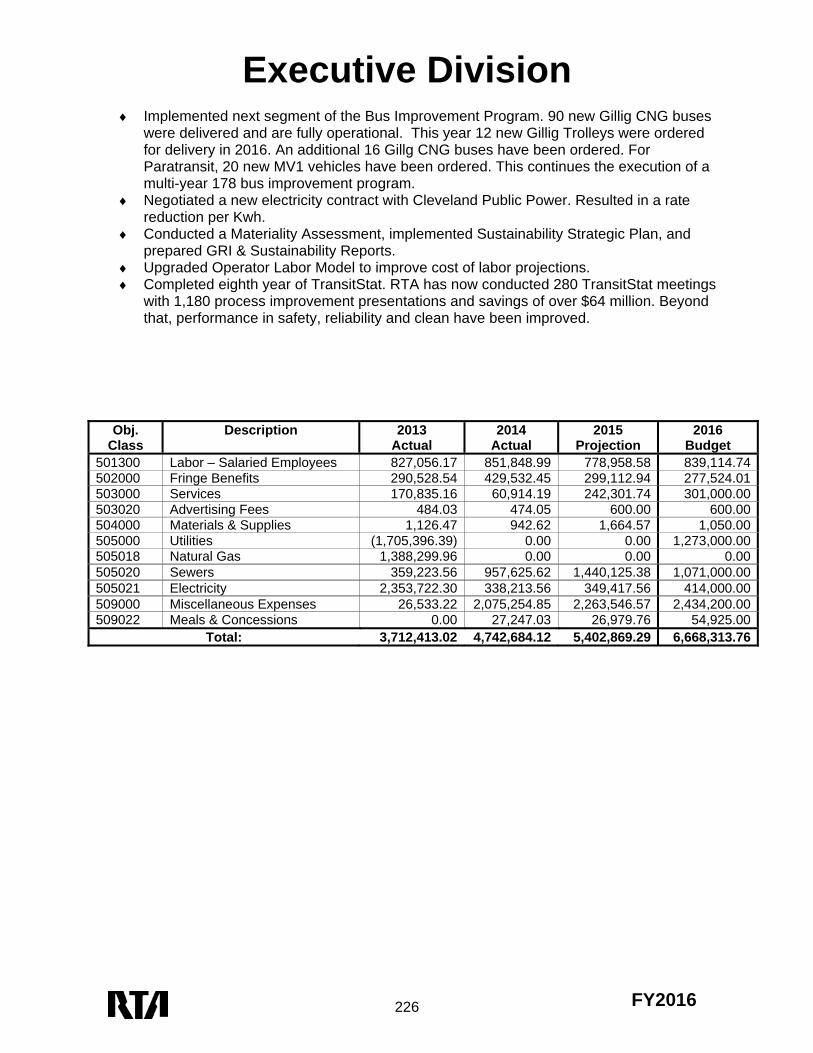
Implemented next segment of the Bus Improvement Program. 90 new Gillig CNG buses were delivered and are fully operational. This year 12 new Gillig Trolleys were ordered for delivery in 2016. An additional 16 Gillg CNG buses have been ordered. For Paratransit, 20 new MV1 vehicles have been ordered. This continues the execution of a multi-year 178 bus improvement program.
Negotiated a new electricity contract with Cleveland Public Power. Resulted in a rate reduction per Kwh.
Conducted a Materiality Assessment, implemented Sustainability Strategic Plan, and prepared GRI & Sustainability Reports.
Upgraded Operator Labor Model to improve cost of labor projections. Completed eighth year of TransitStat. RTA has now conducted 280 TransitStat meetings
with 1,180 process improvement presentations and savings of over $64 million. Beyond that, performance in safety, reliability and clean have been improved.
Obj. Class
Description 2013 Actual
2014 Actual
2015 Projection
2016 Budget
501300 Labor – Salaried Employees 827,056.17 851,848.99 778,958.58 839,114.74 502000 Fringe Benefits 290,528.54 429,532.45 299,112.94 277,524.01 503000 Services 170,835.16 60,914.19 242,301.74 301,000.00 503020 Advertising Fees 484.03 474.05 600.00 600.00 504000 Materials & Supplies 1,126.47 942.62 1,664.57 1,050.00 505000 Utilities (1,705,396.39) 0.00 0.00 1,273,000.00 505018 Natural Gas 1,388,299.96 0.00 0.00 0.00 505020 Sewers 359,223.56 957,625.62 1,440,125.38 1,071,000.00 505021 Electricity 2,353,722.30 338,213.56 349,417.56 414,000.00 509000 Miscellaneous Expenses 26,533.22 2,075,254.85 2,263,546.57 2,434,200.00 509022 Meals & Concessions 0.00 27,247.03 26,979.76 54,925.00
Total: 3,712,413.02 4,742,684.12 5,402,869.29 6,668,313.76
Executive Division
227 FY2016
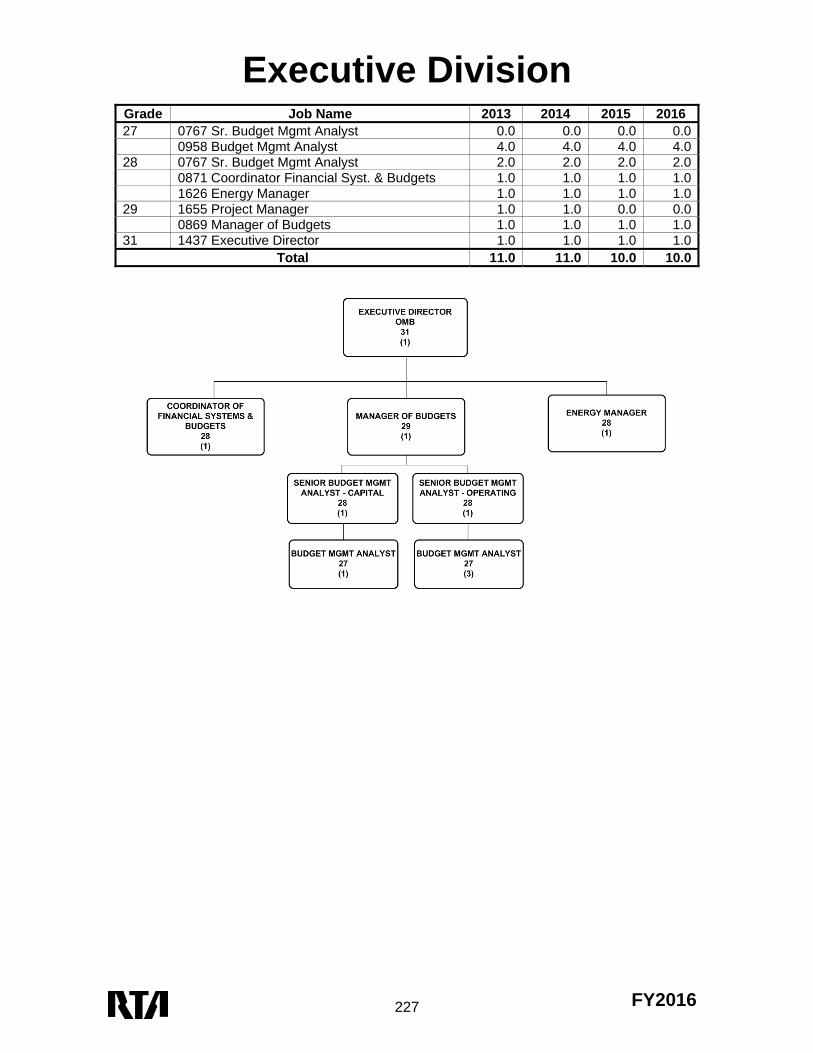
Grade Job Name 2013 2014 2015 2016 27 0767 Sr. Budget Mgmt Analyst 0.0 0.0 0.0 0.0 0958 Budget Mgmt Analyst 4.0 4.0 4.0 4.028 0767 Sr. Budget Mgmt Analyst 2.0 2.0 2.0 2.0 0871 Coordinator Financial Syst. & Budgets 1.0 1.0 1.0 1.0 1626 Energy Manager 1.0 1.0 1.0 1.029 1655 Project Manager 1.0 1.0 0.0 0.0 0869 Manager of Budgets 1.0 1.0 1.0 1.031 1437 Executive Director 1.0 1.0 1.0 1.0
Total 11.0 11.0 10.0 10.0
Executive Division
228 FY2016
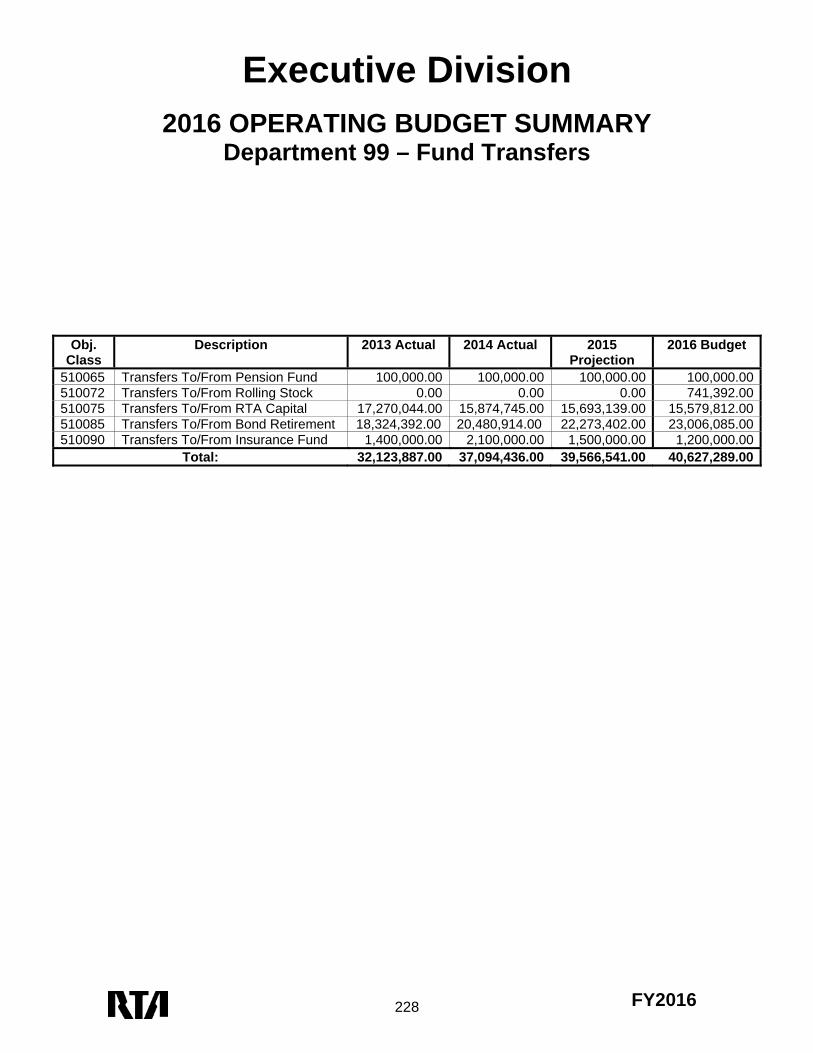
2016 OPERATING BUDGET SUMMARY
Department 99 – Fund Transfers
Obj. Class
Description 2013 Actual 2014 Actual 2015 Projection
2016 Budget
510065 Transfers To/From Pension Fund 100,000.00 100,000.00 100,000.00 100,000.00510072 Transfers To/From Rolling Stock 0.00 0.00 0.00 741,392.00510075 Transfers To/From RTA Capital 17,270,044.00 15,874,745.00 15,693,139.00 15,579,812.00510085 Transfers To/From Bond Retirement 18,324,392.00 20,480,914.00 22,273,402.00 23,006,085.00510090 Transfers To/From Insurance Fund 1,400,000.00 2,100,000.00 1,500,000.00 1,200,000.00
Total: 32,123,887.00 37,094,436.00 39,566,541.00 40,627,289.00


