Download - Evaluating the Potential of Using Passive RFID Technology as a Real Time Location Tracking

Evaluating the Potential of Using Passive RFID Technology as a Real Time Location Tracking System to Assist an Individual with a Visual
Impairment
A Thesis Presented to The Faculty of
California Polytechnic State University, San Luis Obispo
In Partial Fulfillment Of the Requirements for the Degree
Master of Science in Biomedical Engineering By
Zachary Lim Tiulentino August 2011

ii
© 2011 Zachary Lim Tiulentino
ALL RIGHTS RESERVED

iii
COMMITTEE MEMBERSHIP
TITLE: Evaluating the Potential of Using Passive RFID Technology as a Real Time Location Tracking System to Assist an Individual with a Visual Impairment AUTHOR: Zachary Lim Tiulentino DATE SUBMITTED: August 2011 COMMITTEE CHAIR: Dr. Lily Laiho COMMITTEE MEMBER: Dr. Scott Hazelwood COMMITTEE MEMBER: Dr. J. Kevin Taylor
iv
ABSTRACT
Evaluating the Potential of Using Passive RFID Technology as a Real Time Location Tracking System to Assist an Individual with a Visual Impairment
Zachary Lim Tiulentino
This study evaluated the potential of using Passive Radiofrequency Identification [RFID]
Technology as basis for a Real Time Location Tracking System [RTLTS] to assist an individual with
a visual impairment participating in physical activities, such as basketball. While RTLTSs exist
based upon other technologies, Passive RFID Technology had yet to be examined for its
potential in such an application. In this study, a system was designed and modified, for Passive
RFID Technology, in order to enhance the performance of the RTLTS. More specifically, the first
iteration of the software code employed the use of multiple RFID antennas to cooperatively
designate unique zones, which allowed for the identification of a user’s general position. A
series of tests were then conducted to assess the system’s accuracy. In addition, it was
determined whether or not factors, such as the addition of multiple tags identifying an object,
change in the attenuation level and height level of the antenna, or the position of the tag, had a
significant effect on the accuracy of the system. This study showed that the system’s greatest
accuracy was obtained when six distinct Passive RFID tags were used to identify the object and
when the antenna had a direct line of sight to the tags. Results also showed that these read
accuracy rates were indeed comparable to other technologies. Therefore, there exists optimism
in using Passive RFID technology as a basis for a RTLTS to assist an individual with a visual
impairment.
Keywords: Visual Impairment, Blindness, Passive, RFID, Real Time Location Tracking System

v
Acknowledgements
First and foremost, I would like to extend a special thanks to each faculty member of
the Biomedical and General Engineering Department at California Polytechnic State
University, San Luis Obispo. Over the past two years, I have been blessed with the
opportunity to learn from each faculty member’s expertise in the field of Biomedical
Engineering. These lessons learned have been able to provide me with the technical
training and access to hands on laboratory and manufacturing experiences which will
allow me to excel in my professional career. However, more importantly, I was also able
to establish a special bond, with each individual, which shall never be forgotten.
I would also like to take a moment to express my sincere gratitude to my fellow
committee members: Dr. Lily Laiho, Dr. Kevin Taylor, and Dr. Scott Hazelwood. Since
my first day at this fine institution, Dr. Lily Laiho has shown me great support and
enthusiasm for all that I have accomplished. It is through her substantial passion, in
providing assistance for each of her students, which has provided me with the
motivation necessary in making progress throughout my Thesis. Without her exuberant
feedback, I am uncertain where I would be today in my educational career. Thus, I will
be forever grateful.
Without Dr. Kevin Taylor, this thesis would not even be in existence today. Through
his creative teaching technique, he sought for his students to propose different means
of assisting an individual, with a visual impairment, in different physical activities. The
idea to assist an individual, with a visual impairment, in the sport of basketball with a
Real Time Location Tracking System came through this specific educational activity. Not

vi
only did Dr. Taylor continue to support my thoughts and ideas about the proposal, but
he took the initiative to connect me with several important contacts. These contacts
became essential in obtaining the essential feedback that allowed for the Thesis to
advance to a different level of excellence.
While I would like to thank Dr. Scott Hazelwood for being a part of the Committee,
he was more than just a member of the panel. Whether I had a question regarding
coursework or just needed to talk about different sporting activities, Dr. Hazelwood
would always welcome me into his office. Also, it was an honor for me to be one of Dr.
Hazelwood’s Instructional Student Assistants for his Biomechanics course.
I want to express my gratitude towards Dr. Tali Freed from the Industrial and
Manufacturing Engineering Department. With a limited budget for this study, Dr. Freed
was able to assist me by providing all the necessary Passive RFID equipment that was
necessary to conduct the proper experimental tests. In addition, she was able to
provide substantial knowledge about RFID technology that aided me through this study.
Yashar Bahman, Tyler Peabody, and Mike Putnam deserve to be congratulated for
their extraordinary efforts in helping me complete this Thesis. These three fine
gentlemen were each able to take a substantial amount of their time in being able to
assist me in designing and debugging the optimal software code that could be used for a
RTLTS system with Passive RFID Technology. With their assistance, hours of
frustration in front of a computer were averted for me. Therefore, I would like to
extend my gratitude to each and every one of them.

vii
I would like to thank all my family and friends for all the support they have given me
throughout my educational career. My parents, Juanito C. Tiulentino and Ellyn Lim
Tiulentino, have been the primary reason for where I am today in life as they have
continuously motivated me to continue to be the best that I could be. Also, my sisters,
Janelle Tiulentino and Siobhan Tiulentino, have always been there for me whenever I
needed them and I am grateful for that. Lastly, I would like to thank my best friend,
Steve Johnson, for standing behind me throughout the ups and downs the last several
years. Without my family and friends, it would have been a lot more difficult in
accomplishing all that I have throughout my life. So, once again, thank you all!

viii
Table of Contents
Table of Figures……………………………………………………………………………………………….xi Table of Tables……………………………………………………………………………………………….xii Chapter I: Introduction and Background…………………………………………………………1 Section 1: Basic Ocular Anatomy and Physiology……………………………………………………..2 Section 2: Process of Image Information………………………………………………………………….7 Section 3: Classifications of Low Vision………….………………………………………………………..9 Section 4: Causes of Low Vision…………..………………………………………………………………..13 Section 5: Adapted Physical Activity for Individuals with Visual Impairment…….……16 Section 6: Technologies Available for Basis of Real Time Location Tracking System………………………………………………………………………………….20 Section 7: Radiofrequency Identification *RFID+ Systems……………………………………….23 Section 8: Passive RFID versus Active RFID…………………………………………………………….24 Section 9: Product Specifications and Features of Passive RFID Tags……………………..27 Section 10: Application of Passive RFID Systems……………………………………………………32 Section 11: Mathematical Algorithm to Compute Real Time Location of Object…….36 Section 12: Purpose of Study………………………………………………………………………………...43
Chapter II: Design Development and Feasibility Test……………………………………..46 Section 1: Designing and Manufacturing Passive RFID Antenna Placeholder Stand for Feasibility Testing…………………………………………………………………..46 Section 2: Conducting Feasibility Test…………..……………………………………………………….50 Section 3: Test of the Range of How Far the Passive Antenna is Able to Read a Designated Tag.…………………………………………………………………………53 Section 4: Test of the Presence of the Vast Array of Passive RFID Tags within the Testing Environment………………………………………………….............54 Section 5: Test the Number of Times a Passive RFID tag is Read Through Different Activities………………………………………………………………………………..55 Section 6: Construction of Cubic Testing Structure………………………………………………..55 Section 7: Evaluating Software Program Provided by Tyler Peabody……………….…….58 Section 8: Initial Evaluation of Tyler Peabody’s Software Code..…………………………….59 Section 9: Evaluating Performance of Tracking RFID Passive Tag with Software Code Provided by Tyler Peabody……………………………………………68
Chapter III: Modifications to Computer Software Program…………………………….74 Section 1: Modifications for Ease of Operability of System…..……………………………….74 Section 2: Modifications for Delay of Visual Representation in Microsoft Access Interface………………………….………………………………………………………..76 Section 3: Modifications to Enhance Performance of RFID Real Time Location Tracking System…………..…………………………………………………………81
Chapter IV: Evaluation of Modifications to Computer Software Program……………………………………………………………………………………..84 Section 1: Evaluating the Performance of Tracking One Singular Object [with one Passive RFID tag]…..……………………………………………………………….84

ix
Section 2: Evaluating the Performance of Tracking Two Objects Simultaneously [with one Passive RFID tag each]………………………….……..86 Section 3: Evaluating the Performance of Tracking One Singular Object with Multiple RFID Passive Tags …………..………………………………………………87
Chapter V: Results….……………………………………………………………………………………..88 Section 1: Feasibility Test with RFID System Components….………………………………….88 Section 2: Test of Range of How Far the Antenna is Able to Read a Passive RFID Tag………………………….…………………………………………………………………………...91 Section 3: Test of the Presence of the Vast Array of Passive RFID Tags within the Testing Environment………………………………………………….............93 Section 4: Test the Number of Times a Passive RFID tag is Read Through Different Activities………………………………………………………………………………..95 Section 5: Evaluating Performance of Tracking Passive RFID Tag with Software Code Provided by Tyler Peabody……………….………………………….100 Section 6: Evaluating the Performance of Tracking One Singular Object [with one Passive RFID tag]…..…………………………………………………………….103 Section 7: Evaluating the Performance of Tracking One Singular Object with Multiple RFID Passive Tags …………..……………………………………………..105 Section 8: Statistical Analysis on Real Time Location Tracking System………………….111
Chapter VI: Conclusion…………………………………………………………………………………132 Section 1: Interpretation of Statistical Analysis……………………………………………………133 Section 2: Discussion of Results…………………………………………………………………………..136 Section 3: Comparison to Other Real Time Location Tracking Systems………………..140 Section 4: Limitations.…………………………………………………………………………………………142 Section 5: Future Work…….…………………………………………………………………………………144
Appendix A: SolidWorks Design and Construction of Passive RFID Placeholder Stand ………………………………………………………………………………….148 Appendix B: Visual Representation of Conducting Feasibility Test………………..152 Appendix C: Visual Representation of Protocol for Testing Read Range of Poynting Antenna…………………………………………………………………………………….156 Appendix D: Visual Representation of Protocol for Testing Readability of Passive RFID Tags within Testing Environment…………………………………………158 Appendix E: Testing the Number of Times a Passive RFID tag is read through different activities…………………………………………………………………………………...159 Appendix F: Directionality in Testing Cubic Structure…………………………………..161 Appendix G: Height Change in Antenna……………………………………………………….164 Appendix H: Testing Protocol for Original Software Code [by Mr. Tyler Peabody] and Modified Software Code…………………………………………………….165 Appendix I: Directionality with Passive RFID Antenna Placeholder Stand…….168 Appendix J: Guide to New Modifications in Visual Display Seen in Microsoft Access 2007………………………………………………………………………….170

x
Appendix K: Results for Read Accuracy Rate for Original Software Code…………………………………………………………………………………………………………172 Appendix L: Results for Read Accuracy Rate for Modified Software Code [with one Passive RFID tag]………………………………………………………………………177 Appendix M: Results for Read Accuracy Rate for Modified Software Code [with two Passive RFID tag]………………………………………………………………………182 Appendix N: Results for Read Accuracy Rate for Modified Software Code [with three Passive RFID tag]……………………………………………………………………187 Appendix O: Results for Read Accuracy Rate for Modified Software Code [with four Passive RFID tag]……………………………………………………………………..192 Appendix P: Results for Read Accuracy Rate for Modified Software Code [with six Passive RFID tag]………………………………………………………………………..197 Appendix Q: Statistical Analysis Results From Minitab………………………………..202 Appendix R: Test Regarding Feasibility of Reading Multiple Objects with Modified Software Code Used in Visual Basic…………………………………………..206 Appendix S: Modified Software Code Used in Visual Basic…………………………..211 Appendix T: References……………………………………………………………………………….217

xi
Table of Figures Figure 1: Ocular Anatomy………………………………………………………………………………………………2 Figure 2: Pathway of Image Formation in the Eye………………………………………………………….7 Figure 3: Eye Chart………………………………………………………………………………………………………10 Figure 4: Normal Vision……………………………………………………………………………………………….11 Figure 5: Low Vision…………………………………………………………………………………………………….11 Figure 6: Legal Blindness……………………………………………………………………………………………..12 Figure 7: Ishihara Color Blindness Test………………………………………………………………………..12 Figure 8: RFID System Pathway……………………………………………………………………………………23 Figure 9: Avery Dennison 224 Tag Inlay……………………………………………………………………….28 Figure 10: Avery Dennison 230 Tag Inlay……………………………………………………………………..29 Figure 11: Sirit RSI 616 Tag Inlay………………………………………………………………………………….30 Figure 12: Sirit RSI 655 Tag Inlay………………………………………………………………………………….31 Figure 13: Automobile Toll Booth with RFID System……………………………………………………32 Figure 14: RFID Used to Track Livestock………………………………………………………………………33 Figure 15: Equation for Measuring Euclidean Distance………………………………………………..42 Figure 16: RFID Portal Reader……………………………………………………………………………………..44 Figure 17: SolidWorks Design of Passive RFID Antenna Placeholder Stand………………….49 Figure 18: Design of Passive RFID Antenna Placeholder Stand…………………………………….50 Figure 19: Infinity 510 Home Screen……………………………………………………………………………51 Figure 20: Infinity 510 Tag Database Summary Display……………………………………………….52 Figure 21: Visual Schematic of How Tyler Peabody’s Software Code Functions…………..63 Figure 22: Graphical Summary of the Location of Tracked Object in
Microsoft Access 2007………………………………………………………………………………64 Figure 23: Regional Zones of Environmental Setting…………………………………………………..67 Figure 24: Creation of Zone 1 and Zone 2 for the Environmental Setting of System…….71 Figure 25: Angle Measurement for Poynting Antenna………………………………………………..91 Figure 26: Placement of Antennas for Testing Environment………………………………………103 Figure 27: Statistical Summary [Case 0 and Height Level 1+……………………………………….114 Figure 28: Statistical Summary [Case 1 and Height Level 1+……………………………………….115 Figure 29: Statistical Summary *Case 2 and Height Level 1+……………………………………….116 Figure 30: Statistical Summary [Case 3 and Height Level 1+……………………………………….117 Figure 31: Statistical Summary [Case 4 and Height Level 1+……………………………………….118 Figure 32: Statistical Summary [Case 6 and Height Level 1+……………………………………….119 Figure 33: Test for Equal Variances for Objects Read *Case Number+…………………………127 Figure 34: Test for Equal Variances for Objects Read [Attenuation Level+………………….128 Figure 35: Test for Equal Variances for Objects Read *Case Number+…………………………129 Figure 36: Test for Equal Variances for Objects Read *Height Level+………………………….130 Figure 37: Normal Probability Plot (Anderson Darling Test)………………………………………131

xii
Table of Tables Table 1: System Characteristic of Passive RFID versus Active RFID System…………………..26 Table 2: Commands within Microsoft Access 2007………………………………………………………61 Table 3: Feasibility Test for Time Interval of 5 Seconds………………………………………………..88 Table 4: Feasibility Test for Time Interval of 15 Seconds………………………………………………89 Table 5: Feasibility Test for Time Interval of 30 Seconds………………………………………………89 Table 6: Feasibility Test for Time Interval of 60 Seconds……………………………………………..89 Table 7: Measured Read Distance at Various Attenuation Levels………………………………..92 Table 8: Summarized Table of Number of Tags Read Within Testing Environment Under Different Attenuation Levels………………………………………….94 Table 9: Number of Times Passive RFID Tag is Read for Activity #1 – Test Subject Walks, within Environmental Setting, with Passive RFID Tag………………………….96 Table 10: Number of Times Passive RFID Tag is Read for Activity #2 - Test Subject Jogs, within Environmental Setting, with Passive RFID Tag ………………………….96 Table 11: Number of Times Passive RFID Tag is Read for Activity #3 - Test Subject Walks, within Environmental Setting, with Passive RFID Tag inside Nerf Ball………………………………………………………………………………………………………………97 Table 12: Number of Times Passive RFID Tag is Read for Activity #4 - Test Subject Jogs, within Environmental Setting, with Passive RFID Tag inside Nerf Ball….97 Table 13: Number of Times Passive RFID Tag is Read for Activity #5 - Test Subjects Roll Nerf Ball, with Passive RFID Tag inside, Back and Forth within Environmental Setting………………………………………………………………………………….98 Table 14: Number of Times Passive RFID Tag is Read for Activity #6 - Test Subjects Throws Nerf Ball, with Passive RFID Tag inside, Back and Forth within Environmental Setting…………………………………………………………………………………99 Table 15: Accuracy of Real Time Tracking Location System for Original Software Code……………………………………………………………………………………………101 Table 16: Accuracy of Real Time Tracking Location System for Modified Software Code *1 Passive RFID Tag+……………………………………………………………104 Table 17: Accuracy of Real Time Tracking Location System for Modified Software Code *2 Passive RFID Tags+ ………………………………………………………….106 Table 18: Accuracy of Real Time Tracking Location System for Modified Software Code *3 Passive RFID Tags+ …………………………………………………………107 Table 19: Accuracy of Real Time Tracking Location System for Modified Software Code [4 Passive RFID Tags]…………………………………………………………..108 Table 20: Accuracy of Real Time Tracking Location System for Modified Software Code [6 Passive RFID Tags+…………………………………………………………..109 Table 21: Comparison of Accuracy Rates of Various Real Time Tracking Location Systems………………………………………………………………………………………..141

1
CHAPTER 1: INTRODUCTION AND BACKGROUND
The purpose of the study was to evaluate the potential of using Passive
Radiofrequency Identification [RFID] Technology as a basis for a Real Time Location
Tracking System [RTLTS] to assist an individual with a visual impairment. Other
technologies, such as Global Positioning System [GPS], Infrared, and Ultra Wide Band,
have been widely considered for the application of RTLTS. Therefore, background
research was first conducted on these different technologies to gain an understanding
of not only how each was able to function in such a capacity, but to analyze the
advantages and disadvantages of each. While there has yet to be an ideal technology
for the use of RTLTS to assist an individual with a visual impairment, it should be noted
that RFID has been often overlooked as a potential candidate for such an application.
However, in this specific chapter, investigative research was conducted to not only gain
familiarity with the components and current application of the RFID technology but also
to learn how such a technology could potentially be used within a RTLTS.
While this chapter was focused extensively upon the potential of using RFID for an
RTLTS, emphasis was also placed upon the importance of such a study. It should be
recognized that nearly 150 million individuals, throughout the world, have been
classified to have a form of visual impairment. Therefore, this chapter also investigated
the basic ocular anatomy and physiology of an individual, the causes of the most
prevalent visual impairments, as well as the limitations that hinder physical activity for
individuals with a visual impairment.

2
Section 1: Basic Ocular Anatomy and Physiology
The eye is a complex anatomical structure that is referred to as one of the most
sensitive and delicate organs within an individual’s body. The human eye has the
unique functional ability of refracting light sources and then producing a focused image
that can stimulate neural responses within the human brain [1]. Therefore, such an
anatomical component is of importance as it enables an individual with the ability to see
all visual images. While this specific organ is quite small in physical size, the human eye
still has an array of important regions, which include the following: the cornea, sclera,
aqueous humor, vitreous humor, iris, lens, and the retina [See Figure 1]. It needs to be
understood that each component of this anatomy has a prominent role in the human
eye’s complex function.
Figure 1: Ocular Anatomy [1]

3
Cornea
The cornea is a transparent, dome-shaped structure that could be found within the
anterior region of the human eye. As the outermost component of the eye, the primary
purpose of the cornea is to serve as a protective shield to protect the rest of the organ.
For instance, the cornea may prevent the entrance of any germs, dust, or any other
harm matter into the ocular [1]. However, the cornea also acts as the human eye’s
outermost lens. In essence, the cornea is a structure that is held responsible for
controlling the amount of light source entering the human eye, and then refracting the
light source onto the lens region of the eye [2].
Nonetheless, in order to accomplish the function of being able to refract light onto
the lens, it is of great importance that the cornea has a transparent shade of color.
Therefore, unlike other tissues within the human body, the cornea is a component that
does not receive proper nourishment from blood vessels. Even if the cornea were to
receive a small amount of blood vessels as a source of nourishment, the presence of
these vessels would have a profound effect on the structure’s ability to refract light
source onto the lens and could ultimately distort the visual image seen by an individual.
Thus, the cornea is a structure that is supplied with oxygen and nutrients through the
tear-fluids from the tears films and the aqueous humor [2].

4
Sclera
The sclera, which is the white region on the exterior of the human eye, possesses
tough and rugged surface properties to sufficiently protect and provide the shape for
the organ [1]. More specifically, this component of the eye is the outer surface layer
that is protecting the more sensitive components of the inner region of the eye. Also,
the sclera functions as a component that ensures that light sources do not go anywhere
except through the transparent cornea. Thus, unlike the cornea, the sclera does not
have to be transparent. With this, nutrients and oxygen could indeed be provided
through blood vessels. These blood vessels are able to provide the proper nourishment
as they are minimally located on the episclera, which is a thin membrane layer located
right on top of the sclera [2].
Aqueous and Vitreous Humor
Within the human eye, there are two regions referred to as humors, or liquids,
which are primarily responsible for occupying the spaces between different structures
of the ocular [2]. The Aqueous Humor is said to fill, with liquid, the front region of the
human eye as it occupies the region behind the cornea and in front of the lens. In
regards to this specific humor, the fluid is produced at the back of the ciliary body and
then is secreted into the aqueous chamber through the ciliary processes [1]. This
function is of importance as the Aqueous Humor carries oxygen and other nutrients, to
the cornea and the lens, to provide those structures with the proper nutrients, and keep
the structure’s transparent color shade. In contrast, the Vitreous Humor is a liquid

5
region that is located behind the lens that is filled with a gelatinous substance that
places force upon the sclera to obtain the proper spherical shape of the human eye.
Iris and Pupil
The iris is the region of the human eye that many may refer to as the “eye color.”
The reason for the different “eye color” is that the iris is composed of pigmented
fibrovascular tissues, also referred to as stroma [1]. The stroma is not merely
responsible for differentiating the colors of the eye of each individual, but it plays a
prominent role in connecting constricting muscles and dilator muscle [sphincter and
dilator papillae] in order to control the size of the pupil [1]. With bright lights, the iris
sphincter muscles will have a tendency to contract the pupil to reduce the amount of
light coming in. In contrast, darkness will cause for the iris to have a tendency to open
the pupil using the dilator muscles to allow more light to come in. This function is
important as the contraction and expansion of the pupil ensures that appropriate
amount of light source is able to reach the retina [2].
Lens
Once the light source is able to get through the iris and the pupil, it will then be able
to reach the lens of the human eye, which maintains a transparent color shade.
Therefore, similar to the cornea, the lens is unable to receive the proper nutrients from
blood vessels, but rather receives nourishment from the Aqueous Humor. In regards to
the function of the lens, it is of importance to understand that the structure of lens is

6
attached to a mass of zonule fibers, which are then connected to the posterior region of
the ciliary epithelium. This structural arrangement plays a significant role in the
function of the lens as it enables the lens to changes its flexible structural shape [1]. The
adjustment of the shape of the lens will then allow for the image to be more in focus.
For instance, to focus on a near object, the posterior region of the ciliary epithelium
would contract which would result in the zonule fibers to loosen up. The result of such
an action will allow for the lens to change its’ shape in order contract in diameter and
also thickens to create an increase in acuity. Therefore, the lens plays a prominent role
in the vision process of the human eye.
Retina The retina is a component that is a light-sensitive layer located in the posterior
region of the human eye. Uniquely, this component of the ocular possesses specialized
cells, referred to as photoreceptors, which allows for the retina to detect the intensity
and frequency of the light entering the eye [1]. The two primary forms of
photoreceptors, within the retina, are the rods and the cones. In regards to the rods,
these photoreceptors are able to detect the intensity of light, and thus are more
sensitive to changes between light and dark, as well as shape change. In contrast, cones
have the tendency to detect frequency of light and have a prominent role in an
individual being able to see differences in color change and the fine detail of a visual
image. Nonetheless, even though the rods and cones have vastly different functions,

7
both photoreceptors have the ability to send nerve impulses to the brain by sending the
signals through the optic nerve, which is a network of nerve cells.
Section 2: Process of Image Formation
In being able to process the formation of a visual image onto the retina, each
component of the human eye must be able to function properly. In order to
comprehend the pathway of how a visual image is formed onto the retina, it is of ease
to analyze the diagram provided in Figure 2.
The pathway of the image formation begins at the moment in which scattered light
sources are able to reach a specified object [indicated by the red arrow pointed in the
upward direction]. Once the light source comes into contact with the object, it would
have the tendency to leave the surface of the object and is directed into vastly different
directions. Ultimately, the human eye will be able to collect a small proportion of the
Figure 2: Pathway of Image Formation [2]

8
light source, which was previously reflected by the object, and then begin a process of
trying to focus the visual image onto the retina.
Upon the arrival of the light source onto the human eye, it would first come into
contact with the curved region of the cornea. Due to the significant difference between
the refractive index between air and the liquid of the aqueous humor, the cornea has a
prominent role in being able to allow for limiting the amount of light source entering the
human eye, as well as also refracting approximately 80% of the light source onto the
lens [2].
While the cornea is primarily responsible for the refraction of the light source, the
lens is a component of the human eye that has a prominent role in the formation of a
focused and sharp image. In order to accomplish such a task, the lens has the ability to
undergo a process referred to as accommodation, which allows for the lens to change
its structure, shape, and also adjust the focal length to provide sharp and focused
images at close and distant ranges [2]. With the process of accommodation, the human
eye will be able to focus upon an object at close distance if the lens is able to become
thicker in shape. The thickness of the lens may only increase if the ciliary muscles are
able to contract, while the zonule fibers are relaxing. In contrast, the human eye will be
able to focus upon an object at a distant range if the lens is quite thinner, which results
from the ciliary muscles relaxing and the zonule fibers contracting.
After the light source travels through the cornea and the lens, it continues its path
through the vitreous humor before finally reaching the retina. With the functions of
both the cornea and the lens, an image is transmitted to the retina. However, the

9
image that is produced, within the retina, is an inverted image of the real object. Thus,
the pathway for the formation of a visual image does not conclude at this point in time.
Instead, the same light source is able to activate the two primary photoreceptors, which
are the rods and cones. These photoreceptors then send nerve impulses to the brain
by sending the signals through the optic nerve, which is a network of nerve cells. To this
day, very little is known about what happens to the optic signal once it begins its voyage
down the optic nerve. But, it has been determined that the optic nerve of each eye
sends the image that it sees to the opposite hemisphere of the brain. This would then
result in the proper orientation of the object and is the final visual image of the object.
Section 3: Classifications of Low Vision
The World Health Organization [WHO] has approximated that nearly 150 million
individuals have been identified as visually impaired throughout the world [3].
However, this number will continue to rise steadily over the next few decades. The
reason is not only due to individuals aging, but also due to the notion that many
individuals continue to be unaware of the different classifications of visual impairment.
Only through educational health programs and annual visits to an optometrist will an
individual be able to come to realize if they could potentially possess a form of visual
impairment [3].

10
With the human eyes being a vital component of an individual’s anatomy, health
physicians often recommend that each individual take the opportunity to visit an
optometrist, on a yearly basis, to receive an eye examination. In such an examination,
multiple tests are performed to assess the functionality of the human eye. The most
common form of eye assessment is the eye chart [seen in Figure 3], which is primarily
used to measure the visual system’s ability to perceive detail.
In this specific eye test, the physician places an individual 20 feet from the location
of the eye-chart. The individual is then asked to recite the various alphabetic letters
that are present. Such a test allows an optometrist to evaluate a person’s visual acuity.
For instance, for an ideal situation, a patient would possess 20/20 vision, which is
measured by an individual being able to read letters of a certain size at a distance of 20
feet. For those who do possess normal vision, the optometrist will determine the vision
line in which the patient is able to read without any problems. For example, if an
Figure 3: Eye Chart [4]

11
optometrist diagnoses an individual with 20/40 vision, the visual acuity represent the
idea the patient can just read letters, at 20 feet, that someone, with normal vision,
could distinguish at a distance of 40 feet from the chart.
The use of an eye chart as a medical tool for eye examinations is of vast importance
since an optometrist can evaluate a patient’s visual acuity and potentially diagnose one
of the following classifications of Low Vision and Blindness, which established by WHO,
a doctor or an optometrist may diagnose any individual with the following conditions:
- Normal Vision: Vision Acuity of 20/20 [3]. (Seen in Figure 4)
- Low vision: Vision acuity between 20/70 and 20/400 with the best possible correction of 20 degrees or less [3]. (Seen in Figure 5)
- Blindness: Vision acuity worse than 20/400 and the best possible correction of 10 degrees or less [3].
- Legal Blindness: Defined as vision worse than 20/200 or a visual field of 20 degrees or less [3]. (Seen in Figure 6)
Figure 4: Normal Vision Figure 5: Low Vision

12
Aside from the use of an eye chart to assess visual acuity, an optometrist may
implement other assessments to evaluate other forms of visual impairment. For
instance, in regards to determining if an individual possesses color blindness, a physician
would require a patient to take the Ishihara Color Blindness Test [seen in Figure 7].
This specific test consists of an array of colored images with each image containing
hundreds of dots appearing in randomized color and size [5]. However, within this
image of patterned dots, there exists a numerical figure that will be visible to those
individuals with normal color vision, and difficult to observe for those individuals who
have a red-green color deficiency. Similar to determining color blindness, there exists
Figure 6: Legal Blindness
Figure 7: Ishihara Color Blindness Test [5]

13
other evaluative tests have been implemented to assess the following visual impairment
classifications:
- Travel vision: Ability to see at 5-10 feet what the normal eye can see at 200
feet [3].
- Light perception: Individual can distinguish a strong light 3 feet from the eye but
cannot detect hand movement at same distance [3].
- Color Blindness: The inability to perceive differences between some of the
colors that others can distinguish [3].
- Total blindness: Cannot see a strong light [3].
Section 4: Causes of Low Vision
Even though the World Health Organization has said that nearly 150 million
individuals have been identified to have visual impairment, it is important to note that
not all individuals have the same Visual Impairment classification. With the array of
different forms of visual impairment, it is not surprising that there is a wide range of
different causes. According to WHO, the most prevalent causes of visual impairment
include the following: Cataracts, Glaucoma, Diabetic Retinopathy, and Childhood
Blindness [3].
Cataracts
According to WHO, cataracts continues to be one of the most prevalent causes of
visual impairment throughout the world [3]. With cataracts, it has been noted the visual
quality of an individual will gradually begin to degrade due to a significant change in the

14
clarity of the lens component of human eye. Since the lens is primarily composed of
water and protein, it is the responsibility of these specific proteins to provide the proper
nutrients to keep the clarity of the lens. However, as an individual continues to age, the
structures of the lens will begin to diminish. As an individual grows older, proteins will
have a tendency to change their alignment and begin to form clumps within the lens [6].
In many instances, cataracts will begin quite small, and the cloudiness will only affect a
minimal region of the lens. As one ages, the cataracts will then continue to grow slowly,
and cause for a significant reduction in the amount of light that reaches the retina.
Therefore, with cataracts, an individual will experience consistent blurriness in their
vision, and a significant reduction in their visual clarity [6].
Glaucoma
Glaucoma, which is another prominent cause for visual impairment, is an ocular
disease in which the optic nerve is severely damaged. As stated previously, the cornea
and the lens receive the proper nourishment from aqueous liquid instead of blood
vessels. Therefore, the human eye has a process in which it is responsible for producing
aqueous liquid that enters into the Aqueous Humor. However, to prevent the
consistent build up of liquid within the Aqueous Humor, the eye has a complex drainage
system that is able to filter out the liquid [7]. If an individual is diagnosed with
glaucoma, the optometrist will recognize there is a failure within the drainage system of
the eye. Therefore, with not enough liquid being filtered out by the drainage system,
the intraocular pressure in the eye will significantly increase. If the intraocular pressure

15
continues to be quite high, the pressure level will reach a critical stage and will cause
significant damage to the optic nerve [7]. Once the optic nerve is damaged, an
individual will experience permanent loss of their vision.
Diabetic Retinopathy
Any individual, who is diagnosed with Type I or Type II Diabetes, is susceptible to
having some form of visual impairment in their lifetime [8]. The primary reason for this
is that diabetes has a prominent effect upon the circulatory system of an individual’s
retina and thus can lead to one having Diabetic Retinopathy. In the early stages of
Diabetic Retinopathy, an individual will begin to have arteries, within the eye, that
become weakened and start leaking blood vessels upon the retina [8]. And, without the
proper medical treatment, the arteries will only continue to get weaker and will
eventually leak enough blood vessels into the Vitreous Humor. With this leakage, blood
spots will be projected onto the retina as the light source leaves from the lens. It is
these blood spots that will cause vision to get significantly blurry and cause a reduction
in visual clarity.
Age-Related Macular Degeneration
Another leading cause for visual impairment is referred to as Age-Related Macular
Degeneration [ARMD]. As an individual continues to grow with age, ARMD becomes
more prevalent as the arteries, within the ocular, begin to harden. This presents a
significant dilemma as the hardening of the artery prevents the macula, which is the

16
light sensitive tissue of the retina, from receiving proper nourishment. Without the
proper oxygen and nutrients, the macula would be unable to function in the proper
manner. Therefore, ARMD is responsible for the reduction of the clarity of seeing an
image as it causes for the gradual decrease in the sharpness and fine detail of an
individual’s vision [9].
Section 5: Adapted Physical Activity for Individuals with Visual Impairment
John F. Kennedy, the 35th President of the United States of America, once said,
“Mankind’s greatest strength is our ability to acknowledge our differences, but our
greatest weakness exists in failing to embrace these differences” *10]. In the world we
live in today, it is quite apparent that we are all each quite unique and diverse in
different capacities. There are some disabilities and differences that are visually
distinguishable between each person, such as one’s physical appearance and behavior
pattern. But, it is also of vast importance to understand that there are several
differences that are far less noticeable, such as an individual’s ability to learn, their
creative traits, and even their communication skills. Nonetheless, as President Kennedy
said, our society is aware of these many differences, but it is still our reactions and
perceptions towards these differences that becomes the primary reason for why we
continuously fail to embrace the many disabilities that are present.
Many individuals continue to be unaware of the idea that our society has grown
accustomed to forming social and physical barriers, in regards to individuals with a
disability, through our actions and personal beliefs [11]. Our society’s perception and

17
attitude towards others have been classified as a significant factor that has had a
profound effect upon preventing the inclusion of individuals, with a disability, in many
physical activities. The basis for such a notion is that mankind has a tendency to
perceive an individual, with differing abilities, in a negative manner and incapable of
participating in any form of physical activities or making the proper decisions. Since
attitudes and perception are critical in determining an individual’s willingness to
participate in an activity, the effects of attitudinal barriers, on an individual with
different social and physical abilities, have often deterred their participation in any level
of physical activity involvement [11].
The effects of attitudinal barriers remain quite prevalent and continues to be a
considerable factor for many to overcome. As this group remains unwilling to be
involved in physical activities due to fear of humiliation, our society will continue to
overlook the desire of individuals, with disabilities, to have active participation in
athletic recreation [12]. Thus, with no high demand for equipment specifically for
adaptive physical activities, manufacturing companies usually have no desire to design
and supply any type of a modified apparatus.
The lack of modified equipment for adaptive physical activity is another prominent
barrier experienced by those individuals diagnosed with a disability [12]. Many athletic
recreational activities require the use of some form of equipment, whether it is a ball to
shoot with in the sport of basketball, or even a bat to swing with in the sport of baseball.
However, for an individual who had a visual impairment, it would be quite difficult,
without the proper assistance, for one to not only navigate themselves towards the

18
basketball hoop, but also to locate the basketball within the court. Therefore,
equipment selection can have a profound effect upon increasing or decreasing the
active participation of individuals with diverse abilities.
It is of essence to promote positive attitudes and perceptions, as well as being able
to provide modified equipments, to promote inclusive physical activity within our
society. It is through the process of changing perceptions and promoting positive
attitudes that can significantly influence the level of physical activity involvement of
people with differences in ability. By providing equipment options that have been
modified to suit groups with a specific disability, the individuals will be able to feel
acceptance into our society, and will continue to have the desire to perform different
recreational activities.
Modifications for Basketball for Individuals with Visual Impairment
In regards to basketball, an individual, with a visual impairment, often is unable to
participate in such an athletic activity due to the inability to recognize their precise
location on the basketball court, as well as the inability of finding the movement of a
basketball. Therefore, several sporting goods companies have entered the sales market
by providing basketballs that can provide some aide. More specifically, these
basketballs have a sound component, such as a beeping device or bells, implemented
into the center of the basketball [12].
While the sound component within the basketball is aimed to assist in tracking the
location of the basketball, problems will still continue to arise from this specific modified

19
equipment. One common complaint regarding such an apparatus is that the use of bells
or a beeping sound, within a basketball, does not necessarily provide enough guidance
as the sound tends to fade away as the ball goes further away from the user. Also, once
the ball stops its movement, the user will be unable to hear any noise associated with
the ball, and thus will have difficulty in locating the ball. In addition, the modifications
of the basketball still have not resolved the issue of providing aid, to the individual, of
finding their precise location on the court and where they would need to shoot the
basketball to make a basket.
In order to resolve the dilemma of tracking the location of the basketball and the
user within the basketball court, a new system should be implemented. Therefore, the
purpose of this specific study was to propose, design, test, and implement a location
tracking network that enables an individual with visual impairment to determine their
precise position on a basketball court. Once a system was defined and designed, it was
believed that this system would not only be used to locate an individual, but also would
have the capability to translate the position coordinates into either an auditory or tactile
feedback to the user.

20
Section 6: Technologies Available for Basis of Real Time Location Tracking System
The primary purpose of a technology, such as a positioning system, was to have the
ability to provide the location of a specific object in a specific environmental setting,
whether it was in an outdoor setting, or even inside a house or a facility. In many cases,
it would be considered ideal to have a location tracking system that is able to provide
the position of an object in a real time manner. Therefore, a real time location tracking
system [RTLTS] would have the ability to continuously track the location of the object as
it moves through the environmental setting. However, the basis for a RTLTS could be
composed of various technologies, which are stated below.
Global Positioning System
One of the most recognized real time location tracking systems is the global
positioning system [GPS], as it is often designed as a handheld reader that is able to
assist in the navigation of airplanes and even automobiles. In order to provide real time
location tracking, GPS consists of several satellites that are positioned, in a fixed manner
relative to the ground, to orbit around the Earth and are required to continuously
transmit specific signals [13]. A GPS receiver then has the ability to accept these signals
from the different satellites, and evaluates the time interval it takes for the signal to
travel from a satellite to the receiver. This time interval is of great importance as it is
then used in a mathematical algorithm to calculate the latitude and longitude of the
object being tracked [13]. Such coordinates are then able to provide the precise
location of the object.

21
While GPS is indeed used for the navigation of airplanes and automobiles, it is
important to recognize that GPS signals are indeed quite weak. Therefore, it is often
recommended to be only used in areas with an unobstructed pathway between the GPS
receiver and the sky. With this in mind, such a technology would not be feasible for an
indoor environmental setting as the walls and ceilings of the building will pose as an
obstruction between the pathway of the satellite and the receiver. Ultimately, such an
obstruction will cause for a significant impairment in the signal reception leading to
either inaccurate tracking of the ability, or the inability to even locate such an object.
Infrared [IR Technology]
It has been suggested that Infrared [IR] Technology should be considered as the
primary component of a RTLTS. With such an approach, the object to be tracked would
possess its own emitter, identified by a unique code, which would periodically emit an IR
signal [14]. Such a signal would then be detected by the several IR receivers that would
be located within a pre-determined environmental setting, and would then be
processed by a software code that will be able to determine an approximate location of
the object being tracked.
The use of infrared technology, however, has several limitations. While there is
optimism to use IR, such a technology is often used for determining the position of an
object based primary upon the presence of the object. With this notion, IR technology
would not be practical for real time tracking. In addition, another limitation is that the
signals of IR do not have the ability to penetrate through dense material components,
22
such as walls of building, and thus could often cause the system to “lose” sight of the
object. In a similar manner, the system may “lose” track of the object if the orientation
of the IR tag is not in the same line of sight as the corresponding receivers of the system.
Therefore, the limitations and costly expenses, of such technology, could limit the
potential such technology.
Ultra Wideband
Another potential technology for an RTLTS would be Ultra Wideband [UWB]. As
with infrared technology, the use of UWB would entail for the environmental setting to
have several UWB antennas located throughout. And, for the desired object to be
tracked, it would need to possess a receiver upon it. The system would then function
through the antennas being able to propagate radio signals, which have distinct wide
bandwidths, to the receiver [15]. Once the signals have been obtained by the receiver,
it would then be analyzed by a mathematical algorithm that considers the time of arrival
of the signal rather than the signal strength. Such an algorithm is then said to have
good location accuracy and will only to continue to be improved with the
implementation of more antennas.
While it is believed to have good accuracy, there still remain some doubts in regards
to the use of UWB for a RTLTS. The primary reason is that the radiofrequency
bandwidths of the UWB have yet to be standardized, and the Federal Communications
Commission [FCC] has yet approve it for public use worldwide [15]. In addition, the
components of the UWB technology remain quite expensive to purchase.

23
Section 7: Radio Frequency Identification Systems [RFID]
Even though Radio Frequency Identification [RFID] systems have been known to be
in existence since at least the beginning of World War II, the prevalence of this specific
technological was not truly recognized until the past two decades [16]. With the recent
technological advancements in recent years, researchers and developers have been able
to recognize that RFID systems can implement the use of radio frequency waves to
transmit and receive information regarding an object. The process of how a generic
RFID system is used is illustrated in Figure 8.
As illustrated in Figure 8, an RFID system usually implements the use of an RFID
reader, RFID Active or Passive tag, as well as an RFID antenna. The tag, which consists of
a microchip attached to a radio antenna mounted on a substrate, is then placed upon
any desired object, in which user wants it to be identified. Once the RFID system
becomes operational, radio transmission are sent by the RFID reader to the RFID
Figure 8: RFID System Pathway [16]

24
antenna to obtain a request for information regarding the object with the tag [16]. The
tag then sends a response back to the antenna, with information regarding the tag, and
finally back to the reader. Once the reader obtains the information regarding the tag, a
user may then establish a computer program that requests the reader to send the
information into the host computer, where it can be further analyzed by the program.
Section 8: Passive RFID vs. Active RFID
Radiofrequency Identification technology is not merely based upon the
implementation of a universal system for all applications. But instead, different RFID
systems, such as Passive RFID and Active RFID, are employed with different systemic
characteristics to optimize the performance of the technology within a specific
application [16]. More specifically, Passive RFID and Active RFID systems can be
distinguished through characteristics such as the radio frequency band used within the
system, the power source of the RFID tag, and the communication process that exists
between the tag and the reader.
The most prominent distinction between the Passive RFID and Active RFID system is
based upon the power source associated with the system’s respective RFID tag. In
regards to the Passive RFID system, the tag does not have the capability of establishing a
communication pathway between itself and the reader since the tag does not possess
its own power source, such as a battery. Instead, the Passive RFID tag relies upon the
radiofrequency energy transferred from the reader to the tag to generate the power
necessary for the communication pathway [16]. In contrast, an Active RFID system

25
possesses a tag component that uses an internal power source, such as a battery, to
continuously power the tag to have the ability to initiate communication, with the
reader, by sending its own signal [16].
Therefore, as each RFID system is powered through different means, it is seen that
the communication pathway, between the reader and the respective tag, is unlike one
another. In regards to the Passive RFID system, the communication pathway begins
with the reader sending a specific radiofrequency signal to the desired tag. Once the
signal has been received by the antenna component of the passive tag, the signal is then
sent to the integrated circuit. This signal is then able to provide a power source to the
respective tag, and then can finally send an informative response to the reader. With
an Active RFID system, there exists an active transponder that functions similarly to that
of a Passive RFID system since the tag is only activated when it is able to receive a signal
from the reader [16]. However, an Active RFID system can have the tag initiate a
communication pathway since each tag possesses a power source that enables it to do
so. Such a feat is accomplished since a tag is able to emit a signal at pre-determined
intervals that is read by the reader to initiate the communication pathway.
Several other characteristics of the Passive RFID system and Active RFID system are
also prominently different due to the implementation of different power sources of
each respective RFID system. A summary of the differences can be seen in Table 1:

26
Table 1: System Characteristic of Passive RFID versus Active RFID System [16]
RFID System Type
System Characteristic
Passive RFID System Active RFID System
Power Source
of System
No power source within RFID tag. Power source is received from
radiofrequency signal sent from reader.
Power source is within the RFID tag, through the form of a battery.
Communication Pathway
Communication Pathway initiated by reader and sent to
the antenna of desired tag. Signal then travels to integrated circuit before the tag then sends
a response back to reader.
Active Transponder Communication Pathway initiated
by reader.
Beacon Communication Pathway is
initiated by tag sending signals to reader at pre-determined time
intervals.
Size of RFID Tag
Typical Size of Passive RFID Tag 5 millimeters by 5 millimeters
[0.196 inch by 0.196 inch]
Typical Size of Active RFID Tag 84 millimeters by 9 millimeters [3.307 inches by 2.1259 inches]
Read Range Approximately 3 meters [9.83 feet]
Approximately up to 1 kilometers [3,280 feet]
RFID Tag Costs Between $0.10 and $10.00 Between $10.00 and $100.00
As seen in the Table 1, the primary difference between Active and Passive RFID tags
is associated with the power source. Since Active RFID tags are operated through a
battery source and allow for greater read range in comparison to Passive RFID tags, this
technology has been recognized as the most common type of RFID technology to be
used in location tracking systems [17].
The functionality of Active RFID technology begins with corresponding tags
possessing a unique electronic code that differentiates it from another tag. Active RFID
reads are then placed upon an environmental setting and are emitting radiofrequency
signals that are scanning for the presence of these tags. Once information is obtained

27
from these scans, data is then transmitted from the antenna into an Active RFID reader
that processes and stores the information that has been acquired. Location can then be
determined based upon the presence of the object within the environmental setting. In
order to have a visual display of the location, a software code could be created and used
on a desktop. While Active RFID technology should indeed be considered for RTLTS, the
cost of implementing such a system is quite expensive [18].
Passive RFID technology, on the other hand, has yet to be considered for the use of
RTLTS. The reason is that it is believed that Passive RFID tags do not possess their own
power source, and thus are assumed to have a limited read range. However, it is
important to recognize that Passive RFID technology functions in the same manner as
that of the Active RFID technology. In addition, the costs of the components of Passive
RFID technology are far more cost effective [16]. Therefore, research should be
conducted upon evaluating the performance of Passive RFID technology as a basis for a
real time location tracking system.
Section 9: Product Specifications and Features of Passive RFID Tags
Within the PolyGait Laboratory, which is operated by Industrial and Manufacturing
Engineering [IME] Department, the Passive RFID components were limited due to
funding. More specifically, the only Passive RFID Antennas available were the Poynting
Antenna [A-Patch 0025], while the only Passive RFID Readers available were the Sirit
Reader [INfinity 510 UHF Reader]. However, there exists a vast array of Passive RFID
tags available throughout the PolyGait Laboratory. Below are descriptions of the
Passive RFID tags that are available.

28
Avery Dennison-224 [20]
- Product Specifications: o Antenna Size: 3.471 x 0.3208 inc o Operating Frequency: Global (860 – 960 MHz) o Integrated Circuit [IC] – Manufacturer & IC Name: NXP G2XL or NXP
G2XM o Memory: 240 bits EPC or 240 bits EPC + 512 bits User Memory o Operating Temperature: -40°F to 185°F [-40°C to 85°C]
The Avery Dennison (AD)-224 is an Ultra High Frequency [UHF] Passive Inlay has
been advertised, by its manufacturer, as potentially the “future of Passive RFID tags.”
Many are optimistic about the potential of AD-224 since this specific inlay supposedly
has the capability of being used for different purposes. For instance, studies have
shown the successful performances of the AD-224 in activities such as aviation baggage
tracking, asset and retail tracking, and even routing tracking. The success of the
performance of the AD-224 is attributed to the feature characteristics of the inlay.
More specifically, one important feature of the tag is that it has the capability of being
used through global UHF frequencies, which spans the range of 860 to 960 MHz.
Another unique feature is associated with the idea that these inlay tags have a unique
32 bit serial number that is already factory programmed, which enables the ease of
being able to identify a specific tag. Another prominent feature that makes this tag
quite likeable is that it has extra user memory which enables for more applications to be
Figure 9: Avery Dennison – 224 Tag Inlay [20]

29
used. Ultimately, these various features and advantages of the AD-224 make such a
UHF inlay tag quite attractive to the consumer.
Avery Dennison [AD]-230 [20]
- Product Specifications
o Operating Frequency: Optimized for 860 – 928 MHz o Integrated Circuit [IC] – Manufacturer & IC Name: Impinj Monza 3 o Memory: 96 bits EPC o Operating Temperature: -40°F to 185°F [-40°C to 85°C]
Another Passive UHF inlay designed by Avery Dennison is referred to as the Avery
Dennison [AD]-230. While the AD-230 is a Passive UHF inlay, there are some unique
designed characteristics that are able to differentiate this specific model from the AD-
224. Some key features include this specific UHF inlay having a shortened inlay length
that is able to fit 3 inch label width applications. First and foremost, the shortened inlay
length would be desirable as it would allow for different orientation and location
placement of the tag. With a shorter inlay length, the orientation and location
placement of the tag will not significantly affect the read rate of this specific Passive tag.
Another significant feature of this inlay tag is that it has a strong read range, and thus
means there will indeed be greater read rates which would insure increasing system
reliability.
Figure 10: Avery Dennison – 230 Tag Inlay [20]
30
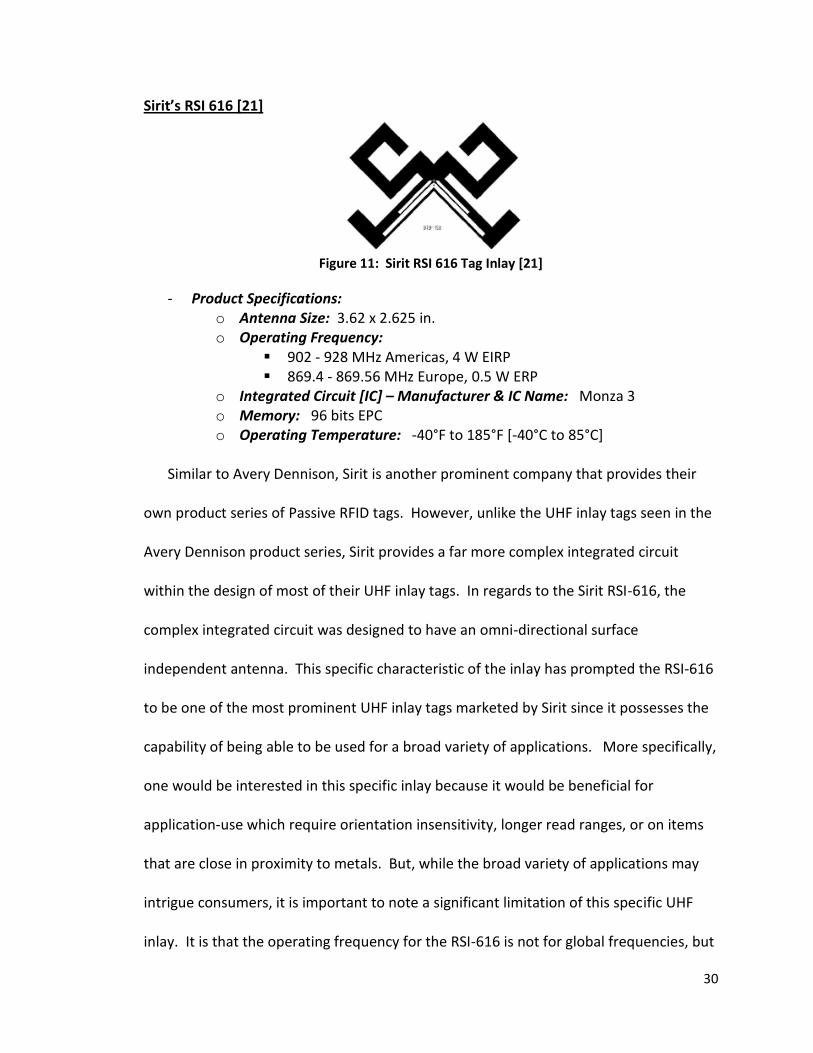
Sirit’s RSI 616 [21]
- Product Specifications: o Antenna Size: 3.62 x 2.625 in. o Operating Frequency:
902 - 928 MHz Americas, 4 W EIRP 869.4 - 869.56 MHz Europe, 0.5 W ERP
o Integrated Circuit [IC] – Manufacturer & IC Name: Monza 3 o Memory: 96 bits EPC o Operating Temperature: -40°F to 185°F [-40°C to 85°C]
Similar to Avery Dennison, Sirit is another prominent company that provides their
own product series of Passive RFID tags. However, unlike the UHF inlay tags seen in the
Avery Dennison product series, Sirit provides a far more complex integrated circuit
within the design of most of their UHF inlay tags. In regards to the Sirit RSI-616, the
complex integrated circuit was designed to have an omni-directional surface
independent antenna. This specific characteristic of the inlay has prompted the RSI-616
to be one of the most prominent UHF inlay tags marketed by Sirit since it possesses the
capability of being able to be used for a broad variety of applications. More specifically,
one would be interested in this specific inlay because it would be beneficial for
application-use which require orientation insensitivity, longer read ranges, or on items
that are close in proximity to metals. But, while the broad variety of applications may
intrigue consumers, it is important to note a significant limitation of this specific UHF
inlay. It is that the operating frequency for the RSI-616 is not for global frequencies, but
Figure 11: Sirit RSI 616 Tag Inlay [21]

31
rather only covers those frequencies in the United States and several countries
throughout Europe.
Sirit’s RSI 655 [21]
- Product Specifications: o Antenna Size: 0.659 x 0.512 in o Operating Frequency:
902 - 928 MHz Americas, 4 W EIRP 869.4 - 869.56 MHz Europe, 0.5 W ERP 865.6 - 867.6 MHz Europe, 2 W ERP
o Integrated Circuit [IC] – Manufacturer & IC Name: NXP UCODE G2XL o Memory: 96 bits EPC [scalable] o Operating Temperature: -40°F to 185°F [-40°C to 85°C]
The Sirit RSI-655 is another Passive UHF inlay tag, but differs from others as it uses a
hexagon-shaped integrated circuit. With a small near-field antenna designed within
this UHF inlay, one may choose to select this specific design as it could potentially be
able to obtain strong read ranges. With strong read ranges, there will indeed be greater
read rates, which would allow for the consumer to have an increase in system reliability.
This is of great importance for a consumer who would like to have a tag that would be
used for high-value asset tracking and applications where a small form factor tag is
required. However, once again, it is seen that this specific UHF inlay tag does span the
Figure 12: Sirit RSI 655 Tag Inlay [21]

32
global frequencies, but rather is limited to frequencies within the United States and
several countries in Europe.
Section 10: Application of Passive RFID Systems
Passive RFID systems are now highly regarded as a successful technological
advancement that is able to transmit the identification of a tag, on an object, through
wireless communication. With the growing success of such a system, the application of
this specific technology has grown tremendously, as it has been implemented to provide
inventory for items in a warehouse, inventory of livestock for farmers, and even
providing the government with a system that is able to obtain a numerical count of
vehicles passing an automobile toll booth [22].
Automobile Toll Booth with RFID System
In recent years, the United States and several other countries have implemented the
use of an RFID system in a tollbooth as seen in Figure 13.
Figure 13: Automobile Toll Booth with RFID System [22]
33
The goal of such a system is to provide a more efficient and accurate method of
receiving monetary toll funds, as well as reducing traffic delays. With this
implementation, an inexpensive RFID tag, with a corresponding account number, is
placed upon the windshield of the automobile. Once the automobile passes through
the automobile toll booth, an RFID antenna, which is mounted on the toll booth, would
read the RFID tag associated with the automobile. Once the tag has been read, the
information is transmitted by the antenna to a computer program that verifies that the
tag ID number corresponds to an active toll account, a debit is then placed onto the
automobile driver’s account, and the car is allowed to pass [22].
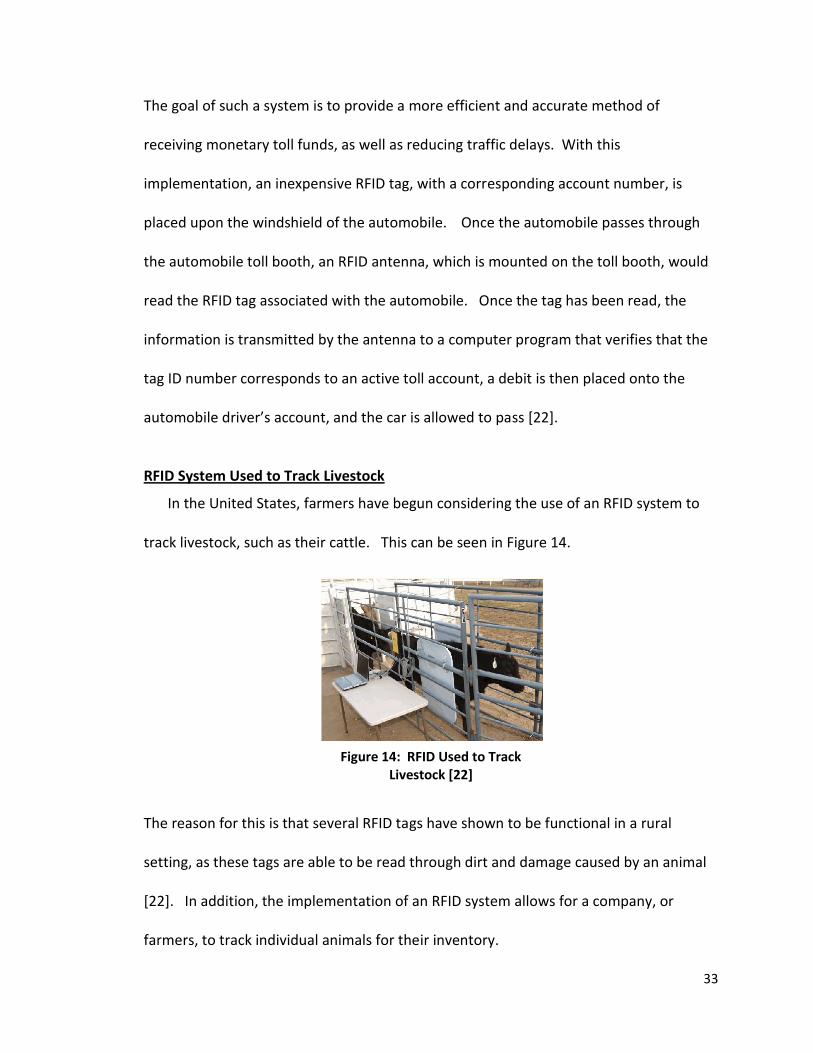
RFID System Used to Track Livestock
In the United States, farmers have begun considering the use of an RFID system to
track livestock, such as their cattle. This can be seen in Figure 14.
The reason for this is that several RFID tags have shown to be functional in a rural
setting, as these tags are able to be read through dirt and damage caused by an animal
[22]. In addition, the implementation of an RFID system allows for a company, or
farmers, to track individual animals for their inventory.
Figure 14: RFID Used to Track Livestock [22]

34
Potential of RFID in Real Time Location Tracking Systems
When implementing the use of RFID systems in various applications, many engineers
deploy the usage of RFID portals. Traditionally, an RFID portal is a system, consisted of
an antenna and a reader, which is created to have an interrogation zone that allows for
RFID tags to be promptly passed through to be read. As with the application of the RFID
systems in the inventory of livestock and in automobile toll booths, the implementation
of stationary portals has been commonly accepted. With this specific RFID portal, an
antenna and a reader are mounted onto a desired object that is required to remain
stationary. Therefore, the reader and antenna must wait for the tag to pass through the
designated area of interrogation to read the information about an RFID tag.
Even with the significant advancements with RFID technology, there has yet to be an
ideal system that is able to provide a precise real time location of an object using an
RFID system. Many may come to such a conclusion since it has been well-documented
that RFID is not specifically designed to engineer a system that provides a precise real
time location of an object [23].
Nonetheless, recent studies have still been conducted to evaluate the potential of
Passive RFID technology, for such an application, and these studies have shown that
there remains optimism. It is important to understand that such hope is based upon
gaining a further understanding of the installation and implementation process of the
RFID system. More specifically, to have a real time location system, the system must
have the capability of automatically and continuously tracking and reporting the

35
location of a tagged object. In order to accomplish such a feat, one must take into
consideration several concepts of the system:
- The ability and capability of the different types of RFID Passive and RFID Active tags. The tag, which will be placed upon an item, will have a unique identification
code that will be read by the readers and antennas of the system. However, as
stated in the previous section, there exists an array of differences between the
tag characteristics of RFID Passive and RFID Active tags [24]. Therefore, one
must first conduct a series of tests to evaluate the benefits and limitations of
each tag type before making any decision on which tag will be better suited for
real time location tracking of an object.
- The placement of readers and antennas within the environment setting. The placement of the readers and antennas is of great importance to
properly place these components in a location that will be able to read the
information from the tag. If the tag is not located within the interrogation zone
of the antennas and readers, no information will be obtained regarding the
specific RFID tag [24]. Thus, the lack of information obtained from the tag will
prevent one from identifying the real time location of the object.

36
- The mathematical algorithms that will be implemented within the computational monitoring system. In order to find the precise real time location of an object, a computational
monitoring system must be implemented. The purpose of such a component is
to allow for the user to send protocol commands that will be able to provide the
antennas and readers with a guidance of what tag information should be
gathered. The tag information will then be transmitted from the readers to the
computational monitoring system. Once information has been received by the
computational monitoring system, mathematical algorithms can be used in being
able to provide an analysis of the precise real time location of the object.
Section 11: Mathematical Algorithms to Compute Real Time Location of Object
As stated previously, RFID technology is not designed to have the application of
being able to provide precise, real time location of an object. Nonetheless, different
mathematical algorithms, within a computational monitoring system, have been
implemented into an RFID system to evaluate and analyze the technology’s
performance in being able to provide data regarding an object’s precise location. In
recent studies, the mathematical algorithms are often based upon the theory of
trilateration and triangulation.
- Trilateration Trilateration is a mathematical approach (i.e. Received Signal Strength [RSS],
Time of Flight [TOF], Time Difference of Arrival [TDOA], and Phase Difference of
37
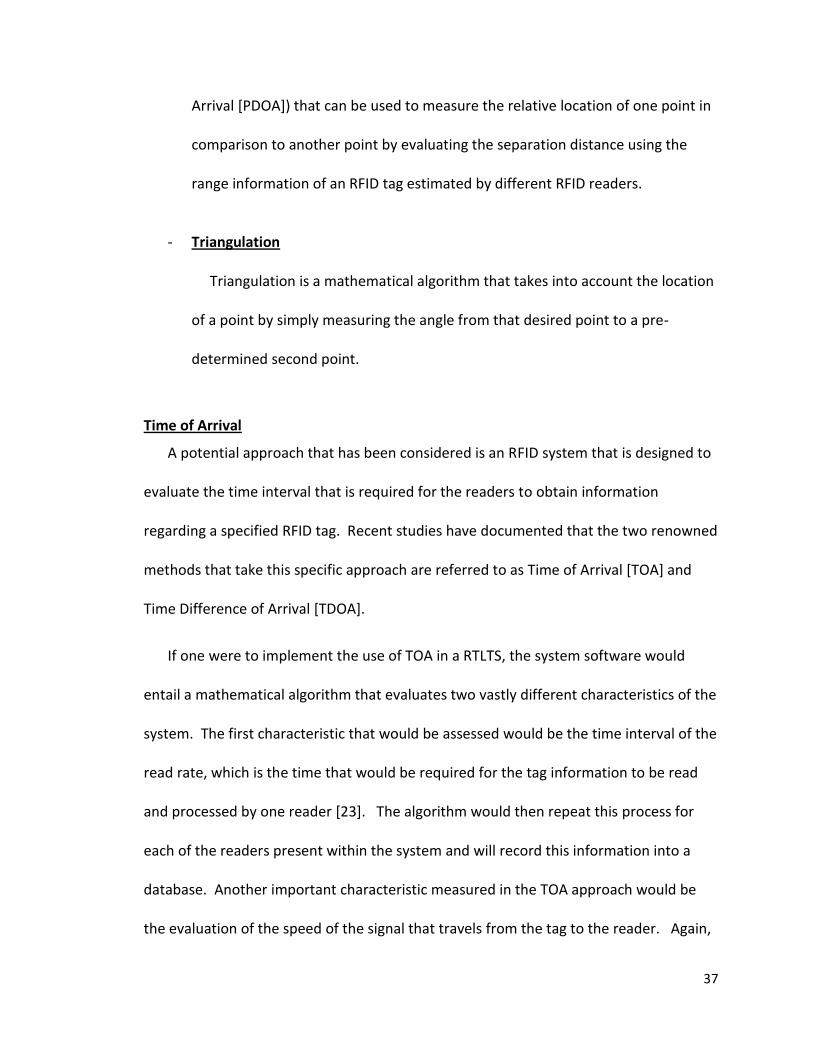
Arrival [PDOA]) that can be used to measure the relative location of one point in
comparison to another point by evaluating the separation distance using the
range information of an RFID tag estimated by different RFID readers.
- Triangulation
Triangulation is a mathematical algorithm that takes into account the location
of a point by simply measuring the angle from that desired point to a pre-
determined second point.
Time of Arrival
A potential approach that has been considered is an RFID system that is designed to
evaluate the time interval that is required for the readers to obtain information
regarding a specified RFID tag. Recent studies have documented that the two renowned
methods that take this specific approach are referred to as Time of Arrival [TOA] and
Time Difference of Arrival [TDOA].
If one were to implement the use of TOA in a RTLTS, the system software would
entail a mathematical algorithm that evaluates two vastly different characteristics of the
system. The first characteristic that would be assessed would be the time interval of the
read rate, which is the time that would be required for the tag information to be read
and processed by one reader [23]. The algorithm would then repeat this process for
each of the readers present within the system and will record this information into a
database. Another important characteristic measured in the TOA approach would be
the evaluation of the speed of the signal that travels from the tag to the reader. Again,

38
this characteristic will be measured for each reader and will have the data recorded
onto the database. Next, the algorithm will consider these two characteristics and
provide an approximate location of the tracked object. However, it is said that the
method requires highly accurate time synchronization from all of the tags and readers
to be able to provide a precise, real time location of an object.
Therefore, due to the vast importance of being able to synchronize the time-aspect
of all the components of the system, recent studies have suggested the use of Time
Difference of Arrival [TDOA]. Again, this method emphasizes the approach of being able
to obtain the time interval that it takes for a reader to read and process the tag
information of the object being tracked. However, unlike the method in TOA, the
synchronization of all components of the system is no longer of great importance. The
reason for this significant difference, between the TOA and the TDOA, is that the
mathematical algorithm, of the TDOA approach, does not look at the read rates of each
pathway as separate entities. Instead, an approximate location of the tracked object
will be measured through analyzing the speed of the signal, and calculating the
difference between the read rate intervals between the tracked object and each of the
separate readers [23].
In order to validate the use of TDOA within a real time location system, simulations
and prototypical systems were evaluated in a study conducted by A. Bhatia and his
peers [23]. In this specific study, a simulation of the performance of the TDOA approach
was performed with the computational software, MATLAB. In this simulation, the
primary objective was to see the average error distance that was recorded for the

39
tracked object. Therefore, an indoor room setting, with the dimensions of 250m by 250
m, was created with readers located at 25m apart from one another in this simulation.
An assumption, that each reader had the capability of being able to read tags within a
distance of 50m, was made. As the simulation was ran for several hundred
experimental tests, it was seen that the average error distance was approximately 5m.
The error distance continued to increase if the room setting area was increased.
However, an increase in the number of readers was shown to significantly decrease the
error in distance [23].
A prototypical system was evaluated in the study analyzed by Bhatia and his peers
[23]. In order to compare results from the simulation models, the researchers also used
the same parameters. Results had shown relatively similar data as the average error
distance was slightly higher at a distance of 6m for the same dimensional settings.
Nonetheless, the simulation and prototypical models have verified the potential of the
TDOA approach in a real time location system as it does not rely upon synchronization
of all components, and can indeed provide reasonable accuracy in detecting the location
of an object being tracked [23].
Spatial-Domain Phase Difference of Arrival
Another potential mathematical algorithm in determining the location of a tagged
object is the use of Spatial Domain Phase Difference of Arrival [SD-PDOA], which is
referred to as Angle of Arrival [AOA]. By incorporating such an approach, an estimated
distance, of the tagged object, could be determined based upon measuring the phase

40
signal of the desired tag [25]. More specifically, the system would implement the use of
a pre-determined number of antennas that will be placed at fixed locations. The
location of the tagged object will then be determined by the phase signal difference
between the different antennas. Through this process, a corresponding angle and path
difference can be correlated with the phase signal difference. Thus, such a method
could potentially provide for a mathematical approach in being able to find the location
of a tagged object.
The limitations, associated with the SD-PDOA, have played a prominent role in
preventing such an approach from being used in a real time location system. The
primary limitation is that the accuracy is based upon the precise angle measurements
that are obtained [25]. If a minimal error in the angle measurement is obtained, the
mathematical algorithm may provide a significant error in the estimated location of the
tagged object. Another limitation is that the SD-PDOA has shown to be quite
ineffective within an indoor environment, as the environment may possess material that
could cause inaccurate angle measurements due to reflection of the phase signals.
With this limitation, it seems as though the most optimal environment, for the SD-
PDOA, would be one in which the line of sight, from the tag to the antennas, is not
obstructed by any object. Therefore, one may conclude that such an approach is not
suitable for an indoor environment.

41
Landmarc Approach
In a study conducted by Lionel M. Ni and his fellow colleagues, the researchers
proposed the Landmarc Approach, which took into consideration the use of trilateration
[18]. In order to accomplish such a feat, Ni established an RFID system with the primary
components consisting of four RFID readers and the use of Active Ultra-High Frequency
[UHF] tags. In this specific study, Ni chose to utilize RFID readers that are designed to
have pre-assigned power levels [1-8] that represents the correlation associated with the
received signal strength [RSS] that is needed for the reader to obtain information
regarding a desired tag on an object. In essence, the power levels of the four RFID
readers can be used as a characteristic that provides a broad definition of different
regional zones in a room setting. Thus, with this unique feature, the desired tag can be
identified into a specific zone as a mathematical algorithm is able to take into
consideration the power levels, in each of the four readers, which cover the distance of
each region. However, the Landmarc approach was not solely based upon using the
power levels of the readers.
Instead, another important component implemented into the Landmarc Approach
was the use of Active UHF tags not only on the object, but was used in the room setting
with the intention of being used as fixed reference points [18]. With this specific
approach, the readers were able to continue to use the method of measuring power
levels to approximate the location and distance of the object tag. However, the method
of measuring the Euclidean distance, which is the distance between the signal strength
from the tag of the object and each reference tag, was taken into consideration. Such a

42
Figure 15: Equation for Measuring Euclidean Distance [18]
measurement was obtained with the following equation in Figure 15, where E denotes
the distance, S denotes the signal strength from the tag of the object, and Ѳ denotes the
RSS from the reference tags.
The results, from the study conducted with the Landmarc approach, have illustrated
several important characteristics and concepts regarding the implementation of such a
method in an RFID system. First, there does exists different possibilities of being able to
improve the precision of locating an object, as it is not solely based upon adding more
RFID readers. Similar to the approach of using Active UHF tags as reference points,
these different possibilities would not only yield more accurate and reliable results
regarding the precise location of the object, but a cost-saving opportunity to establish
an RFID system.
Even with the significant advantages associated with the Landmarc system, it
remains difficult to overlook the problems associated with such an approach. While the
approach is able to provide quite accurate information regarding the position of an
object, the time to obtain an analysis of the location was considerably quite long. This
specific study has shown that it exceeds over a minute for the RFID readers to scan the
different power levels and estimated the signal strength of all Active UHF tags within the
room setting. Another prominent dilemma was that the placement of the reference
tags and the readers were of vast importance since the regional zones were based upon

43
the location of these components. Therefore, the problem remained to be the issue
that the regional zones would continue to be altered and in different orientations if the
RFID readers were positioned diversely. Nonetheless, it was of vast importance to
consider the proposal of the Landmarc approach as it established the basis for the
potential of using RFID technology to obtain a precise, real time location system.
Section 12: Purpose of Study
An individual, diagnosed with a visual impairment, often must experience the many
social and physical barriers when trying to participate in a recreation activity. While it
will remain quite difficult in changing our society’s perception on individuals with a
disability, it should be noted that our society has an opportunity to assist in overcoming
any physical barrier that is presented. While it is evident that an individual, with a visual
impairment, may experience difficulty in performing certain aspects in the sport of
basketball, it should be known that assistance can be provided through the modification
of the equipment, such as the implantation of sound components inside the basketball.
However, there has yet to be an assistive device that is able to provide assistance in
navigating a person towards not only the basketball hoop, but to locate the individual
within the court.
Therefore, the purpose of this study was to suggest the implementation of a real
time location tracking system to assist an individual, with a visual impairment, to
recognize their precise location on the basketball court. While there exist real time
location tracking systems available on the market, it was desirable to have one that was

44
cost effective. Due to the relatively low cost of the Passive RFID tags [between $0.10
and $0.50] and the corresponding Antenna and Reader, it was decided that the Passive
System would be the proper choice for the RFID Technology even though such
technology was not specifically designed for real time location tracking. The reason for
such optimism was associated with the notion that RFID technology has been used in a
vast array of applications, and has been recognized as quite reliable in tracking objects
as it passes an RFID portal, as seen in Figure 16.
With this specific study, it was hypothesized that Passive RFID technology would be
able to be used as the basis for a real time location tracking system. It was believed that
such a system would then be able to recognize the accurate location of an individual
within a pre-determined environmental setting. Therefore, to accomplish such a feat, a
software code was written to not only establish a communication pathway between all
Figure 16: RFID Portal Reader [16]

45
of the components of the system, but to function in a manner that requests the system
to provide a visual database of the object being tracked. With this, the first iteration of
this design was employed with the use of multiple Radio Frequency Identification [RFID]
antennas to cooperatively designate unique interrogation zones, which allowed for the
identification of a general position of a user. However, future iterations will involve
either a reference tag scheme or a phase shift determination for identifying relative
position more precisely and with fewer readers.
In addition, tests were conducted to analyze whether or not factors such as
directionality of tag, attenuation and height levels of the antenna, and the
implementation of multiple tags to track an object had a significant impact upon the
read accuracy of the technology of Passive RFID as a real time location tracking system.
And, after the conduction of this study, the hope was to recommend the use of Passive
RFID technology, for the RTLTS, along with a form of tactical stimulation in order to
assist an individual, with a visual impairment, with a directional guidance of where the
basketball hoop was located.

46
CHAPTER II: DESIGN DEVELOPMENT AND FEASIBILITY TEST
In order to gain a sense of familiarity with how each component of the Passive RFID
Technology functions as a unified system, a series of preliminary tests were conducted.
A Passive RFID Antenna Placeholder and Cubic Testing Structure were first designed and
manufactured. Next, a software code was designed with the sole purpose of tracking
the zones in which a Passive RFID tag was located within. A series of tests were then
conducted to analyze and evaluate the performance of the RFID technology as a RTLTS.
The tests consisted of evaluating the presence of the vast array of Passive RFID tags that
were present within the testing environment, the number of times each Passive RFID
tag was read by the system, as well as the range of how far each Passive RFID antenna
was able to read a designated tag.
Section 1: Designing and Manufacturing Passive RFID Antenna Placeholder Stand for Feasibility Test
In order to evaluate and analyze the performance of RFID technology within a RTLTS,
a placeholder stand for the RFID antenna was first designed and manufactured. With
this, the materials that were needed were the following:
- Total of 20 feet of 1” PVC pipe needed o 2 – 2 foot section of 1” PVC Pipe o 6 – 1 foot section of 1” PVC Pipe o 2 – 5 foot section of 1” PVC Pipe
- 6 – 1” PVC Elbows - 2 – 1” PVC T-Joints - 2 – 1-1/4” PVC T-Joints - 8” x 8” plywood - 4 screws [for plywood] - 2-wingnuts

47
- PVC clamp
Since 1” PVC pipes were generally sold with the stock size of ten feet, it was of
necessity to measure and cut the original length of the PVC pipe into the desired
dimensions. Therefore, for a two foot section of 1” PVC pipe, a distance of two feet was
first measured with a measuring tape. Once a measurement was made to determine
the distance, a marker was then used to designate the desired cut length. Next, to
obtain the desired portion size of the PVC pipe, a PVC cutter was then used to cut the
PVC pipe at the designated mark. The same process was used to obtain a total of two
sections of 1” PVC Pipe with the length of two feet, six sections of 1” PVC Pipe with the
length of one-foot, and two sections of 1” PVC Pipe with the length of five feet.
In order to construct the base of the placeholder stand, I first took one section of the
1 feet PVC Pipes and placed one PVC elbow at each end. Next, at the end of each of the
PVC elbows, I then needed to connect an additional section of one-foot PVC Pipe. Once
attached, I then connect one PVC T-Joint *1”+ to the end of the one-foot PVC Pipe. In
addition, it was important to note that the single, vertical component of the T-joint had
to be directed in the upward direction. Next, I connected the PVC Pipe with the
corresponding length of two feet to the each end of the PVC T-Joints. Afterwards, PVC
elbows were connected to each end of the two-foot long PVC Pipes. Finally, I completed
the base of the placeholder stand by connecting the two PVC elbows with another one-
foot PVC pipe. Once the base of the placeholder stand had been completed, I placed a
PVC pipe the length of five feet to each of the 1” PVC T-joint attachments.

48
In regards to the PVC T-Joint with the diameter of one and a quarter inch, I identified
the center point of the horizontal region of this specific component. Next, I used a
quarter inch drill bit to create a corresponding hole. Next, one wingnut was fitted into
the hole. The same procedure was repeated for the other corresponding T-Joint. Once
this step had been completed, I then connected the two T-joints with another one-foot
PVC Pipe. In order to attach the antenna to this specific component, I first measured
the corresponding distances between the threaded holes on the antenna onto the 8” by
8” plywood. Once the corresponding marks were made onto the plywood, I used the
quarter inch drill bit to create a corresponding through hole. Next, I attached the
plywood onto the Sirit Antenna by screwing in the four screws into the four through
holes that have been created. Next, I placed the one-foot PVC pipe in the middle of the
plywood, with the two T-joints extended beyond the plywood. Next, I used the two PVC
clamps and placed each approximately two inches from the edge of the plywood. Once
the position had been determined, I drilled in the screws to clamp the PVC Pipe. Once
this component had been constructed, I allowed for one end of the PVC T-Joint to slide
through the vertical five-foot PVC Pipe, and slipped the other end PVC T-Joint to the
other vertical five-foot PVC Pipe. In order to position the Antenna component, I twisted
each of the wingnuts to tighten the component to the vertical PVC Pipe.
Next, the top component of the stand had to be constructed. For this, I first took
one of the one-foot PVC Pipes and placed one PVC elbow at each end. Next, at the end
of each of the PVC elbows, I connected an additional one-foot PVC Pipe. Finally, I
connect one end of the PVC elbow to the vertical, five-foot PVC pipe, and the PVC elbow

49
to the other vertical PVC Pipe to complete the structure. Below, Figure 17 shows a
SolidWorks design of the Passive RFID Antenna Placeholder Stand, and Figure 18 shows
an actual image of such a stand. For images of the construction of the RFID Antenna
Placeholder Stand and additional Solidwork Designs for the structure, please refer to
Appendix A.
Figure 17: SolidWorks Design of Passive RFID Antenna Placeholder Stand

50
Section 2: Conducting Feasibility Test
Once the Passive RFID Antenna Placeholder Stand had been constructed, a series of
tests were conducted to evaluate the performance of the Passive RFID system in
tracking corresponding Passive RFID Tags. Initial feasibility tests were first conducted
with the pre-assigned program setting that was provided, on a compact disc [CD], by the
manufacturer of the RFID reader, Sirit. Therefore, it was of necessity to install the
program onto a pre-assigned laptop to conduct these tests.
Once the installation of the software program was completed, an Ethernet cord was
used to establish a communication pathway between the laptop and the Sirit Reader
[INfinity 510 UHF Reader]. Also, one had to establish a communication pathway
Figure 18: Design of Passive RFID Antenna Placeholder Stand
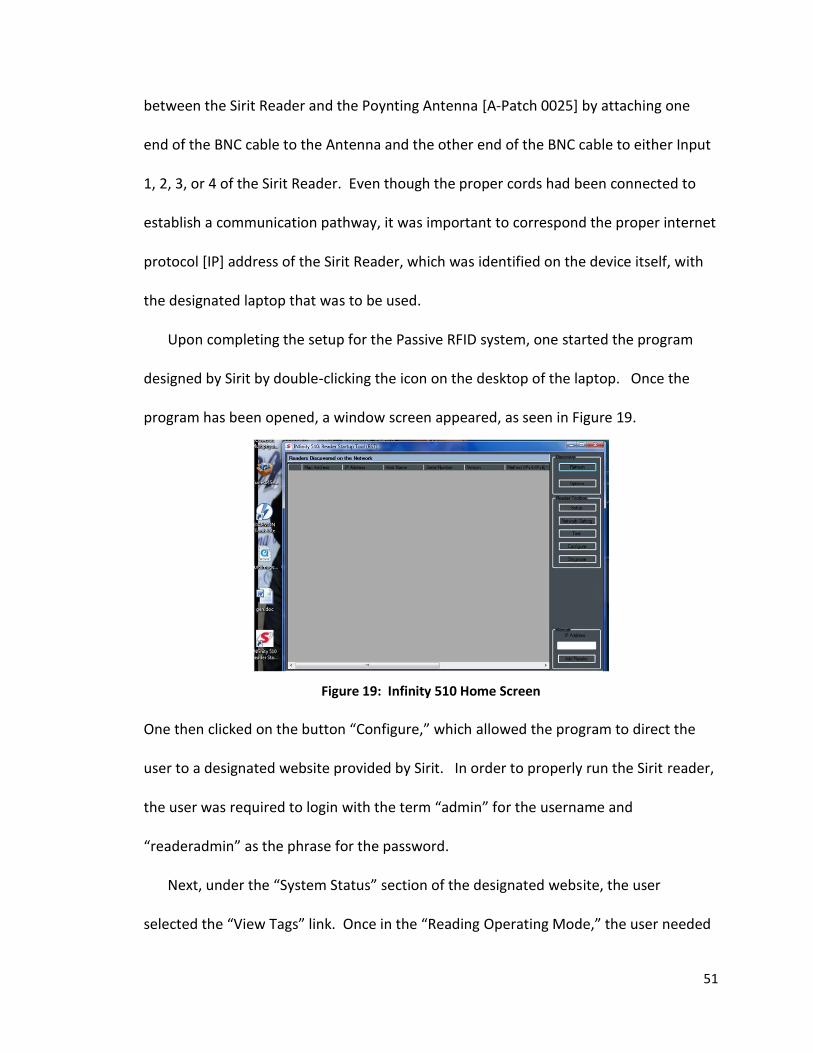
51
between the Sirit Reader and the Poynting Antenna [A-Patch 0025] by attaching one
end of the BNC cable to the Antenna and the other end of the BNC cable to either Input
1, 2, 3, or 4 of the Sirit Reader. Even though the proper cords had been connected to
establish a communication pathway, it was important to correspond the proper internet
protocol [IP] address of the Sirit Reader, which was identified on the device itself, with
the designated laptop that was to be used.
Upon completing the setup for the Passive RFID system, one started the program
designed by Sirit by double-clicking the icon on the desktop of the laptop. Once the
program has been opened, a window screen appeared, as seen in Figure 19.
One then clicked on the button “Configure,” which allowed the program to direct the
user to a designated website provided by Sirit. In order to properly run the Sirit reader,
the user was required to login with the term “admin” for the username and
“readeradmin” as the phrase for the password.
Next, under the “System Status” section of the designated website, the user
selected the “View Tags” link. Once in the “Reading Operating Mode,” the user needed
Figure 19: Infinity 510 Home Screen

52
to select “Active Mode” to begin a communication between the RFID reader, RFID
antenna, and the laptop. For this specific feasibility test, the user specified different
time intervals, within the “polling period” option, to test how many times various tags
were read, by an antenna, over that time period. Once the time interval had been
determined, the user selected “Start” to begin tracking the tags. Similarly, to end the
communication, one clicked the “Stop” button. A summary of the number of tags
within the environment, as well as a numerical count of how many times each tag was
read by the Antenna, was then provided with the Sirit Program as seen in Figure 20. For
a visual representation of protocol for Feasibility Test, please refer to Appendix B.
Results from this protocol can be seen in Chapter IV, Section 1.
Figure 20: Infinity 510 Tag Database Summary Display

53
Section 3: Test of the range of how far the Passive Antenna is able to read a Designated Tag
As the Sirit Program allowed for the user to change the attenuation level of the
Poynting Antenna, I first decided to evaluate the read range of the Antenna at different
attenuation levels to gain a sense of the read range of the Poynting Antenna. In order
to accomplish such a task, we obtained an Avery Dennison-224 RFID Passive Tag. We
then used a portable hand-held reader to identify and note the specific identification
number of the RFID Passive Tag chosen for use. To begin testing for the read range, an
individual held the corresponding Passive Tag not only in front of their body, but also at
the same height level as the antenna. Testing began by having the individual hold the
tag flesh with the side of the antenna, which was at a corresponding angle of 00 in
relation to the right side of the antenna. Once in the proper position, the number of
times that specific tag was read by the Antenna over a five second time interval was
recorded. Next, the individual took an inch step backward and once again recorded the
number of times that specific tag was read. This step was repeated in the same line of
path until the tag was no longer read by the antenna, which corresponded to the
identification tag no longer being seen in the summary page of the software program.
And, this distance was recorded. Once the tag was no longer read in that same line of
path, the same individual was positioned at an angle of 20o in relation to the side of the
antenna. The same procedures were repeated and distance at which the tag was no
longer read was recorded. The same procedures until were continued until one
obtained read ranges at 1800 (other side of the antenna), at intervals of every 200. The
same steps were repeated for the different attenuation levels to be investigated.
54
Results from this test can be seen in Chapter IV, Section 2, while a visual representation
of the protocols can be seen in Appendix C.
Section 4: Test of the presence of the vast array of Passive RFID tags within the testing environment
With a defined read range over a span 1800 for the antenna, the user had a sense of
where the antenna should be able to read various Passive RFID tags. Thus, to test this
notion, I obtained multiple different Passive RFID tags and used the portable hand-held
reader to obtain the specific tag identification of each. Next, all the different Passive
RFID tags were placed anywhere with the read range measured for the Attenuation
Levels of 0, 50, 100, 150, 200, 250, 300, and 350. Once the tags were placed, the
software program, provided by Sirit, was used to obtain a summary of the number times
each tag was read over a span of different time intervals. The procedure was repeated
by simply moving the tags to different locations. By implementing such a test, the user
was able to recognize the feasibility of not only reading one specific tag within the read
range of the antenna, but whether or not multiple tags could be read simultaneously.
Results from this test can be seen in Chapter IV, Section 3 and a visual representation of
such a protocol can be seen in Appendix D.

55
Section 5: Test of the Number of Times a Passive RFID tag is read through different activities
After testing if a Passive RFID tag can be read through a stationary position within
the read range, the next test was designed to establish the notion that the tags could be
detected and read throughout the events of different activities. For the first activity, I
once again obtained a Passive RFID tag and identified the identification number
associated with the tag. Next, I allowed an individual to hold the tag and walk around a
zone, within the pre-determined read range, for a time interval of 15 seconds to identify
if the tag was still being read. In another activity, I asked for an individual to hold the
tag and jog around a zone, and then noted the summary of how many times the tag was
read. In another activity, a NERF ball was obtained and an incision was made to allow
for a Passive RFID tag to be placed within this slot. Next, the NERF ball was thrown at
different speeds to see if the ball was read by the antenna as it “passed” by. In order to
see a visual representation of these activities, refer to Appendix E. Summarized results
can be seen in seen in Chapter IV, Section 4.
Section 6: Construction of Cubic Testing Structure
For the next phase of testing the feasibility of the RFID system as a location tracking
system, I wanted to establish a “sensing” surface, which was broken down into small
squares of equivalent sizes, which was then able to aide in determining the position of a
tagged object. Therefore, to define a sensing surface to test this method’s capability of
providing real time location, a cubic testing structure of the size of 9 feet by 9 feet by 9
feet needed to be constructed.

56
Designing and Manufacturing Cubic Testing Structure In order to design and manufacture the Cubic Testing Structure, the materials that
were needed were the following:
- Total of 144 feet of 1” PVC pipe will be needed o 16 – 6 inch sections of 1” PVC Pipe o 16 – 4 foot sections 1” PVC Pipe o 24 – 4.5 foot sections of 1” PVC Pipe
- 8 – 1” PVC Elbows - 24 – 1” PVC T-Joints - 12 - 1” PVC Connectors - 8 – 8” Cable ties
Since 1” PVC pipes are generally sold with the stock size of ten feet, it was of
necessity to measure and cut the original length of the PVC pipe into the desired
dimensions. Therefore, for a desired 1” PVC pipe with the length of six inches, a
distance of six inches was first measured with a measuring tape. Once a measurement
was made to determine the distance, a marker was then used to designate the desired
cut length. Next, to obtain the desired portion size of the PVC pipe, a PVC cutter was
then used to cut the PVC pipe at the designated mark. The same process was used to
obtain a total of 16 sections of 1” PVC Pipe with the length of six inches each, 16
sections of 1” PVC Pipe with the length of four feet each, and 24 sections of 1” PVC
Pipe with the length of 4.5 feet each.
To construct this structure, it was highly recommended to begin with creating the
lower base. First, I obtained one section of the 1” PVC elbows and attached one section
of the six-inch section of PVC pipes to each end. Next, I connect one PVC T-Joint *1”+ to
the end of each of the six-inch PVC Pipes. Afterwards, a PVC Pipe with the length of 4.5
feet was connected onto the ends of each of the PVC T-Joints. To the ends of both PVC

57
Pipes, I connected another PVC T-Joint followed by a connection with another PVC Pipe
of the length of 4.5 feet. To each ends of these PVC Pipes, I needed to connect another
PVC T-joint followed by six-inch long PVC Pipe. I then completed the first half of the
base by connecting a PVC elbow to the ends of each of the six-inch long PVC Pipe. In
order to complete the second half of the base, I repeated the same procedures that
were previously stated and a square-shaped base was established. Once the lower
base has been constructed, I created the exact same base, by following the same
protocol, to obtain the component for the top of the Cubic Testing Structure.
After the completion of both the lower base and the upper base, I then needed to
obtain one of the 1” PVC Pipe of the length of 4.5 feet and attached it, perpendicularly,
to one of the PVC T-Joints on the lower base. The same procedure was repeated for
the eleven other PVC T-Joints on the lower base. Once completed, I then attached a 1”
PVC Connector to each of the 1” PVC Pipes of the length 4.5 feet. Next, I connected the
remaining 1” PVC Pipes of the length of 4.5 feet to each of the recently attached PVC
Connectors. Finally, to complete the Cubic Testing Structure, I aligned the top base to
each of the 1” PVC Pipes of the length of 4.5 feet and then secured the attachment.

58
Section 7: Evaluating Software Program Provided by Tyler Peabody
Instead of designing a software code with the pre-assigned settings established in
the Sirit Program, Dr. Tali Freed suggested discussing my options of how to create a
system with the capability of providing a real time location of a Passive RFID tag with
Mr. Tyler Peabody. In the conversations, it was recommended to use a program, such
as Microsoft Access, to accomplish such a feat. The primary reason for such a
recommendation was associated with the notion that Mr. Peabody had previously
written a software code, in Microsoft Access, with the sole purpose of tracking the
zones in which a Passive RFID tag was located within. Thus, with the similarities
between the two projects, Mr. Peabody was kind enough to provide us with his
software code as a basic foundation for what my code would need to entail to be able to
have a system that would provide for a real time location tracking of a designated
Passive RFID tag.
While the software code, in Visual Basic, provided by Mr. Peabody indeed served as
a basic foundation for my own software code, it was of importance to evaluate each line
of his code to gain a familiarity with not only the programming language, but also the
communication pathway that was established between the antennas, reader, and
Microsoft Access. Therefore, to establish a systemic environment that could easily be
divided into well-established zone regions to track a Passive RFID Tag, the Cubic Testing
Structure was of great use in such an evaluation.
59
Section 8: Initial Evaluation of Mr. Tyler Peabody’s Software Code
For the initial evaluation of Mr. Peabody’s software code in Visual Basic, it was
determined that the Cubic Testing Structure was to be used for the creation of a
systematic environment. Since knowing the placement of the Poynting RFID Antennas
would have a prominent effect upon the performance of a RTLTS, it was determined
that the best placement of these antennas would be at the four corners of the Cubic
Testing Structure. At an approximate height of 4.5 feet, I used two cable ties to attach
the Poynting Antenna to the PVC Pipes at the corner of the Cubic Testing Structure. This
procedure was repeated for the other three Poynting Antennas at each respective
corner of the Cubic Testing Structure.
Upon completing the attachment of the four antennas to the Cubic Testing
Structure, one needed to establish a communication between the Sirit Reader and each
of the four Poynting Antennas. Therefore, for one of the four Poynting Antennas, a BNC
cable was obtained and one end of the cable was attached to the Antenna, and the
other end of the BNC cable into Input 1. Under a clockwise direction, the user moved
from the first corner of the structure to the next corner of the Cubic Testing Structure.
Once again, the BNC cable was attached to the corresponding Antenna and the other
end placed into Input 2 of the Sirit Reader. The same protocol was followed for the
third and fourth Poynting Antennas, while remembering to go in a clockwise direction
and placing the other end of the BNC cable into the Input that corresponded to the
numerical order previously established in this process. After ensuring that all antennas
were connected to the Sirit reader, an Ethernet cord was used to establish a

60
communication pathway between the laptop and the Sirit Reader. Finally, the
corresponding power-cord from an electrical outlet was connected to the Sirit Reader.
Once the connection had been made, it was ensured that the proper internet protocol
[IP] address of the Sirit Reader, which was identified on the device itself, was in
correlation with the designated laptop that was to be used prior to any usage. If proper
connections were made, the Sirit Reader displayed three lights that were illuminated in
green. Otherwise, one of the three lights had to be illuminated in green, and the user
had to ensure that all connections were properly made.
However, prior to being able to test the capability of the software program provided
by Mr. Tyler Peabody, it was of essence to first gain an understanding of the
programming language, in Visual Basic, that was utilized. In order to accomplish such a
feat, it was recommended to go from line to line, within the code, and identify the
primary commands of each line. Once the primary commands had been identified,
research tools, such as Microsoft Access Help Tool and the Internet, were used to gain
some insight regarding the basis and purpose behind each command, as the action that
is takes place due to the command. Table 2 illustrates the commands that had an
imminent role within the original software code:
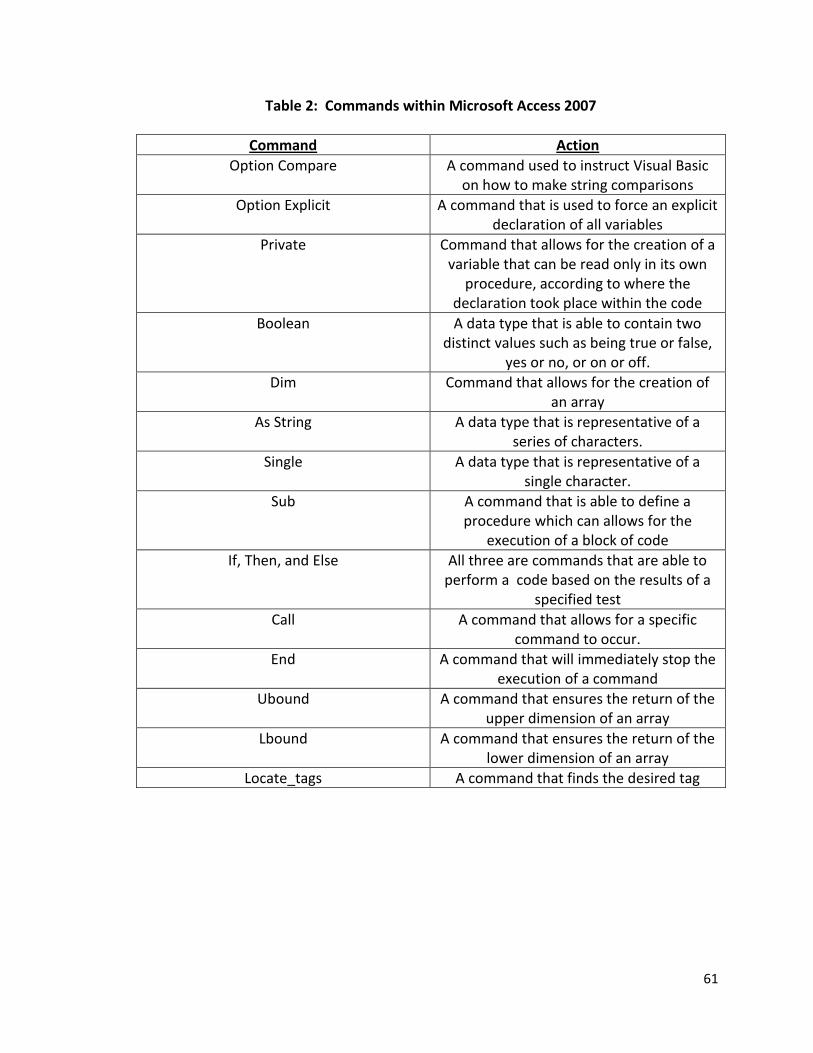
61
Table 2: Commands within Microsoft Access 2007
Command Action
Option Compare A command used to instruct Visual Basic on how to make string comparisons
Option Explicit A command that is used to force an explicit declaration of all variables
Private Command that allows for the creation of a variable that can be read only in its own
procedure, according to where the declaration took place within the code
Boolean A data type that is able to contain two distinct values such as being true or false,
yes or no, or on or off.
Dim Command that allows for the creation of an array
As String A data type that is representative of a series of characters.
Single A data type that is representative of a single character.
Sub A command that is able to define a procedure which can allows for the
execution of a block of code
If, Then, and Else All three are commands that are able to perform a code based on the results of a
specified test
Call A command that allows for a specific command to occur.
End A command that will immediately stop the execution of a command
Ubound A command that ensures the return of the upper dimension of an array
Lbound A command that ensures the return of the lower dimension of an array
Locate_tags A command that finds the desired tag

62
Understanding the commands of the software code, however, did not provide
sufficient enough knowledge to fully comprehend how, such a software program, was
able to provide information regarding the real time location of an object. Instead, an
analysis had to be conducted on the sequential placement of each command within the
software code, and how such a chronological order, of these commands, had a
prominent affect upon the performance and functionality of the entire system. In
essence, if one placed a specific command prior to another command within the code,
there was a distinct possibility that the system would function in a different manner
than that of which was desired. By recognizing this importance, focus was then placed
upon creating a visual representation of the progression of steps, between all the
different components of the entire Passive RFID System, which were of essence in being
able to provide an analysis of the real time location of an object. Therefore, the initial
schematic, seen in Figure 21, was simply based upon having a conceptual understanding
of the sequential order of the commands used within the software code designed by
Mr. Peabody.

63
While the schematic above represents the entire pathway, in which I believed the
software code was able to detect the location of a Passive RFID Tag, it was of
importance to note that the visual representation was still an educated estimation of
the entire process based upon knowledge on the progression of commands within the
code. Nonetheless, such a pathway was verified through the process of debugging each
line of the software code. In order to begin this verification process, it was first ensured
that each antenna was properly connected, with the BNC cords, to the Sirit Reader as
Figure 21: Visual Schematic of How Tyler Peabody’s Software Code Functions

64
stated previously. Similarly, it was ensured that the Sirit Reader and the laptop had
established a communication pathway through the attachment of the Ethernet cord.
Next, the user opened the designated file (‘ZoneTracker.aacdb’) with the program
Microsoft Access 2007. Once the program had been opened, the “Database Tools” Tab
was chosen and “Visual Basic” was selected. By doing such a procedural step, one
recognized that a new “Microsoft Visual Basic” window then appeared and contained
the entire software code in the text window. Before continuing, the user went back to
the Microsoft Access and ensured that the visual representation of the location tracker
of the object was present. An image of such a screen is seen in Figure 22.
If not, one would need to expand the “Unrelated Object” tab on the toolbar on the left
column. Under this tab, double click the “Zone Tracker” option to see the desired
visualization. In order to view the graphical summary of the location of the tracked
object and the code simultaneously, have both the Microsoft Access window and
Figure 22: Graphical Summary of the Location of Tracked Object in Microsoft Access 2007

65
Microsoft Visual Basic window side by side on the computer screen. Once the desired
view had been obtained, I began the debugging process by clicking the “Connect”
button, followed by the “Start Tracking” button within the Microsoft Access window.
While the tracking process was activated, one could place “debug” markers in the
software code by identifying the line of code that was to be evaluated and a marker was
placed on the left column by simply clicking the left button of the mouse.
Through an understanding of the purpose of each command and debugging the
software code while it was running, such a process allowed for a confirmation of how
the software code was able to track an RFID Passive Tag within the designed
environment. Once the user selected the “Connect” button followed by the “Start
Tracking” button, the software code first went through an initialization phase. In this
initialization phase, the software code first determined whether or not there already
existed a communication pathway. If not, the computer established and activated a
communication pathway between the computer and the reader. Once this procedural
step had been accomplished, the code sent a command to the Sirit Reader to process a
signal to establish the communication pathway between the reader and the four
antennas.
Following the establishment of these communication pathways, the software code
entered the “read phase.” In this phase, a specific line of software code allowed for the
user to modify the settings of the attenuation levels of each Poynting Antenna.
Similarly, another line of the code identified the identification number of the desired
RFID Passive Tag that would be tracked. Once the code surpassed these specific

66
command lines, the next command was associated with requiring the Sirit Reader to
allow for all four antennas to be in the continuous process of reading the desired tag.
While the antennas were continuously tracking the desired tag, the software code
also had an “evaluation phase.” In such a phase, there was a command line, within the
code, that provided correspondence between the identification number of the tag and a
designated image. This image had great importance as it could then be displayed,
within the Microsoft Access window, which would provide nine different zones in which
the tag could potentially be in. However, to approximate the location of the tag, the
software code had a command in which the reader analyzed which antennas were able
to recognize the desired tag. More specifically, below were the scenarios in which the
antennas may read the tag, and the corresponding regional zones can be seen in Figure
23:

67
- Zone 1: Read by Antenna 1 only - Zone 2: Read by Antenna 1 and 2 only - Zone 3: Read by Antenna 3 only - Zone 4: Read by Antenna 1 and 3 only - Zone 5: Ready by Antenna 1, 2, 3 and 4 - Zone 6: Read by Antenna 2 and 4 only - Zone 7: Read by Antenna 3 only - Zone 8: Read by Antenna 3 and 4 only - Zone 9: Read by Antenna 4 only.
Antenna #1
Antenna #2
Antenna #3
Antenna #4
Figure 23: Regional Zones of Environmental Setting

68
Once the reader was able to determine which antennas were able to read the
desired RFID Passive Tag, the reader sent the analysis to the computer to interpret the
results. The interpretation was seen through the visual display within the Microsoft
Access window. With an image associated with the tag, the image was then placed
within the corresponding zone that was previously determined by the reader. Such a
process continued to be repeated until the user selected “Stop Tracking” to turn off the
activation of the reader to signal the end of the experimental testing run.
Section 9: Evaluating Performance of Tracking RFID Passive Tag with Software Code by Tyler Peabody
With an understanding of the sequential order of the commands, within the
software code, and how it was able to function in unison, an evaluative test was
conducted on its performance on tracking a RFID Passive Tag. In this specific test, an
approach similar to that of the Landmarc study was implemented as the user assigned
each Poynting Antenna with a pre-determined attenuation value that represented the
correlation associated with the received signal strength [RSS] that was needed for the
reader to obtain information regarding a desired tag on an object. In essence, the
attenuation levels of the four RFID readers were used as a characteristic that provided a
broad definition of different regional zones in a room or environmental setting. Thus,
with this unique feature, the desired tag was identified into a specific zone by
determining which antennas, simultaneously, were able to promptly read the desired
tag within the environmental setting.
69
To establish the regional zones within the environmental setting, the user decided
upon using a specific attenuation level for all four Poynting Antennas. Once this
attenuation level had been determined, the regional zones were created by first
determining the read range of each of the antennas. In order to accomplish such a feat,
an Avery Dennison [AD]-224 RFID Passive tag was obtained and a portable hand-held
reader was used to identify the identification number of that specific tag. Next, the
software code in Visual Basic was accessed and the identification number was placed
into the command that identified the tag that was supposed to be tracked. Afterwards,
an attenuation level was proposed to be used for the performance test. User then
accessed the software code within Visual Basic, and the command line, in which the
attenuation levels of each Poynting Antenna could be modified, was identified. The
attenuation was then set for Antenna 1 [antenna connected to input 1] to the desired
attenuation level of 100 and the other three antennas to the maximum attenuation
level value of 350. Testing then began with the individual holding the tag flesh with the
side of the antenna, which was at a corresponding angle of 00 in relation to the side of
the antenna. Once in the proper position, the number of times that specific tag was
read by the Antenna over a five second time interval was recorded. Next, the individual
took a one-inch step backwards and once again the number of times that specific tag
was read was recorded. This step was repeated in the same line of path until the tag
was no longer reader by the antenna, which corresponded to the identification tag no
longer being seen in the summary page of the software program. And, this distance was
recorded. The same procedural step at an angle of 900, with respect to the other end of

70
the antenna, was repeated and the corresponding distance was measured. Since each
antenna could potentially have different read ranges due to an array of reasons, it was
highly recommended to repeat steps to determine the specific read range of each
Poynting Antenna within the environmental setting.
Once the read ranges had been determined for the four Poynting Antennas at an
attenuation level of 100, regional zones were then established within the environmental
setting. In order to construct such a zone, the process began with Antenna 1 and a
measuring tape was used to identify the maximum read range of the antenna [from the
direction of Antenna 1 to Antenna 2]. To indicate the max distance, a tape was placed
on the ground at that specific distance and was considered as length [L1]. Next, once
again the measuring tape was used to identify the maximum read range of Antenna 2
[from the direction of Antenna 2 to Antenna 1. This distance was indicated with another
piece of tape and this distance was referred to as length [L2]. To determine the zone
between Antenna 1 and Antenna 2, the guidance of the placements of the tape was
used. With this, it was determined that Zone 1 would only be the region that
corresponded to [L1], while Zone 2 corresponded to the overlap of the lengths [L1 – L2],
and Zone 3 was the length that only was L2. Figure 24 represents how the zones were
conducted with this protocol. Next, these procedural steps were repeated for each side
of the Testing Cubic Structure [i.e. for the side of Antenna 1 and Antenna 3, Antenna 2
and Antenna 4, and also Antenna 3 and Antenna 4]. By doing this, nine distinct zones
were established as the “regional zones” of the environmental setting.

71
Following the establishment of the regional zones, an analysis was conducted on the
performance of tracking the location of an object. The user accessed the software code
through Visual Basic and modified all four Poynting Antennas to each have the identical
attenuation level. The attenuation level chosen corresponded to the desired size of the
regional zone for the systemic environment. Next, it was ensured that the proper
identification tag number had been classified within the command that sought the tag
being tracked. Once these settings had been established, the individual stood within
Zone 1 and held the RFID Passive Tag at chest level facing the front direction. Once
settled within that position, the user selected “Start Tracking” to begin the
communication pathway of the entire system. For a time period of 5 seconds, it was
recorded whether or not the software code [through the visual representation seen in
Figure 24: Creation of Zone 1 and Zone 2 for the Environmental Setting of System

72
Microsoft Access] was able to recognize that the RFID Passive Tag was indeed within
Zone 1. Accuracy was defined to be the ability of the software code to properly depict,
in the Microsoft Access Interface, the regional zone in which the tag was within. After
the first time interval, the individual then moved into Zone 2 holding the tag in the exact
same position and direction and once again the accuracy of the detection process was
recorded. The same procedures for each of the nine zones were repeated. Once
completed, the user selected “Stop Tracking” to deactivate the communication
pathway.
While a RFID Passive tag could be located within the read range of the antenna, the
antenna component did not always read the tag. Potential reasons included the
directionality of the tag, as well as the possibility that the signals from the antenna had
to go through the human body. Therefore, these reasons were believed to have a
prominent effect upon the tracking the desired RFID Passive tag, thus testing protocol
also considered the directionality of the tag being located. Therefore, as performed
with the front direction, the same procedural steps were conducted for the backward
(Direction 2), left (Direction 3), right (Direction 4), 450 (Direction 5) and 1350 (Direction
6) directions. For visual clarification of these directionalities, one may reference
Section 6 in Appendix.
Aside from the directionality of the tag, another factor that was presumed to have a
prominent effect on the performance of the system was the height level of the antenna
in comparison to the height of the RFID Passive Tag being tracked. Thus, to manipulate
different height scenarios, all four antennas, within the Testing Cubic Structure, were

73
moved to a distance of one-foot higher than where the user had a tendency to hold the
Passive RFID tag. At this specific height, the performance of the software code was then
evaluated for all nine regional zones with all six corresponding directions that were
previously tested. In a similar capacity, all four antennas should then be placed at a
distance of one-foot lower than where the user has a tendency to hold the Passive RFID
tag. By manipulating a change in the height of the antenna, the user was able to
evaluate whether or not straight line of sight between antenna and the tag allowed for
maximum accuracy in reading the tag. A visual example of the three heights can be
seen in Appendix G.
While using the Testing Cubic Structure was able to provide a good testing
environment, it was important to note that there existed a limitation. It was associated
with the notion that the testing environment were neither able to expand nor shrink
since the antennas were in a fixed position, and thus the attenuation level remained at a
value of 100. However, it remained pertinent that the attenuation level values must be
evaluated to investigate the performance of the system. Thus, it was highly
recommended that the same procedural steps were conducted with the four RFID
Antenna Placeholder Stands. More specifically, under each attenuation level, an
environmental setting was created as done previously, and then the performance of the
system was tested under different scenarios, such as with the six different
directionalities and different height levels. To reference a more in-depth description of
the procedures, please reference Appendix H. Results from these tests could be seen in
Chapter IV, Section 5.

74
CHAPTER III: MODIFICATIONS TO COMPUTER SOFTWARE PROGRAM The goal of this study was to be able to establish a RFID system that was able to
provide real time location tracking of a pre-determined object. The software code,
designed by Mr. Tyler Peabody, provided a substantial basis in accomplishing such a
feat. However, there existed several persistent problems, which ultimately prevented
the software code from being ideal for this specific purpose and goal. The most
prominent problem consisted of the inaccuracy of the code to read the RFID Passive Tag
within each regional zone, as indicated by the inability for the software code to display
the tag within the proper zone in the Microsoft Access Interface. While there were
instances in which the antennas were able to accurately recognize the tag in the proper
zone, the problem became associated with a consistent delay of the visual display of the
tag in Microsoft Access. Even with these limitations, there still remained optimism in
using RFID components as a real time location tracking system. Thus, significant
modifications, to the software code, were considered to improve the performance of
the RFID system.
Section 1: Modifications for Ease of Operability of System An important component of the software code entailed the ability to modify the
attenuation levels of each antenna to obtain the desired read range for the testing
environment. As previously stated, this specific modification process required for the
user to access the software code in Visual Basic and then promptly identifying the
command line to modify such a setting. However, such a procedural step limited the
ease of operability of this RFID location tracking system. Thus, to establish a more user-

75
friendly operating system, the user no longer had to identify the specific command line,
within the software code, to change the attenuation level. Instead, such a modification
setting should be able to be altered in the same Microsoft Access Interface that allowed
for the user to view the graphical summary of the location of the tracked object. In
order to accommodate such an alteration, the software code was modified in a manner
that contained two distinct command lines that both feature the input function. The
first “input” command function was associated with a specific text box within the
Microsoft Access interface, in which the user was be able to type in the numerical
identification of the antenna into the textbox. The second “input” command featured
the ability for the user to indicate, within the Microsoft Access interface, the
attenuation level in which each of the previously identified antennas possessed. Once
complete, the user was able to select the newly established “Set Attenuation” button
that enabled the software code to acknowledge and accept the new systemic settings.
In a similar manner, the user could potentially experience some complexity in
directing the RFID real time location tracking system in identifying the desired tag to be
tracked. Once again, it was recognized that the original software code was designed for
the user to be able to identify the specific command window that acknowledged the
identification number of RFID Passive Tag to be read. However, such a process could be
further simplified. As was done with the attenuation levels, the input function was
once again utilized to allow for the user to adjust the identification number of the RFID
Passive Tag desired to be tracked. The “Student Info” tab was constructed within the
Microsoft Access interface. Within this specific tab, the user was be able to type in the

76
identification number for the desired Passive RFID tag within the textbox instead of
modifying the identification number within the software code in Visual Basic. Once the
user completed this task, the software code recognized the specific Passive RFID tag was
the one to be tracked once the “tracking” process was initiated.
Section 2: Modifications for Delay of Visual Representation in Microsoft Access Interface
In earlier studies conducted with the original software code, experimental results
had indicated that there existed several significant issues regarding the performance of
the RFID real time location tracking system. Therefore, modifications to the code had to
extend beyond just making the system easier to operate for the user, but in a way that
would enhance the performance of the system. One prominent issue that was noted
was associated with the notion that there were instances in which the antennas were
indeed able to identify the proper regional zone that the desired tags was located
within. However, the visual representation, seen on the Microsoft Access, was often
delayed in providing a precise real time location of the tag.
In order to resolve this persistent issue, debugging protocols were first conducted
upon the “evaluative” phase of the code, which included the command lines that were
designated to inform how the software would identify the tag within the appropriate
regional zone. As the reason stated previously, this approach was indeed quite pertinent
as it provided significant insight upon the process of how the software code truly was
functioning. It was recognized that one cycle, which took up to a tenth of a second, was
defined as the completion of each of the four antennas broadcasting a signal in an

77
attempt to read the Passive RFID tag being tracked. Once a cycle had been completed,
the software code then underwent a process that analyzed the approximate regional
zone in which the object was supposedly located. However, over a time interval of one
second, there were approximately ten cycles that occurred. As the number of cycles
continued to accumulate over an extended time period, the software code was unable
to remain on pace in processing the information and often caused for a delay in the
display of the location of the object in the Microsoft Access Interface.
Aside from the overload in analyzing each cycle, the debugging process also
illustrated that another prominent affect on the delay of the visual representation was
associated with another feature of the software code. More specifically, while the
software code was primarily designed on locating the identification number of the
desired Passive RFID tag, it still possessed the ability to recognize other Passive RFID
tags located within the vicinity of the environmental setting. Even though these specific
tags were not acknowledged within the “evaluation” process of the software code, a
database was still established, within the Microsoft Access interface, and stored these
identification tag numbers within its memory. This additional feature contributed to the
delay of the visual representation seen in Microsoft Access.
In order to enhance the response of the visual representation seen in Microsoft
Access, modifications to the original code were considered. First, it was highly
reasonable to believe that there existed no purpose in maintaining a database that
stored the identification numbers of other existing tags, which were located within the
vicinity. Therefore, initial efforts were placed upon eliminating such a feature within the

78
software code. Upon removing the command line responsible for such a feature, it was
immediately seen that all antennas, within the environmental systems, were still able to
recognize these undesired RFID Passive tags. However, these identification numbers of
those undesired tags were no longer being stored within a database established in
Microsoft Access, but were rather disregarded by the software code. Such a
modification was important as the software code allowed for not only an alleviation of
the memory space within Microsoft Access interface, but a greater ability for the system
to focus upon locating only the desired RFID Passive Tag that had been acknowledged
within the software code.
Yet, even though such a modification showed an enhancement in the performance
of the system, it was still of great importance to note that such an alteration only had a
minimal effect upon the response time of the visual display. In fact, such an
improvement was only seen in the early phases of the testing time interval, as there
were only a limited number of cycles in which the software code had to analyze. Once
the interface encountered a compilation of additional cycles to evaluate the location of
the tag, the system no longer was able to remain proficient in providing such an
analysis. As a result, there remained a significant delay in showing the location of the
tag on the visual representation in the Microsoft Access interface.
In an attempt to resolve this dilemma, modification was considered with the primary
definition of “cycle” within the software code. As previously stated, the original
software code consisted of identifying a “cycle” as the process in which each of the four
antennas was required to broadcast a signal, under a sequential order, in an attempt to

79
read the Passive RFID tag being tracked. Once a cycle had been completed, the RFID
reader processed which antennas were able to recognize and read the tag being
tracked. Such an analysis was transmitted to the visual representation within the
Microsoft Access interface. This process continued to occur until the entire system was
required to “Stop Tracking.”
To address the limitation, one potential solution was introduced. In such a
proposed solution, modification was conducted upon the command line that identified
the definition of a “cycle.” As one cycle occurred every tenth of a second, the system
had a significant delay in response due to an abundance of cycles being evaluated.
Therefore, the suggested modification involved an increase in the time interval of each
cycle. More specifically, the new cycle was defined as each of the four antennas
broadcasting a signal, under a sequential order, for not only one round, but rather for a
process of ten rounds. With such a modification, the software code no longer had to
evaluate and display the results onto the interface after just one round, or every tenth
of a second. Instead, data was acquired, regarding which antennas recognized the tag
being tracked, every second and then results were stored within a database. After ten
rounds, an analysis was conducted on the results stored in the database. If results
indicated that an antenna were able to recognize the Passive RFID tag all ten rounds,
within that cycle, then the object was placed into the corresponding regional zone in the
visual representation seen in the Microsoft Access interface. Otherwise, if none of the
four antennas were able to recognize the tracked tag for at least all ten rounds, then the

80
visual representation suggested to the user that the tag is “out of range” and was
believed to not be located in any of the regional zones.
Aside from the modification of the definition of the cycle, another prominent change
to the software code included the implementation of what was referred to as the
“delay” feature. Again, as the goal remained to be alleviating the reader from
processing too much analysis simultaneously, the “delay” feature allowed for the reader
to have a pre-determined time interval that distinctly separates two vastly different
cycles. This time delay interval, suggested to be about 50 milliseconds, allowed
additional time for the reader to analyze the data prior to advancing to another cycle
that was to be analyzed.
The modification in the meaning of the term “cycle,” as well as the addition of the
“delay” feature, in the software code enabled the system to encounter fewer cycles to
analyze the approximate position of the RFID Passive Tag being evaluated. As there
were fewer cycles and more time between each cycle, the entire system was able to
properly maintain a consistent response time for each analysis and this resulted in
consistent display of the location in the visual representation without any delay. While
these two modifications promoted a more rapid response time to depict the location of
the object within the visual representation, the accuracy of the system remained quite
suspect.

81
Section 3: Modifications to Enhance Performance of RFID Real time Location Tracking System
After being able to enhance the response time for the visual schematic of the
location of the object, the focus was then shifted toward developing the accuracy of the
entire system to provide the precise real time location of the object. At this point in
time, the accuracy remained quite limited since results showed that it was a rarity for
any of the four antennas to recognize the identification number, of the desired tag, for
all ten rounds of each cycle. With this limitation, it was then suggested that
modifications were then made to incorporate a command line that identified a new
feature referred to as a “cutoff point.”
While a cycle continued to consist of ten rounds of each antenna broadcasting a
respective signal, a “cutoff point” was incorporated into the software code. In essence,
this new feature allowed for the user to determine whether or not each antenna was
able to read a tag all ten times during a cycle to conclude that, with an absolute
certainty, the tag was in a specific regional zone within the environmental setting. If it
was verified that such a value was indeed quite excessive, the user was given an
opportunity, with the “cutoff point” command, to modify such a value to another
distinct integer value, which was considered as the “new” acceptable level of reads, for
each of the four antennas. Therefore, once a cycle had been completed, the reader
determined which antennas were able to recognize the identification number, of the
tracked tag, for the desired “cutoff point.” Once such an analysis was complete, the
reader provided a communication with the software code. Next, the proper regional
zone was determined, through the definitions established within the software code,

82
before promptly displaying the results on the visual schematic seen in the Microsoft
Access Interface.
Following the addition of the “cutoff point” feature within the system, it was
suggested that the ease of recognizing the end of cycle could be had by simply having a
counter display on the visual representation seen in the Microsoft Access Interface.
Thus, five distinct textboxes were designed in this specific interface. The first textbox,
showed a visual display of the number of rounds that had been completed within that
cycle. With such a display, the user was able to easily recognize when a cycle was about
to begin or end. In regards to the other textboxes seen, each textbox corresponded to
an Antenna in the environmental setting. Each of these textboxes was able to display a
counter of how many times each antenna was able to recognize the tag being tracked
within the corresponding cycle.
With the establishment of the counter display, I conducted a test to evaluate an
acceptable “cutoff point” value for this specific RFID Real time Location Tracking System.
More specifically, the test was designed to evaluate the performance of the system at
different integer values between 1 and 10. Thus, it was recommended that testing
procedures were once again replicated to those conducted previously in this study.
More specifically, I first evaluated the “cutoff value” at the integer value of 10. Once
the appropriate settings were properly identified in the software code, an individual was
asked to stand within Zone 1, and held the RFID Passive Tag at chest level facing the
front direction. Once settled within that position, the user selected “Start Tracking” to
begin the communication pathway of the entire system. After the completion of each

83
cycle, which was indicated by the counter feature that was implemented, the user was
asked to record whether or not the software code [through the visual representation
seen in Microsoft Access] was able to recognize that the RFID Passive Tag is indeed
within Zone 1. After recording the corresponding data, the individual moved into Zone 2
holding the tag in the same orientation. The same procedures were repeated for each
of the nine zones. Once completed, the user selected “Stop Tracking” to deactivate the
communication pathway. This protocol was repeated for other integer values that were
in existence between 1 and 10 [Results from such an analysis can be seen in the Results
Section]. Ultimately, it was recognized that the most accurate results were obtained
with the “cutoff value” of 3, and therefore was used in this software code. Nonetheless,
it was important to note that the user may change this value in the software code if
desired. Please Reference Appendix J for A Guidance for the Visual Display Seen in
Microsoft Access 2007.

84
CHAPTER IV: EVALUATION OF MODIFICATION TO COMPUTER SOFTWARE PROGRAM
Even though each modification was believed to ensure an enhancement in the
performance of the system, in providing a real time location of a desired object, results
were still needed to validate such a claim. Therefore, it was of importance to note that
it was highly recommended that the evaluative protocols remained consistent without
any significant modifications to establish a correlation between each test. With this in
mind, the exact same procedural steps, used to evaluate the original software program,
were once again conducted for this specific study. These protocols were previously
referenced in Appendix H. While the same procedural steps were implemented in this
study, different circumstances were considered and evaluated.
Section 1: Evaluating the Performance of Tracking One Singular Object [with one Passive RFID tag]
The primary purpose of this study was to provide a form of assistance in allowing for
an individual, with a visual impairment, to recognize their precise location within an
environmental setting. Therefore, with this specific RFID real time tracking location
system, the first evaluative performance was conducted upon the accuracy of tracking
one singular object, which would be a human subject. However, there were different
factors which had profound impact upon the read accuracy of the system. It was also
these factors, listed below, that had to be taken into consideration when evaluating the
performance of tracking one singular object with only one Passive RFID tag.
85
- Different Attenuation Levels of Each Antenna: The attenuation levels of each
antenna had a prominent role, upon this specific system, as an alteration in such
a factor affected the read range distance of each antenna. With this, the user
had to determine the appropriate read range distance, that best suited the
systemic environment, by choosing an attenuation level between the values of 0
[maximum read range distance] to 350 [minimum read range distance].
o For this specific study, a systemic environment was created with the
attenuation levels of 0, 15, 30, 50 and 100 for each of the four antennas.
This allowed for distinguishing the maximum read range of the antenna
at each of the four levels of attenuation, as well as the accuracy of
tracking a singular object by not only maximizing the size of the testing
environment, but also by reducing the size of such an environment.
- Directionality of Passive RFID Tag: Another potential effect upon the accuracy
of this real time tracking location system was the directionality of the Passive
RFID tag. While it was known that an individual possessed a Passive RFID tag, it
was important to note that not only did the position of the object affect the
accuracy of being able to distinguish the location of the object, but also the
directionality of the tag.
o In order to assess the effect of such a factor, the human test subject was
asked to remain in the same location of a regional zone, but under six
vastly different directions. Images of these directions could be seen in
Appendix I.
86
- Height Location of Each Antenna: Similar to that of the directionality of the
Passive RFID Tag, the height difference of the antenna, in comparison to that of
the tag, was said to be a factor that could alter the accuracy of the system. The
reason for this was that readings were more precise if there was a straight line of
sight between the tracked Passive RFID tag and the corresponding antennas.
o Therefore, to investigate such a claim, the three distinct heights were
used for each antenna. The first height corresponded to a measurement
in which all four antennas had a straight line of sight to the Passive RFID
tag. The second height, to be evaluated, was one-foot above the straight
line of sight to the Passive RFID tag. Finally, the third height was one-foot
below the straight line of sight to the Passive RFID tag. Visual
Representation of different heights can be seen in Appendix G.
Section 2: Evaluating the Performance of Tracking Two Objects Simultaneously [with one Passive RFID tag each]
If an individual, with a visual impairment, were to participate in an activity, such as
the sport of basketball, the focus of a real time location tracking system should not be
solely based upon identifying the location of just the individual. Instead, it should have
the capability of simultaneously being able to track a second object, whether it was
another individual or a basketball. In this specific evaluation, each object was identified
through only one distinct Passive RFID tag each. Once these tags had been identified,
the accuracy of the system was then be evaluated. More specifically, the same factors

87
that were previously analyzed, in the performance of just tracking one object, were all
evaluated for tracking two objects simultaneously. Results can be seen in Appendix R.
Section 3: Evaluating the Performance of Tracking One Singular Object with Multiple RFID Passive Tags
Within the modifications of the new software program, the user now had the ability
to recognize a single object with multiple RFID Passive Tags. With such a capability, it
was investigated whether or not the performance of the real time location tracking
system was enhanced. Thus, in this specific analysis, the user identified a singular object
with multiple tags. In the first scenario, a singular object was identified with two
different RFID Passive Tags. In the second and third scenarios, a singular object was
identified with three and four different RFID Passive Tags, respectively. However, for
each scenario, each factor that was considered previously must once again be
evaluated. Data was analyzed by identifying the accuracy results from each scenario
and results were compared to the performance of tracking one singular object with just
one RFID Passive Tag.

88
CHAPTER V: RESULTS
Section 1: Feasibility Test with RFID System Components Aside from gaining a sense of familiarity with the array of Radio Frequency
Identification components at PolyGait, a feasibility test was conducted to assess the
potential of such a system in being able to first recognize the different tags present
within the environmental setting. Therefore, as stated previously, one of the Passive
RFID Antenna Placeholder Stand and the pre-assigned program setting, by Sirit, were
used to conduct such a feasibility test. Table 3 to Table 6 consists of results of not only
the identification number of tags recognized by the Antenna within its read range, but
also a numerical count of how many times each of those tags were read over a specified
period of time.
Table 3: Feasibility Test for Time Interval of 5 Seconds
Tag Identification Number Number of Times Read
050430080000000000000BFB 145
050430080000000000000BF7 97
050430080000000000000BFC 83
050430080000000000000BFD 2896
050430080000000000000CFF 61
050430080000000000000CFG 568
050430080000000000000DFA 103
050430080000000000000DFB 611
Total Reads: --- 4564

89
Table 4: Feasibility Test for Time Interval of 15 Seconds
Tag Identification Number Number of Times Read
050430080000000000000BFB 583
050430080000000000000BF7 434
050430080000000000000BFC 603
050430080000000000000BFD 7895
050430080000000000000CFF 252
050430080000000000000CFG 1873
050430080000000000000DFA 463
050430080000000000000DFB 1967
Total Tags Read: --- 14,070
Table 5: Feasibility Test for Time Interval of 30 Seconds
Tag Identification Number Number of Times Read
050430080000000000000BFB 1233
050430080000000000000BF7 1347
050430080000000000000BFC 2034
050430080000000000000BFD 15,343
050430080000000000000CFF 897
050430080000000000000CFG 3,278
050430080000000000000DFA 923
050430080000000000000DFB 3,92
Total Tags Read: --- 28,597
Table 6: Feasibility Test for Time Interval of 60 Seconds
Tag Identification Number Number of Times Read
050430080000000000000BFB 2583
050430080000000000000BF7 2868
050430080000000000000BFC 4,239
050430080000000000000BFD 30,113
050430080000000000000CFF 2,980
050430080000000000000CFG 6,432
050430080000000000000DFA 2,004
050430080000000000000DFB 7,894
Total Tags Read: --- 59,113

90
While the specific feasibility test was designed to determine the number of times a
Passive RFID Tag was read within the range of a Poynting Antenna, it was implemented
with different time intervals. Table 3 represented data that was obtained for a time
interval of 5 seconds, while Table 4, 5, and 6 represented the time interval of 15
seconds, 30 seconds, and 60 seconds respectively. Even though each of the feasibility
tests was conducted with different time intervals, it was evident that there were 8
distinct Passive RFID tags that were continuously identified within the read range of the
Poynting Antenna that was used. Under each of the test scenarios conducted in the
test, it was seen that all eight of the Passive RFID tags were not read for an identical
amount of times. Instead, some tags were read more often than others, as the Passive
RFID Tag with the identification number of “050430080000000000000BFD” was read
the most frequently in each of the time intervals. The reason for this could be
attributed to the notion that specific tag was closer in proximity to the antenna in
comparison to the other tags. As expected, it was seen that, with an increase in the
time interval, each of the Passive RFID tags were read at greater quantities.
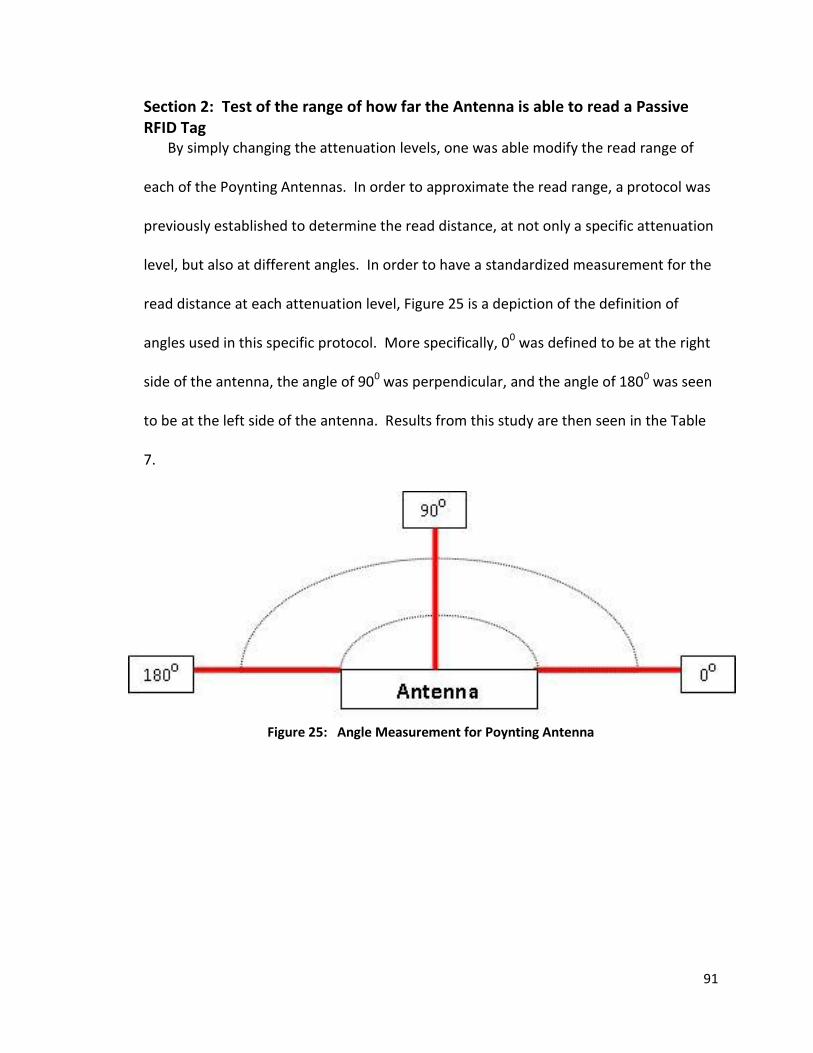
91
Section 2: Test of the range of how far the Antenna is able to read a Passive RFID Tag By simply changing the attenuation levels, one was able modify the read range of
each of the Poynting Antennas. In order to approximate the read range, a protocol was
previously established to determine the read distance, at not only a specific attenuation
level, but also at different angles. In order to have a standardized measurement for the
read distance at each attenuation level, Figure 25 is a depiction of the definition of
angles used in this specific protocol. More specifically, 00 was defined to be at the right
side of the antenna, the angle of 900 was perpendicular, and the angle of 1800 was seen
to be at the left side of the antenna. Results from this study are then seen in the Table
7.
Figure 25: Angle Measurement for Poynting Antenna
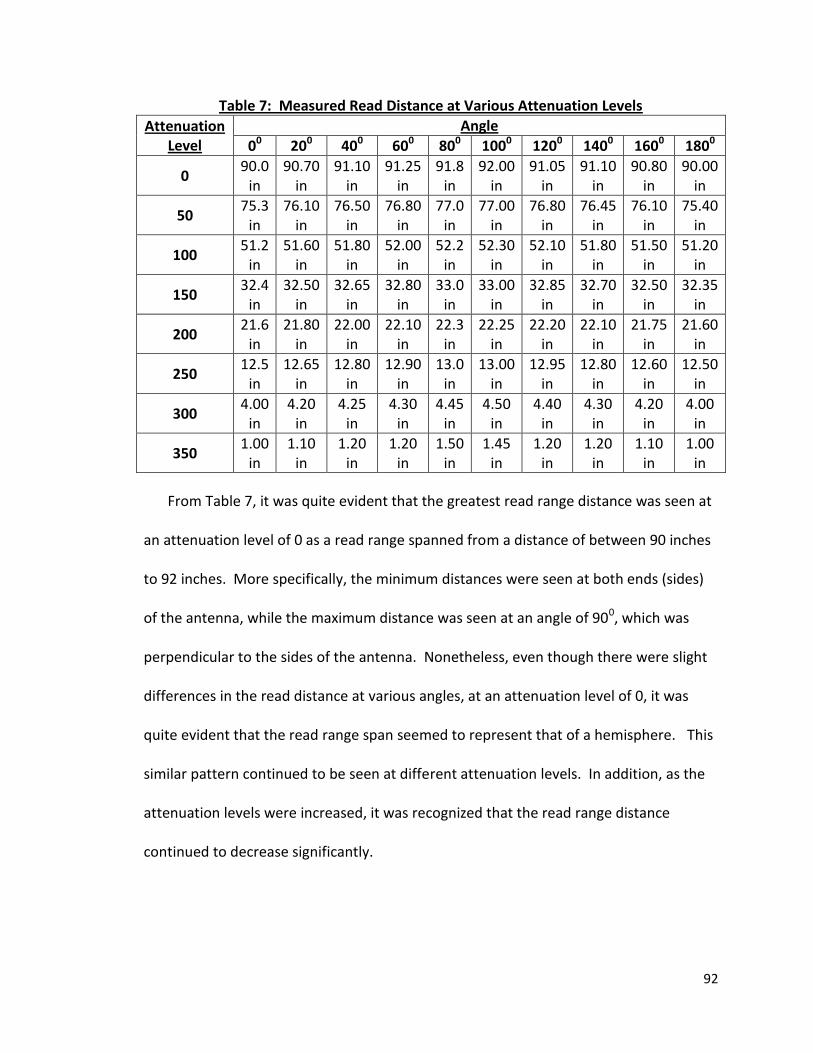
92
Table 7: Measured Read Distance at Various Attenuation Levels
Attenuation Level
Angle
00 200 400 600 800 1000 1200 1400 1600 1800
0 90.0
in 90.70
in 91.10
in 91.25
in 91.8
in 92.00
in 91.05
in 91.10
in 90.80
in 90.00
in
50 75.3
in 76.10
in 76.50
in 76.80
in 77.0
in 77.00
in 76.80
in 76.45
in 76.10
in 75.40
in
100 51.2
in 51.60
in 51.80
in 52.00
in 52.2
in 52.30
in 52.10
in 51.80
in 51.50
in 51.20
in
150 32.4
in 32.50
in 32.65
in 32.80
in 33.0
in 33.00
in 32.85
in 32.70
in 32.50
in 32.35
in
200 21.6
in 21.80
in 22.00
in 22.10
in 22.3
in 22.25
in 22.20
in 22.10
in 21.75
in 21.60
in
250 12.5
in 12.65
in 12.80
in 12.90
in 13.0
in 13.00
in 12.95
in 12.80
in 12.60
in 12.50
in
300 4.00
in 4.20
in 4.25
in 4.30
in 4.45
in 4.50
in 4.40
in 4.30
in 4.20
in 4.00
in
350 1.00
in 1.10
in 1.20
in 1.20
in 1.50
in 1.45
in 1.20
in 1.20
in 1.10
in 1.00
in
From Table 7, it was quite evident that the greatest read range distance was seen at
an attenuation level of 0 as a read range spanned from a distance of between 90 inches
to 92 inches. More specifically, the minimum distances were seen at both ends (sides)
of the antenna, while the maximum distance was seen at an angle of 900, which was
perpendicular to the sides of the antenna. Nonetheless, even though there were slight
differences in the read distance at various angles, at an attenuation level of 0, it was
quite evident that the read range span seemed to represent that of a hemisphere. This
similar pattern continued to be seen at different attenuation levels. In addition, as the
attenuation levels were increased, it was recognized that the read range distance
continued to decrease significantly.

93
Section 3: Test of the presence of the vast array of Passive RFID tags within the testing environment
By establishing the maximum distance that the antenna may read at different
angles, the user was able to obtain an approximate read range that the antenna was
able to identify not only one Passive RFID tag, but rather multiple tags. Therefore, as
stated within the protocol stated in Chapter II [Section 5], five distinct tags were placed
within the read range of the antenna, which had a pre-defined attenuation level. After a
time interval of 15 seconds, it was then determined whether or not each of the five
distinct Passive RFID tags were read by the antenna. This was repeated three times for
each attenuation level. Results can then be seen within Table 8.

94
Table 8: Summarized Table of Number of Tags Read Within Testing Environment Under Different Attenuation Levels
Passive RFID Tags
Attenuation Level
Test Run Number
Tag #1 Tag #2 Tag #3 Tag #4 Tag #5 Total Tags Read
0 1 1 1 1 1 1 5
2 1 1 1 1 1 5
3 1 1 1 1 1 5
Total Tags Read: 3 3 3 3 3 ---
50 1 1 1 1 1 1 5
2 1 1 1 1 1 5
3 1 1 1 1 1 5
Total Tags Read: 3 3 3 3 3 ---
100 1 1 1 1 1 1 5
2 1 1 1 1 1 5
3 1 1 1 1 1 5
Total Tags Read: 3 3 3 3 3 ---
150 1 1 1 0 1 1 4
2 1 1 1 1 1 5
3 1 1 1 1 1 5
Total Tags Read: 3 3 2 3 3 ---
200 1 1 1 1 0 1 4
2 1 1 1 1 1 5
3 1 1 0 1 1 4
Total Tags Read: 3 3 2 2 3 ---
250 1 0 1 1 1 1 4
2 1 1 1 1 1 5
3 1 1 1 1 1 5
Total Tags Read: 2 3 3 3 3 ---
300 1 1 1 1 1 1 5
2 1 1 1 1 1 5
3 1 1 1 1 1 5
Total Tags Read: 3 3 3 3 3 ---
350 1 1 1 1 1 1 5
2 1 0 1 1 1 4
3 1 1 1 1 1 5
Total Tags Read: 3 2 3 3 3 ---

95
As seen in Table 8, three distinct test runs were conducted for each of the pre-
determined attenuation levels. However, for each of the three test runs, the five
distinct Passive RFID tags were placed in different locations within the acceptable read
range determined in Table 7. At attenuation levels of 0, 50, 100, and 300, it was seen
that each of the Passive RFID tags were properly distinguished by the Poynting Antenna
of the system. However, at the attenuation levels of 150, 200, 250, and 350, there were
several instances in which several of the Passive RFID tags were unable to be identified.
Nonetheless, there were no more than two occurrences, in which a tag was
unidentifiable, at each attenuation level. Therefore, within this study, it was seen that
Passive RFID Tags were identified at least 86.67% (13/15) of the time.
Section 4: Test of the Number of Times a Passive RFID tag is read through different activities
While the last several evaluative tests served the sole purpose of identifying the
feasibility of whether or not Passive RFID Tags were read in a pre-defined environment,
it was important to recognize that each of the tags remained stationary. Therefore, it
was proposed to conduct a series of evaluative tests to analyze whether or not the RFID
components would still provide sufficient reads through different activities that
incorporate some form of motion. As stated previously, a time interval of 15 seconds
was implemented for each activity that was evaluated and results are seen in Table 9 to
Table 14.

96
Table 9: Number of Times Passive RFID Tag is Read for Activity #1- Test Subject Walks, within Environmental Setting, with Passive RFID Tag Time Interval: 15 Seconds Attenuation Level: 0
Test Run Tag Identification Number Number of Times Read
1 050430080000000000000BFB 2,348
2 050430080000000000000BFB 1,674
3 050430080000000000000BFB 2,229
For data that was obtained for Table 9, a human test subject was asked to walk, with
a Passive RFID Tag, within the read range of the system, at an attenuation level of 0, for
a time interval of 15 seconds. This test was repeated for three distinct test runs and it
was seen that the Passive RFID Tag was read quite frequently by the Poynting Antenna.
The minimum number of times read was seen in Test Run #2, as the tag was only read
1,674 times, with the maximum number of reads seen to be at 2,348 times in Test Run
#1.
Table 10: Number of Times Passive RFID Tag is Read for Activity #2- Test Subject Jogs, within Environmental Setting, with Passive RFID Tag Time Interval: 15 Seconds Attenuation Level: 0
Test Run Tag Identification Number Number of Times Read
1 050430080000000000000BFB 1,228
2 050430080000000000000BFB 897
3 050430080000000000000BFB 1,102
For data that was obtained for Table 10, a human test subject was asked to jog, with
a Passive RFID Tag, within the read range of the system, at an attenuation level of 0, for
a time interval of 15 seconds. This test was repeated for three distinct test runs and it
was seen that the Passive RFID Tag was once again read quite frequently by the

97
Poynting Antenna. The minimum number of times read was seen in Test Run #2, as the
tag was only read 897 times, with the maximum number of reads seen to be at 1,228
times in Test Run #1.
Table 11: Number of Times Passive RFID Tag is Read for Activity #3- Test Subject Walks, within Environmental Setting, with Passive RFID Tag inside Nerf Ball Time Interval: 15 Seconds Attenuation Level: 0
Test Run Tag Identification Number Number of Times Read
1 050430080000000000000BFB 1,023
2 050430080000000000000BFB 967
3 050430080000000000000BFB 899
For data that was obtained for Table 11, a human test subject was asked to walk,
with a Passive RFID Tag inside a Nerf Ball, within the read range of the system, at an
attenuation level of 0, for a time interval of 15 seconds. This test was once again
repeated for three distinct test runs and it was seen that the Passive RFID Tag was often
recognized by the Poynting Antenna. The minimum number of times read was seen in
Test Run #3, as the tag was only read 899 times, with the maximum number of reads
seen to be at 1,023 times in Test Run #1.
Table 12: Number of Times Passive RFID Tag is Read for Activity #4 - Test Subject Jogs, within Environmental Setting, with Passive RFID Tag inside Nerf Ball Time Interval: 15 Seconds Attenuation Level: 0
Test Run Tag Identification Number Number of Times Read
1 050430080000000000000BFB 767
2 050430080000000000000BFB 804
3 050430080000000000000BFB 732

98
For data that was obtained for Table 12, a human test subject was asked to jog, with
a Passive RFID Tag inside a NERF ball, within the read range of the system, at an
attenuation level of 0, for a time interval of 15 seconds. This test was repeated for three
distinct test runs and it was seen that the Passive RFID Tag was once again read quite
frequently by the Poynting Antenna. The minimum number of times read was seen in
Test Run #3, as the tag was only read 732 times, with the maximum number of reads
seen to be at 804 times in Test Run #2.
Table 13: Number of Times Passive RFID Tag is Read for Activity #5- Test Subjects Roll Nerf Ball, with Passive RFID Tag inside, Back and Forth within Environmental Setting Time Interval: 15 Seconds Attenuation Level: 0
Test Run Tag Identification Number Number of Times Read
1 050430080000000000000BFB 723
2 050430080000000000000BFB 756
3 050430080000000000000BFB 747
For data that was obtained for Table 13, a human test subject was asked to roll a
NERF ball, with a Passive RFID Tag inside, within the read range of the system, at an
attenuation level of 0, for a time interval of 15 seconds. This test was repeated for three
distinct test runs and it was seen that the Passive RFID Tag was once again read quite
frequently by the Poynting Antenna. The minimum number of times read was seen in
Test Run #1, as the tag was only read 723 times, with the maximum number of reads
seen to be at 756 times in Test Run #2.

99
Table 14: Number of Times Passive RFID Tag is Read for Activity #6 - Test Subjects Throws Nerf Ball, with Passive RFID Tag inside, Back and Forth within Environmental Setting Time Interval: 15 Seconds Attenuation Level: 0
Test Run Tag Identification Number Number of Times Read
1 050430080000000000000BFB 689
2 050430080000000000000BFB 704
3 050430080000000000000BFB 714
For data that was obtained for Table 14, a human test subject was asked to
continuously throw the NERF ball, with a Passive RFID Tag inside, within the read range
of the system, at an attenuation level of 0, for a time interval of 15 seconds. This test
was repeated for three distinct test runs and it was seen that the Passive RFID Tag was
once again read quite frequently by the Poynting Antenna. The minimum number of
times read was seen in Test Run #1, as the tag was only read 689 times, with the
maximum number of reads seen to be at 714 times in Test Run #3.
Overall Summary The primary purpose of the evaluative tests conducted in this section was to analyze
whether or not the RFID components were able to provide sufficient reads through
different activities that incorporated some form of motion. It was seen that the Passive
RFID Tag was read at a greater rate through the activity of simply just walking in
comparison to the other activities. More specifically, once the human test subject was
asked to begin jogging within the read range, the read rate decreased slightly due to the
rapid movement of the tag causing for the antenna to have more of a difficulty in
identifying the tag. In similar manner, since the antenna would be forced to send

100
radiofrequency signals through the material of the NERF Ball, one expected to have a
decrease in read rates and this was indeed seen.
Section 5: Evaluating Performance of Tracking RFID Passive Tag with Software Code by Tyler Peabody
While the original code, provided by Mr. Tyler Peabody, provided a foundation for
establishing a Real time Location Tracking System with RFID components, it was
important to recognize that it remained far from being ideal. The reason for such
pessimism was associated with the notion that previous experimental tests, with this
specific code, had shown that the detection rate was quite inaccurate. Therefore, to
validate such a claim, evaluative tests, in order to analyze the performance of the
system, were conducted for six different tag directions (as seen in Appendix G), at six
different attenuation levels (0, 15, 30, 50, 100), and three distinct height levels, which
were the following:
Height 1: The first height corresponded to a measurement in which all four
antennas had a straight line of sight to the Passive RFID tag.
Height 2: The second height, to be evaluated, was one-foot above the straight
line of sight to the Passive RFID tag.
Height 3: The third height was one-foot below the straight line of sight to the
Passive RFID tag.
Table 15 shows the summary of the system’s accuracy, while the more in-depth
results can be seen Appendix K.
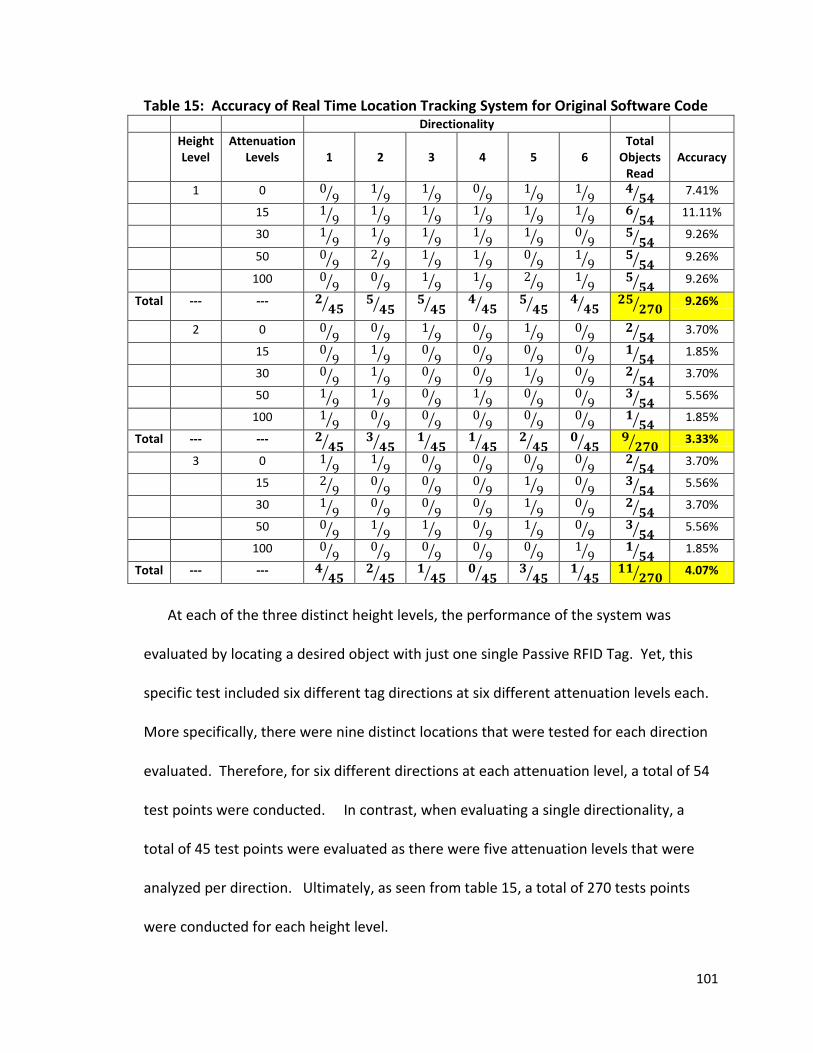
101
Table 15: Accuracy of Real Time Location Tracking System for Original Software Code Directionality
Height Level
Attenuation Levels
1
2
3
4
5
6
Total Objects
Read
Accuracy
1 0
7.41%
15
11.11%
30
9.26%
50
9.26%
100
9.26%
Total --- ---
9.26%
2 0
3.70%
15
1.85%
30
3.70%
50
5.56%
100
1.85%
Total --- ---
3.33%
3 0
3.70%
15
5.56%
30
3.70%
50
5.56%
100
1.85%
Total --- ---
4.07%
At each of the three distinct height levels, the performance of the system was
evaluated by locating a desired object with just one single Passive RFID Tag. Yet, this
specific test included six different tag directions at six different attenuation levels each.
More specifically, there were nine distinct locations that were tested for each direction
evaluated. Therefore, for six different directions at each attenuation level, a total of 54
test points were conducted. In contrast, when evaluating a single directionality, a
total of 45 test points were evaluated as there were five attenuation levels that were
analyzed per direction. Ultimately, as seen from table 15, a total of 270 tests points
were conducted for each height level.

102
Upon the completion of conducting this specific evaluative test, it was quite evident
that the accuracy of the system was greatest at Height Level 1, in which the tag would
have a direct line of sight to the antenna. It was seen that the total accuracy read rate
was at 9.26% since 25 out of the 270 test points were accurately read by the system. By
either increasing or decreasing the height level of antenna, it was seen that the accuracy
of the system decreased to 3.33% (9 out of 270 points were accurately read) and 4.07%
(11 out of 270 points were accurately read) respectively. In regards to the directionality
of the tag, more reads were obtained for Direction 3 and Direction 5 for Height Level 1.
However, these directions were not as prominent for Height Level 2 or Height Level 3.
Nonetheless, the accuracy results for an RTLTS, based upon the original software code,
were quite low. While such low read accuracy rates were undesirable, it remained quite
important to recognize the significance of how such a code was still able to provide a
basis for how to implement Passive RFID into a real time location tracking system.

103
Section 6: Evaluating the Performance of Tracking One Singular Object [with one Passive RFID tag] As stated in the protocols stated in Chapter IV [Section 1], the performance of the
modified software code was analyzed in a similar capacity as was done with the
evaluation of the software code provided by Mr. Tyler Peabody. Therefore, tests were
first conducted within the Cubic Testing Structure at a pre-defined attenuation level of
100 at three distinct height levels. Next, to establish a variable read range, tests were
conducted with the four RFID Antenna Placeholder Stands placed in a manner similar to
that seen in Figure 26.
Various attenuation levels were evaluated in the experimental tests, as well as at
different height levels. Table 16 summarizes the results, but more detailed results can
be seen in Appendix L.
Figure 26: Placement of Antennas for Testing Environment

104
Table 16: Accuracy of Real Time Location Tracking System for Modified Software Code [1 Passive RFID Tag] Directionality
Height Level
Attenuation Levels
1
2
3
4
5
6
Total Objects
Read
Accuracy
1 0
27.78%
15
27.78%
30
25.93%
50
27.78%
100
24.07%
Total --- ---
26.67%
2 0
9.26%
15
11.11%
30
11.11%
50
11.11%
100
12.96%
Total --- ---
11.11%
3 0
14.81%
15
14.81%
30
16.67%
50
16.67%
100
11.11%
Total --- ---
14.81%
At each of the three distinct height levels, the performance of the system was once
again evaluated by performing an evaluative test that determined the accuracy of the
system in tracking a desired object. In a similar manner, as seen in Table 15, six
different directions were evaluated for each of the six attenuation level. Also, three
distinct height levels were evaluated. Therefore, once again, a total of 270 test points
were evaluated for each height level. However, the primary difference was associated
with the notion that the system was based upon the modification to the software code.
The results did indeed indicate that the modification allowed for an enhancement of the

105
accuracy of the system as the accuracy rate was raised to 26.67% for Height level 1.
Again, by either increasing or decreasing the height level of antenna, it was seen that
the accuracy of the system decreased to 11.11% and 14.81% respectively. In regards to
the directionality of the tag, more reads were obtained for Direction 1 and Direction 4
for Height Level 1.
Section 7: Evaluating the Performance of Tracking One Singular Object [with Multiple Passive RFID tags]
In the modification of the software program, it was established that a singular
object, which was desired to be tracked, was able to be identified by multiple Passive
RFID tags. By incorporating such a feature, it was believed to improve the accuracy of
the real time location tracking system. In order to validate such a claim, experimental
simulations were once again conducted with the same protocols that were used
previously to analyze the system’s accuracy. The data seen in Table 17 to Table 20
summarize the results for tracking one singular object with multiple tags, but more
detailed results can be seen in Appendix M to Appendix P.
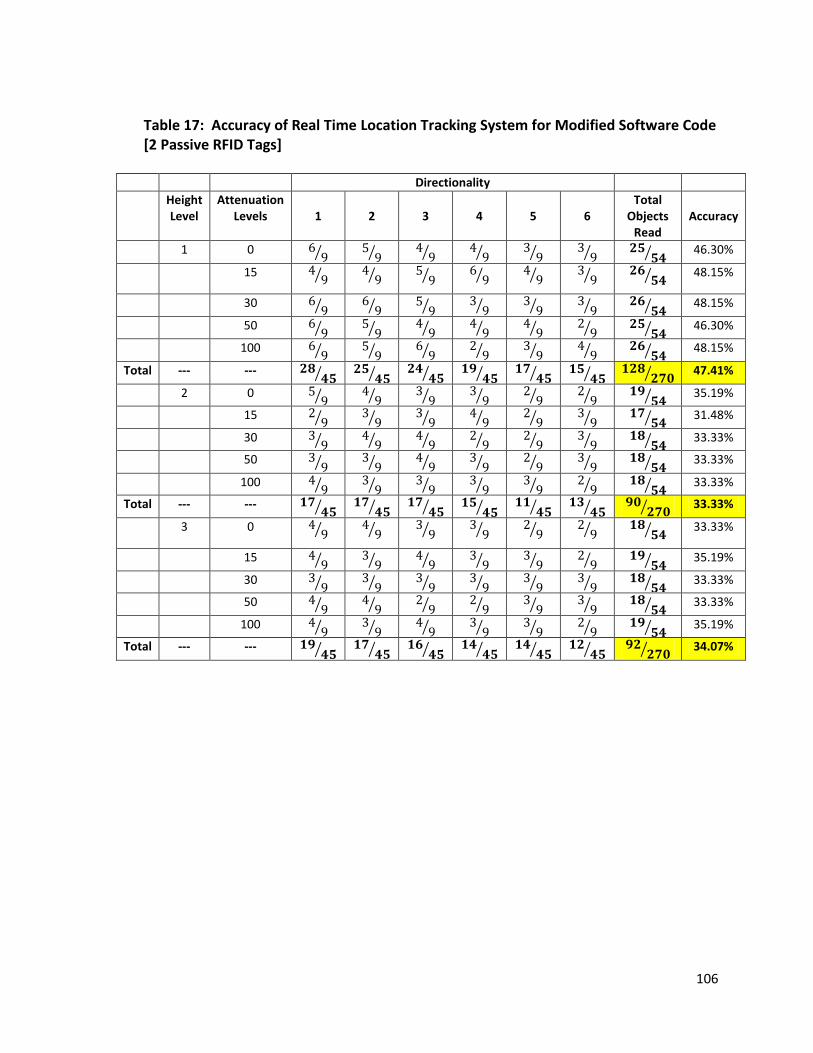
106
Table 17: Accuracy of Real Time Location Tracking System for Modified Software Code [2 Passive RFID Tags]
Directionality
Height Level
Attenuation Levels
1
2
3
4
5
6
Total Objects
Read
Accuracy
1 0
46.30%
15
48.15%
30
48.15%
50
46.30%
100
48.15%
Total --- ---
47.41%
2 0
35.19%
15
31.48%
30
33.33%
50
33.33%
100
33.33%
Total --- ---
33.33%
3 0
33.33%
15
35.19%
30
33.33%
50
33.33%
100
35.19%
Total --- ---
34.07%

107
Table 18: Accuracy of Real Time Location Tracking System for Modified Software Code [3 Passive RFID Tags] Directionality
Height Level
Attenuation Levels
1
2
3
4
5
6
Total Objects
Read
Accuracy
1 0
55.56%
15
59.26%
30
62.96%
50
59.26%
100
61.11%
Total --- ---
59.63%
2 0
48.15%
15
48.15%
30
48.15%
50
48.15%
100
46.30%
Total --- ---
47.78%
3 0
48.15%
15
50.00%
30
50.00%
50
48.15%
100
50.00%
Total --- ---
49.26%
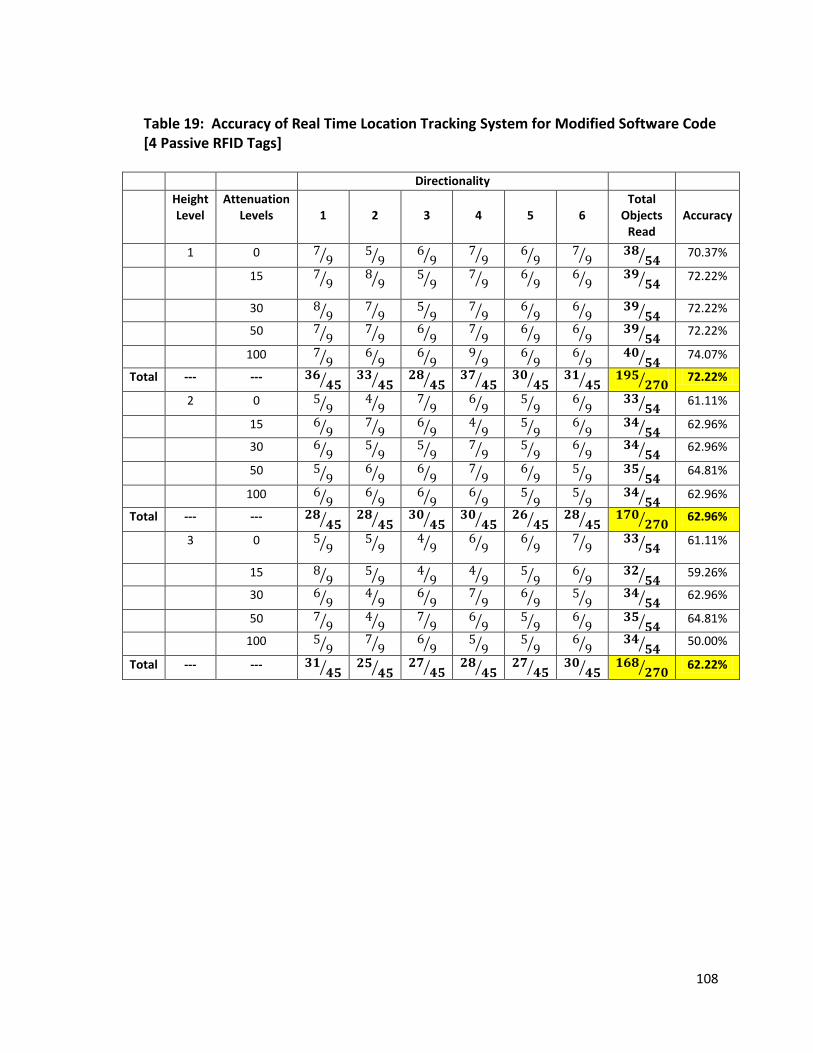
108
Table 19: Accuracy of Real Time Location Tracking System for Modified Software Code [4 Passive RFID Tags] Directionality
Height Level
Attenuation Levels
1
2
3
4
5
6
Total Objects
Read
Accuracy
1 0
70.37%
15
72.22%
30
72.22%
50
72.22%
100
74.07%
Total --- ---
72.22%
2 0
61.11%
15
62.96%
30
62.96%
50
64.81%
100
62.96%
Total --- ---
62.96%
3 0
61.11%
15
59.26%
30
62.96%
50
64.81%
100
50.00%
Total --- ---
62.22%

109
Table 20: Accuracy of Real Time Location Tracking System for Modified Software Code [6 Passive RFID Tags]
Directionality
Height Level
Attenuation Levels
1
2
3
4
5
6
Total Objects
Read
Accuracy
1 0
85.19%
15
85.19%
30
87.04%
50
87.04%
100
85.19%
Total --- ---
85.93%
2 0
75.93%
15
72.22%
30
74.07%
50
72.22%
100
74.07%
Total --- ---
73.70%
3 0
75.93%
15
72.22%
30
74.07%
50
72.22%
100
74.07%
Total --- ---
73.70%
110
One of the most important modifications to the software program was the feature
of being able to track a desired object with multiple Passive RFID Tags. Therefore, the
performance of the system was once again evaluated through the process of identifying
the accuracy read rate of the system. As stated with the evaluative tests seen in Section
5 and Section 6, six different directions were evaluated for each of the six attenuation
level. Also, three distinct height levels were evaluated and a total of 270 test points
were evaluated for each height level.
Results in this section indicated that the continuous addition of Passive RFID tags, to
identify a singular object, allowed for a significant increase in the accuracy rate of the
system. As seen in Table 17 for Height Level 1, the use of two Passive RFID Tags
obtained an accuracy read rate of 46.3% for the system, which was a significant increase
in comparison to an accuracy read rate of only 27.78% seen for the use of tracking an
object with only one Passive RFID tag. With the continuous addition of Passive RFID
Tags to identify a singular object to be tracked, the accuracy read rate of the system
continued to exhibit vast improvement. In Table 20, it was seen that the accuracy of the
RTLTS for the modified software code with six distinct Passive RFID Tags was recorded to
be at 85.93% at Height Level 1. This result exhibited the highest accuracy read rate, and
was indeed comparable to those of other technologies used for RTLTS.
As previously seen, the change in the height level of the Poynting Antenna showed a
prominent affect upon the accuracy read rate of the system. Even with the addition of
multiple tags to identify a singular object, there continued to be a decrease in the

111
accuracy read rate of the system when the tag was either one-foot higher or lower than
the direct line of sight of the antenna. In regards to the directionality of the tag, there
was not necessarily one direction that was more prominent than another. Nonetheless,
a statistical analysis had to be conducted to examine whether or not these different
factors would had a prominent affect on the performance of the Real time Location
Tracking System.
Section 8: Statistical Analysis on Real Time Location Tracking System
As stated previously in the protocols for the evaluative tests, an assessment was
conducted on the performance of the Real time Location Tracking System with not only
the modified software code but also with the original software code. The need to
evaluate the original software code was attributed with the belief that the new features
implemented into the modified software code had a profound effect on enhancing
accuracy and performance of the system. In a similar manner, it was believed that
factors such as the directionality of the RFID Passive tag, in relation to the Poynting
antenna, and the location of the RFID Passive tag, in comparison to the height of the
Poynting antenna, had a significant impact on the accuracy and performance of the
system as well. Therefore, the primary purpose of a statistical analysis, within Minitab,
was to examine whether or not these different factors had a prominent affect on the
performance of the Real time Location Tracking System. More specifically, the different
types of cases that were considered in this analysis included the following:

112
Case 0 – Original Software Code [with 1 Passive RFID Tag]:
o Height 1: The first height corresponded to a measurement in which all
four antennas had a straight line of sight to the Passive RFID tag.
o Height 2: The second height, to be evaluated, was one-foot above the
straight line of sight to the Passive RFID tag.
o Height 3: The third height was one-foot below the straight line of sight to
the Passive RFID tag.
Case 1 – Modified Software Code [with 1 Passive RFID Tag]:
o Height 1: The first height corresponded to a measurement in which all
four antennas had a straight line of sight to the Passive RFID tag.
o Height 2: The second height, to be evaluated, was one-foot above the
straight line of sight to the Passive RFID tag.
o Height 3: The third height was one-foot below the straight line of sight to
the Passive RFID tag.
Case 2 – Modified Software Code [with 2 Passive RFID Tags]:
o Height 1: The first height corresponded to a measurement in which all
four antennas had a straight line of sight to the Passive RFID tag.
o Height 2: The second height, to be evaluated, was one-foot above the
straight line of sight to the Passive RFID tag.
o Height 3: The third height was one-foot below the straight line of sight to
the Passive RFID tag.

113
Case 3 – Modified Software Code [with 3 Passive RFID Tags]:
o Height 1: The first height corresponded to a measurement in which all
four antennas had a straight line of sight to the Passive RFID tag.
o Height 2: The second height, to be evaluated, was one-foot above the
straight line of sight to the Passive RFID tag.
o Height 3: The third height was one-foot below the straight line of sight to
the Passive RFID tag.
Case 4 – Modified Software Code [with 4 Passive RFID Tags]:
o Height 1: The first height corresponded to a measurement in which all
four antennas had a straight line of sight to the Passive RFID tag.
o Height 2: The second height, to be evaluated, was one-foot above the
straight line of sight to the Passive RFID tag.
o Height 3: The third height was one-foot below the straight line of sight to
the Passive RFID tag.
Case 6 – Modified Software Code [with 6 Passive RFID Tags]:
o Height 1: The first height corresponded to a measurement in which all
four antennas had a straight line of sight to the Passive RFID tag.
o Height 2: The second height, to be evaluated, was one-foot above the
straight line of sight to the Passive RFID tag.
Height 3: The third height was one-foot below the straight line of sight to
the Passive RFID tag.

114
Section 8.1: Graphical Summary
Prior to conducting a Hypothesis Test upon the data set, the software program of
Minitab was used to provide a graphical summary of the results of the number of times
the system was able to properly recognize an object (identified by the Passive RFID tag)
within the pre-defined environmental setting. Provided below are graphical summaries
of each of the different cases with the defined condition of Height 1. In order to view
the graphical summaries of each of the different conditions with the defined condition
of Height 2 and Height 3, please refer to Appendix Q.
From this graphical summary in Figure 27, it was seen that the sample mean of the
number of objects read for [Case 0] was 0.8333 objects out of every 9 opportunities,
with a sample standard deviation of 0.53067 objects. In addition, we were 95%
confident that the population mean number of tags read was between 0.63518 objects
and 1.03149 objects.
86420
Median
Mean
1.00.90.80.70.6
1st Q uartile 0.75000
Median 1.00000
3rd Q uartile 1.00000
Maximum 2.00000
0.63518 1.03149
1.00000 1.00000
0.42263 0.71339
A -Squared 4.68
P-V alue < 0.005
Mean 0.83333
StDev 0.53067
V ariance 0.28161
Skewness -0.192287
Kurtosis 0.458975
N 30
Minimum 0.00000
A nderson-Darling Normality Test
95% C onfidence Interv al for Mean
95% C onfidence Interv al for Median
95% C onfidence Interv al for StDev95% Confidence Intervals
Summary for Objects ReadCase = 0, Height Level = 1
Figure 27: Statistical Summary for Case 0 and Height Level 1

115
From this graphical summary in Figure 28, it was seen that the sample mean of the
number of objects read for [Case 1] was 2.40 objects out of every 9 opportunities, with a
sample standard deviation of 0.8350 objects. In addition, we were 95% confident that
the population mean number of objects read were between 2.0807 objects and 2.7193
objects.
86420
Median
Mean
3.02.82.62.42.22.0
1st Q uartile 2.0000
Median 2.0000
3rd Q uartile 3.0000
Maximum 4.0000
2.0807 2.7193
2.0000 3.0000
0.6809 1.1494
A -Squared 2.34
P-V alue < 0.005
Mean 2.4000
StDev 0.8550
V ariance 0.7310
Skewness 0.510707
Kurtosis -0.237205
N 30
Minimum 1.0000
A nderson-Darling Normality Test
95% C onfidence Interv al for Mean
95% C onfidence Interv al for Median
95% C onfidence Interv al for StDev95% Confidence Intervals
Summary for Objects ReadCase = 1, Height Level = 1
Figure 28: Statistical Summary for Case 1 and Height Level 1

116
From this graphical summary, it was seen that the sample mean of the number of
objects for [Case 2] was 4.2667 objects out of every 9 opportunities, with a sample
standard deviation 1.2576 objects. In addition, we were 95% confident that the
population mean number of objects read were between 3.7971 objects and 4.7363
objects.
86420
Median
Mean
5.04.84.64.44.24.03.8
1st Q uartile 3.0000
Median 4.0000
3rd Q uartile 5.2500
Maximum 6.0000
3.7971 4.7363
4.0000 5.0000
1.0016 1.6906
A -Squared 1.13
P-V alue 0.005
Mean 4.2667
StDev 1.2576
V ariance 1.5816
Skewness 0.01370
Kurtosis -1.03969
N 30
Minimum 2.0000
A nderson-Darling Normality Test
95% C onfidence Interv al for Mean
95% C onfidence Interv al for Median
95% C onfidence Interv al for StDev95% Confidence Intervals
Summary for Objects ReadCase = 2, Height Level = 1
Figure 29: Statistical Summary for Case 2 and Height Level 1

117
From this graphical summary in Figure 30, it was seen that the sample mean of the
number of objects read for [Case 3] was 5.3667 objects out of every 9 opportunities,
with a sample standard deviation of 0.8087 objects. In addition, we were 95% confident
that the population mean number of objects read were between 5.0647 objects and
5.6686 objects.
86420
Median
Mean
6.05.85.65.45.25.0
1st Q uartile 5.0000
Median 5.0000
3rd Q uartile 6.0000
Maximum 7.0000
5.0647 5.6686
5.0000 6.0000
0.6441 1.0872
A -Squared 2.32
P-V alue < 0.005
Mean 5.3667
StDev 0.8087
V ariance 0.6540
Skewness 0.465056
Kurtosis -0.025720
N 30
Minimum 4.0000
A nderson-Darling Normality Test
95% C onfidence Interv al for Mean
95% C onfidence Interv al for Median
95% C onfidence Interv al for StDev95% Confidence Intervals
Summary for Objects ReadCase = 3, Height Level = 1
Figure 30: Statistical Summary for Case 3 and Height Level 1
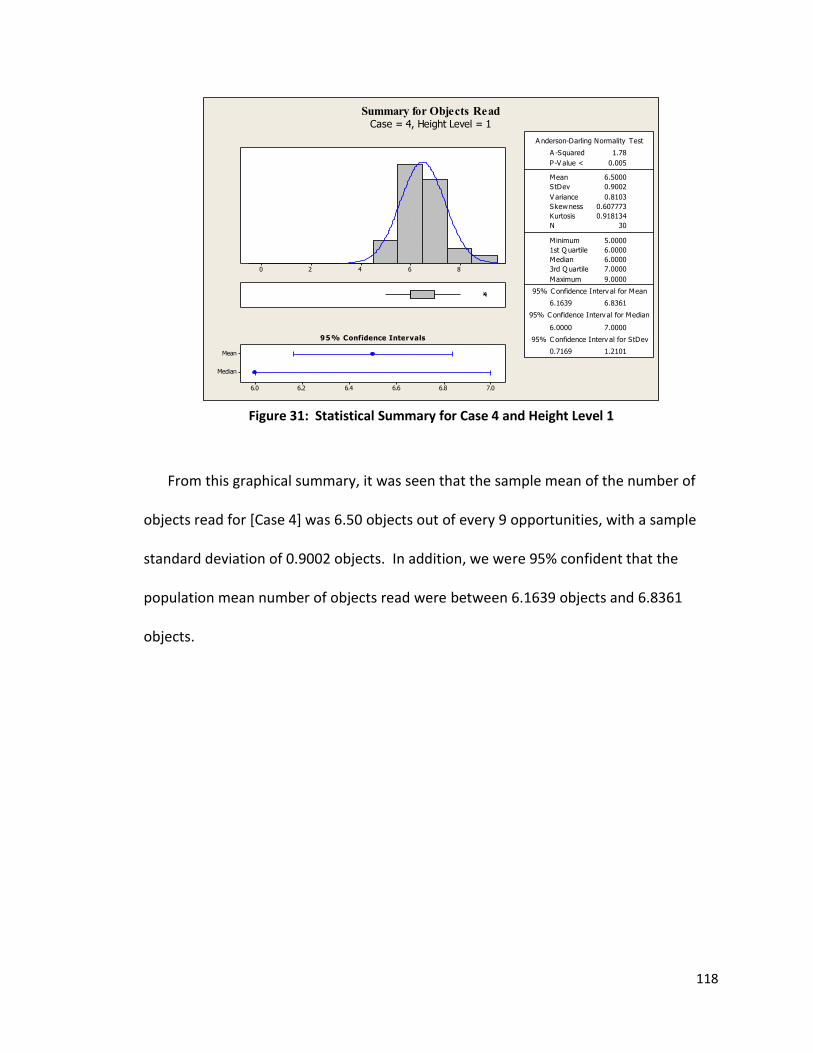
118
From this graphical summary, it was seen that the sample mean of the number of
objects read for [Case 4] was 6.50 objects out of every 9 opportunities, with a sample
standard deviation of 0.9002 objects. In addition, we were 95% confident that the
population mean number of objects read were between 6.1639 objects and 6.8361
objects.
86420
Median
Mean
7.06.86.66.46.26.0
1st Q uartile 6.0000
Median 6.0000
3rd Q uartile 7.0000
Maximum 9.0000
6.1639 6.8361
6.0000 7.0000
0.7169 1.2101
A -Squared 1.78
P-V alue < 0.005
Mean 6.5000
StDev 0.9002
V ariance 0.8103
Skewness 0.607773
Kurtosis 0.918134
N 30
Minimum 5.0000
A nderson-Darling Normality Test
95% C onfidence Interv al for Mean
95% C onfidence Interv al for Median
95% C onfidence Interv al for StDev95% Confidence Intervals
Summary for Objects ReadCase = 4, Height Level = 1
Figure 31: Statistical Summary for Case 4 and Height Level 1

119
From this graphical summary, it was seen that the sample mean of the number of
objects read for [Case 6] was 7.7333 objects out of every 9 opportunities, with a sample
standard deviation of 0.6397 objects. In addition, we were 95% confident that the
population mean number of objects read was between 7.4945 objects and 7.9722
objects.
86420
Median
Mean
8.07.97.87.77.67.5
1st Q uartile 7.0000
Median 8.0000
3rd Q uartile 8.0000
Maximum 9.0000
7.4945 7.9722
8.0000 8.0000
0.5094 0.8599
A -Squared 3.57
P-V alue < 0.005
Mean 7.7333
StDev 0.6397
V ariance 0.4092
Skewness -0.555802
Kurtosis 0.864294
N 30
Minimum 6.0000
A nderson-Darling Normality Test
95% C onfidence Interv al for Mean
95% C onfidence Interv al for Median
95% C onfidence Interv al for StDev95% Confidence Intervals
Summary for Objects ReadCase = 6, Height Level = 1
Figure 32: Statistical Summary for Case 6 and Height Level 1
120
From the graphical summaries seen in Figure 27 to Figure 32, it was recognized that
the mean number of tags read significantly increased when comparing the use of the
RTLTS with the Original Software Code and the Modified Software Code. More
specifically, with just one Passive RFID Tag, it was seen that only about 0.833 objects
were read for every 9 opportunities with the original software code, while there were
about 2.40 objects read for every 9 opportunities with the newly modified software
code. By identifying an object, with multiple Passive RFID tags, there was an increase in
the accuracy of the RTLTS, as it was seen that there were a greater number of times that
an object was read. For instance, when comparing Case 1 [1 Passive RFID tag] to Case 6
[6 Passive RFID tag], data showed that 7.7333 objects were read out of every 9
opportunities compared to only 2.40 objects read for every 9 opportunities. In regards
to the change in height level, it was seen that Height Level 1 had a greater accuracy in
reading an object in comparison to Height Level 2 and Height Level 3.

121
Section 8.2: Hypothesis Test
While the graphical summaries were indeed able to indicate a difference in the
sample means and standard deviations, a Hypothesis Test was conducted. By
conducting a Statistical Hypothesis Test one was able to determine, with a 95%
confidence level, whether or not there was a significant difference in the accuracy of the
RTLTS, under various conditions. More specifically, a one-way ANOVA was used for the
Hypothesis Test in order to accomplish the following:
(1) Hypothesis Test #1: There exists a significant difference in the Accuracy of the
System when Using the Original Code Versus Modified Software Code with the
implementation of multiple RFID Passive Tags to Track Object.
(2) Hypothesis Test #2: There exists a significant difference in the Accuracy of the
System by Changing Attenuation Levels of Each Antenna.
(3) Hypothesis Test #3: There exists a significant difference in the Accuracy of the
System by changing the directionality of RFID Passive tag relative to the position
of the Poynting Antenna
(4) Hypothesis Test #4: There exists a significant difference in the Accuracy of the
System by changing the Height level of the Poynting Antenna relative to the
position of the RFID Passive Tag(s).

122
Procedural Steps for Hypothesis Test - Definition of Variables
- Step 1: State Assumptions that are needed for the Statistical Analysis o The first assumption was that the sampled data must be random and
Independent. o The second assumption stated that the values in each sampled group
must be drawn from a normally distributed population. o The third assumption stated that the variance within each population
should be equal for all populations. Hypothesis Test #1
Hypothesis Test #2
Hypothesis Test #3
Hypothesis Test #4
- Step 2: State the Null Hypothesis for Each Test o Hypothesis Test #1
H0: µCase 1 = µCase 2 = µCase 3 = µ Case 4 = µ Case 5 = µ Case 6
o Hypothesis Test #2 H0: µATT 0 = µATT 15 = µCase 30 = µ Case 50 = µ Case 100
o Hypothesis Test #3
H0: µDirection 1 = µDirection 2 = µDirection 3 = µ Direction 4 = µ Direction 5 = µDirection 6

123
o Hypothesis Test #4 H0: µHeight 1 = µHeight 2 = µHeight 3
- Step 3: State the Alternative Hypothesis
o Hypothesis Test #1 H1: µi ≠ µj for at least one pair of [i,j]
o Hypothesis Test #2
H1: µi ≠ µj for at least one pair of [i,j]
o Hypothesis Test #3 H1: µi ≠ µj for at least one pair of [i,j]
o Hypothesis Test #4
H1: µi ≠ µj for at least one pair of [i,j]
- Step 4: Establish a 95% Confidence Interval o α = 0.05 for each Hypothesis Test
*Complete Results from Minitab Can Be Seen in Section 17 of Appendix*
Results from One-Way Anova for Each Hypothesis Test [conducted in Minitab] Source DF Seq SS Adj SS Adj MS F P
Regression 16 2988.03 2988.03 186.752 325.581 0.000000
Case Number 5 2833.99 2833.99 566.797 988.147 0.000000
Attenuation Level 4 0.53 0.53 0.132 0.231 0.921049
Height Level 2 118.06 118.06 59.030 102.911 0.000000
Direction 5 35.45 35.45 7.091 12.362 0.000000
Error 523 299.99 299.99 0.574
Total 539 3288.02
From the results obtained from the One-Way Anova, the primary focus was to
identify the p-value obtained for each of the categories. More specifically, if a category
were to obtain a p-value that is less than 0.05, we concluded that we were 95%
confident that we had to reject the null hypothesis. Therefore, if we do reject the null
hypothesis, we were 95% confident that there was indeed a significant difference in the
mean number of objects read under the specific category. Through the statistical

124
analysis conducted in Minitab, it was recognized that the categories of case number,
height level, and direction all had a p-value of 0.0000. Thus, we were able to conclude
that there were indeed significant differences in the mean number of objects read
under these categories. In regards to attenuation level, it was seen that the p-value was
0.921049. Since the p-value was greater than 0.05, we accepted the null hypothesis.
Thus, there was insufficient data to conclude that there were significant differences in
the mean number of objects read under the different attenuation levels evaluated.
Results from Regression Coefficient Table for Each Hypothesis Test [conducted in Minitab] Term Coef SE Coef T P
Constant 3.85741 0.0325916 118.356 0.000
Case Number 0 -3.35741 0.0728771 -46.069 0.000
1 -2.27963 0.0728771 -31.280 0.000
2 -0.41296 0.0728771 -5.667 0.000
3 0.84259 0.0728771 11.562 0.000
4 2.06481 0.0728771 28.333 0.000
In order to obtain the regression coefficient of Case Number 6, it was of necessity to
sum all of the coefficient values to the value of 0, and solve for the unknown variable
(Coefficient for Case 6). Through this, we obtained the coefficient value to be 3.1426,
which represented the greatest coefficient value among all of the case categories. With

125
this, we were 95% confident that Case 6 had the most prominent affect, among all of
the cases, in being able to obtain the greatest accuracy read rates for the system.
Attenuation Level
In regards to Attenuation Level, there was insufficient data in determining to
conclude there existed significant difference in the mean number of objects read under
this specific category. Therefore, there exists no maximum regression coefficient for the
category of Attenuation Level.
Height Level 1 0.65926 0.0460915 14.303 0.000
2 -0.37407 0.0460915 -8.116 0.000
In order to obtain the regression coefficient of Height Level 3, it was once again of
necessity to sum all of the coefficient values to the value of 0, and solve for the
unknown variable (Coefficient for Height Level 3). Through this, we obtained the
coefficient value to be -0.28519. From this data set, it was seen that the greatest
coefficient value among all of the Attenuation Level was seen to be at Height Level 1 at
a value of 0.65926. Therefore, we were 95% confident that Height Level 1 had the most
prominent affect, among all of the cases, in being able to obtain the greatest accuracy
read rates for the system.

126
Direction 1 0.39815 0.0728771 5.463 0.000
2 0.17593 0.0728771 2.414 0.016
3 -0.02407 0.0728771 -0.330 0.741
4 0.07593 0.0728771 1.042 0.298
5 -0.34630 0.0728771 -4.752 0.000
In order to obtain the regression coefficient of Direction 6, it was once again of
necessity to sum all of the coefficient values to the value of 0, and solve for the
unknown variable (Coefficient for Direction 6). Through this, we obtained the
coefficient value to be 0.122780. From this data set, it was seen that the greatest
coefficient value among all of the Attenuation Level was seen to be at Direction 1 at a
value of 0.39815. Therefore, we were 95% confident that Direction 1 had the most
prominent affect, among all of the cases, in being able to obtain the greatest accuracy
read rates for the system.

127
Check the Validity of the Assumptions In order to validate whether or not the variance within each population were equal
for all populations, the Bartlett and Levene Tests were conducted on the data sets.
Hypothesis Test #1 - State the Null Hypothesis
- State the Alternative Hypothesis
H1: σi ≠ σj for at least one pair of [I,j] - In order to establish a 95% Confidence Interval, a value of 0.05 was selected for
α. α = 0.05
From the Bartlett’s Test, it was seen that a p-value of 0.8975 was obtained for this
data set. Since the p-value (0.8975) was greater than the alpha value (0.05), we failed to
reject the null hypothesis. Thus, we were 95% confident that the variances, within each
population [Objects Read and Case Number], were equal for all populations. Therefore,
this assumption was valid.
6
4
3
2
1
0
1.41.31.21.11.00.90.80.70.60.5
Ca
se
Nu
mb
er
95% Bonferroni Confidence Intervals for StDevs
Test Statistic 41.11
P-Value 0.000
Test Statistic 2.55
P-Value 0.027
Bartlett's Test
Levene's Test
Test for Equal Variances for Objects Read
Bartlett’s Test Test Statistic 1.75
P-Value 0.8975
Levene’s Test Test Statistic 0.28 P-Value 0.753
Figure 33: Test for Equal Variances for Objects Read (Case Number)
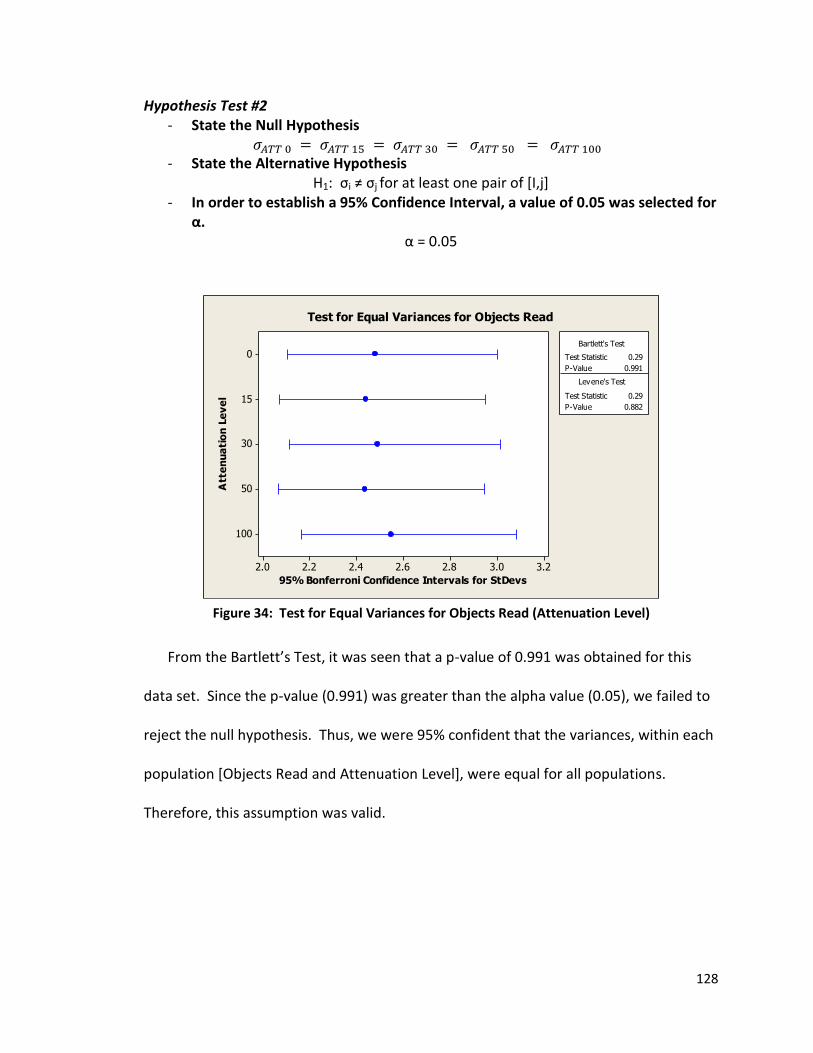
128
Hypothesis Test #2 - State the Null Hypothesis
- State the Alternative Hypothesis
H1: σi ≠ σj for at least one pair of [I,j] - In order to establish a 95% Confidence Interval, a value of 0.05 was selected for
α. α = 0.05
From the Bartlett’s Test, it was seen that a p-value of 0.991 was obtained for this
data set. Since the p-value (0.991) was greater than the alpha value (0.05), we failed to
reject the null hypothesis. Thus, we were 95% confident that the variances, within each
population [Objects Read and Attenuation Level], were equal for all populations.
Therefore, this assumption was valid.
100
50
30
15
0
3.23.02.82.62.42.22.0
Att
en
ua
tio
n L
ev
el
95% Bonferroni Confidence Intervals for StDevs
Test Statistic 0.29
P-Value 0.991
Test Statistic 0.29
P-Value 0.882
Bartlett's Test
Levene's Test
Test for Equal Variances for Objects Read
Figure 34: Test for Equal Variances for Objects Read (Attenuation Level)

129
Hypothesis Test #3
- State the Null Hypothesis
- State the Alternative Hypothesis
H1: σi ≠ σj for at least one pair of [I,j] - In order to establish a 95% Confidence Interval, a value of 0.05 was selected for
α. α = 0.05
From the Bartlett’s Test, it was seen that a p-value of 0.886 was obtained for this
data set. Since the p-value (0.886) was greater than the alpha value (0.05), we failed to
reject the null hypothesis. Thus, we were 95% confident that the variances, within each
population [Objects Read and Direction], were equal for all populations. Therefore, this
assumption was valid.
6
5
4
3
2
1
3.43.23.02.82.62.42.22.0
Dir
ecti
on
95% Bonferroni Confidence Intervals for StDevs
Test Statistic 1.72
P-Value 0.886
Test Statistic 0.74
P-Value 0.597
Bartlett's Test
Levene's Test
Test for Equal Variances for Objects Read
Figure 35: Test for Equal Variances for Objects Read (Direction)

130
Hypothesis Test #4 - State the Null Hypothesis
- State the Alternative Hypothesis H1: σi ≠ σj for at least one pair of [I,j]
- In order to establish a 95% Confidence Interval, a value of 0.05 was selected for α.
α = 0.05
From the Bartlett’s Test, it was seen that a p-value of 0.731 was obtained for this
data set. Since the p-value (0.731) was greater than the alpha value (0.05), we failed to
reject the null hypothesis. Thus, we were 95% confident that the variances, within each
population [Objects Read and Height Level], were equal for all populations. Therefore,
this assumption was valid.
3
2
1
2.92.82.72.62.52.42.32.22.12.0
He
igh
t Le
ve
l
95% Bonferroni Confidence Intervals for StDevs
Test Statistic 0.63
P-Value 0.731
Test Statistic 0.28
P-Value 0.753
Bartlett's Test
Levene's Test
Test for Equal Variances for Objects Read
Figure 36: Test for Equal Variances for Objects Read (Height Level)
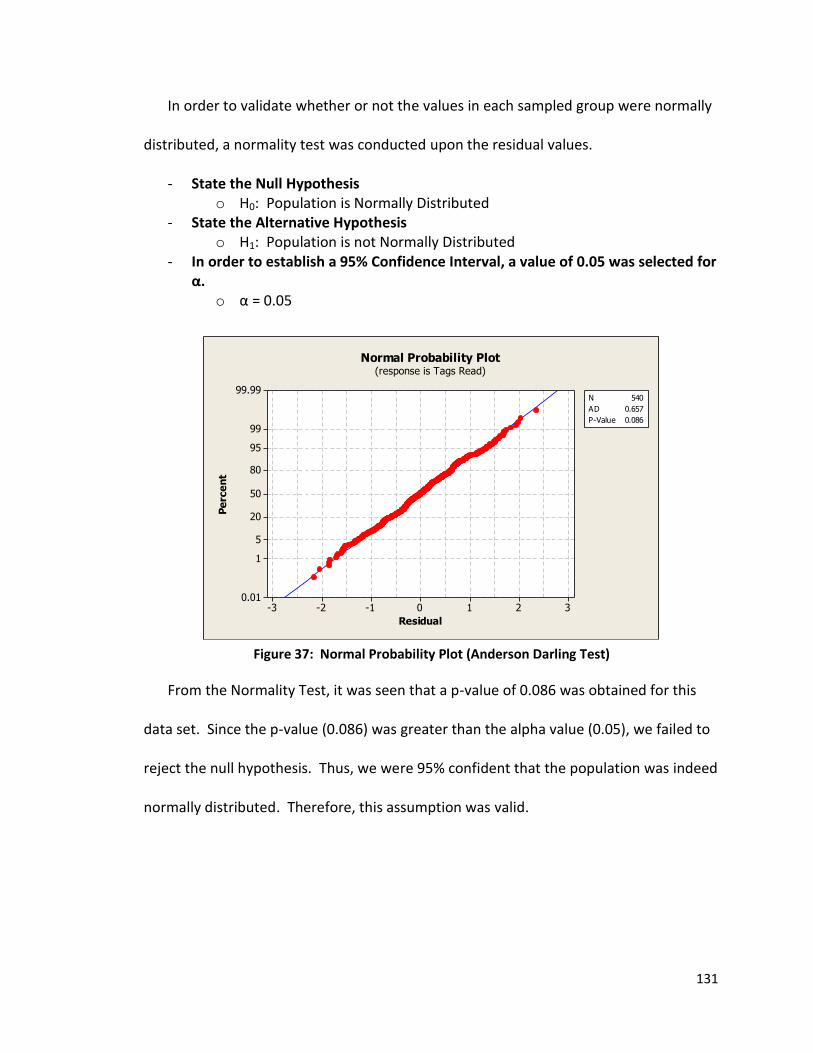
131
In order to validate whether or not the values in each sampled group were normally
distributed, a normality test was conducted upon the residual values.
- State the Null Hypothesis o H0: Population is Normally Distributed
- State the Alternative Hypothesis o H1: Population is not Normally Distributed
- In order to establish a 95% Confidence Interval, a value of 0.05 was selected for α.
o α = 0.05
From the Normality Test, it was seen that a p-value of 0.086 was obtained for this
data set. Since the p-value (0.086) was greater than the alpha value (0.05), we failed to
reject the null hypothesis. Thus, we were 95% confident that the population was indeed
normally distributed. Therefore, this assumption was valid.
3210-1-2-3
99.99
99
95
80
50
20
5
1
0.01
Residual
Pe
rce
nt
N 540
AD 0.657
P-Value 0.086
Normal Probability Plot(response is Tags Read)
Figure 37: Normal Probability Plot (Anderson Darling Test)

132
CHAPTER VI: CONCLUSION
As stated previously, the goal of this study was to establish a RFID system that was
able to provide real time location tracking of a pre-determined object. While the
software code, provided by Mr. Tyler Peabody, provided a substantial basis in
accomplishing such a feat, modifications were still needed to improve the accuracy read
rate of the system. This modified software code then underwent several evaluative
tests to not only analyze the potential of RFID technology in a Real Time Location
Tracking System, but also to evaluate how factors such as directionality of the tag,
height level of the antenna, as well as attenuation levels could affect the performance
of the system. Upon the tabulation of the results, a One-Way ANOVA test was used as
the statistical analysis method with Minitab.
In this specific chapter, the results from the One-Way ANOVA test were first
discussed, as well as interpreted for each of the categorical factors that were evaluated.
While the statistical analysis showed that many of these categorical factors had a
prominent effect upon the performance of the system, it was important to recognize
that the accuracy read rates were substantially improved through the modifications of
the software code. In effect, the accuracy read rates, which were seen, were indeed
quite comparable to that of other technologies used for RTLTS and will be further
discussed in this chapter. Nonetheless, it should be recognized that several limitations
were experienced and should be considered in future work.

133
Section 1: Interpretation of Statistical Analysis
In order to analyze and determine, with a 95% confidence level, whether or not
there was a significant difference in the number of times an object was read by the
system, a one-way ANOVA test was performed, with Minitab, upon four distinct
conditions. In addition, Minitab was also used to obtain Regression Coefficient values as
a means to determine which variable obtained the best results from each of the
corresponding conditions. Below is an interpretation of the statistical analysis for each
of the four hypothesis tests that were conducted.
Hypothesis Test #1 From the results obtained from the One-Way Anova Test conducted on this specific
data set, it was seen that the p-value was recognized to be 0.000. Thus, since the p-
value [0.000] was less than α *0.05+, we rejected the null hypothesis. Therefore, we
were 95% confident that there was a significant difference in the mean number of
objects read under various cases that were studied. The statistical results suggested that
not only did the modifications, within the software code, result in a significant change in
number of objects being read by the system, but similar results were seen with the
implementation of multiple tags to track a singular object. In order to determine which
of the cases resulted in a greater number of objects being read by the system, Minitab
was used to obtain Regression Coefficient Values. Results indicated that Case Number 6
had the greatest Regression Coefficient Value. Thus, we were 95% confident to
conclude that the greatest number of objects read with six Passive RFID tags to track a
singular object.
134
Hypothesis Test #2 From the results obtained from the One-Way Anova Test conducted on this specific
data set, it was seen that the p-value was recognized to be 0.921049. Thus, since the p-
value [0.921049] was greater than α *0.05+, we failed to reject the null hypothesis.
Therefore, there was insufficient data to conclude that there existed significant
differences in the mean number of objects read under different attenuation levels that
were evaluated.
Hypothesis Test #3 From the results obtained from the One-Way Anova Test conducted on this specific
data set, it was seen that the p-value was recognized to be 0.000. Thus, since the p-
value [0.000] was less than α *0.05+, we rejected the null hypothesis. Therefore, we
were 95% confident that there was also a significant difference in the mean number of
objects read with a change of the directionality of the Passive RFID tags in relation to
the antennas of the system. Minitab was once again used in order to observe the
Regression Coefficient Values for this specific data set. From the results, it was seen
that Direction 1 had the greatest Regression Coefficient Value. Thus, we were 95%
confident to conclude that the greatest number of objects read would have the tag in a
similar direction to that of Direction 1.

135
Hypothesis Test #4 From the results obtained from the One-Way Anova Test conducted on this specific
data set, it was seen that the p-value was recognized to be 0.000. Thus, since the p-
value [0.000] was less than α *0.05+, we rejected the null hypothesis. Therefore, we
were 95% confident that there was also a significant difference in the mean number of
objects read with a change of the height level of the antenna in relation to the Passive
RFID Tags. More specifically, by changing the height level of the antenna to one that
prevented the Passive RFID tags from having a direct line of sight to the antenna, there
was a significant decrease in the number of objects read by the system. Minitab was
once again used to observe the Regression Coefficient Values for this specific data set.
From the results, it was seen that Height Level 1 had the greatest Regression Coefficient
Value. Thus, we were 95% confident to conclude that the greatest number of objects
read would have a height level in which the Passive RFID tags would have a direct line of
sight to the antennas.

136
Section 2: Discussion of Results
The primary purpose of this study was to evaluate and analyze the performance of
Passive Radio Frequency technology as a basis for a real time location tracking system.
Even though the results did not yield the ideal read accuracy of 100%, for the Passive
RFID technology, optimism remained for such technology to be considered for a real
time location tracking system. From the statistical analysis, it was seen that the original
software code [Code 0], provided by Mr. Tyler Peabody, exhibited the lowest read
accuracy rates as only about 9.26% were recognized in the proper zone. While such low
read accuracy rates were undesirable, it remained quite important to recognize the
significance of how such a code was still able to provide a basis for how to implement
Passive RFID into a real time location tracking system.
In order to address the low read accuracy rates, several modifications were made to
the original software code to try to enhance the performance and accuracy level of the
system. Such modifications included some features that enhanced the speed of the
visual display on the graphical representation, as well as incorporated a ‘cutoff point’
and a new definition of a ‘cycle’ to improve the accuracy of the system. However, it was
the ability to track a singular object with multiple Passive RFID tags that had the most
prominent effect upon improvement of the performance.
By implementing a real time location tracking system that allowed for a singular
object to be identified and tracked by multiple Passive RFID tags, the results had
indicated there was a statistical significance difference in the amount of the read
accuracy rate of the system [Hypothesis Test #1]. More specifically, from the statistical

137
analysis conducted in Hypothesis Test #1, we were 95% confident to conclude that there
was indeed a significant increase in the read accuracy rates of the system as more
Passive RFID tags were used to identify and track a singular object. It was seen that,
with the modified software code, the read accuracy rates were only about 26.67% with
the use of only one Passive RFID tag, but such a value rose to approximately an accuracy
rate of 85.93% with six Passive RFID tags. Through statistical analysis, it was validated
that the use of six Passive RFID tags yielded the best accuracy results, as it obtained the
highest Regression Coefficient Values, among all of the cases in Hypothesis Test #1.
With the results obtained from the statistical analysis from Hypothesis Test #1, it
was suggested that the implementation of more Passive RFID tags to identify a singular
object led to a more accurate real time location tracking system. The reason for such a
belief was associated with the notion that the incorporation of more Passive RFID tags,
to identify a singular object, allowed for a greater likelihood in which the antennas
recognized one of the corresponding tags. It was the increase in the recognition of the
corresponding tags that ensured the system to have a greater accuracy in analyzing
which of the four antennas are able to identify the object. Such a process allowed for
this specific real time location tracking system to provide a more precise determination
of which zone the singular object was located within. However, while it was
recognized that the identification of a singular object with multiple tags had a
prominent effect upon the read accuracy of the system, it was important to
acknowledge that other factors altered the precision of the real time location tracking
system.

138
Through the evaluation of the statistical analysis conducted upon the experimental
data set, we were also 95% confident that the change in the height level of the four
antennas [Hypothesis Test #4], in relation to the position of the Passive RFID tags, also
exhibited significant differences in read accuracy of the real time location tracking
system. When observing the case in which six tags were used to identify a singular
object, it was seen that that the read accuracy rate was approximately 85.93% when the
antenna was at the same height level as that of the Passive RFID tags. However, by
lowering or raising the antennas by a distance of one-foot, it was seen that the read
accuracy rate declined to approximately about 73.70% for both scenarios. A similar
pattern was seen, with the change of height levels, for each of the cases explored in
Hypothesis Test #1. Thus, one may conclude that as the height of the antenna got
further and further away from the position of the Passive RFID tags, the system
obtained a significantly worse read accuracy rate. A potential reason for such a
justification was that, while the Poynting Antenna was able to broadcast a
radiofrequency signal with a range of 1800, it was only able to do so in a singular plane.
Therefore, if the Passive RFID tags were in the same plane or height level as that of the
Poynting Antennas, there was an increased probability that system precisely recognized
the proper location of the tracked object.
Aside from the change in the height level of the four antennas, another factor that
indicated a significant change in the accuracy read rate of this specific real time location
tracking system was the direction of Passive RFID tags, in relation to the position of the
antenna. In this specific study, Passive RFID tags were placed upon a singular object and
139
were kept in the same location for each of the repetitive trials. However, the singular
object was required, within each regional zone, to be positioned into six distinct
orientations. With 95% confidence, we were able to conclude that there was a
significant difference in the read accuracy rate of the system upon changing the
directionality of the tag.
Through the evaluation process, it was quite evident that the read accuracy of the
system was more prominent when the Passive RFID tags were positioned in a manner in
which there exist no other components that would obstruct the pathway between itself
and the antennas. In a scenario in which an individual was be tracked with only one
passive RFID tag, there was a potential for the body of the human specimen to be
turned in an orientation that prevented the tag from having a direct line of sight from
the antenna. In such a situation, the antenna emitted radiofrequency signals that
passed through the human body, and often times the signal was unable to reach the
Passive RFID tags. Therefore, such an action ultimately caused for inaccuracy in the read
rates of this system. Similar problems continued to arise if the antennas were required
to continuously emit these signals through other dense objects. However, to prevent
such a dilemma, it was essential for the Passive RFID tags to be in the same line of sight
as the antennas. Therefore, it was highly suggested for multiple tags to be strategically
placed onto an object, which was to be tracked, to allow for each of the antennas to
have the opportunity to be able to read at least one of those Passive RFID tags located
on the object. If it were undesirable to use multiple tags, it would then be essential for
the tag to be in a direct sight of the antenna to achieve the greatest accuracy read rate.

140
Another potential factor that had a potential impact upon the read accuracy rate of
this real time location tracking was the ability to modify the attenuation levels of the
antenna. However, through statistical analysis, there was insufficient data to conclude
there existed significant differences in the read accuracy rates by simply changing the
attenuation levels of all four antennas within a system. Through this study, it was now
understood that it was important to attenuate the signals of the antennas to obtain the
proper size of each of the regional zones within the environmental setting. More
specifically, it was through the process of finding the maximum read range of each
antenna, under a specific attenuation level, which enabled an individual to create and
identify the size of a proper regional zone. Therefore, since the change in the
attenuation levels only increased or decreased the size of each regional zone, it should
be believed that such a factor did not have a prominent affect upon the read accuracy
rates of the entire system.
Section 3: Comparison to Other Real time Location Tracking Systems
As stated previously, the purpose of this study was to evaluate the potential of using
Passive RFID technology as a basis for a real time location tracking system. Experimental
tests were indeed conducted in this study to assess the accuracy of the system in being
able to recognize the location of an object being tracked. However, such results were
compared to that of other real time location tracking system to validate the potential of
such a technology. Therefore, below is a table that provides a summary of the accuracy
of several real time location tracking systems.

141
Table 21: Comparison of Accuracy Rates of Various Real Time Tracking Location Systems
Technology Real Amount of Objects
Mean Amount of Objects Read
Accuracy Rate Percentage Error
Active RFID 190 150 78.95% 21.05%
Indoor GPS 200 102 51.00% 49.00%
Infrared 140 118 84.29% 15.71%
Passive RFID 270 232 85.93% 14.07%
Ultra-Wideband 210 189 90.00% 10.00%
From the table above, it was seen that the read accuracy rate of a real time location
tracking system based upon the use of Passive RFID technology was indeed quite
comparable to those other systems. From Table 21, it was recognized that the use of
Passive RFID technology resulted in better results than that of technologies, such as
Active RFID, Indoor GPS, and Infrared. The read accuracy rates of this specific real time
location tracking system could even be further enhanced through the consideration of
several factors. As previously stated, it was the factors of the proper placement of the
Passive RFID tags and antennas, as well as the use of multiple tags, that had the most
prominent affect upon the read accuracy rates. Nonetheless, results, from this study,
have indicated that a system based upon Passive RFID technology yielded acceptable
read accuracy rates, especially with the appropriate considerations of several factors.
Therefore, it should be concluded that use of Passive RFID technology for a real time
location tracking system was a viable option for being used as a directional guidance, for
an individual with a visual impairment, of where they are located within the court.

142
Section 4: Limitations
In regards to this study, several limitations were encountered during the process of
analyzing the performance of the Passive RFID technology based real time location
tracking system. One of the most pronounced restraints was associated with inability
to secure an environmental setting that did not contain any materials that had the
ability to interfere with the system. Instead, my experimental tests were limited to
being conducted in the PolyGait laboratory, which was operated by the Industrial and
Manufacturing Engineering Department. While such a laboratory possessed sufficient
surface area to conduct the necessary tests for the study, the environmental setting
often contained a vast array of elements that were not considered to be beneficiary for
the system. For instance, the environmental setting contained additional Passive RFID
tags that were often recognized by the four antennas of the system. This could be seen
as a hindrance as the recognition of additional Passive RFID tags caused for a delay in
the functionality of the system.
Another limitation associated with conducting the study in the PolyGait laboratory
was the presence of various structures composed of metallic components. While these
structures were not located within any of the regional zones, their presence outside of
the pre-determined environmental settings was still believed to have an effect upon the
performance of the system. The reason for such a belief was that the radiofrequency
signals emitted by the antennas could reflect upon the metallic components and change
the trajectory of such signals. Aside from the various metallic components potentially
affecting the accuracy read rates of the system, another source of interference could be
143
attributed with the emission of signals from a cellular phone. Such occurrences had a
profound effect upon the accuracy read rate of the system.
In this specific study, the components of the Passive RFID technology, such as the
Poynting Antennas, the Sirit Reader, and several Passive RFID tags, were provided by the
IME Department. These components were then used to evaluate the performance of
such technology for the purpose of a real time location tracking system. However, due
to the expensive nature of these components, my study was unable to evaluate
different models of Passive RFID Antennas and Readers. Thus, a limitation was then
associated with the assumption that most Passive RFID components will function in a
similar manner, and will result in comparable accuracy read rates.
Another limitation associated with the use of Passive RFID technology, for RTLTS,
was the idea that substantially long wires and cables, such as the BNC cable and
Ethernet cords, had to be used for the system to establish the communication pathway
between the components. If such technology were to be used for an activity such as
assisting an individual, with a visual impairment, in playing the sport of basketball, those
cables and wires would become a detriment. The reason for such pessimism was due to
the potential that it could hinder the movement of an individual due to the fear of
tripping over such components. Therefore, a series of safety protocols should be
implemented to ensure that no such events could potentially occur.

144
Section 5: Future Work
The primary purpose of this study was to evaluate and analyze the use of Passive
RFID technology to serve as a basis for a real time location tracking system. This study
was able to validate the claim that such a technology was indeed a viable option by
confirming that the accuracy read rates were indeed comparable to other technologies.
However, such a validation should not prevent any further research from being
conducted. Instead, there should continue to be different areas that could be further
investigated and researched.
As stated previously, the availability of different models and brands for the Passive
RFID readers, antennas, and tags were quite limited in the PolyGait laboratory.
However, there exists a vast array of brands and models that are available, on the
market, for the different components of the Passive RFID technology. If additional funds
were used to purchase these different brands and models, evaluative tests should be
conducted to analyze whether or not the performance of the components are relatively
similar to that of the Poynting Antennas and Sirit Readers that are present in the
PolyGait laboratory. If statistical analysis does indeed show that there exist significant
differences in the performance of these different brands and models, it should then be
determined which corresponding antennas and readers could help enhance the
performance of the real time location tracking system.
Another aspect that could be studied in the near future would be to evaluate this
specific system in an outdoor setting. In regards to this research, the performance of
the system was only tested and evaluated in the PolyGait laboratory, which is an indoor

145
environmental setting. Therefore, if such a system were to be considered for an
outdoor activity, similar tests would need to be conducted upon the system. These
evaluative tests would be of importance in recognizing whether or not the accuracy read
rates would remain comparable to that those results obtained for an indoor setting. If
the read accuracy rates were to exhibit significant decline, research could assist in
determining the reason for such different results, and corresponding modifications
could then be made to the software code to enhance the system’s performance.
If Passive RFID technology is indeed chosen to assist an individual, with a visual
impairment, in performing the motions in the sport of basketball, the current set-up
would not be ideal. As stated earlier, the components of the system, due to their size,
may interfere during the activity, and could ultimately pose a potential hazard to an
individual. Therefore, future work may include designing and developing a portable real
time location tracking system based upon Passive RFID technology. In such an
approach, the ultimate goal would be to eliminate the excess cords and wires that could
possess tripping hazards, as well as limit the number of components, such as the stands
for the antennas, that an individual may accidentally bump into. If such a portable
structure is designed, an individual will not only have a device that could help provide
the user with an estimate of their precise location, but also a device that will not
interfere during the motions of the activity.
The primary purpose of a real time location tracking system is to provide a user a
visual display of their precise location within an environmental setting. However, for an
individual diagnosed with a visual impairment, the user may not have the ability to

146
acknowledge these visual displays. With this in mind, this specific system may be
deemed irrelevant for such an individual. Therefore, it should be suggested that one
design a form of sensory stimulation that could work in parallel with the real time
location tracking system. For instance, a wristband device could be designed to provide
some tactical feedback that could help guide an individual in some manner. In such a
design, the real time location tracking system will analyze the position of the individual
and send this analysis to the wristband device. This device will then have a tactical
feedback, which could be in the form of vibration, which could vibrate in different
regions of the lower arm that could suggest the user to move in a specific direction to
reach the basketball hoop. With a sensory stimulation device and real time location
tracking system functioning as a partnership, one could have a prominent system that
will be quite useful in assisting an individual, with a visual impairment, in participating in
various sporting activities, such as basketball.
It should be noted that such a technology should not be limited to being used for
various sporting activities, such as the sport of basketball. Instead, it should be
determined whether or not a RTLTS, based upon Passive RFID technology, could be used
in a different capacity. One potential application of such a system could be
implemented to determine whether or not an increase in interaction activity between a
patient and doctor, within a hospital setting, could lead to an increase in health. In
order to accomplish a task, the patient and doctor would each be identified with a
distinct Passive RFID Tag. The tags would then be continuously tracked by the system
within the systematic environment. Once these tags are within a pre-determined

147
distance from one another, the system could then have a feature that would allow for a
time interval to be measured. This time interval could then be used by the hospital staff
to determine how much time is truly spent between the patient and doctor. Therefore,
it should be noted that the use of Passive RFID, as the technological basis for a RTLTS,
could potentially provide for a vast array of applications, which is not limited to just
various sporting activities, but also for use in the clinical setting.

148
Appendix A: SolidWorks Design and Construction of Passive RFID Placeholder Stand
Materials to be used in Construction of Passive RFID
Placeholder Stand
Cutting 1” PVC Pipe into a Proper Length of Two Feet
Attaching a PVC Elbow to one end and a PVC T-Joint to the other end of the Two Foot Long 1” PVC Pipe

149
Completed Base of Passive RFID Antenna Placeholder Stand
Using Quarter Inch Drill Bit into PVC T-Joint
Fitting Wingnut into Quarter Inch Hole in PVC T-Joint

150
Use Quarter Inch Drill Bit to Create Corresponding Hole into 8” by 8”
Plywood
Attachment of Poynting Antenna onto 8” by8” Plywood with PVC
Structure
Final Attachment of Antenna onto Passive RFID Antenna Placeholder
Stand

151
Passive RFID Placeholder Stand
Front View of SolidWorks Design of Passive RFID Placeholder Stand
Top View of SolidWorks Design of Passive RFID Placeholder Stand
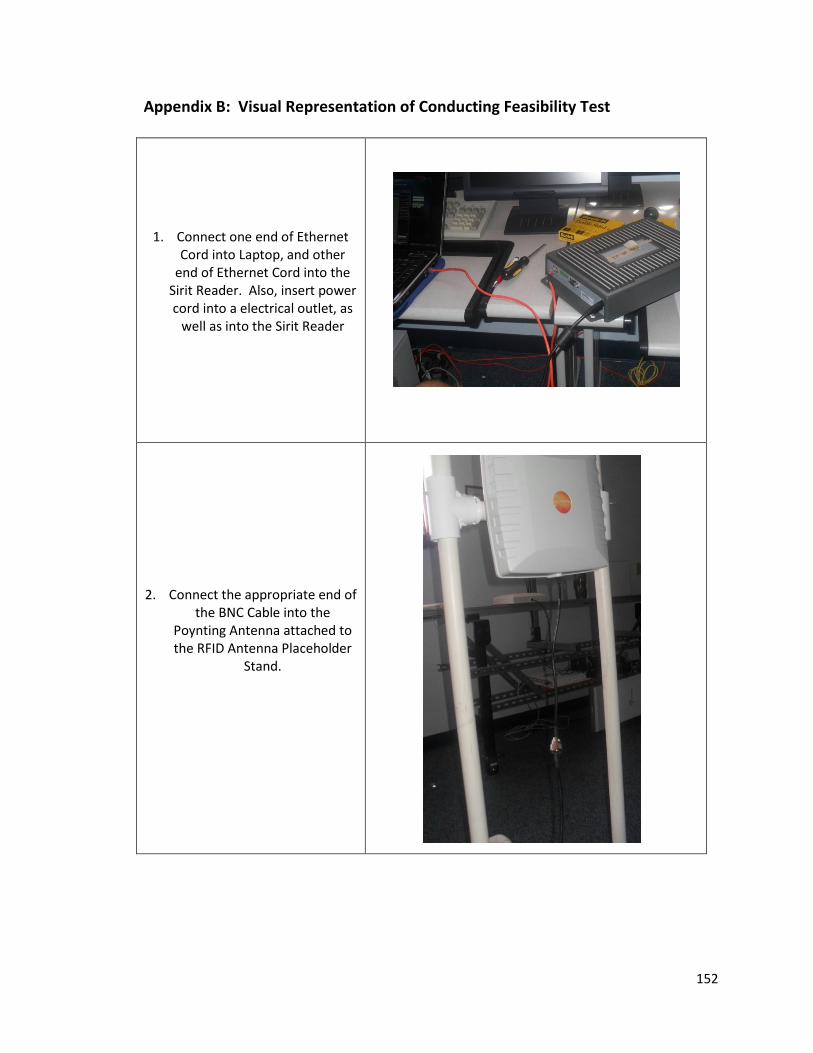
152
Appendix B: Visual Representation of Conducting Feasibility Test
1. Connect one end of Ethernet Cord into Laptop, and other
end of Ethernet Cord into the Sirit Reader. Also, insert power cord into a electrical outlet, as
well as into the Sirit Reader
2. Connect the appropriate end of the BNC Cable into the
Poynting Antenna attached to the RFID Antenna Placeholder
Stand.

153
3. Connect other end of BNC cable into one of the four inputs of Sirit Reader
4. Install Sirit Program into Laptop

154
5. Open Sirit Program and Home Screen of Program will be displayed. Next, select
“Configure.”
6. Once user selects “Configure,” program will direct user to a designated website
provided by Sirit. Under this new screen, user must select “View Tags”
7. Once under the Reader Operating mode, user must sign log into the
program with the following.
User name: Admin Password: readeradmin
Once logged in, select “Active” Mode and the user may change the time interval in
the same screen. User may then click “Start” in order to begin the reading of tags.

155
8. Summary of “View Tags” after a
completed time interval is the provided.
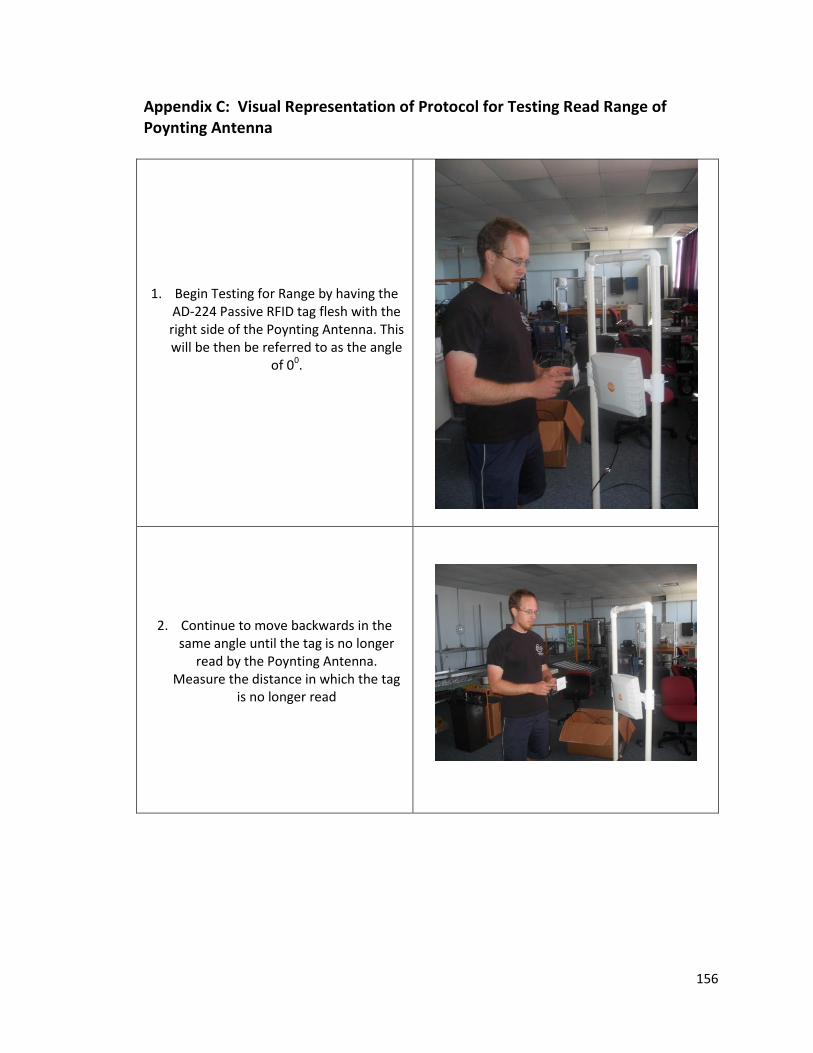
156
Appendix C: Visual Representation of Protocol for Testing Read Range of Poynting Antenna
1. Begin Testing for Range by having the AD-224 Passive RFID tag flesh with the right side of the Poynting Antenna. This will be then be referred to as the angle
of 00.
2. Continue to move backwards in the same angle until the tag is no longer
read by the Poynting Antenna. Measure the distance in which the tag
is no longer read

157
3. Repeat same test for every angle between 00 and 1800 at every interval
of 200.
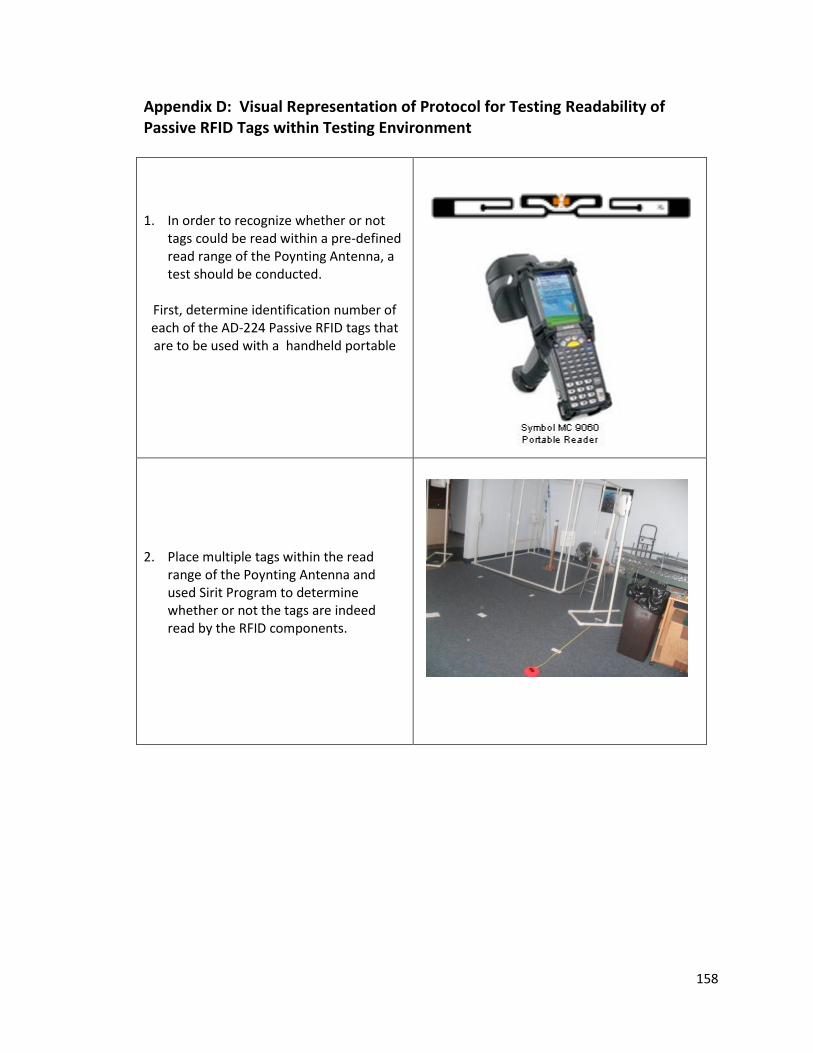
158
Appendix D: Visual Representation of Protocol for Testing Readability of Passive RFID Tags within Testing Environment 1. In order to recognize whether or not
tags could be read within a pre-defined read range of the Poynting Antenna, a test should be conducted.
First, determine identification number of each of the AD-224 Passive RFID tags that are to be used with a handheld portable
2. Place multiple tags within the read
range of the Poynting Antenna and used Sirit Program to determine whether or not the tags are indeed read by the RFID components.

159
Appendix E: Testing the Number of Times a Passive RFID tag is read through different activities
Activity #1: Test Subject Walks, within Environmental Setting, with Passive
RFID Tag
Activity#2: Test Subject Jogs, within Environmental Setting, with Passive
RFID Tag
Activity #3: Test Subject Walks, within Environmental Setting, with Passive
RFID Tag inside Nerf Ball

160
Activity #4: Test Subject Runs, within Environmental Setting, with Passive
RFID Tag inside Nerf Ball
Activity #5: Test Subjects Roll Nerf Ball, with Passive RFID Tag inside, Back and
Forth within Environmental Setting
Activity #6: Test Subjects Throws Nerf Ball, with Passive RFID Tag inside, Back and Forth within Environmental Setting

161
Appendix F: Directionality in Testing Cubic Structure
Direction 1: Front Direction
Direction 2: Backward Direction

162
Direction 3: Right Direction
Direction 4: Left Direction
Direction 5: 450 Direction

163
Direction 6: 1350 Direction

164
Appendix G: Height Change For Antenna
Height 1: Direct Line of Sight
Between Antenna and RFID Passive Tag
Height 2: One-foot Above Direct
Line of Sight Between Antenna and RFID Passive Tag
Height 3: One-foot Below Direct
Line of Sight Between Antenna and RFID Passive Tag

165
Appendix H: Testing Protocol for Original Software Code [by Mr. Tyler Peabody] and Modified Software Code Establishing Connection of all RFID Components of the System
1. Connect the power source cord into an electrical outlet and into the back end of the Sirit Reader.
2. Connect one end of the Ethernet Cord to a port of a laptop, and the other end of the Ethernet Cord to the port on the back end of the Sirit Reader.
3. Obtain four BNC cables. And, for each of the four antennas, connect the corresponding end of the BNC cable to the Poynting Antenna, and the other end into an input port of the Sirit Reader.
a. Reminder: Input 1 will correspond to Antenna 1, Input 2 will correspond to Antenna 2, Input 3 will correspond to Antenna 3, and Input 4 will correspond to Antenna 4.
4. To ensure that all connections are properly made, the use must look observe whether or not all LED lights [on the Sirit Reader] are green.
a. If a red LED light continues to flash, make sure that all connections are properly attached.
Creating Regional Zones for Testing Environment
1. In order to establish regional zones, it should be noted that three of the four antennas should be disconnected [remove the BNC cable from the inputs of the Sirit Reader]
2. Set attenuation of antenna at a desired value. a. For original software code, attenuation of antenna must be changed in
the Visual Basic command window. b. For modified software code, attenuation of antenna may be changed on
visual display in Visual Basic. 3. Begin testing by having the individual hold the tag flesh with the side of the
antenna, which is at a corresponding angle of 00 in relation to the side of the antenna.
4. Once in the proper position, record the number of times that specific tag is read by the Antenna over a five second time interval.
5. Next, have the individual take a one inch step backwards and once again record the number of times that specific tag is read.
6. Repeat this step in the same line of path until the tag is no longer reader by the antenna, which corresponds to the identification tag no longer being seen in the summary page of the software program.
7. Record the distance 8. Repeat same procedural step at an angle of 900 and 1800, with respect to the
other end of the antenna, and measure the corresponding distances 9. Once complete, do the same procedure for the other three Poynting Antennas. 10. Creation of Zones

166
a. To indicate the max distance, place a tape on the ground at that specific distance and consider this length [L1].
b. Next, once again use a measuring tape to identify the max read range of Antenna 2 [from the direction of Antenna 2 to Antenna 1].
i. Indicate this distance with another piece of tape and this distance will be referred to as length [L2].
c. To determine the zone between Antenna 1 and Antenna 2, use the guidance of the placements of the tape.
i. With this, it is determined that Zone 1 will only be the region that corresponds to [L1], while Zone 2 corresponds to the overlap of the lengths [L1 – L2], and Zone 3 will be the length that only has L2.
d. Next, repeat the these procedural steps for each side of the Testing Cubic Structure [i.e. for the side of Antenna 1 and Antenna 3, Antenna 2 and Antenna 4, and also Antenna 3 and Antenna 4].
e. By doing this, nine distinct zones will be established as the “regional zones” of the environmental setting.
Testing Accuracy of System
1. Prior to performing experimental tests on the accuracy of the system, one must ensure that all four of the Poynting Antennas have the desired Attenuation Levels.
2. Next, identify the identification tag number of the tag, to be tracked, with the use of a handheld RFID reader.
3. Once the ID number of tag has been identified, ensure that tag is recognized by system.
a. For original software code, the tag ID may be placed inside the code located in the Visual Basic command window.
b. For modified software code, select “StudentInfo” tab in Microsoft Access and place ID number into corresponding box.
4. Next, have the test subject enter zone 1 of the environmental setting. a. The first direction that is to be evaluated should be Direction 1[Front
Direction]. 5. The user may then select “Register” followed by “Start Tracking” in order to
begin testing. a. After a time period of five seconds, record whether or not the software
code [through the visual representation seen in Microsoft Access] is able to recognize that the RFID Passive Tag is indeed within Zone 1.
6. Next, have the test subject then move into Zone 2 holding the tag in the exact same position and direction and once again recording the accuracy of the detection process.
7. Repeat the same procedures for each of the nine zones. 8. Once complete, select “Stop Tracking” in order to deactivate the communication
pathway.

167
9. Repeat the same steps [1-8] for different directional positions as identified in Section 9 of Appendix .
10. Repeat the same steps [1-9] for different attenuation levels a. Attenuation Levels of 0, 15, 30, 50, and 100.

168
Appendix I: Directionality with Passive RFID Antenna Placeholder Stand
Direction 1: Front Direction
Direction 2: Backward Direction
Direction 3: Right Direction

169
Direction 4: Left Direction
Direction 5: 450 Direction
Direction 6: 1350 Direction

170
Appendix J: Guide to New Modifications in Visual Display Seen in Microsoft Access 2007
Summary Key 1. Represents Object 1 Being Tracked 2. Represents Object 2 Being Tracked 3. Visual Display that shows the number of objects being seen in at least one of the
nine zones. 4. Text Box that allows for the user to modify the Attenuation Level 5. Text Box that identifies the Antenna number that will be modified 6. Visual Display of the number of rounds that have been completed within that
cycle a. Pre-assigned to have 10 rounds per cycle.
7. Visual Display of the number of times each Antenna is able to read the corresponding Tag

171
a. First row represents a display that exhibits the number of times each antenna recognizes the first object.
i. First Box = First Antenna ii. Second Box = Second Antenna
iii. Third Box = Third Antenna iv. Fourth Box = Fourth Antenna
b. First row represents a display that exhibits the number of times each antenna recognizes the second object.
i. First Box = First Antenna ii. Second Box = Second Antenna
iii. Third Box = Third Antenna iv. Fourth Box = Fourth Antenna

172
Appendix K: Results for Read Accuracy Rate for Original Software Code Test Conducted in Cubic Testing Structure
Height Level 1: Antenna and RFID Passive tag have direct line of sight Height Level 2: Antenna one-foot above the straight line of sight to the Passive RFID tag Height Level 3: Antenna one-foot below the straight line of sight to the Passive RFID tag
Zone
Attenuation Level
Height Level
Direction 1 2 3 4 5 6 7 8 9 Total Objects
Read
100 1 1 1 0 0 0 0 0 0 0 0 1
2 0 0 0 0 0 0 1 0 0 1
3 0 0 0 0 0 0 0 0 0 0
4 1 0 0 0 0 0 0 0 0 1
5 0 0 0 0 0 0 0 0 0 0
6 0 0 0 0 0 0 0 0 0 0 Total
Objects Read
---
---
---
2 0 0 0 0 0 1 0 0 3
100 2 1 0 0 0 0 0 0 0 0 0 0
2 0 0 0 0 0 0 0 0 0 0
3 0 0 0 0 0 0 0 0 0 0
4 0 0 0 0 0 0 0 0 0 0
5 0 0 1 0 0 0 0 0 0 1
6 1 0 0 0 0 0 0 0 0 1 Total
Objects Read
---
---
---
1 0 1 0 0 0 0 0 0 2
100 3 1 0 0 0 0 0 0 0 0 0 0
2 0 0 0 0 0 0 0 0 1 1
3 0 0 0 0 0 0 0 0 0 0
4 0 0 0 0 0 0 0 0 0 0
5 0 0 0 0 0 0 0 0 0 0
6 0 0 0 0 0 0 0 0 0 0 Total
Objects Read
---
---
---
0 0 0 0 0 0 0 0 1 1

173
Test Conducted with the Four RFID Antenna Placeholder Stands Height Level 1: Antenna and RFID Passive tag have direct line of sight
Zone
Attenuation Level
Height Level
Direction 1 2 3 4 5 6 7 8 9 Total Objects
Read 0 1 1 0 0 0 0 0 0 0 0 0 0
2 0 0 0 0 0 0 0 0 1 1
3 0 0 1 0 0 0 0 0 0 1
4 0 0 0 0 0 0 0 0 0 0
5 0 0 1 0 0 0 0 0 0 1
6 1 0 0 0 0 0 0 0 0 1 Total
Objects Read
---
---
---
1 0 2 0 0 0 0 0 1 4
15 1 1 1 0 0 0 0 0 0 0 0 1
2 0 0 0 0 0 0 0 0 1 1
3 0 0 1 0 0 0 0 0 0 1
4 1 0 0 0 0 0 0 0 0 1
5 0 0 1 0 0 0 0 0 0 1
6 1 0 0 0 0 0 0 0 0 1 Total
Objects Read
---
---
---
3 0 2 0 0 0 0 0 1 6
30 1 1 0 0 0 0 0 0 0 1 0 1
2 0 0 0 0 0 0 1 0 0 1
3 0 0 0 0 0 0 0 0 1 1
4 1 0 0 0 0 0 0 0 0 1
5 0 0 1 0 0 0 0 0 0 1
6 0 0 0 0 0 0 0 0 0 0 Total
Objects Read
---
---
---
1 0 1 0 0 0 1 1 1 5
50 1 1 0 0 0 0 0 0 0 0 0 0
2 0 0 0 0 0 0 1 0 1 2
3 0 0 0 0 0 0 0 0 1 1
4 1 0 0 0 0 0 0 0 0 1
5 0 0 0 0 0 0 0 0 0 0
6 1 0 0 0 0 0 0 0 0 1 Total
Objects Read
---
---
---
2 0 0 0 0 0 1 0 2 5
100 1 1 0 0 0 0 0 0 0 0 0 0
2 0 0 0 0 0 0 0 0 0 0

174
3 0 0 0 0 0 0 0 0 1 1
4 0 0 0 0 0 0 1 0 0 1
5 0 0 1 0 0 0 0 0 1 2
6 0 0 0 0 0 0 1 0 0 1 Total
Objects Read
---
---
---
0 0 1 0 0 0 2 0 2 5
Height Level 2: Antenna one-foot above the straight line of sight to the Passive RFID tag
Zone
Attenuation Level
Height Level
Direction 1 2 3 4 5 6 7 8 9 Total Objects
Read 0 2 1 0 0 0 0 0 0 0 0 0 0
2 0 0 0 0 0 0 0 0 0 0
3 0 0 1 0 0 0 0 0 0 1
4 0 0 0 0 0 0 0 0 0 0
5 0 0 1 0 0 0 0 0 0 1
6 0 0 0 0 0 0 0 0 0 0 Total
Objects Read
---
---
---
0 0 2 0 0 0 0 0 0 2
15 2 1 0 0 0 0 0 0 0 0 0 0
2 0 0 0 0 0 0 0 0 1 1
3 0 0 0 0 0 0 0 0 0 0
4 0 0 0 0 0 0 0 0 0 0
5 0 0 0 0 0 0 0 0 0 0
6 0 0 0 0 0 0 0 0 0 0 Total
Objects Read
---
---
---
0 0 0 0 0 0 0 0 1 1
30 2 1 0 0 0 0 0 0 0 0 0 0
2 0 0 0 0 0 0 1 0 0 1
3 0 0 0 0 0 0 0 0 0 0
4 0 0 0 0 0 0 0 0 0 0
5 0 0 1 0 0 0 0 0 0 1
6 0 0 0 0 0 0 0 0 0 0 Total
Objects Read
---
---
---
0 0 1 0 0 0 1 0 0 2
50 2 1 1 0 0 0 0 0 0 0 0 1
2 0 0 0 0 0 0 1 0 0 1
3 0 0 0 0 0 0 0 0 0 0
4 1 0 0 0 0 0 0 0 0 1

175
5 0 0 0 0 0 0 0 0 0 0
6 0 0 0 0 0 0 0 0 0 0 Total
Objects Read
---
---
---
2 0 0 0 0 0 1 0 0 3
100 2 1 1 0 0 0 0 0 0 0 0 1
2 0 0 0 0 0 0 0 0 0 0
3 0 0 0 0 0 0 0 0 0 0
4 0 0 0 0 0 0 0 0 0 0
5 0 0 0 0 0 0 0 0 0 0
6 0 0 0 0 0 0 0 0 0 0 Total
Objects Read
---
---
---
1 0 0 0 0 0 0 0 0 1
Height Level 3: Antenna one-foot below the straight line of sight to the Passive RFID tag
Zone
Attenuation Level
Height Level
Direction 1 2 3 4 5 6 7 8 9 Total Objects
Read 0 3 1 0 0 1 0 0 0 0 0 0 1
2 0 0 0 0 0 0 0 0 1 1
3 0 0 0 0 0 0 0 0 0 0
4 0 0 0 0 0 0 0 0 0 0
5 0 0 0 0 0 0 0 0 0 0
6 0 0 0 0 0 0 0 0 0 0 Total
Objects Read
---
---
---
0 0 1 0 0 0 0 0 1 2
15 3 1 1 0 1 0 0 0 0 0 0 2
2 0 0 0 0 0 0 0 0 0 0
3 0 0 0 0 0 0 0 0 0 0
4 0 0 0 0 0 0 0 0 0 0
5 0 0 1 0 0 0 0 0 0 1
6 0 0 0 0 0 0 0 0 0 0 Total
Objects Read
---
---
---
1 0 2 0 0 0 0 0 0 3
30 3 1 0 0 1 0 0 0 0 0 0 1
2 0 0 0 0 0 0 0 0 0 0
3 0 0 0 0 0 0 0 0 0 0
4 0 0 0 0 0 0 0 0 0 0
5 0 0 0 0 0 0 0 0 1 1
6 0 0 0 0 0 0 0 0 0 0

176
Total Objects
Read
---
---
---
0 0 1 0 0 0 0 0 1 2
50 3 1 0 0 0 0 0 0 0 0 0 0
2 0 0 0 0 0 0 0 0 1 1
3 0 0 0 0 0 0 0 0 1 1
4 0 0 0 0 0 0 0 0 0 0
5 0 0 1 0 0 0 0 0 0 1
6 0 0 0 0 0 0 0 0 0 0 Total
Objects Read
---
---
---
0 0 1 0 0 0 0 0 2 3
100 3 1 0 0 0 0 0 0 0 0 0 0
2 0 0 0 0 0 0 0 0 0 0
3 0 0 0 0 0 0 0 0 0 0
4 0 0 0 0 0 0 0 0 0 0
5 0 0 0 0 0 0 0 0 0 0
6 1 0 0 0 0 0 0 0 0 1 Total
Objects Read
---
---
---
1 0 0 0 0 0 0 0 0 1

177
Appendix L: Results for Read Accuracy Rate for Modified Software Code [with one Passive RFID tag]
Test Conducted in Cubic Testing Structure Height Level 1: Antenna and RFID Passive tag have direct line of sight
Height Level 2: Antenna one-foot above the straight line of sight to the Passive RFID tag Height Level 3: Antenna one-foot below the straight line of sight to the Passive RFID tag
Zone
Attenuation Level
Height Level
Direction 1 2 3 4 5 6 7 8 9 Total Objects
Read
100 1 1 1 0 1 0 0 0 1 0 1 4
2 0 0 0 0 0 0 1 0 0 1
3 0 0 1 0 0 0 0 0 1 2
4 1 0 1 0 0 0 1 0 0 3
5 0 0 1 0 0 0 0 0 0 1
6 1 0 0 0 0 0 0 0 0 1 Total
Objects Read
---
---
---
3 0 4 0 0 0 3 0 2 12
100 2 1 1 0 1 0 0 0 0 0 0 2
2 0 0 0 0 0 0 1 0 0 1
3 0 0 1 0 0 0 0 0 0 1
4 1 0 0 0 0 0 1 0 0 2
5 0 0 1 0 0 0 0 0 0 1
6 1 0 0 0 0 0 0 0 0 1 Total
Objects Read
---
---
---
3 0 3 0 0 0 2 0 0 8
100 3 1 1 0 0 0 0 0 0 0 0 1
2 0 0 0 0 0 0 0 0 1 1
3 1 0 0 0 0 0 0 0 0 1
4 0 0 1 0 0 0 1 0 0 2
5 0 0 1 0 0 0 0 0 0 1
6 1 0 0 0 0 0 0 0 0 1 Total
Objects Read
---
---
---
3 0 2 0 0 0 1 0 1 7
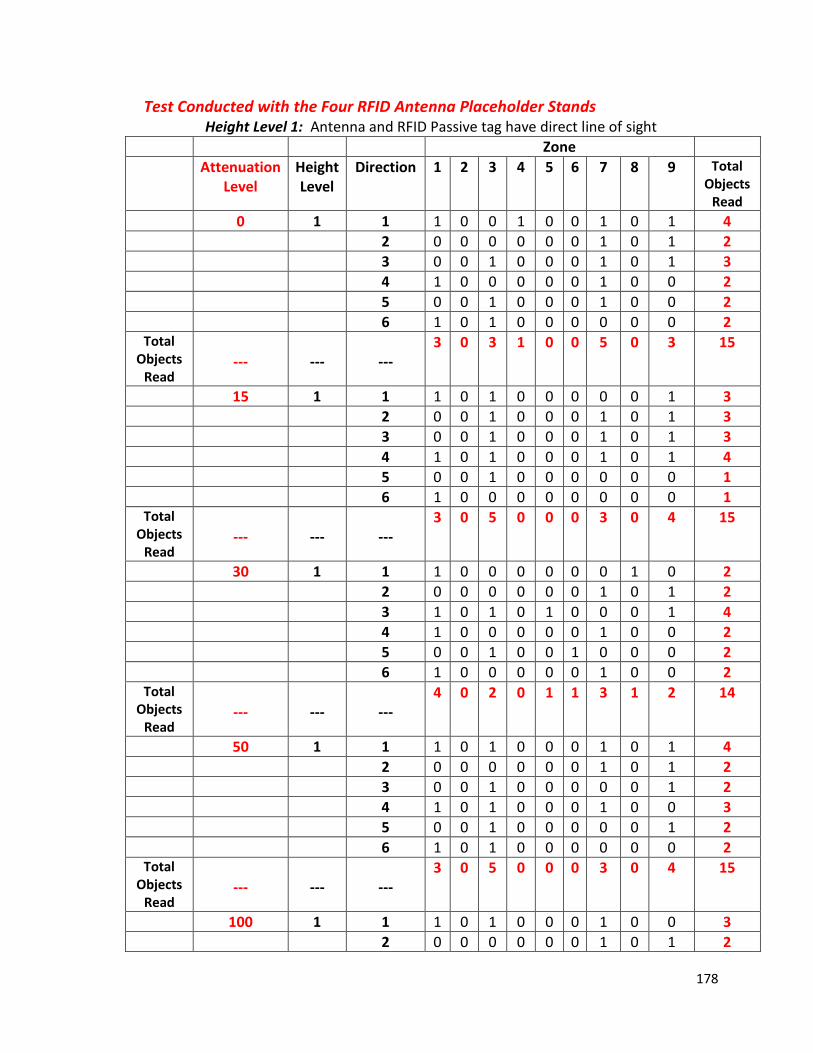
178
Test Conducted with the Four RFID Antenna Placeholder Stands Height Level 1: Antenna and RFID Passive tag have direct line of sight
Zone
Attenuation Level
Height Level
Direction 1 2 3 4 5 6 7 8 9 Total Objects
Read 0 1 1 1 0 0 1 0 0 1 0 1 4
2 0 0 0 0 0 0 1 0 1 2
3 0 0 1 0 0 0 1 0 1 3
4 1 0 0 0 0 0 1 0 0 2
5 0 0 1 0 0 0 1 0 0 2
6 1 0 1 0 0 0 0 0 0 2 Total
Objects Read
---
---
---
3 0 3 1 0 0 5 0 3 15
15 1 1 1 0 1 0 0 0 0 0 1 3
2 0 0 1 0 0 0 1 0 1 3
3 0 0 1 0 0 0 1 0 1 3
4 1 0 1 0 0 0 1 0 1 4
5 0 0 1 0 0 0 0 0 0 1
6 1 0 0 0 0 0 0 0 0 1 Total
Objects Read
---
---
---
3 0 5 0 0 0 3 0 4 15
30 1 1 1 0 0 0 0 0 0 1 0 2
2 0 0 0 0 0 0 1 0 1 2
3 1 0 1 0 1 0 0 0 1 4
4 1 0 0 0 0 0 1 0 0 2
5 0 0 1 0 0 1 0 0 0 2
6 1 0 0 0 0 0 1 0 0 2 Total
Objects Read
---
---
---
4 0 2 0 1 1 3 1 2 14
50 1 1 1 0 1 0 0 0 1 0 1 4
2 0 0 0 0 0 0 1 0 1 2
3 0 0 1 0 0 0 0 0 1 2
4 1 0 1 0 0 0 1 0 0 3
5 0 0 1 0 0 0 0 0 1 2
6 1 0 1 0 0 0 0 0 0 2 Total
Objects Read
---
---
---
3 0 5 0 0 0 3 0 4 15
100 1 1 1 0 1 0 0 0 1 0 0 3
2 0 0 0 0 0 0 1 0 1 2

179
3 0 0 1 0 0 0 0 0 0 1
4 1 0 1 0 0 0 1 0 0 3
5 0 0 1 0 0 0 0 0 1 2
6 1 0 0 0 0 0 1 0 0 2 Total
Objects Read
---
---
---
3 0 4 0 0 0 4 0 2 13
Height Level 2: Antenna one-foot above the straight line of sight to the Passive RFID tag
Zone
Attenuation Level
Height Level
Direction 1 2 3 4 5 6 7 8 9 Total Objects
Read 0 2 1 0 0 0 1 0 0 0 0 1 2
2 0 0 0 0 0 0 1 0 0 1
3 0 0 0 0 0 0 0 0 1 1
4 1 0 0 0 0 0 0 0 0 1
5 0 0 0 0 0 0 0 0 0 0
6 0 0 0 0 0 0 0 0 0 0 Total
Objects Read
---
---
---
1 0 0 1 0 0 1 0 2 5
15 2 1 0 0 1 0 0 0 0 0 0 1
2 0 0 0 0 0 0 0 0 1 1
3 0 0 0 0 0 0 0 0 1 1
4 1 0 0 0 0 0 1 0 0 2
5 0 0 0 0 0 0 0 0 1 1
6 0 0 0 0 0 0 0 0 0 0 Total
Objects Read
---
---
---
1 0 1 0 0 0 1 0 3 6
30 2 1 1 0 1 0 0 0 0 0 0 2
2 0 0 0 0 0 0 1 0 1 2
3 0 0 1 0 0 0 0 0 0 1
4 0 0 0 0 0 0 1 0 0 1
5 0 0 0 0 0 0 0 0 0 0
6 0 0 0 0 0 0 0 0 0 0 Total
Objects Read
---
---
---
1 0 2 0 0 0 2 0 1 6
50 2 1 1 0 1 0 0 0 0 0 0 2
2 0 0 0 0 0 0 1 0 0 1
3 0 0 0 0 0 0 0 0 1 1
4 1 0 0 0 0 0 1 0 0 2

180
5 0 0 0 0 0 0 0 0 0 0
6 0 0 0 0 0 0 0 0 0 0 Total
Objects Read
---
---
---
2 0 1 0 0 0 2 0 1 6
100 2 1 1 0 1 0 0 0 1 0 0 3
2 0 0 0 0 0 0 1 0 0 1
3 0 0 0 0 0 0 0 0 0 0
4 1 0 0 0 0 0 0 0 0 1
5 0 0 1 0 0 0 0 0 0 1
6 1 0 0 0 0 0 0 0 0 1 Total
Objects Read
---
---
---
3 0 2 0 0 0 2 0 0 7
Height Level 3: Antenna one-foot below the straight line of sight to the Passive RFID tag
Zone
Attenuation Level
Height Level
Direction 1 2 3 4 5 6 7 8 9 Total Objects
Read 0 3 1 0 0 1 0 0 0 0 0 0 1
2 0 0 0 0 0 0 1 0 1 2
3 0 0 1 0 0 0 0 0 1 2
4 0 0 0 0 0 0 1 0 0 1
5 0 0 1 0 0 0 0 0 0 1
6 1 0 0 0 0 0 0 0 0 1 Total
Objects Read
---
---
---
1 0 3 0 0 0 2 0 2 8
15 3 1 1 0 1 0 0 0 0 0 0 2
2 0 0 0 0 0 0 1 0 1 2
3 0 0 1 0 0 0 0 0 0 1
4 1 0 0 0 0 0 1 0 0 2
5 0 0 0 0 0 0 0 0 0 0
6 1 0 0 0 0 0 0 0 0 1 Total
Objects Read
---
---
---
3 0 2 0 0 0 2 0 1 8
30 3 1 1 0 1 0 0 0 0 0 0 2
2 0 0 0 0 0 0 1 0 1 2
3 0 0 1 0 0 0 0 0 1 2
4 1 0 0 0 0 0 1 0 0 2
5 0 0 1 0 0 0 0 0 0 1
6 0 0 0 0 0 0 0 0 0 0

181
Total Objects
Read
---
---
---
2 0 3 0 0 0 2 0 2 9
50 3 1 1 0 1 0 0 0 0 0 0 2
2 0 0 0 0 0 0 1 0 1 2
3 0 0 0 0 0 0 0 0 1 1
4 1 0 0 0 0 0 1 0 0 2
5 0 0 1 0 0 0 0 0 0 1
6 0 0 0 0 0 0 1 0 0 1 Total
Objects Read
---
---
---
2 0 2 0 0 0 3 0 2 9
100 3 1 1 0 1 0 0 0 1 0 0 3
2 0 0 0 0 0 0 1 0 0 1
3 0 0 1 0 0 0 0 0 0 1
4 0 0 0 0 0 0 0 0 0 0
5 0 0 1 0 0 0 0 0 0 1
6 0 0 0 0 0 0 0 0 0 0 Total
Objects Read
---
---
---
1 0 3 0 0 0 2 0 0 6

182
Appendix M: Results for Read Accuracy Rate for Modified Software Code [with two Passive RFID tag]
Test Conducted in Cubic Testing Structure Height Level 1: Antenna and RFID Passive tag have direct line of sight
Height Level 2: Antenna one-foot above the straight line of sight to the Passive RFID tag Height Level 3: Antenna one-foot below the straight line of sight to the Passive RFID tag
Zone
Attenuation Level
Height Level
Direction 1 2 3 4 5 6 7 8 9 Total Objects
Read
100 1 1 1 1 1 0 0 0 0 1 0 4
2 1 1 1 0 0 0 0 1 0 4
3 1 0 0 1 1 1 1 0 1 6
4 1 0 0 0 1 1 0 0 1 4
5 1 0 0 0 1 0 1 0 0 3
6 1 0 1 0 0 0 0 0 1 3 Total
Objects Read
---
---
---
6 2 3 1 3 2 2 2 3 24
100 2 1 1 0 1 0 0 0 0 1 0 3
2 1 1 1 0 0 0 0 0 0 3
3 0 0 0 1 1 1 1 0 0 4
4 0 0 0 0 1 1 0 0 0 2
5 1 0 0 0 0 0 1 0 0 2
6 1 0 1 0 0 0 0 0 0 2 Total
Objects Read
---
---
---
4 1 3 1 2 2 2 1 0 16
100 3 1 0 0 1 0 0 0 0 1 1 3
2 1 0 1 0 0 0 1 0 0 3
3 0 0 0 1 1 1 0 0 0 3
4 1 0 0 0 0 1 0 0 1 3
5 1 0 0 0 0 0 1 0 1 3
6 1 0 0 0 0 0 0 0 0 1 Total
Objects Read
---
---
---
4 0 2 1 1 2 2 1 3 16

183
Test Conducted with the Four RFID Antenna Placeholder Stands Height Level 1: Antenna and RFID Passive tag have direct line of sight
Zone
Attenuation Level
Height Level
Direction 1 2 3 4 5 6 7 8 9 Total Objects
Read 0 1 1 1 1 1 0 0 0 1 1 1 6
2 1 1 1 0 1 0 0 1 0 5
3 1 0 0 1 1 0 0 0 1 4
4 1 0 1 0 1 1 0 0 0 4
5 1 0 0 0 1 0 0 0 1 3
6 1 0 0 0 0 0 1 0 1 3 Total
Objects Read
---
---
---
6 2 3 1 4 1 2 2 4 25
15 1 1 1 0 1 0 0 0 1 0 1 4
2 1 0 1 0 0 0 1 0 1 4
3 1 0 1 0 1 0 1 0 1 5
4 1 1 1 0 1 0 1 0 1 6
5 1 0 1 0 0 0 1 0 1 4
6 1 0 1 0 0 0 1 0 0 3 Total
Objects Read
---
---
---
6 1 6 0 2 0 6 0 5 26
30 1 1 1 1 1 0 1 0 0 1 1 6
2 1 1 0 0 1 1 1 0 1 6
3 1 0 1 0 1 0 1 0 1 5
4 1 0 0 0 1 0 1 0 0 3
5 0 1 1 0 0 1 0 0 0 3
6 1 0 0 1 0 0 1 0 0 3 Total
Objects Read
---
---
---
5 3 3 1 4 2 4 1 3 26
50 1 1 1 0 1 1 1 0 1 0 1 6
2 1 0 1 0 1 0 1 0 1 5
3 0 0 1 0 1 0 1 0 1 4
4 1 0 1 0 0 0 1 0 1 4
5 0 0 1 1 0 1 0 0 1 4
6 1 0 0 0 0 0 0 1 0 2 Total
Objects Read
---
---
---
4 0 5 2 3 1 4 1 5 25
100 1 1 1 1 1 0 0 0 1 1 1 6
2 1 1 1 0 0 0 1 0 1 5
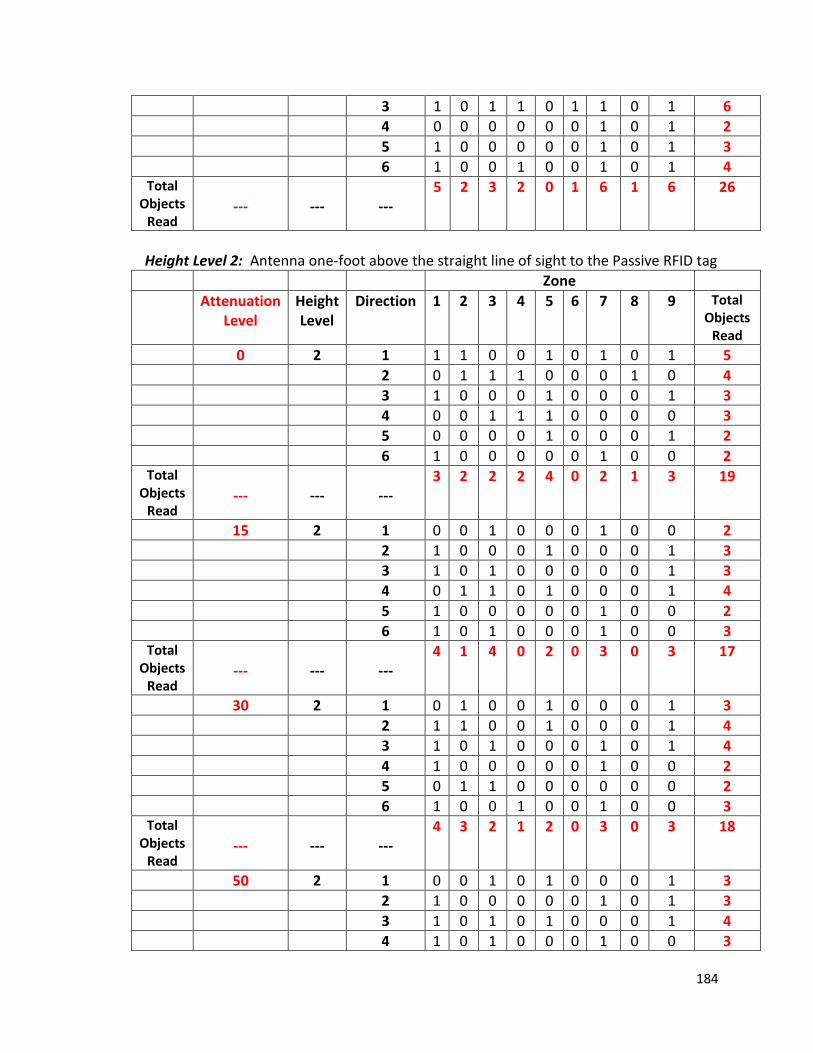
184
3 1 0 1 1 0 1 1 0 1 6
4 0 0 0 0 0 0 1 0 1 2
5 1 0 0 0 0 0 1 0 1 3
6 1 0 0 1 0 0 1 0 1 4 Total
Objects Read
---
---
---
5 2 3 2 0 1 6 1 6 26
Height Level 2: Antenna one-foot above the straight line of sight to the Passive RFID tag
Zone
Attenuation Level
Height Level
Direction 1 2 3 4 5 6 7 8 9 Total Objects
Read 0 2 1 1 1 0 0 1 0 1 0 1 5
2 0 1 1 1 0 0 0 1 0 4
3 1 0 0 0 1 0 0 0 1 3
4 0 0 1 1 1 0 0 0 0 3
5 0 0 0 0 1 0 0 0 1 2
6 1 0 0 0 0 0 1 0 0 2 Total
Objects Read
---
---
---
3 2 2 2 4 0 2 1 3 19
15 2 1 0 0 1 0 0 0 1 0 0 2
2 1 0 0 0 1 0 0 0 1 3
3 1 0 1 0 0 0 0 0 1 3
4 0 1 1 0 1 0 0 0 1 4
5 1 0 0 0 0 0 1 0 0 2
6 1 0 1 0 0 0 1 0 0 3 Total
Objects Read
---
---
---
4 1 4 0 2 0 3 0 3 17
30 2 1 0 1 0 0 1 0 0 0 1 3
2 1 1 0 0 1 0 0 0 1 4
3 1 0 1 0 0 0 1 0 1 4
4 1 0 0 0 0 0 1 0 0 2
5 0 1 1 0 0 0 0 0 0 2
6 1 0 0 1 0 0 1 0 0 3 Total
Objects Read
---
---
---
4 3 2 1 2 0 3 0 3 18
50 2 1 0 0 1 0 1 0 0 0 1 3
2 1 0 0 0 0 0 1 0 1 3
3 1 0 1 0 1 0 0 0 1 4
4 1 0 1 0 0 0 1 0 0 3

185
5 0 0 1 0 0 0 0 0 1 2
6 1 0 0 0 1 0 0 1 0 3 Total
Objects Read
---
---
---
4 0 4 0 3 0 2 1 4 18
100 2 1 0 0 1 0 1 1 0 1 0 4
2 1 1 0 0 0 0 0 0 1 3
3 0 0 1 0 0 1 1 0 0 3
4 1 0 0 0 1 0 1 0 0 3
5 0 1 1 0 0 0 0 0 1 3
6 1 0 0 0 1 0 0 0 0 2 Total
Objects Read
---
---
---
3 2 3 0 3 2 2 1 2 18
Height Level 3: Antenna one-foot below the straight line of sight to the Passive RFID tag
Zone
Attenuation Level
Height Level
Direction 1 2 3 4 5 6 7 8 9 Total Objects
Read 0 3 1 1 0 1 0 1 0 1 0 0 4
2 0 1 0 1 0 0 0 1 1 4
3 0 0 1 0 1 0 0 0 1 3
4 1 0 0 0 1 0 1 0 0 3
5 0 0 1 0 0 0 0 0 1 2
6 1 0 0 0 0 0 0 1 0 2 Total
Objects Read
---
---
---
3 1 3 1 3 0 2 2 3 18
15 3 1 1 0 1 0 0 1 1 0 0 4
2 0 0 0 0 1 0 1 0 1 3
3 0 0 1 0 1 0 1 0 1 4
4 0 1 0 0 1 0 0 0 1 3
5 1 0 0 0 0 0 1 0 1 3
6 0 0 1 0 0 0 1 0 0 2 Total
Objects Read
---
---
---
2 1 3 0 3 1 5 0 4 19
30 1 1 1 1 0 0 1 0 0 0 0 3
2 0 1 0 0 1 0 0 0 1 3
3 1 0 1 0 0 1 0 0 0 3
4 0 0 1 0 0 0 1 1 0 3
5 1 0 1 0 0 0 1 0 0 3
6 1 0 0 1 0 0 1 0 0 3

186
Total Objects
Read
---
---
---
4 2 3 1 2 1 3 1 1 18
50 1 1 1 0 1 0 1 0 0 0 1 4
2 1 0 0 0 1 0 1 0 1 4
3 1 0 0 0 1 0 0 0 0 2
4 1 0 0 0 0 0 1 0 0 2
5 0 0 1 0 0 1 0 0 1 3
6 1 0 0 1 0 0 0 1 0 3 Total
Objects Read
---
---
---
5 0 2 1 3 1 2 1 3 18
100 1 1 0 0 0 1 1 1 0 1 0 4
2 1 0 0 1 0 0 0 0 1 3
3 0 0 1 1 0 1 1 0 0 4
4 1 1 0 0 0 0 1 0 0 3
5 0 0 1 1 0 0 0 1 0 3
6 0 1 0 0 1 0 0 0 0 2 Total
Objects Read
---
---
---
2 2 2 4 2 2 2 2 1 19

187
Appendix N: Results for Read Accuracy Rate for Modified Software Code [with three Passive RFID tag] Test Conducted in Cubic Testing Structure
Height Level 1: Antenna and RFID Passive tag have direct line of sight Height Level 2: Antenna one-foot above the straight line of sight to the Passive RFID tag Height Level 3: Antenna one-foot below the straight line of sight to the Passive RFID tag
Zone
Attenuation Level
Height Level
Direction 1 2 3 4 5 6 7 8 9 Total Objects
Read
100 1 1 1 0 1 1 0 0 0 1 1 5
2 1 1 0 0 1 0 1 1 1 6
3 1 1 1 0 1 1 1 0 1 7
4 1 1 0 0 1 1 1 0 1 6
5 1 0 1 0 0 1 0 0 1 4
6 1 1 0 0 0 1 1 0 0 4 Total
Objects Read
---
---
---
6 3 3 1 3 4 4 2 5 32
100 2 1 1 0 0 1 0 0 0 1 0 3
2 1 0 0 0 1 0 0 1 1 4
3 1 1 1 0 0 1 1 0 1 6
4 1 1 0 0 1 0 1 0 1 5
5 0 0 1 0 0 1 0 0 1 3
6 1 1 0 0 0 1 1 0 0 4 Total
Objects Read
---
---
---
5 3 2 1 2 3 3 2 4 25
100 3 1 1 0 1 1 0 0 0 1 0 4
2 0 0 0 0 1 0 1 1 1 4
3 0 1 1 0 0 1 1 0 0 4
4 1 0 0 1 1 0 1 0 1 5
5 0 0 1 0 1 1 0 0 1 4
6 1 1 1 0 0 1 1 0 0 5 Total
Objects Read
---
---
---
3 2 4 2 3 3 4 2 3 26
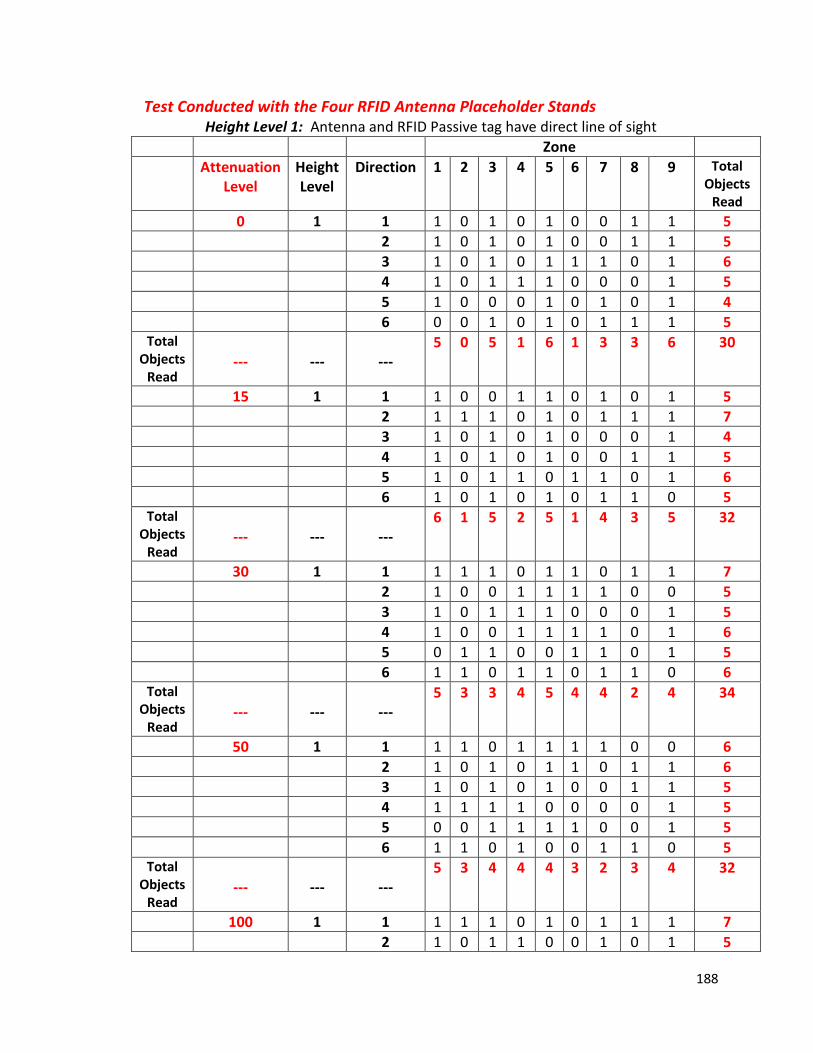
188
Test Conducted with the Four RFID Antenna Placeholder Stands Height Level 1: Antenna and RFID Passive tag have direct line of sight
Zone
Attenuation Level
Height Level
Direction 1 2 3 4 5 6 7 8 9 Total Objects
Read 0 1 1 1 0 1 0 1 0 0 1 1 5
2 1 0 1 0 1 0 0 1 1 5
3 1 0 1 0 1 1 1 0 1 6
4 1 0 1 1 1 0 0 0 1 5
5 1 0 0 0 1 0 1 0 1 4
6 0 0 1 0 1 0 1 1 1 5 Total
Objects Read
---
---
---
5 0 5 1 6 1 3 3 6 30
15 1 1 1 0 0 1 1 0 1 0 1 5
2 1 1 1 0 1 0 1 1 1 7
3 1 0 1 0 1 0 0 0 1 4
4 1 0 1 0 1 0 0 1 1 5
5 1 0 1 1 0 1 1 0 1 6
6 1 0 1 0 1 0 1 1 0 5 Total
Objects Read
---
---
---
6 1 5 2 5 1 4 3 5 32
30 1 1 1 1 1 0 1 1 0 1 1 7
2 1 0 0 1 1 1 1 0 0 5
3 1 0 1 1 1 0 0 0 1 5
4 1 0 0 1 1 1 1 0 1 6
5 0 1 1 0 0 1 1 0 1 5
6 1 1 0 1 1 0 1 1 0 6 Total
Objects Read
---
---
---
5 3 3 4 5 4 4 2 4 34
50 1 1 1 1 0 1 1 1 1 0 0 6
2 1 0 1 0 1 1 0 1 1 6
3 1 0 1 0 1 0 0 1 1 5
4 1 1 1 1 0 0 0 0 1 5
5 0 0 1 1 1 1 0 0 1 5
6 1 1 0 1 0 0 1 1 0 5 Total
Objects Read
---
---
---
5 3 4 4 4 3 2 3 4 32
100 1 1 1 1 1 0 1 0 1 1 1 7
2 1 0 1 1 0 0 1 0 1 5
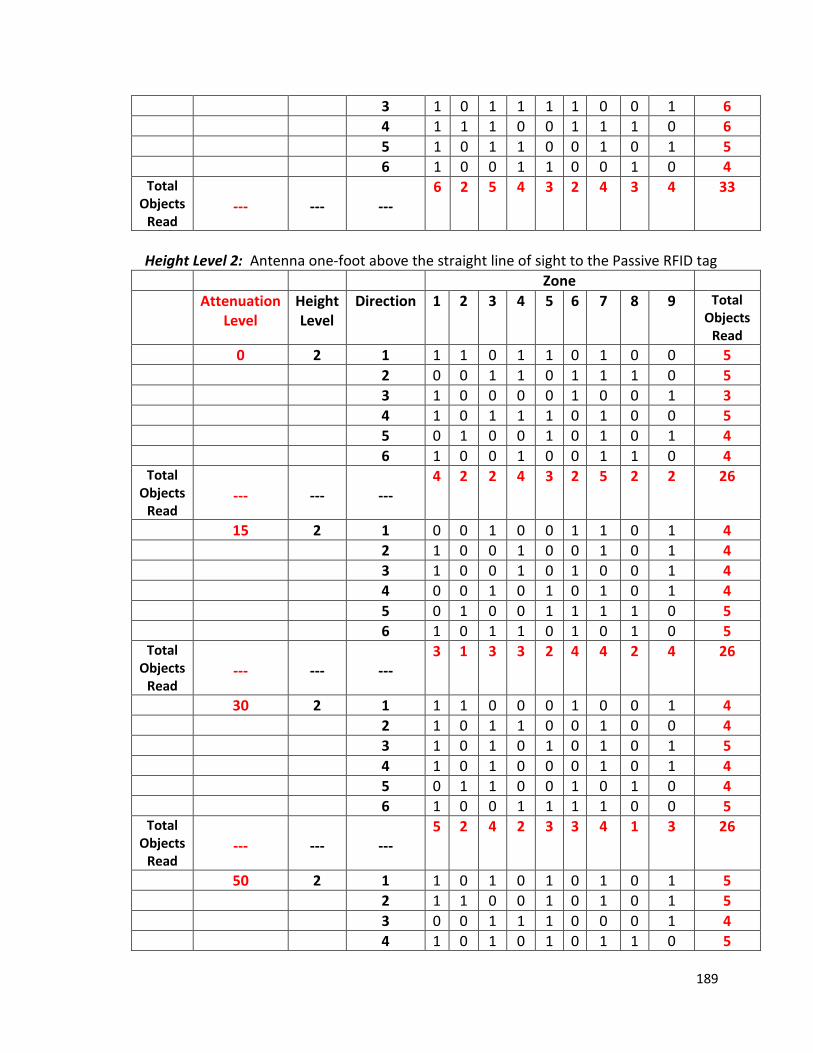
189
3 1 0 1 1 1 1 0 0 1 6
4 1 1 1 0 0 1 1 1 0 6
5 1 0 1 1 0 0 1 0 1 5
6 1 0 0 1 1 0 0 1 0 4 Total
Objects Read
---
---
---
6 2 5 4 3 2 4 3 4 33
Height Level 2: Antenna one-foot above the straight line of sight to the Passive RFID tag
Zone
Attenuation Level
Height Level
Direction 1 2 3 4 5 6 7 8 9 Total Objects
Read 0 2 1 1 1 0 1 1 0 1 0 0 5
2 0 0 1 1 0 1 1 1 0 5
3 1 0 0 0 0 1 0 0 1 3
4 1 0 1 1 1 0 1 0 0 5
5 0 1 0 0 1 0 1 0 1 4
6 1 0 0 1 0 0 1 1 0 4 Total
Objects Read
---
---
---
4 2 2 4 3 2 5 2 2 26
15 2 1 0 0 1 0 0 1 1 0 1 4
2 1 0 0 1 0 0 1 0 1 4
3 1 0 0 1 0 1 0 0 1 4
4 0 0 1 0 1 0 1 0 1 4
5 0 1 0 0 1 1 1 1 0 5
6 1 0 1 1 0 1 0 1 0 5 Total
Objects Read
---
---
---
3 1 3 3 2 4 4 2 4 26
30 2 1 1 1 0 0 0 1 0 0 1 4
2 1 0 1 1 0 0 1 0 0 4
3 1 0 1 0 1 0 1 0 1 5
4 1 0 1 0 0 0 1 0 1 4
5 0 1 1 0 0 1 0 1 0 4
6 1 0 0 1 1 1 1 0 0 5 Total
Objects Read
---
---
---
5 2 4 2 3 3 4 1 3 26
50 2 1 1 0 1 0 1 0 1 0 1 5
2 1 1 0 0 1 0 1 0 1 5
3 0 0 1 1 1 0 0 0 1 4
4 1 0 1 0 1 0 1 1 0 5

190
5 1 0 1 0 0 1 0 0 1 4
6 1 0 0 1 0 0 0 1 0 3 Total
Objects Read
---
---
---
5 1 4 2 4 1 3 2 4 26
100 2 1 0 1 0 1 0 1 0 1 0 4
2 1 1 0 0 1 0 0 0 1 4
3 0 1 0 0 0 1 0 1 0 3
4 0 1 0 0 1 0 0 0 1 3
5 1 1 1 0 1 0 1 0 1 6
6 1 0 0 0 1 1 1 0 1 5 Total
Objects Read
---
---
---
3 5 1 1 4 3 2 2 4 25
Height Level 3: Antenna one-foot below the straight line of sight to the Passive RFID tag
Zone
Attenuation Level
Height Level
Direction 1 2 3 4 5 6 7 8 9 Total Objects
Read 0 3 1 1 0 0 1 1 0 1 0 0 4
2 1 0 0 0 1 0 0 0 1 3
3 1 0 1 0 1 0 1 0 1 5
4 1 1 0 0 1 0 1 1 0 5
5 0 0 1 0 1 1 0 0 1 4
6 1 0 1 0 1 0 1 1 0 5 Total
Objects Read
---
---
---
5 1 3 1 6 1 4 2 3 26
15 3 1 1 0 1 0 0 1 0 1 0 4
2 0 1 0 1 0 0 1 0 1 4
3 0 0 1 0 1 1 1 0 1 5
4 1 1 0 1 1 0 0 0 1 5
5 1 0 0 1 0 1 1 0 1 5
6 0 1 1 0 1 0 1 0 0 4 Total
Objects Read
---
---
---
3 3 3 3 3 3 4 1 4 27
30 1 1 1 1 0 0 1 0 0 1 1 5
2 0 1 1 0 1 1 1 0 0 5
3 1 0 1 0 0 1 0 1 0 4
4 1 0 1 1 0 0 1 1 0 5
5 0 0 1 1 1 0 1 0 0 4
6 1 0 0 1 0 0 1 0 1 4

191
Total Objects
Read
---
---
---
4 2 4 3 3 2 4 3 2 27
50 1 1 1 0 1 1 1 1 0 0 1 6
2 1 1 0 1 0 0 1 0 1 5
3 0 0 1 1 1 0 0 1 0 4
4 1 1 1 0 1 0 0 0 1 5
5 0 1 0 0 0 1 0 0 1 3
6 0 0 0 1 0 0 1 1 0 3 Total
Objects Read
---
---
---
3 3 3 4 3 2 2 2 4 26
100 1 1 0 1 0 1 1 1 0 1 0 5
2 1 0 0 1 1 0 1 0 1 5
3 0 0 1 1 0 1 1 1 0 5
4 1 0 1 0 1 0 1 1 0 5
5 1 0 0 1 0 1 0 1 0 4
6 0 1 0 0 1 0 0 0 1 3 Total
Objects Read
---
---
---
3 2 2 4 4 3 3 4 2 27

192
Appendix O: Results for Read Accuracy Rate for Modified Software Code [with four Passive RFID tag]
Test Conducted in Cubic Testing Structure Height Level 1: Antenna and RFID Passive tag have direct line of sight
Height Level 2: Antenna one-foot above the straight line of sight to the Passive RFID tag Height Level 3: Antenna one-foot below the straight line of sight to the Passive RFID tag
Zone
Attenuation Level
Height Level
Direction 1 2 3 4 5 6 7 8 9 Total Objects
Read
100 1 1 1 0 1 1 1 1 0 1 1 7
2 1 0 0 1 1 0 1 1 1 6
3 1 1 1 0 1 1 1 1 1 8
4 1 1 0 0 1 1 1 0 1 6
5 1 0 1 1 0 1 1 0 1 6
6 1 1 0 1 0 1 1 0 1 6 Total
Objects Read
---
---
---
6 3 3 4 4 5 5 3 6 39
100 2 1 1 0 0 1 0 1 0 1 1 5
2 1 1 0 0 1 1 0 1 1 6
3 1 1 0 0 1 1 1 0 1 6
4 1 0 1 0 1 0 1 0 1 5
5 0 1 1 0 0 1 1 0 1 5
6 1 1 0 1 0 1 1 0 0 5 Total
Objects Read
---
---
---
5 4 2 2 3 5 4 2 5 32
100 3 1 1 1 1 1 0 1 0 1 0 6
2 0 1 0 1 1 0 1 0 1 5
3 0 1 0 1 0 1 1 0 1 5
4 1 0 1 0 1 0 1 0 1 5
5 1 0 1 0 1 1 0 1 1 6
6 1 0 1 0 1 1 1 1 0 6 Total
Objects Read
---
---
---
4 3 4 3 4 4 4 3 4 33
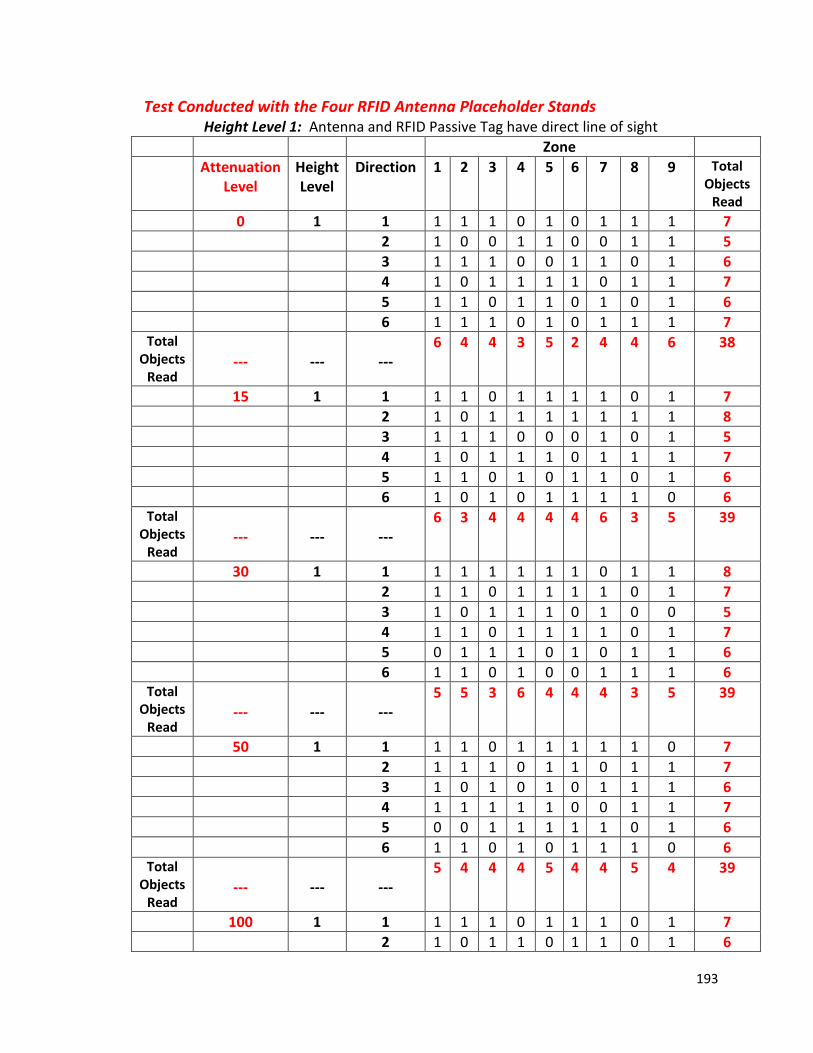
193
Test Conducted with the Four RFID Antenna Placeholder Stands Height Level 1: Antenna and RFID Passive Tag have direct line of sight
Zone
Attenuation Level
Height Level
Direction 1 2 3 4 5 6 7 8 9 Total Objects
Read 0 1 1 1 1 1 0 1 0 1 1 1 7
2 1 0 0 1 1 0 0 1 1 5
3 1 1 1 0 0 1 1 0 1 6
4 1 0 1 1 1 1 0 1 1 7
5 1 1 0 1 1 0 1 0 1 6
6 1 1 1 0 1 0 1 1 1 7 Total
Objects Read
---
---
---
6 4 4 3 5 2 4 4 6 38
15 1 1 1 1 0 1 1 1 1 0 1 7
2 1 0 1 1 1 1 1 1 1 8
3 1 1 1 0 0 0 1 0 1 5
4 1 0 1 1 1 0 1 1 1 7
5 1 1 0 1 0 1 1 0 1 6
6 1 0 1 0 1 1 1 1 0 6 Total
Objects Read
---
---
---
6 3 4 4 4 4 6 3 5 39
30 1 1 1 1 1 1 1 1 0 1 1 8
2 1 1 0 1 1 1 1 0 1 7
3 1 0 1 1 1 0 1 0 0 5
4 1 1 0 1 1 1 1 0 1 7
5 0 1 1 1 0 1 0 1 1 6
6 1 1 0 1 0 0 1 1 1 6 Total
Objects Read
---
---
---
5 5 3 6 4 4 4 3 5 39
50 1 1 1 1 0 1 1 1 1 1 0 7
2 1 1 1 0 1 1 0 1 1 7
3 1 0 1 0 1 0 1 1 1 6
4 1 1 1 1 1 0 0 1 1 7
5 0 0 1 1 1 1 1 0 1 6
6 1 1 0 1 0 1 1 1 0 6 Total
Objects Read
---
---
---
5 4 4 4 5 4 4 5 4 39
100 1 1 1 1 1 0 1 1 1 0 1 7
2 1 0 1 1 0 1 1 0 1 6

194
3 1 0 1 0 1 1 0 1 1 6
4 1 1 1 1 1 1 1 1 1 9
5 1 0 0 1 1 0 1 1 1 6
6 1 1 0 1 1 0 1 1 0 6 Total
Objects Read
---
---
---
6 3 4 4 5 4 5 4 5 40
Height Level 2: Antenna one-foot above the straight line of sight to the Passive RFID tag
Zone
Attenuation Level
Height Level
Direction 1 2 3 4 5 6 7 8 9 Total Objects
Read 0 2 1 1 0 0 1 1 0 1 0 1 5
2 1 0 0 0 1 0 0 1 1 4
3 1 0 1 0 1 1 1 1 1 7
4 1 1 1 1 1 0 0 0 1 6
5 1 0 1 0 1 0 1 0 1 5
6 0 1 1 0 1 0 1 1 1 6 Total
Objects Read
---
---
---
5 2 4 2 6 1 4 3 6 33
15 2 1 1 1 0 1 1 0 1 0 1 6
2 1 1 1 0 1 1 0 1 1 7
3 1 0 1 1 1 0 1 0 1 6
4 0 1 1 0 0 0 0 1 1 4
5 1 0 1 0 0 1 1 0 1 5
6 1 1 1 0 1 0 1 1 0 6 Total
Objects Read
---
---
---
5 4 5 2 4 2 4 3 5 34
30 2 1 0 1 1 0 1 1 0 1 1 6
2 1 1 0 0 1 1 1 0 0 5
3 1 0 1 1 0 0 1 0 1 5
4 1 0 0 1 1 1 1 1 1 7
5 0 1 1 0 0 1 0 1 1 5
6 0 1 1 1 1 0 1 1 0 6 Total
Objects Read
---
---
---
3 4 4 3 4 4 4 4 4 34
50 2 1 1 1 0 1 0 1 1 0 0 5
2 1 0 1 0 0 1 1 1 1 6
3 1 0 1 0 1 1 0 1 1 6
4 1 1 1 1 0 1 1 0 1 7
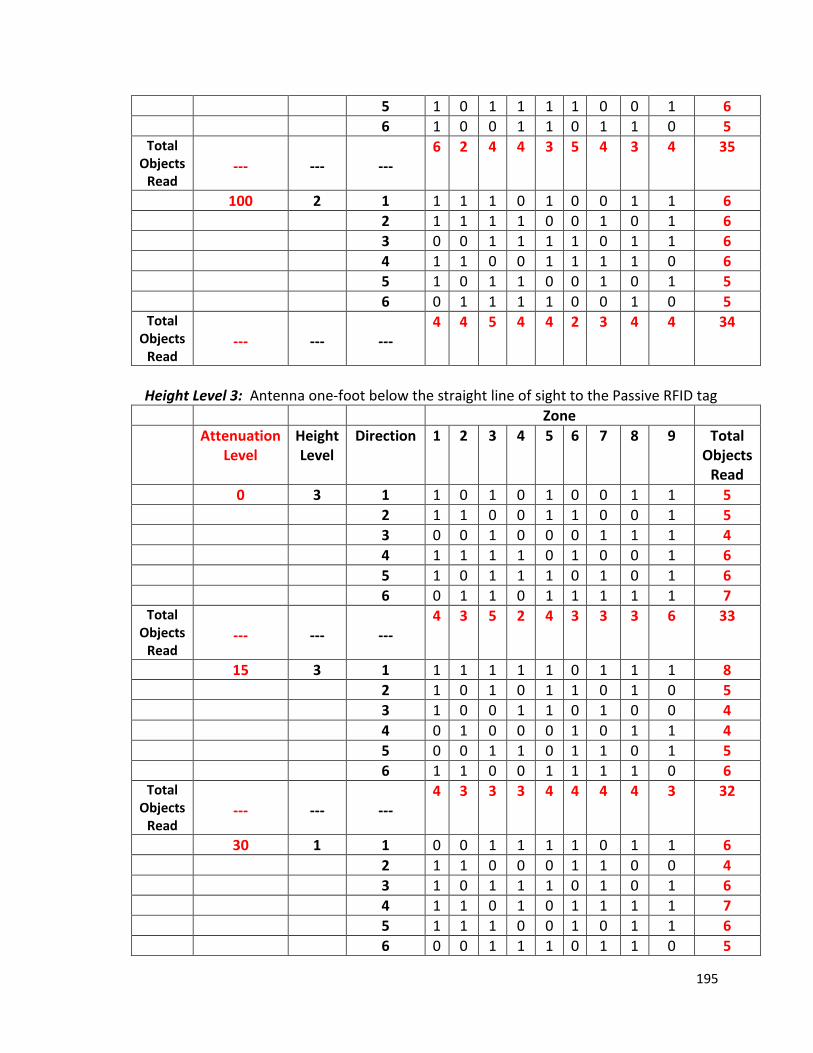
195
5 1 0 1 1 1 1 0 0 1 6
6 1 0 0 1 1 0 1 1 0 5 Total
Objects Read
---
---
---
6 2 4 4 3 5 4 3 4 35
100 2 1 1 1 1 0 1 0 0 1 1 6
2 1 1 1 1 0 0 1 0 1 6
3 0 0 1 1 1 1 0 1 1 6
4 1 1 0 0 1 1 1 1 0 6
5 1 0 1 1 0 0 1 0 1 5
6 0 1 1 1 1 0 0 1 0 5 Total
Objects Read
---
---
---
4 4 5 4 4 2 3 4 4 34
Height Level 3: Antenna one-foot below the straight line of sight to the Passive RFID tag
Zone
Attenuation Level
Height Level
Direction 1 2 3 4 5 6 7 8 9 Total Objects
Read
0 3 1 1 0 1 0 1 0 0 1 1 5
2 1 1 0 0 1 1 0 0 1 5
3 0 0 1 0 0 0 1 1 1 4
4 1 1 1 1 0 1 0 0 1 6
5 1 0 1 1 1 0 1 0 1 6
6 0 1 1 0 1 1 1 1 1 7 Total
Objects Read
---
---
---
4 3 5 2 4 3 3 3 6 33
15 3 1 1 1 1 1 1 0 1 1 1 8
2 1 0 1 0 1 1 0 1 0 5
3 1 0 0 1 1 0 1 0 0 4
4 0 1 0 0 0 1 0 1 1 4
5 0 0 1 1 0 1 1 0 1 5
6 1 1 0 0 1 1 1 1 0 6 Total
Objects Read
---
---
---
4 3 3 3 4 4 4 4 3 32
30 1 1 0 0 1 1 1 1 0 1 1 6
2 1 1 0 0 0 1 1 0 0 4
3 1 0 1 1 1 0 1 0 1 6
4 1 1 0 1 0 1 1 1 1 7
5 1 1 1 0 0 1 0 1 1 6
6 0 0 1 1 1 0 1 1 0 5
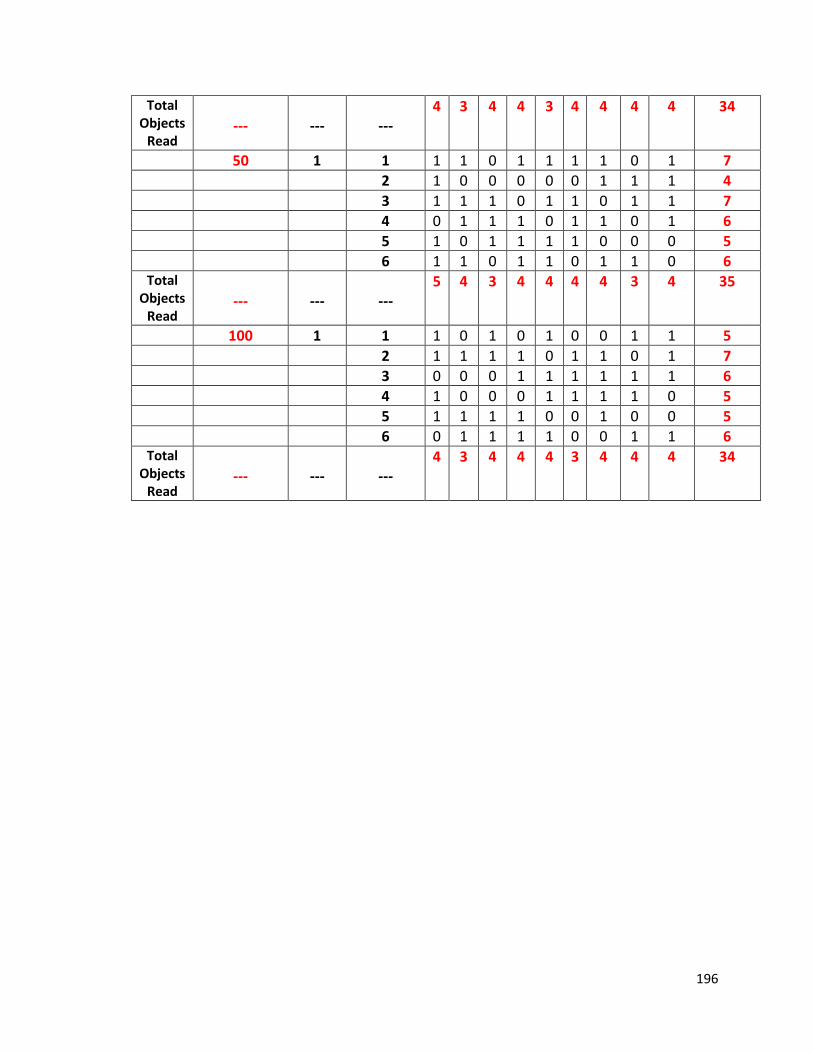
196
Total Objects
Read
---
---
---
4 3 4 4 3 4 4 4 4 34
50 1 1 1 1 0 1 1 1 1 0 1 7
2 1 0 0 0 0 0 1 1 1 4
3 1 1 1 0 1 1 0 1 1 7
4 0 1 1 1 0 1 1 0 1 6
5 1 0 1 1 1 1 0 0 0 5
6 1 1 0 1 1 0 1 1 0 6 Total
Objects Read
---
---
---
5 4 3 4 4 4 4 3 4 35
100 1 1 1 0 1 0 1 0 0 1 1 5
2 1 1 1 1 0 1 1 0 1 7
3 0 0 0 1 1 1 1 1 1 6
4 1 0 0 0 1 1 1 1 0 5
5 1 1 1 1 0 0 1 0 0 5
6 0 1 1 1 1 0 0 1 1 6 Total
Objects Read
---
---
---
4 3 4 4 4 3 4 4 4 34
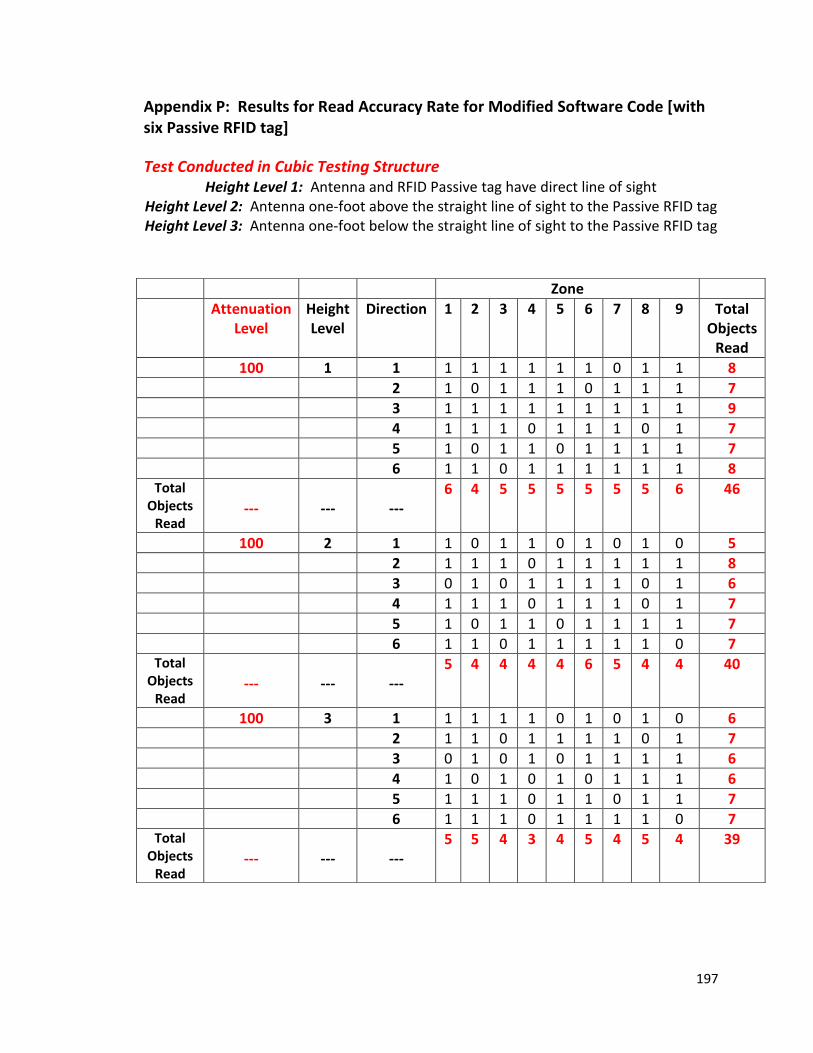
197
Appendix P: Results for Read Accuracy Rate for Modified Software Code [with six Passive RFID tag]
Test Conducted in Cubic Testing Structure Height Level 1: Antenna and RFID Passive tag have direct line of sight
Height Level 2: Antenna one-foot above the straight line of sight to the Passive RFID tag Height Level 3: Antenna one-foot below the straight line of sight to the Passive RFID tag
Zone
Attenuation Level
Height Level
Direction 1 2 3 4 5 6 7 8 9 Total Objects
Read
100 1 1 1 1 1 1 1 1 0 1 1 8
2 1 0 1 1 1 0 1 1 1 7
3 1 1 1 1 1 1 1 1 1 9
4 1 1 1 0 1 1 1 0 1 7
5 1 0 1 1 0 1 1 1 1 7
6 1 1 0 1 1 1 1 1 1 8 Total
Objects Read
---
---
---
6 4 5 5 5 5 5 5 6 46
100 2 1 1 0 1 1 0 1 0 1 0 5
2 1 1 1 0 1 1 1 1 1 8
3 0 1 0 1 1 1 1 0 1 6
4 1 1 1 0 1 1 1 0 1 7
5 1 0 1 1 0 1 1 1 1 7
6 1 1 0 1 1 1 1 1 0 7 Total
Objects Read
---
---
---
5 4 4 4 4 6 5 4 4 40
100 3 1 1 1 1 1 0 1 0 1 0 6
2 1 1 0 1 1 1 1 0 1 7
3 0 1 0 1 0 1 1 1 1 6
4 1 0 1 0 1 0 1 1 1 6
5 1 1 1 0 1 1 0 1 1 7
6 1 1 1 0 1 1 1 1 0 7 Total
Objects Read
---
---
---
5 5 4 3 4 5 4 5 4 39

198
Test Conducted with the Four RFID Antenna Placeholder Stands Height Level 1: Antenna and RFID Passive Tag have direct line of sight
Zone
Attenuation Level
Height Level
Direction 1 2 3 4 5 6 7 8 9 Total Objects
Read 0 1 1 1 1 1 1 1 0 1 1 1 8
2 1 1 1 1 1 1 0 1 1 8
3 1 1 1 1 1 1 1 0 1 8
4 1 0 1 1 1 1 1 1 1 8
5 1 1 0 1 1 0 1 1 1 7
6 1 1 1 0 1 1 0 1 1 7 Total
Objects Read
---
---
---
6 5 5 5 6 4 4 5 6 46
15 1 1 1 0 1 1 1 1 1 1 1 8
2 1 1 1 1 1 1 1 0 1 8
3 1 1 1 1 1 0 1 1 1 8
4 1 0 1 1 1 0 1 1 1 7
5 1 1 1 1 0 1 1 0 1 7
6 1 1 1 0 1 1 1 1 1 8 Total
Objects Read
---
---
---
6 4 6 5 5 4 6 4 6 46
30 1 1 1 0 1 1 1 1 1 1 1 8
2 1 1 1 1 1 0 1 0 1 7
3 1 1 1 1 1 1 1 1 1 9
4 1 0 1 0 1 1 1 1 1 7
5 1 1 1 1 1 1 0 1 1 8
6 1 1 1 1 0 1 1 1 1 8 Total
Objects Read
---
---
---
6 4 6 5 5 5 5 5 6 47
50 1 1 1 1 1 1 0 1 1 1 1 8
2 1 1 1 1 1 1 1 1 1 9
3 1 0 1 0 1 1 1 1 1 7
4 1 1 1 0 1 0 1 1 1 7
5 1 1 1 1 1 1 1 0 1 8
6 1 1 1 1 0 1 1 1 1 8 Total
Objects Read
---
---
---
6 5 6 4 4 5 6 5 6 47
100 1 1 1 0 1 1 0 1 1 0 1 6
2 1 1 1 1 0 1 1 1 1 8
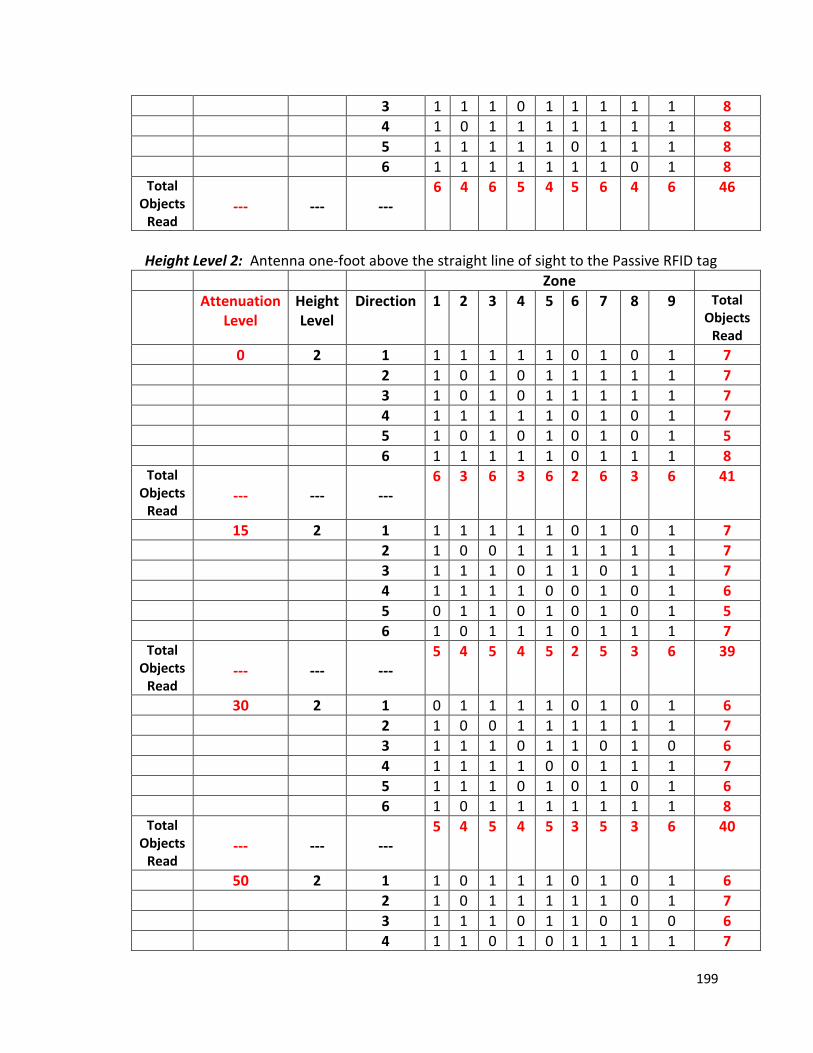
199
3 1 1 1 0 1 1 1 1 1 8
4 1 0 1 1 1 1 1 1 1 8
5 1 1 1 1 1 0 1 1 1 8
6 1 1 1 1 1 1 1 0 1 8 Total
Objects Read
---
---
---
6 4 6 5 4 5 6 4 6 46
Height Level 2: Antenna one-foot above the straight line of sight to the Passive RFID tag
Zone
Attenuation Level
Height Level
Direction 1 2 3 4 5 6 7 8 9 Total Objects
Read 0 2 1 1 1 1 1 1 0 1 0 1 7
2 1 0 1 0 1 1 1 1 1 7
3 1 0 1 0 1 1 1 1 1 7
4 1 1 1 1 1 0 1 0 1 7
5 1 0 1 0 1 0 1 0 1 5
6 1 1 1 1 1 0 1 1 1 8 Total
Objects Read
---
---
---
6 3 6 3 6 2 6 3 6 41
15 2 1 1 1 1 1 1 0 1 0 1 7
2 1 0 0 1 1 1 1 1 1 7
3 1 1 1 0 1 1 0 1 1 7
4 1 1 1 1 0 0 1 0 1 6
5 0 1 1 0 1 0 1 0 1 5
6 1 0 1 1 1 0 1 1 1 7 Total
Objects Read
---
---
---
5 4 5 4 5 2 5 3 6 39
30 2 1 0 1 1 1 1 0 1 0 1 6
2 1 0 0 1 1 1 1 1 1 7
3 1 1 1 0 1 1 0 1 0 6
4 1 1 1 1 0 0 1 1 1 7
5 1 1 1 0 1 0 1 0 1 6
6 1 0 1 1 1 1 1 1 1 8 Total
Objects Read
---
---
---
5 4 5 4 5 3 5 3 6 40
50 2 1 1 0 1 1 1 0 1 0 1 6
2 1 0 1 1 1 1 1 0 1 7
3 1 1 1 0 1 1 0 1 0 6
4 1 1 0 1 0 1 1 1 1 7

200
5 1 1 1 0 1 1 1 0 1 7
6 1 0 0 1 1 0 1 1 1 6 Total
Objects Read
---
---
---
6 3 4 4 5 4 5 3 5 39
100 2 1 1 1 1 1 1 0 1 0 1 7
2 1 0 1 1 1 1 1 0 1 7
3 1 1 1 0 1 1 0 1 0 6
4 0 1 1 1 0 1 1 1 1 7
5 0 1 1 0 1 1 1 1 1 7
6 1 0 0 1 1 0 1 1 1 6 Total
Objects Read
---
---
---
5 4 4 4 5 4 5 4 5 40
Height Level 3: Antenna one-foot below the straight line of sight to the Passive RFID tag
Zone
Attenuation Level
Height Level
Direction 1 2 3 4 5 6 7 8 9 Total Objects
Read 0 2 1 1 1 1 1 1 0 1 0 1 7
2 1 0 1 0 1 1 1 1 1 7
3 1 0 1 0 1 1 1 1 1 7
4 1 1 1 1 1 0 1 0 1 7
5 1 0 1 0 1 0 1 0 1 5
6 1 1 1 1 1 0 1 1 1 8 Total
Objects Read
---
---
---
6 3 6 3 6 2 6 3 6 41
15 2 1 1 1 1 1 1 0 1 0 1 7
2 1 0 0 1 1 1 1 1 1 7
3 1 1 1 0 1 1 0 1 1 7
4 1 1 1 1 0 0 1 0 1 6
5 0 1 1 0 1 0 1 0 1 5
6 1 0 1 1 1 0 1 1 1 7 Total
Objects Read
---
---
---
5 4 5 4 5 2 5 3 6 39
30 2 1 0 1 1 1 1 0 1 0 1 6
2 1 0 0 1 1 1 1 1 1 7
3 1 1 1 0 1 1 0 1 0 6
4 1 1 1 1 0 0 1 1 1 7
5 1 1 1 0 1 0 1 0 1 6
6 1 0 1 1 1 1 1 1 1 8

201
Total Objects
Read
---
---
---
5 4 5 4 5 3 5 3 6 40
50 2 1 1 0 1 1 1 0 1 0 1 6
2 1 0 1 1 1 1 1 0 1 7
3 1 1 1 0 1 1 0 1 0 6
4 1 1 0 1 0 1 1 1 1 7
5 1 1 1 0 1 1 1 0 1 7
6 1 0 0 1 1 0 1 1 1 6 Total
Objects Read
---
---
---
6 3 4 4 5 4 5 3 5 39
100 2 1 1 1 1 1 1 0 1 0 1 7
2 1 0 1 1 1 1 1 0 1 7
3 1 1 1 0 1 1 0 1 0 6
4 0 1 1 1 0 1 1 1 1 7
5 0 1 1 0 1 1 1 1 1 7
6 1 0 0 1 1 0 1 1 1 6 Total
Objects Read
---
---
---
4 4 5 4 5 4 5 4 5 40
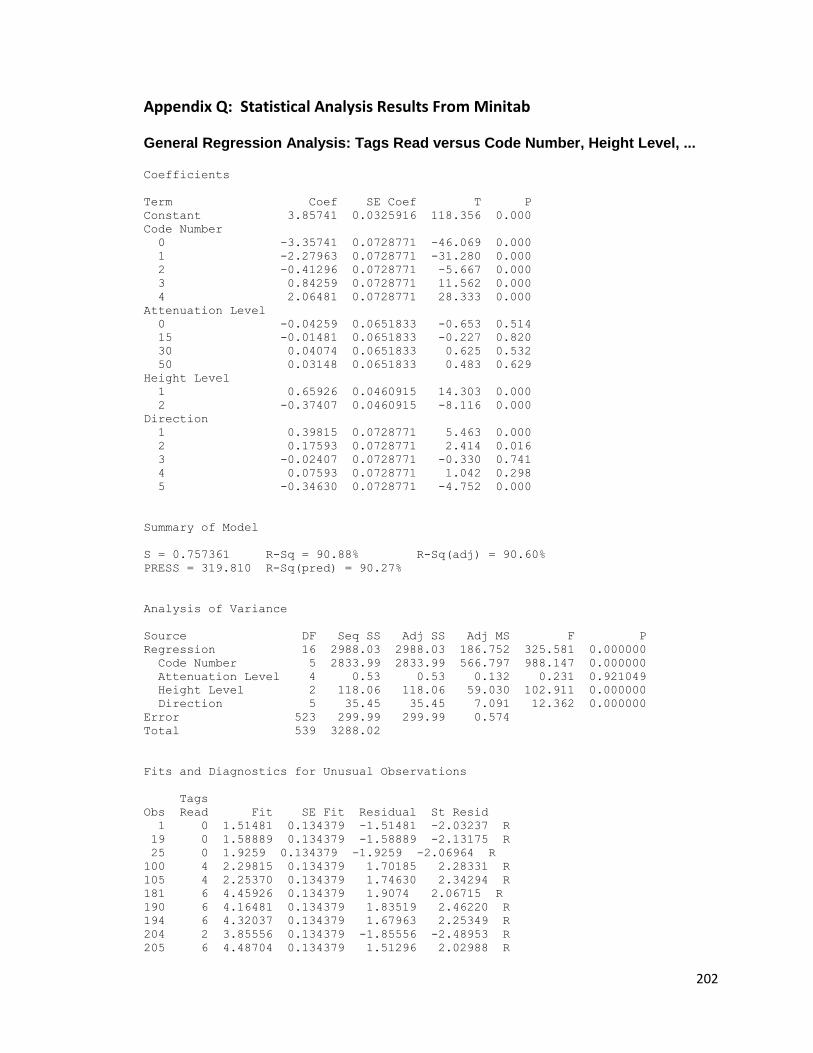
202
Appendix Q: Statistical Analysis Results From Minitab General Regression Analysis: Tags Read versus Code Number, Height Level, ... Coefficients
Term Coef SE Coef T P
Constant 3.85741 0.0325916 118.356 0.000
Code Number
0 -3.35741 0.0728771 -46.069 0.000
1 -2.27963 0.0728771 -31.280 0.000
2 -0.41296 0.0728771 -5.667 0.000
3 0.84259 0.0728771 11.562 0.000
4 2.06481 0.0728771 28.333 0.000
Attenuation Level
0 -0.04259 0.0651833 -0.653 0.514
15 -0.01481 0.0651833 -0.227 0.820
30 0.04074 0.0651833 0.625 0.532
50 0.03148 0.0651833 0.483 0.629
Height Level
1 0.65926 0.0460915 14.303 0.000
2 -0.37407 0.0460915 -8.116 0.000
Direction
1 0.39815 0.0728771 5.463 0.000
2 0.17593 0.0728771 2.414 0.016
3 -0.02407 0.0728771 -0.330 0.741
4 0.07593 0.0728771 1.042 0.298
5 -0.34630 0.0728771 -4.752 0.000
Summary of Model
S = 0.757361 R-Sq = 90.88% R-Sq(adj) = 90.60%
PRESS = 319.810 R-Sq(pred) = 90.27%
Analysis of Variance
Source DF Seq SS Adj SS Adj MS F P
Regression 16 2988.03 2988.03 186.752 325.581 0.000000
Code Number 5 2833.99 2833.99 566.797 988.147 0.000000
Attenuation Level 4 0.53 0.53 0.132 0.231 0.921049
Height Level 2 118.06 118.06 59.030 102.911 0.000000
Direction 5 35.45 35.45 7.091 12.362 0.000000
Error 523 299.99 299.99 0.574
Total 539 3288.02
Fits and Diagnostics for Unusual Observations
Tags
Obs Read Fit SE Fit Residual St Resid
1 0 1.51481 0.134379 -1.51481 -2.03237 R
19 0 1.58889 0.134379 -1.58889 -2.13175 R
25 0 1.9259 0.134379 -1.9259 -2.06964 R
100 4 2.29815 0.134379 1.70185 2.28331 R
105 4 2.25370 0.134379 1.74630 2.34294 R
181 6 4.45926 0.134379 1.9074 2.06715 R
190 6 4.16481 0.134379 1.83519 2.46220 R
194 6 4.32037 0.134379 1.67963 2.25349 R
204 2 3.85556 0.134379 -1.85556 -2.48953 R
205 6 4.48704 0.134379 1.51296 2.02988 R

203
207 6 4.06481 0.134379 1.93519 2.59636 R
208 2 4.16481 0.134379 -2.16481 -2.90445 R
211 5 3.42593 0.134379 1.57407 2.11187 R
329 6 3.96481 0.134379 2.03519 2.73053 R
332 3 4.9815 0.134379 -1.9815 -2.07709 R
362 5 6.71481 0.134379 -1.71481 -2.30070 R
369 5 6.9259 0.134379 -1.9259 -2.06964 R
375 5 6.59815 0.134379 -1.59815 -2.14417 R
388 9 6.64259 0.134379 2.35741 3.16284 R
392 4 5.68148 0.134379 -1.68148 -2.25598 R
393 7 5.48148 0.134379 1.51852 2.03734 R
400 4 5.60926 0.134379 -1.60926 -2.15908 R
423 4 5.57037 0.134379 -1.57037 -2.10691 R
426 7 5.31481 0.134379 1.68519 2.26095 R
427 8 6.02037 0.134379 1.97963 2.65599 R
429 4 5.59815 0.134379 -1.59815 -2.14417 R
430 4 5.69815 0.134379 -1.69815 -2.27834 R
434 4 5.85370 0.134379 -1.85370 -2.48704 R
440 4 5.84444 0.134379 -1.84444 -2.47462 R
475 6 8.04259 0.134379 -2.04259 -2.74047 R
486 8 6.30370 0.134379 1.69630 2.27586 R
498 8 6.38704 0.134379 1.61296 2.16405 R
516 8 6.39259 0.134379 1.60741 2.15660 R
528 8 6.47593 0.134379 1.52407 2.04479 R
R denotes an observation with a large standardized residual.
100806040200
3
2
1
0
-1
-2
Attenuation Level
Re
sid
ua
l
Residuals Versus Attenuation Level(response is Tags Read)

204
2.251.500.750.00-0.75-1.50-2.25
90
80
70
60
50
40
30
20
10
0
Residual
Fre
qu
en
cy
Histogram(response is Tags Read)
9876543210
3
2
1
0
-1
-2
Fitted Value
Re
sid
ua
l
Versus Fits(response is Tags Read)
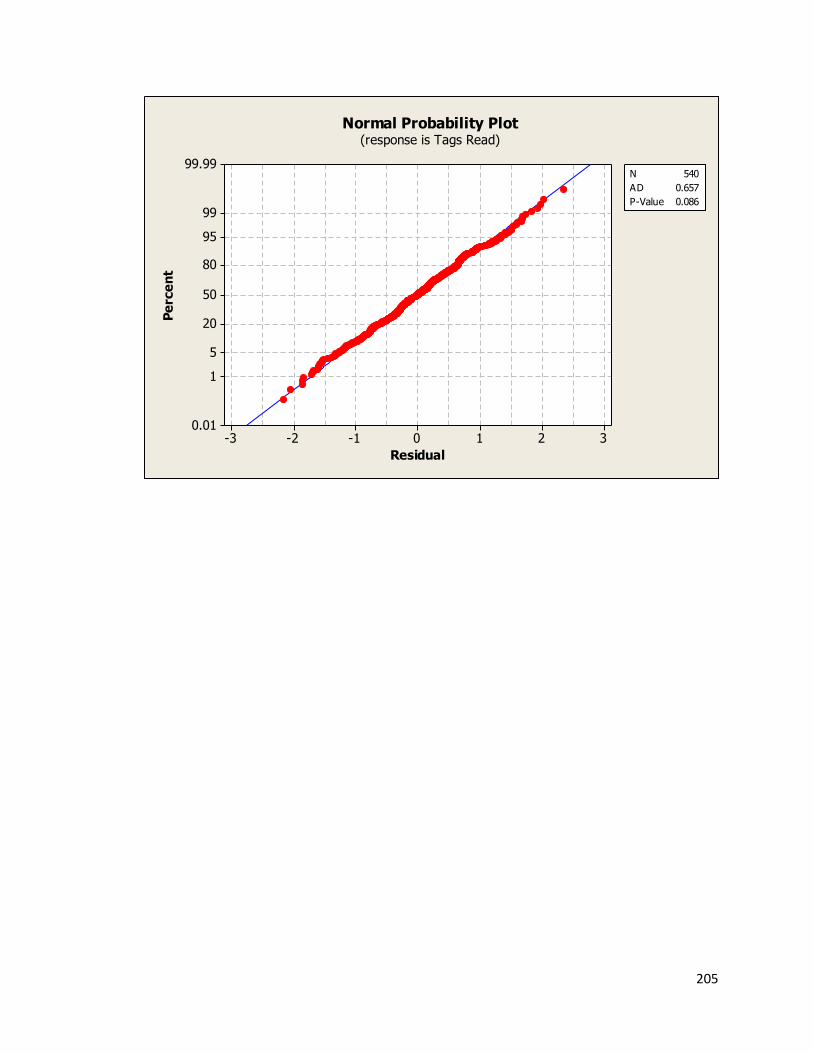
205
3210-1-2-3
99.99
99
95
80
50
20
5
1
0.01
Residual
Pe
rce
nt
N 540
AD 0.657
P-Value 0.086
Normal Probability Plot(response is Tags Read)

206
Appendix R: Test Regarding Feasibility of Reading Multiple Objects with Modified Software Code Used in Visual Basic
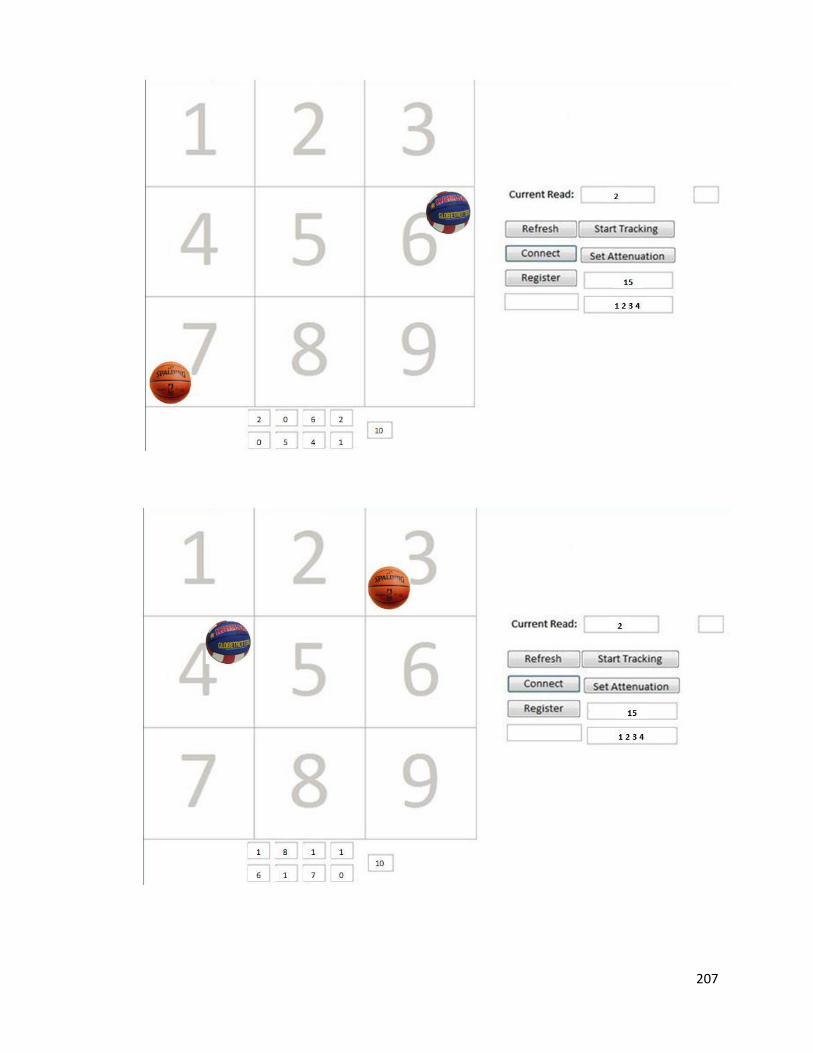
207

208

209

210

211
Appendix S: Modified Software Code Used in Visual Basic Option Compare Database Option Explicit Private WithEvents sockmain As Winsock Private WithEvents sockRecv As Winsock Dim ActiveMode As Boolean, KeepAlive As Boolean, SkipData As Boolean, andy As Boolean Dim strData As String Dim antenna As Single Dim all_ants(3) Dim testnum As String Private Sub cboSend_AfterUpdate() If Len(Me.cboSend) > 0 Then Me.txtArgs = DLookup("arguments", "sirit_commands", "command = """ & Me.cboSend & """") End Sub Private Sub cmdActiveMode_Click() Me.txtStatus = "" If Me.cmdActiveMode.Caption = "Active mode=off" Then Me.cmdActiveMode.Caption = "Active mode=on" Call Sirit_send("tag.reporting.report_fields=tag_id antenna time") Call Sirit_send("reader.events.register(id=" & Val(Me.txtSessionID) & ",name=event.tag.report)") Call Sirit_send("setup.operating_mode=active") ActiveMode = True GoTo ending End If If Me.cmdActiveMode.Caption = "Active mode=on" Then Me.cmdActiveMode.Caption = "Active mode=off" Call Sirit_send("reader.events.unregister(id=" & Val(Me.txtSessionID) & ",name=event.tag.report)") Call Sirit_send("setup.operating_mode=standby") ActiveMode = False End If GoTo ending ending: DoEvents End Sub Private Sub cmdClear_Click() Me.txtStatus = "" End Sub

212
Private Sub cmdConnect_Click() Call Sirit_connect Me.txtSessionID = "" KeepAlive = True Me.Form.TimerInterval = 3000 End Sub Private Sub cmdScanLoc_Click() antenna = 0 'prepare tables With DoCmd .SetWarnings False .OpenQuery "SendToHistory", acViewNormal, acAdd .OpenQuery "purgelocation", acViewNormal, acAdd .SetWarnings True End With testnum = InputBox("Please enter a test name", "Test Name") andy = True 'gather data 'Call Sirit_send("modem.antennas.perform_check()") all_ants(0) = 1 all_ants(1) = 2 all_ants(2) = 3 all_ants(3) = 4 Call Sirit_send("antennas.mux_sequence=1") Call Sirit_send("tag.reporting.report_fields=tag_id antenna") Call Sirit_send("reader.events.register(id=" & Val(Me.txtSessionID) & ",name=event.tag.report)") Call Sirit_send("setup.operating_mode=active") Form.TimerInterval = 2000 End Sub Private Sub cmdSend_Click() Me.txtStatus = "" Call Sirit_send(Me.cboSend) End Sub Private Sub Form_Load() ActiveMode = False KeepAlive = False andy = False antenna = 0 End Sub

213
Private Sub Form_Timer() If andy = False Then Call Sirit_send("reader.is_alive()") SkipData = True End If If andy = True Then ' If antenna < UBound(all_ants) Then ' Call Sirit_send("antennas.mux_sequence=" & all_ants(antenna)) ' antenna = antenna + 1 ' Else Call Sirit_send("setup.operating_mode=standby") andy = False Me.Form.TimerInterval = 2000 DoCmd.OpenQuery "UniqueLocations", acViewNormal 'DoCmd.OpenForm "ZoneTracker", acNormal ' End If End If End Sub Private Sub sockMain_Close() Call Sirit_connect End Sub Private Sub sockRecv_DataArrival(ByVal bytesTotal As Long) If andy = True Then Call sockRecv.GetData(strData) Call loc_data Exit Sub End If Call sockRecv.GetData(strData) If ActiveMode = True Then Call add_data If ActiveMode = False Then If Left(strData, 22) = "event.connection id = " Then Me.txtSessionID = Right(strData, Len(strData) - 22) End If End Sub 'Private Sub sockmain_DataArrival(ByVal bytesTotal As Long) ' 'If andy = True Then ' Call sockmain.GetData(strData) ' 'all_ants = Split(Right(strData, Len(strData) - 3), " ") ' 'Debug.Print Right(strData, Len(strData) - 2)

214
'End If 'If SkipData = True Then ' SkipData = False ' Call sockmain.GetData(strData) ' Exit Sub 'End If ' 'Call sockmain.GetData(strData) 'Me.txtStatus = strData ' 'End Sub Sub Sirit_connect() Me.txtSessionID = "" Set sockmain = New Winsock Set sockRecv = New Winsock With sockmain .RemoteHost = DLookup("host", "sirit_settings") .RemotePort = DLookup("portSend", "sirit_settings") .Connect End With With sockRecv .RemoteHost = DLookup("host", "sirit_settings") .RemotePort = DLookup("portRecv", "sirit_settings") .Connect End With End Sub Sub Sirit_send(strCommand As String) sockmain.SendData strCommand & Chr(10) End Sub Sub loc_data() Dim TagAry As Variant Dim x As Integer Dim rst As ADODB.Recordset, rst1 As ADODB.Recordset Set rst = New ADODB.Recordset Set rst1 = New ADODB.Recordset rst.Open "[location]", CurrentProject.Connection, adOpenStatic, adLockOptimistic Dim fields(2) fields(0) = "TagID" fields(1) = "Antenna" fields(2) = "TestNumber" Dim values(2)
215
TagAry = Split(strData, "event.tag.report tag_id=0x") If IsArray(TagAry) = False Then Exit Sub For x = 1 To UBound(TagAry) values(0) = Left(TagAry(x), 24) values(1) = Mid(TagAry(x), 35, 1) values(2) = testnum If Len(values(0)) = 24 And Not (Left(values(1), 1) = " ") = True Then rst1.Open "SELECT DISTINCT * FROM [Location] WHERE TagID = """ & values(0) & """ AND Antenna= " & all_ants(antenna), CurrentProject.Connection, adOpenStatic, adLockOptimistic If rst1.RecordCount = 0 Then rst.AddNew fields, values rst1.Close End If Next rst.Close End Sub Sub add_data() Dim TagAry As Variant Dim x As Integer Dim rst As ADODB.Recordset, rst1 As ADODB.Recordset Set rst = New ADODB.Recordset Set rst1 = New ADODB.Recordset rst.Open "[read]", CurrentProject.Connection, adOpenStatic, adLockOptimistic Dim fields(2) fields(0) = "TagID" fields(1) = "TimeRead" fields(2) = "Antenna" Dim values(2) TagAry = Split(strData, "event.tag.report tag_id=0x") If IsArray(TagAry) = False Then Exit Sub For x = 1 To UBound(TagAry) values(0) = Left(TagAry(x), 24) values(1) = Mid(TagAry(x), 9, 12) & " " & Date values(2) = Mid(TagAry(x), 35, 1) If Len(values(0)) = 24 And Len(values(1)) > 0 And Not (Left(values(2), 1) = " ") = True Then rst1.Open "SELECT DISTINCT * FROM [Read] WHERE TagID = """ & values(0) & """", CurrentProject.Connection, adOpenStatic, adLockOptimistic If rst1.RecordCount = 0 Then rst.AddNew fields, values rst1.Close Else rst1.Close

216
rst1.Open "UPDATE [Read] SET [Read].TimeRead = """ & values(1) & """ WHERE (Read.TagID)= """ & values(0) & """" End If End If Next rst.Close End Sub

217
Appendix T: References 1. Lens, Al, Sheila C. Nemeth, and Janice K. Ledford. Ocular Anatomy and
Physiology. Thorofare, NJ: SLACK, 2008. Print. 2. Schwartz, Steven H. Visual Perception. New York: McGraw-Hill Medical, 2010.
Print. 3. "Who: Visual Impairment and Blindness." WHO. World Health Organization.
Web. 8 July 2011. <http://www.who.int/mediacentre/factsheets/fs282/en/>.
4. "Google Images." Google. Web. 08 July 2011. <http://www.google.com/imgres?imgurl=http://a3.mzstatic.com/us/r1000/021/ Purple/fd/ab/53/mzl.fmnfokjg.320x480-75.jpg>.
5. "Ishihara Test for Color Blindness." Comprehensive Toledo Bend Lake Information Resource - Toledo-Bend.Com. Web. 08 July 2011. <http://www.toledo- bend.com/colorblind/Ishihara.asp>.
6. Shulman, Julius. Cataracts. New York: St. Martin's Griffin, 1995. Print. 7. Garg, Ashok. Glaucoma: Diagnosis and Treatment. New Delhi, India: Jaypee
Brothers, 2008. Print 8. Duh, Elia J. Diabetic Retinopathy. Totowa, N.J: Humana, 2008. Print. 9. Torres, Rodr guez Mischayra. Age Related Macular Degeneration. 2008. Print. 10. O'Brien, Michael. John F. Kennedy: a Biography. New York: Thomas Dunne /St.
Martin's, 2005. Print. 11. Kasser, Susan L., and Rebecca K. Lytle. Inclusive Physical Activity: a Lifetime of
Opportunities. Champaign, IL: Human Kinetics, 2005. Print. 12. Sherrill, Claudine. Adapted Physical Activity, Recreation, and Sport:
Crossdisciplinary and Lifespan. Boston, Mass.: WCB/McGraw-Hill, 1998. Print. 13. El-Rabbany, Ahmed. Introduction to GPS: the Global Positioning System. Boston,
MA: Artech House, 2006. Print. 14. Diakides, Nicholas A. Infrared: from Tanks to Tumors. New York, NY, 2002. Print. 15. Siwiak, Kazimierz, and Debra McKeown. Ultra-wideband Radio Technology.
Chichester, England: Hoboken, NJ, 2004. Print. 16. Sweeney, Patrick J., and Eva Zeisel. CompTIA RFID+ Study Guide. Indianapolis, IN:
Wiley Pub., 2007. Print. 17. Tesoriero, R., J. Gallud, M. Lozano, and V. Penichet; (2008). “Using active and
passive rfid technology to support indoor location aware systems”. Consumer Electronics, IEEE Transactions on 9(2): 578-583.
18. Gallud, J. M. Lozano, V. Penichet, R. Tebar, and R. Tesoriero; (2010). Improving location awareness in indoor spaces using RFID technology. Expert Systems with Applications. 37: 894-898.
19. Lau, Y.C., Y. Liu, L.M. Ni, A.P. Patil; (2004). LANDMARC: Indoor Location Sensing Using Active RFID. Wireless Networks. 10: 701-710.
20. Avery Dennison RFID. Web. 12 Oct. 2010. <http://www.rfid.averydennison.com/products.php#2>.
21. SIRIT UHF Inlay. Web. 12 Oct. 2010. <http://www.sirit.com/Downloads.asp#UHF Inlays>.

218
22. Shepard, Steven. RFID: Radio Frequency Identification. New York: McGraw-Hill, 2005. Print.
23. Liu, H., H. Darabi, P. Banerjee, and J. Liu. “Survey of wireless indoor positioning techniques and systems,” IEEE Transactions on systems, Man, and Cybernetics — Part C: Applications and Reviews, Vol. 37, No. 6, November 2007.
24. A. Bhatia, B. Mehta and R. Gupta. “Different Localization Techniques for Real Time Location Sensing using passive RFID,” Indian Institute of Technology, 2007.
25. P. V. Nikitin, R. Martinez, S. Ramamurthy, H. Leland, G. Spiess, and K. V. S. Rao. “Phase based spatial identification of UHF RFID tags,” in Proc. IEEE Int RFID Conf, 2010, pp. 102–109.
26. M. Bouet and G. Pujolle. A range-free 3-D localization method for RFID tags based on virtual landmarks. In Proc. of PIMRC, 2008.
27. Harackieweisz, F.J., B. Lee, and H. Rhyu; (2007). Wide Coverage Area of UHF- Band RFID System Using a Pattern Reconfigurable Antenna. Microwave and Optical Technology Letters. 49 (9): 219-2157.
28. L. Ran, A. Helal, and S. E. Moore. “Drishti: An Integrated Indoor/Outdoor Blind Navigation System and Service”, In Proceedings of the Second IEEE Annual Conference on Pervasive Computing and Communications (PerCom.04),
pp. 23-30, 2004. 29. Bonino, D, Z. Cattaneo, C. Cornoldi, I. Mammarella, P. Pietrini, E. Ricciardi,
and T. Vecchi; (2008). Imagery and spatial processes in blindness and visual impairment. Neuroscience and Biobehavioral Reviews. 32: 1346-1360.
30. Vogt, H. Multiple Object Identification with Passive RFID Tags. 2002 IEEE International Conference on Systems, Man and Cybernetics. October 2002.


