NBER WORKING PAPER SERIES
ESTIMATING PRICE ELASTICITIES WHEN THERE IS SMUGGLING:
THE SENSITIVITY OF SMOKING TO PRICE IN CANADA
Jonathan Gruber
Anindya Sen
Mark Stabile
Working Paper 8962
http://www.nber.org/papers/w8962
NATIONAL BUREAU OF ECONOMIC RESEARCH
1050 Massachusetts Avenue
Cambridge, MA 02138
May 2002
We are grateful to Mark Bergman for excellent research assistance. Sen gratefully acknowledges funding
support from the Centre for Behavioural Research and Program Evaluation of the Canadian Cancer Society
/ National Cancer Institute of Canada. The views expressed herein are those of the authors and not
necessarily those of the National Bureau of Economic Research.
© 2002 by Jonathan Gruber, Anindya Sen and Mark Stabile. All rights reserved. Short sections of text, not
to exceed two paragraphs, may be quoted without explicit permission provided that full credit, including ©
notice, is given to the source.

Estimating Price Elasticities When there is Smuggling:
The Sensitivity of Smoking to Price in Canada
Jonathan Gruber, Anindya Sen and Mark Stabile
NBER Working Paper No. 8962
May 2002
JEL No. I1, H2
ABSTRACT
A central parameter for evaluating tax policies is the price elasticity of demand for cigarettes. But
in many countries this parameter is difficult to estimate reliably due to widespread smuggling, which
significantly biases estimates using legal sales data. An excellent example is Canada, where widespread
smuggling in the early 1990s, in response to large tax increases, biases upwards the response of legal
cigarette sales to price. We surmount this problem through two approaches: excluding the provinces and
years where smuggling was greatest; and using household level expenditure data on smoking, where there
is a downward bias to estimated elasticities from smuggling. These two approaches yield a tightly
estimated elasticity in the range of -0.45 to -0.47. We also show that the sensitivity of smoking to price
is much larger among lower income Canadians. In the context of recent behavioral models of smoking,
whereby higher taxes reduce unwanted smoking among price sensitive populations, this finding suggests
that cigarette taxes may not be as regressive as previously suggested. Finally, we show that price increases
on cigarettes do not increase, and may actually decrease, consumption of alcohol; as a result, smuggling
of cigarettes may have raised consumption of alcohol as well.
Jonathan Gruber Anindya Sen Mark Stabile
Department of Economics University of Waterloo Department of Economics
MIT, E52-355 University of Toronto
50 Memorial Drive 150 St. George Street
Cambridge, MA 02142-1347 Toronto, ON
and NBER Canada M5S 3G7
One of the most important sources of government revenue raising around the world, both
economically and politically, is the taxation of tobacco products. A central determinant of the
optimal level of tobacco taxation is the price sensitivity of demand for cigarettes. This parameter
has been estimated repeatedly in the U.S. context, with a consensus estimate of 0.4 to 0.5
(Chaloupka and Warner, 2000), but with recent estimates at 0.6 (Gruber and Koszegi,
2000,2002; Yurekli and Zhang, 2000). But estimating this parameter in many other countries
faces a fundamental difficulty which is not a real barrier in the U.S. context: widespread
smuggling. Smuggling of cigarette products can significantly bias price elasticities estimated
using legal sales data, as the shift from legal to illegal product will appear to be a price sensitivity
of overall demand.
A classic example of this problem is the experience of Canada in the early 1990s.
Between 1989 and 1993, excise taxes at the federal and provincial level rose sharply from an
average of $1.90 per pack to $3.50 per pack. In response to these large tax increases, there was an
enormous increase in smuggling in Canada through legal export and illegal reimport. Indeed, by
the typical measure of smuggling used to describe this experience, smuggled cigarettes
represented roughly one-third of all domestic cigarette consumption at their peak. Then, in the
face of enormous smuggling, federal and provincial taxes were halved in 1994. In recent years,
however, there has again been a trend towards increasing these taxes in response to reports that
2
1 For further details please see “Martin hints at tobacco price increase: with conditions.” (Canadian Press Newswire,September 19th, 1996), “Governments raise tobacco taxes, Ottawa restricts tobacco ads.” (Canadian PressNewswire, November 28th, 1996) and “Provinces with low tobacco taxes had higher smoking rates.” (CanadianPress Newswire, April 17th, 1995).
the decline in cigarette prices has resulted in a significant increase in smoking by Canadians.1
In this paper, we provide a framework for estimating elasticities in the context of
widespread smuggling. In particular, we estimate demand models for Canada that attempt to
correct for the smuggling problem in two different ways. First, we use legal sales data, and
exclude the regions and years where the smuggling problem was the worst. Second, we use
micro-data on consumer cigarette expenditures. As we point out below, the bias from smuggling
in legal sales and consumer expenditure data work in opposite directions, so the estimates from
these two sources bound the truth. In fact, we find that the estimates from these two sources are
quite divergent initially, but become more similar (in the range of -0.45 to -0.47) when
smuggling provinces/years are excluded. This suggests that a fairly reliable estimate of the
elasticity of demand for cigarettes can be provided for Canada despite the large smuggling
problem.
We then extend the analysis in two important directions. First, we estimate the price
sensitivity of demand by different income groups. It is well known that lower income groups
spend a larger share of their incomes on cigarettes, so that tobacco taxes have been traditionally
viewed as regressive. But, as we discuss further below, under alternative (plausibly more
reasonable) models of the smoking decision, tobacco taxes may not be regressive if lower income
groups are much more price sensitive. It therefore becomes critical to explore the price
sensitivity of smoking by income group. We do so using our micro-data on tobacco expenditure,
3
and show that lower income groups are much more price sensitive than higher income groups;
this finding suggests that tobacco taxes in fact may not be regressive in the context of plausible
alternative models.
Second, we estimate the impact of cigarette price changes, and of smuggling of cigarettes,
on demand for alcohol. If cigarettes and alcohol are substitutes, then one potential advantage of
smuggling is that it reduces a shift into this alternative “bad”. But, if these activities are
complements, then a further cost of smuggling is that it increases not only cigarette consumption
but also alcohol consumption as well. We find in that legal sales data that cigarettes and alcohol
are complements; higher cigarette taxes lead to lower alcohol consumption, and that smuggling
lead to increased alcohol consumption. We do not find confirmatory evidence in the expenditure
data, however; thus, while it is clear that these goods are not substitutes, there is mixed evidence
on whether they are complements.
Our paper proceeds as follows. Part I provides some background on the literature on the
price elasticity of demand for cigarettes, and on cigarette taxation in Canada and the U.S. Part II
describes our data, and Part III discusses our empirical methodology. Part IV presents our basic
results on demand elasticities. Part V discusses estimated elasticities by income group, and Part
VI presents evidence on the substitutability of cigarettes and alcohol. Part VII concludes.
Part I: Background
There is an enormous literature in the United States that has been devoted to estimating
the price elasticity of demand for cigarettes. This literature has taken advantage of the fact that
there is substantial variation in the price of cigarettes across the U.S. states, and significant
4
changes within states over time, due to variable state excise tax policies. For example, in 2001,
the excise tax on cigarettes varied from a low of 2.5 cents in Virginia to a high of $1.11 in New
York.
The U.S. literature is reviewed in detail in Chaloupka and Warner (2001). The consensus
estimate of the price elasticity of demand in their review is -0.45. Recent estimates, using
updated data through the 1990s, have suggested that the elasticity may be higher. Gruber and
Koszegi estimate an elasticity of -0.6 in legal sales data, and of -0.66 in micro-data on
consumption (Gruber and Koszegi, 2000, 2001); Yurekli and Zhang (2000) estimate an elasticity
of -0.62 in legal sales data.
Another issue that has been addressed in the U.S. is the impact of smuggling on elasticity
estimates. A number of articles have included indirect controls for smuggling in the United
States. A typical example is the approach taken in a recent paper by Farrelly, Pechacek, and
Chaloupka (2001). They estimate models of aggregate cigarette sales by U.S. state, and they
include in their models controls for “importing” and “exporting” which are the gap in price
between the state and its neighbors, weighted by the population densities near the border of the
state. This type of approach will capture price incentives for smuggling, and indeed the results
using this approach suggest that there are flows of sales from high tax to low tax states. Other
papers have augmented this approach by including the price differentials between the state and
the low price tobacco producing states (Kentucky, North Carolina, and Virginia; see, for
example, Becker, Grossman and Murphy (1984) or Yurekli and Zhang (2000)).
But this approach provides a somewhat crude proxy for the actual amount of smuggling.
To the extent that smuggling is related to non-price factors, it will not be captured. Even if price
5
is the only determinant of smuggling, the actual functional form of how price relates to
smuggling may differ from the ones imposed by these models (e.g. nonlinear terms of the price,
or different functional forms of population distribution, may be relevant). In the U.S., where
smuggling is a relatively minor issue, this may not be an important problem for estimating
demand elasticities; but in Canada, as noted below, it could be a more significant issue.
There are two reasons to think that the elasticity estimates from the U.S. may not apply in
the Canadian context. First, prices are much higher in Canada. On average, over the 1980s and
1990s, the real price of cigarettes was $1.86 in the U.S. (in $1999). It was roughly 25% higher at
$2.33, in Canada (1999 U.S. $) over the same time period. There is little evidence on how the
elasticity of demand varies with price. But the general presumption is that the elasticity of
demand falls with prices; at higher prices, only the most addicted smokers remain in the smoking
pool.
A second, and critical, difference is smuggling. There is modest cross-state smuggling in
the U.S., which has been estimated to be on the order of 3-4% of consumption in the 1970s
(Thursby and Thursby, 2000), and 6% of tax revenues in 1995 (Yurekli and Zhang, 2000). But
smuggling of cigarettes into Canada in the 1990s was on a very different scale. In the face of
rising taxes in the early 1990s, smuggling of cigarettes increased dramatically through a
particular mechanism: legal export to the U.S., and then legal re-import across the U.S./Canadian
border, in particular through Indian reservations which straddle the border. There exists evidence
which suggests that virtually all cigarettes smuggled into Canada in the early and mid 1990s,
were previously exported from Canada to the United States, and previous research have
employed these exports as a proxy for smuggling (see Galbraith and Kaiserman, 1997 for
6
2 The actual press release can be found at http://canada.justice.gc.ca/en/news/nr/1999/doc_24494.html. On June 30,2000, the United States District Court dismissed Canada's case on points of law, citing the Revenue Rule as thereason for dismissal. In response, the Government of Canada filed a notice of appeal on July 28th 2000.
example). Further support for this assumption stems from the lawsuit launched by the
Government of Canada in October 1999 in the United States Federal Court against RJR-
Macdonald Inc., RJ Reynolds Tobacco Holdings Inc., and several related companies claiming
that the RJ Reynolds companies conspired with known distributors and smugglers to illegally
smuggle their tobacco products into Canada.2
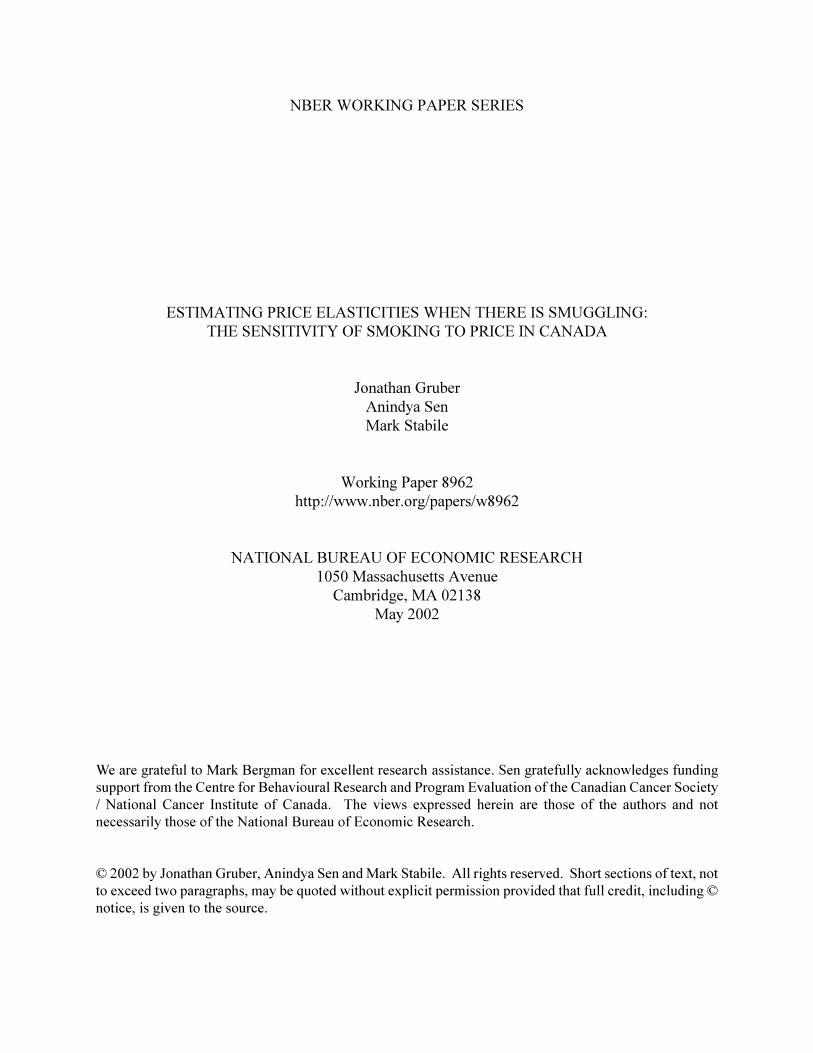
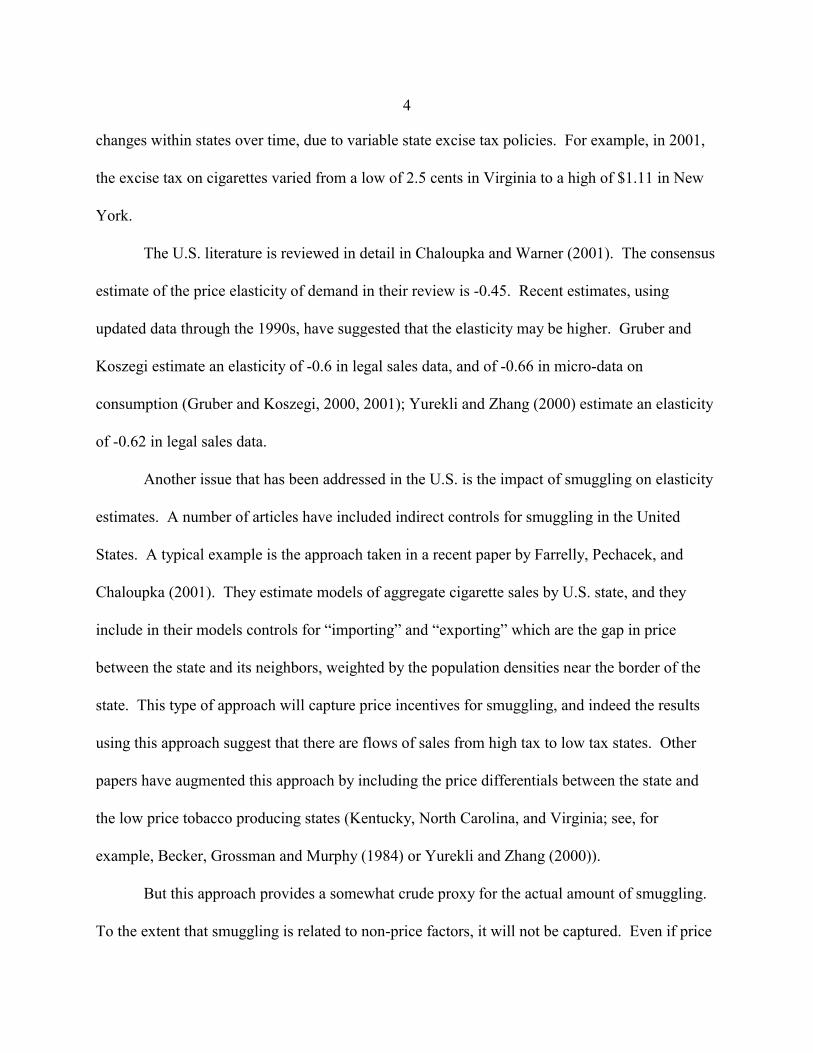
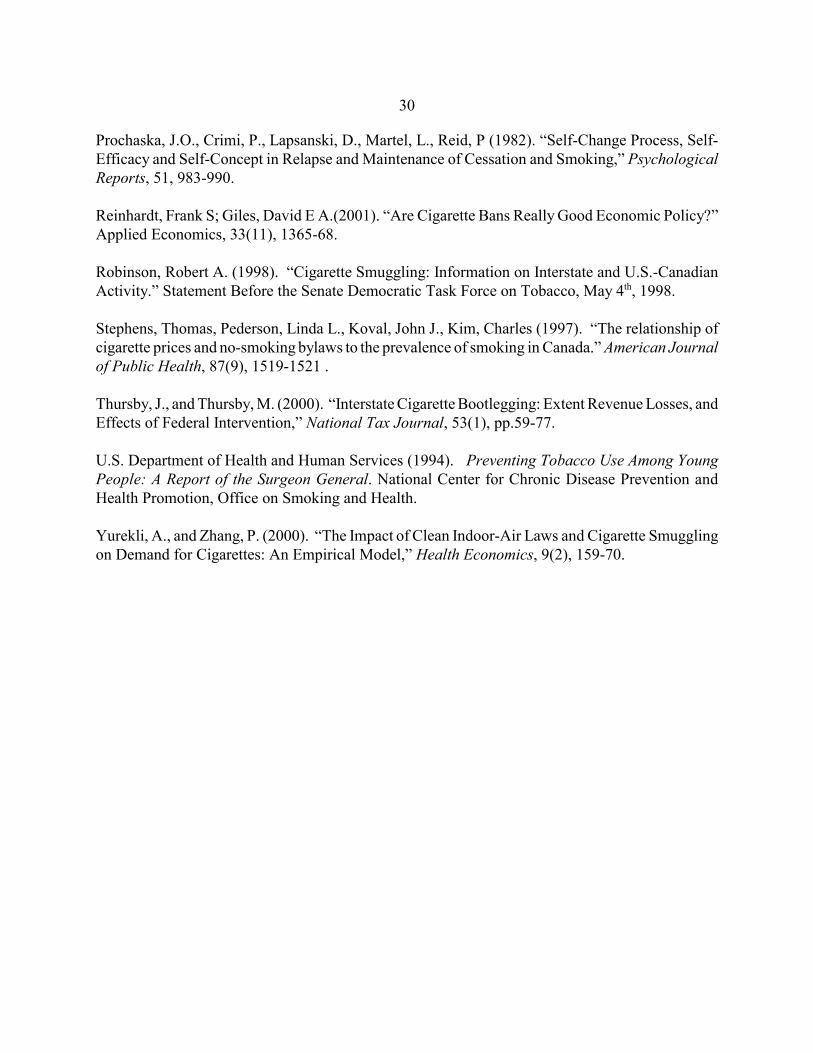
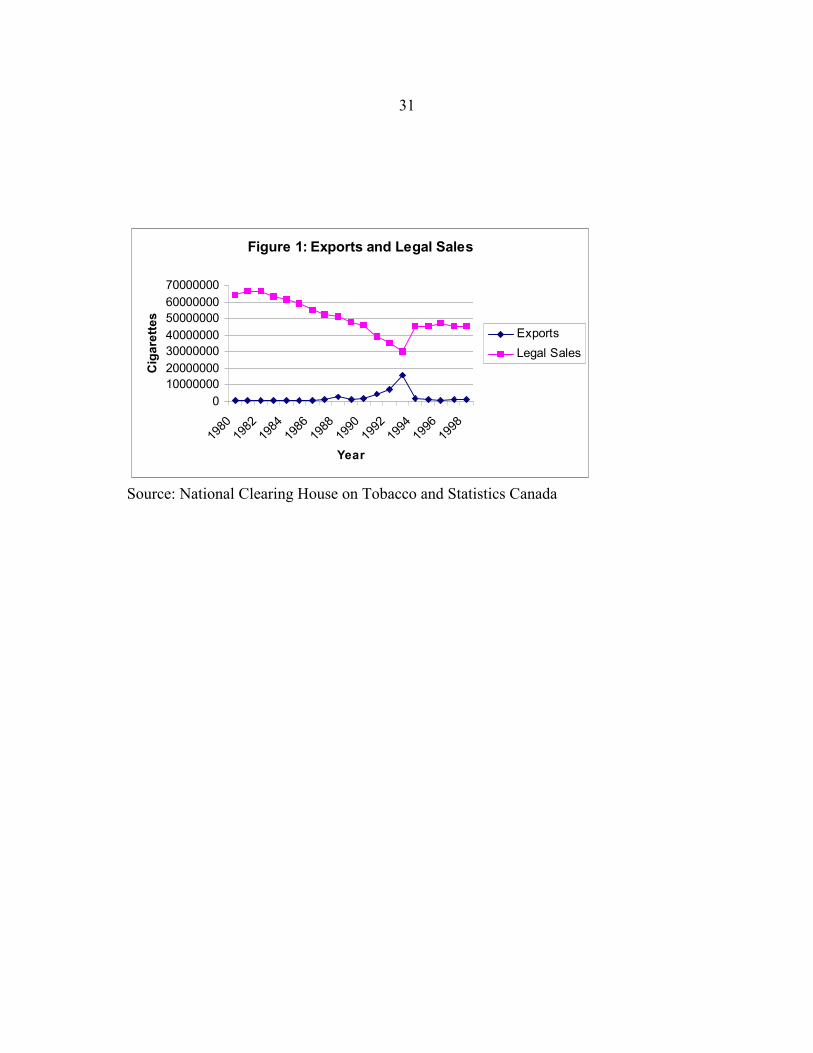
The typical means of estimating contraband sales in Canada in the early 1990s is
therefore to consider increases in cigarette exports relative to the pre-1990 baseline. This is
shown in Figure 1. Legal sales of cigarettes, after slowly declining until 1990 (mirroring the
decline in the U.S.), suddenly dropped precipitously until 1993, before jumping back up again in
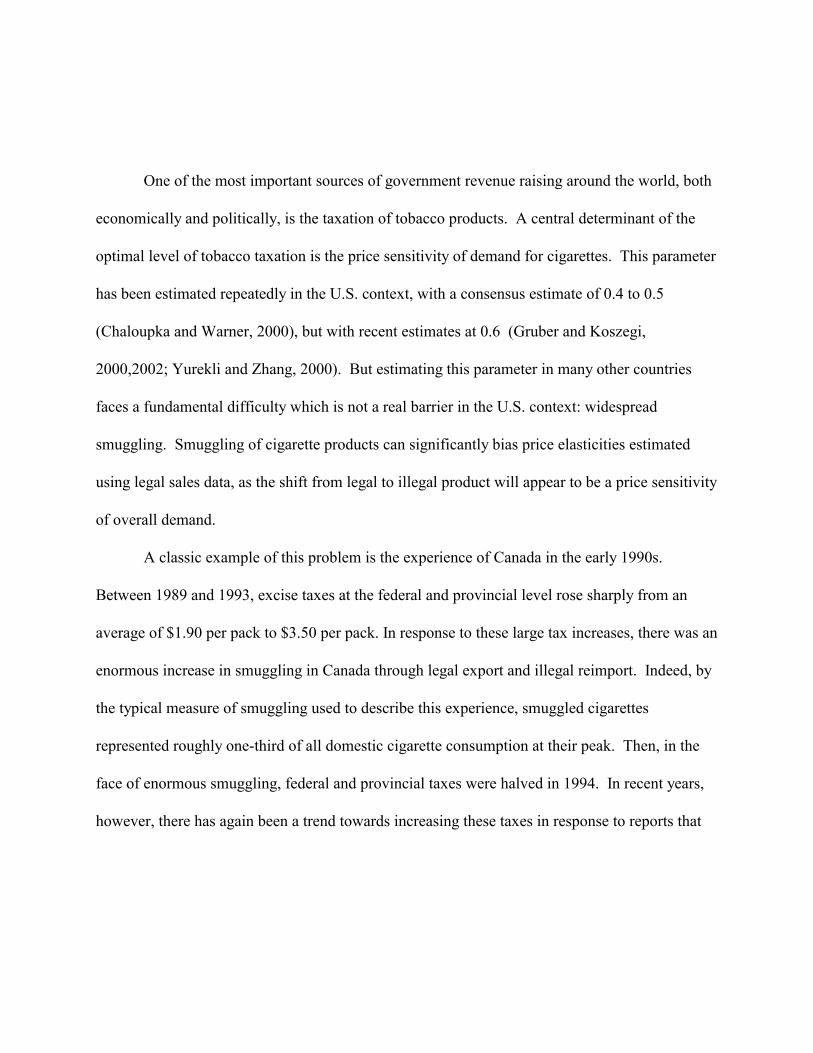
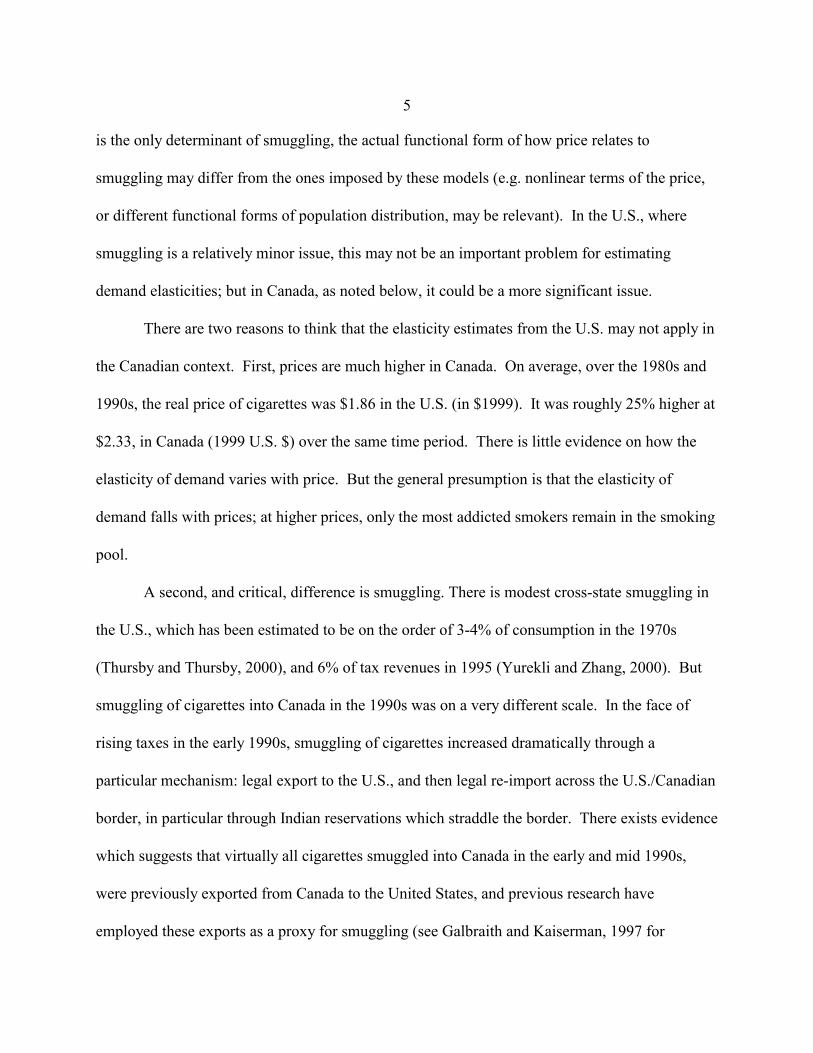
1994. There is a mirror-image increase in cigarette exports over these years. As Figure 2 shows,
exports rose from a pre-1990 level of less than 1.5% of legal sales to a level in 1993 of roughly
half of legal sales, before plummeting again in 1994 as taxes declined. This suggests smuggling
on a much larger scale than has been seen in the U.S. context.
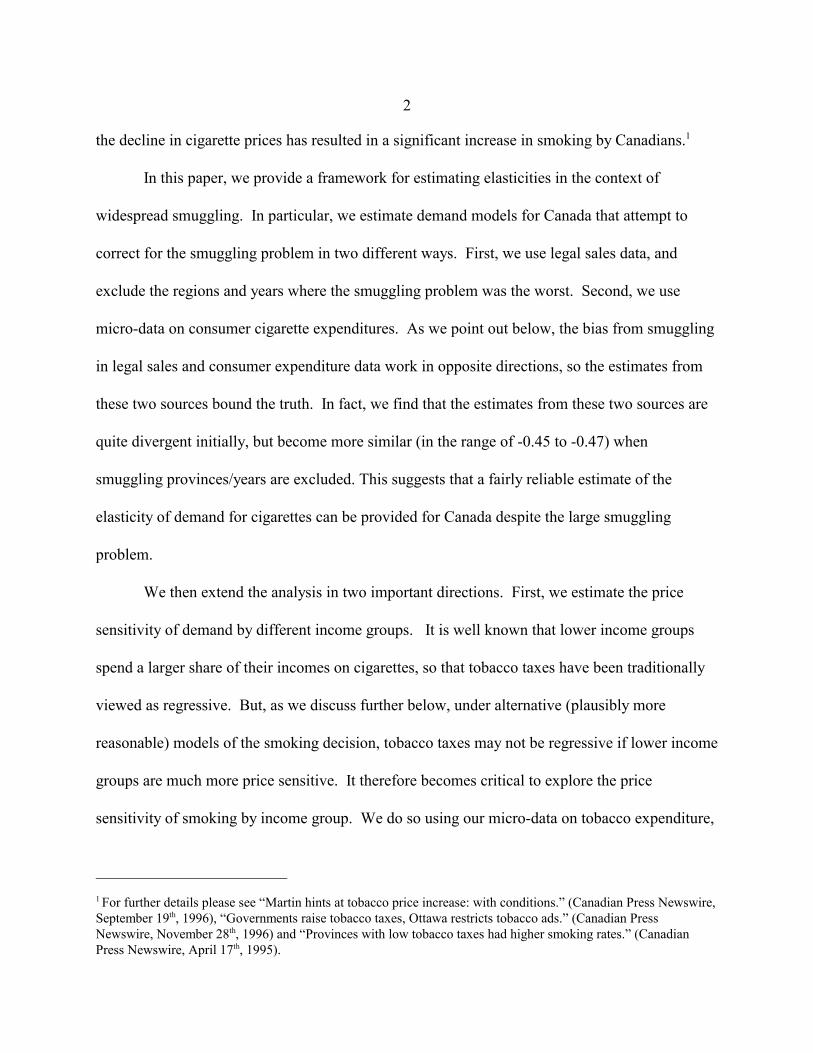
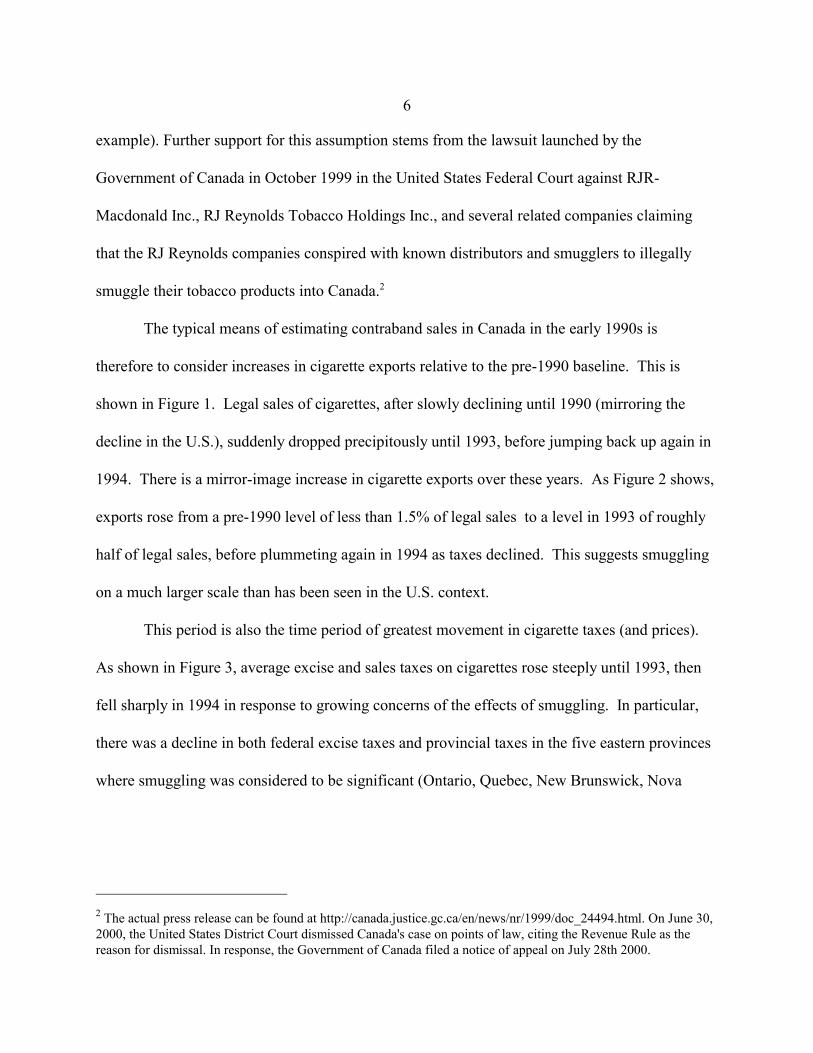
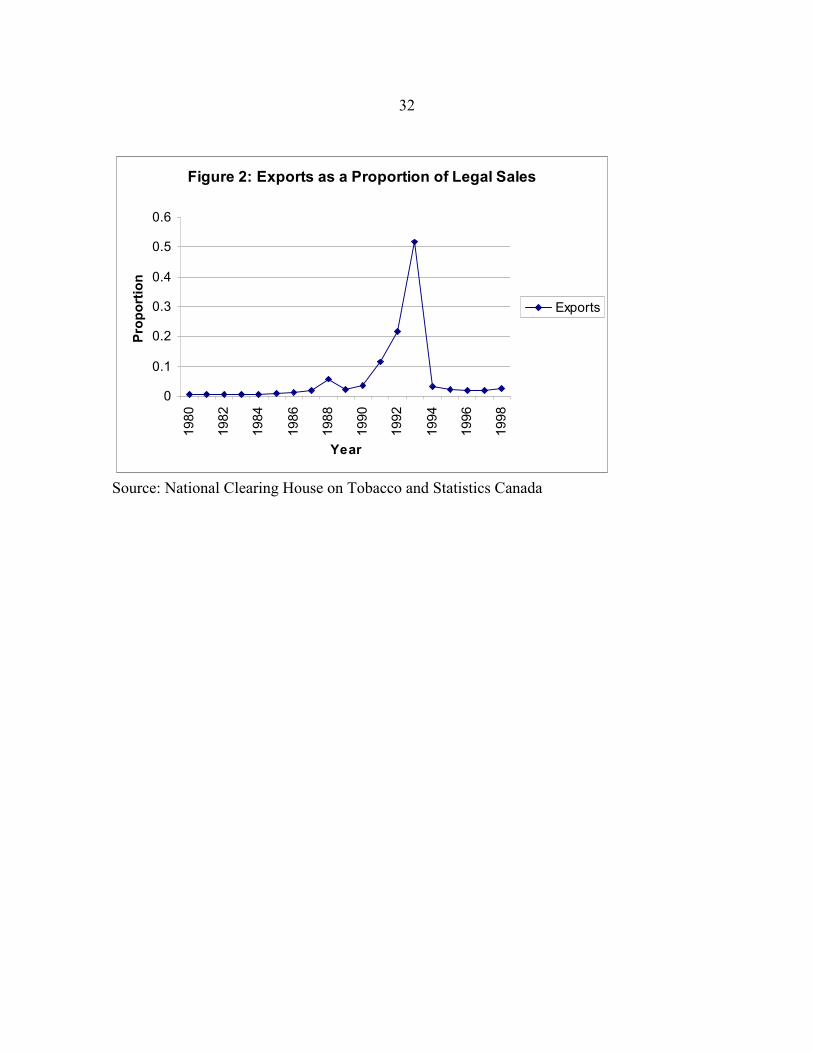
This period is also the time period of greatest movement in cigarette taxes (and prices).
As shown in Figure 3, average excise and sales taxes on cigarettes rose steeply until 1993, then
fell sharply in 1994 in response to growing concerns of the effects of smuggling. In particular,
there was a decline in both federal excise taxes and provincial taxes in the five eastern provinces
where smuggling was considered to be significant (Ontario, Quebec, New Brunswick, Nova
7
3 The Canadian prime minister, Jean Chretien, stated that smuggling was attracting organized-crime gangs,increasing the danger to law-enforcement officials and others as smugglers use assault weapons, creating hardshipfor owners of small stores that rely heavily on cigarette sales, and costing millions in lost tax revenue to provincialand federal treasuries (Gunby, 1994).
4 Unlike other federal taxes, the federal government sets province specific federal excise taxes oncigarettes. We discuss this in further detail below.
Scotia, and Prince Edward Island) from February 9 to April 15, 1994.3 The federal government
cut its excise tax (levied at the manufacturer's end) from $10.36 to $5.36 per carton of 200
cigarettes in February 1994. After the federal tax cut, the five eastern provinces dropped their
provincial tax rates (levied at the retailer's end) as well. Quebec dropped its tax rate in February
1994, and it was soon followed by New Brunswick, Ontario, Prince Edward Island and Nova
Scotia. The federal government then cut the cigarette excise tax even further in these five
provinces.4 By April 1994, the combined federal and provincial cuts had reduced tax rates in
these provinces by between $14 and $21 per carton (Hamilton et al, 1997a). The above policy
details indicate which provinces were the hardest hit by smuggling: those eastern provinces in
which it was easiest to re-import legally exported cigarettes to the U.S..
The few studies that have attempted to estimate the price elasticity of demand in Canada
either fail to address the impact of smuggling or suffer from other shortcomings. Reinhardt and
Giles (2001) find a price elasticity of –0.62. Their study uses time series national level data
between 1968 to 1990, which precludes the serious smuggling period of the early nineteen-
nineties. However, they rely solely on national time series variation; any other contemporaneous
trends in the demand for cigarettes (such as the overall fall in demand that was observed in the
U.S. as well) could bias their estimates.
Galbraith and Kaiserman (1997) also employ national time series data on legal cigarette
8
sales and prices, their data comes from 1980 to 1994. In order to account for the smuggling
between 1990 to 1994, the authors combine legal sales figures with export numbers to come up
with an estimate of total consumption. They find short run elasticities of legal and total
consumption with respect to legal prices to be –1.01 and –0.40, respectively. Their model does
control for linear time trends in smoking, but it is unclear if this is sufficient to control for
underlying trends in smoking demand that might be correlated with (but not caused by) price
changes.
Hamilton et al, (1997b) examine the response to changes in cigarette prices in Canada
between 1985 and 1995. They use micro data on cigarette consumption over time and across
provinces and estimate elasticities in the range of -.3. These estimates exploit the significant
variation in prices across the provinces over the 1990s, but again do not control for the impact of
smuggling over this period. Nor do they include province fixed effects to control for differences
across provinces in tastes for smoking.
In short, none of the Canadian literature has approached the sophistication of the U.S.
literature, which uses “difference-in-difference” estimates based on tax variation within states
over time to control for state-specific tastes for smoking and for national trends in smoking. And
the issue of smuggling has also either been ignored or addressed in a rudimentary fashion. Thus,
it seems to us appropriate to revisit a Canada-specific estimate of the elasticity of cigarette
demand. It is this estimate that we pursue below.
9
5 Data on federal and provincial taxes from 1971 onwards were obtained from the Ministry of Finance, and counterchecked against relevant editions of the National Finances, and Provincial and Municipal Finances.
Part II: Data
Tax, Price, and Legal Sales Data
There exists significant cross-province and time-series variation in both federal and
provincial cigarette taxes. Federal taxes consist of excise taxes, excise duties, and sales taxes (the
federal sales tax until 1991, and the goods and services tax (GST) thereafter). There is
considerable variation in these taxes over time. Moreover, unlike other federal taxes, federal
taxes on cigarettes also differ across provinces at a point in time. Specifically, while federal
excise duties and sales taxes are similar across provinces there are pronounced differences in
federal excise taxes after February 1994. Federal excise taxes dropped from $10.35 per 200
cigarettes to $5.35 (nominal $) in British Columbia, Alberta, Saskatchewan, Manitoba, and
Newfoundland. In contrast federal excise taxes fell from $10.35 to $0.75, $0.35, $3.35, $3.35,
and $1.10 in Ontario, Quebec, New Brunswick, Nova Scotia, and Prince Edward Island,
respectively. Provinces also levy their own tobacco tax and sales taxes, and further provincial
variation results from whether or not a provincial sales tax is applied to tobacco products.5 The
result of this web of taxes is that there is significant variation in effective excise and sales taxes
on cigarettes within provinces over time.
Average prices (nominal) per 200 cigarettes for each province between 1994 to 1999
were obtained from Statistics Canada. Average province specific prices for other years between
1981 to 1997 were then extrapolated using cigarette price indices for each province from
Statistics Canada. The problem with computing prices in this manner, however, is that the index
10
6 Nominal prices and taxes were deflated with province specific consumer price indices, obtained from StatisticsCanada.
7 This division comes from the fact that the primary conduits for smuggling cigarettes into Canada were across theSt. Lawrence River and Indian reserves that separate the eastern provinces (Ontario, and Quebec and the Maritimes)from the U.S. (“Contraband cigarettes hurt Canada's cigarette makers.” The Economist, v 330, Jan 15 1994. p. 68).Moreover, this division is confirmed by the fact that our set of “smuggling” provinces is exactly the set where bothprovincial and federal taxes were slashed in response to the smuggling “crisis”; thus, these are the provinces forwhich policy-makers viewed the smuggling problem as worst. Smuggling apparently was not significant inNewfoundland due to it’s distance from the U.S. border. This explains why it did not lower its tobacco taxes in1994 along with other eastern provinces.
is only available annually, and there are important movements in taxes (and therefore prices)
within the year. We therefore compute a pre-tax annual price by subtracting from the nominal
price the average excise and sales tax level during the year. We then compute a new after-tax
price by adding to this annual average pre-tax price the monthly value of the excise and sales tax.
We obtained data on total legal sales of cigarettes for each province between 1981 to
1999 from the National Clearinghouse on Tobacco and Health Program, an organization funded
by the federal government as well as the provinces, which acts as a public repository for data
relevant to tobacco control. Our dependent variable, legal cigarette sales per capita, is created by
dividing sales by the population age 15 and older in each province and year.
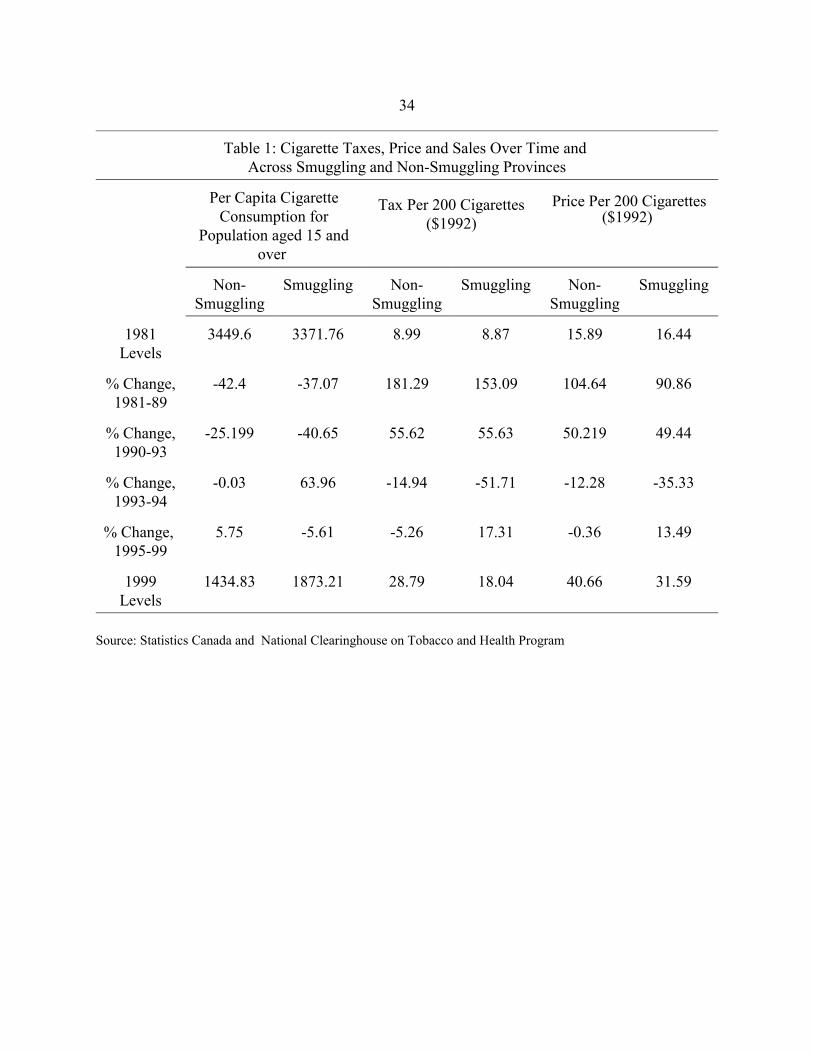
Table 1 contains average real prices and taxes (in $ 1992) per 200 cigarettes, and legal
sales per capita, from the end points of the sample (1981 and 1999) separately for provinces
where there was less smuggling (British Columbia, Alberta, Saskatchewan, Manitoba, and
Newfoundland) and where smuggling was concentrated (Ontario, Quebec, New Brunswick, Nova
Scotia, and Prince Edward Island).6 7 We also divide this period into several sub-periods of
interest: 1981 to 1989 (before smuggling was a major issue); 1990-1993 (the period of major
smuggling); 1993-94 (the period of reaction to the smuggling problem); and 1995-1999. In 1981,
at the start of our period, these two sets of provinces looked quite similar in terms of per capita
11
8This decline in cigarette taxes in non-smuggling provinces was primarily due to the drop in federal excise taxesfrom $10.35 per 200 cigarettes to $5.35 (nominal $), as other relevant federal and provincial taxes remainedunchanged. As discussed earlier, the fall in federal excise taxes in the smuggling provinces was much moredramatic. Provincial tobacco taxes fell from: $13 to $3.40 in Ontario; $13.76 to $2.76 in Quebec; $13.60 to $6.60 inNew Brunswick; $13.60 to $6.60 in Nova Scotia; and $19.60 to $10.36 in Prince Edward Island, respectively.Federal excise duties remained constant across all provinces at $5.50.
legal sales, taxes, and prices. They also had similar changes in sales, taxes, and prices over the
1981-1989 period. Over the 1990-1993 period, the change in price and tax was also similar in
the two sets of provinces, but there were quite different changes in legal sales. In the non-
smuggling provinces, legal sales fell by 25%; but, in the smuggling provinces, sales fell by 40%.
This higher price sensitivity in the “smuggling provinces” is very consistent with the notion of
smuggling into these provinces, eroding the legal sales base.
From 1993-1994, there were much larger reductions in taxes and prices in the smuggling
provinces; as noted above, these were the response to the smuggling problem.8 There was an
associated dramatic increase in legal sales in those provinces relative to the nonsmuggling
provinces; this response to the price change once again highlights the impact of smuggling on
price sensitivity of legal sales. Finally, in the last period, taxes began to rise again in the
smuggling provinces, and legal sales to fall. By 1999, the result of these actions was that taxes
and prices were significantly lower in the smuggling provinces, and per capita consumption was
significantly higher.
The results in Table 1 confirm that smuggling was a major problem in Canada in the
1990-1993 period. Since price changes were similar over the 1990-1993 period in the two sets of
provinces, we can infer that the 15.45% larger drop in legal sales in the smuggling provinces
represented the impact of smuggling. Multiplying this by per capita sales, and then by
population, we obtain an estimate of a 4.6 billion reduction in legal cigarette sales. According to
12
9We re-run all specifications limiting the sample to only urban populations, and also including urban/ruralcontrols. Our finding are robust to these alternate specifications.
the export data cited earlier, over the 1990-1993 period exports of cigarettes averaged 7.6 billion
per year. This represented a rise of 5.3 billion per year over the 1988-1989 (“pre-smuggling”)
baseline. So our estimate using the legal sales data is only about 13% lower than the export
estimate of smuggling. Moreover, our estimate should be a lower bound, since we assume zero
smuggling into all of the other provinces in Canada.
FAMEX Data
Our second data source is the Canadian Survey of Family Expenditure (FAMEX). We use
information from this survey to track household cigarette expenditure over time and across
Canada. We use every available survey year between 1982 and 1998 which comprises of 1982,
1984, 1986, 1990, 1992, 1996, 1997, and 1998. The survey is a national survey, although some
of the survey years focus on urban centres, while others include both urban and rural
populations.9
Each survey collects information on how much the household spent on cigarettes (as
separate from other tobacco products) in that year. We use this question as our measure of
cigarette expenditure. The survey also collects limited demographic information which we
include in our analysis, including the after tax income of the household, the family size of the
household, and the sex of the head of the household. The survey also reports total expenditures
on all goods by the household, which we use later in our analysis. While education information
is available in earlier surveys, these questions were unfortunately dropped from the later years of
13
the survey and so we do not include education controls here.
While ideally we would like to know the province of residence, the FAMEX data reports
consistent information for region of residence only . The region variable groups the Maritime
provinces together and the Prairie provinces together. Therefore the data contain information on
five regions: the Maritimes, Quebec, Ontario, the Prairies, and British Columbia. Beginning in
1986 the data contain a separate regional identifier for Alberta and beginning in 1992 the data
identify all 10 provinces. In our analysis we use the five regional dummies available throughout
our sample as regional controls. In order to assign cigarette taxes to provinces we exploit the
maximum amount of regional information available in that survey year and when necessary
assign the average of the tax rates across the region when the specific province is not identifiable.
We drop a small number of observations (362) for which regional information is missing. All
expenditure and income information is transformed into 1992 Canadian dollars. The resulting
data set consists of 81,479 observations across eight survey years.
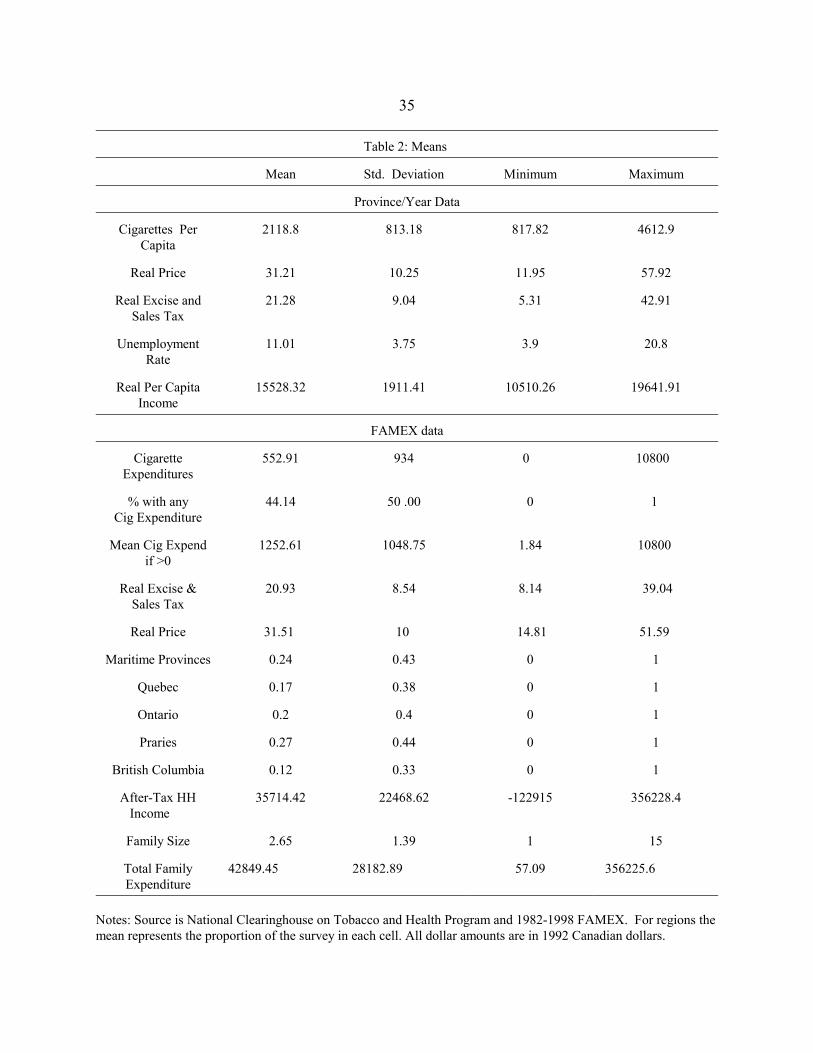
Means
Means of our data sets are show in Table 2. On average, Canadians consumed 2188.8
cigarettes on an annual basis at a per-carton real (1992) price of $31.21, paying a tax of $21.28.
There is considerable variation in real taxes as the sample minimum and maximum are $5.31 and
$42.91, respectively. The sample mean of taxes as a share of price is 66.01%, with minimum and
maximum values of 44.40% and 80.65%, respectively. In the FAMEX data, average cigarette
expenditure was $553 in 1992 dollars. Forty-four percent of households spent some amount on
cigarettes in the past year and among smokers average expenditure was $1253 (1992 dollars).
14
Part III: Empirical Methodology
Our basic empirical methodology follows that used in the previous literature. We use the
legal sales data to estimate models of the form:
(1) SALESjt = α + βPRICEjt + δj + τt + δj*TIME +ε
where SALES is cigarettes sold per capita in province j in year t; PRICE is the cigarette price; δj
and τt are fixed effects for province and year, respectively; and TIME is a linear time trend. By
including province fixed effects, we control for any fixed differences in tastes for smoking across
provinces. Likewise, by including fixed time effects, we control for any national changes in
smoking behavior which may be correlated with, but causally unrelated to, tax changes. But the
problem with those controls alone, when the panel is long, is that there may be slowly moving
trends within provinces that are correlated with both smoking and cigarette prices; as Gruber and
Koszegi (2000) discuss for the U.S., there is a very significant impact of such trends on price
elasticity estimates. Thus, we include linear province-specific time trends in our models as well.
Finally, we also control for provincial unemployment rates and real per capita income in order to
proxy business-cycle effects. We estimate this model in levels; results from log-log models are
quite similar.
One problem with this model is that price may be endogenous. That is, tobacco
companies may set province-specific prices in reaction to province-specific shocks that affect
the taste for smoking. We therefore estimate an instrumental variables version of equation (1),
where we use province/year taxes as instruments for prices.
The major problem that remains with this framework, as highlighted above, is smuggling.
If there is significant smuggling, then the elasticity we estimate with legal sales data will

15
overstate the true elasticity, since part of the response to price increases is to exit the legal
market. That is, suppose that true total consumption is:
SMOKEjt = SALESjt + SMUGGLEjt
where SALES is legal sales, as above; SMUGGLE is smoking of smuggled cigarettes; and
SMOKE is total smoking. Then the estimated elasticity of sales with respect to the price is:
δSALES = δSMOKE - δSMUGGLEδPRICE δPRICE δPRICE
Since the first term on the right hand side is negative, and the second term is positive, the
elasticity of sales with respect to price will over state the true elasticity of smoking with respect
to price.
How can one address this problem? There are three approaches. The first is to try to
include a measure of smuggled consumption directly into the model, to control for this omitted
factor. The problem is that the only measure that we have available is export data, but these are
national data and there is no way to use them to derive a province-specific amount of smuggling.
The second approach is to estimate the elasticity over times and places where smuggling is not an
issue. We have already presented evidence that the worst smuggling in Canada was in the
eastern part of the country. In terms of the specific time period, we assume that significant
movement in contraband cigarettes from the U.S. occurred during 1990-94, which is consistent
with previous research (Galbraith and Kaiserman, 1997). Therefore, we can reestimate this
model excluding observations from these eastern provinces over the 1990-94 period.
But the disadvantage of this approach is that it is once again relatively crude. We can’t
definitely define either the times or the places where smuggling was worst. And the broader the
16
cut out of our data to account for this, the more true variation in prices we lose, since the 1990s
was the period of the greatest movement in cigarette prices.
We therefore also rely on a third approach: using actual cigarette expenditure data. The
advantage of cigarette expenditure data is that the bias is the opposite of that documented for
legal sales data: smuggling will lead to an understatement of the elasticity using expenditure data.
This is because our regressions use the legal price of cigarettes, which overstates the effective
price of consumption in the smuggling provinces. Thus, there is systematic measurement error in
the price data that leads to a downwards bias to the estimated elasticity.
In the cigarette expenditure data, we run similar regressions to those above. The
dependent variable is household cigarette expenditures (including zeros if there is no cigarette
expenditure). We also show results below where we estimate separate models for any smoking
and the conditional amount smoked. As above, we control for fixed effects for each region and
for each year, as well as region-specific linear time trends. We also control for some of the
household characteristics available in this micro-data: after tax household income, the square of
after tax income, the sex of the household head and the family size.
Part IV: Basic Results
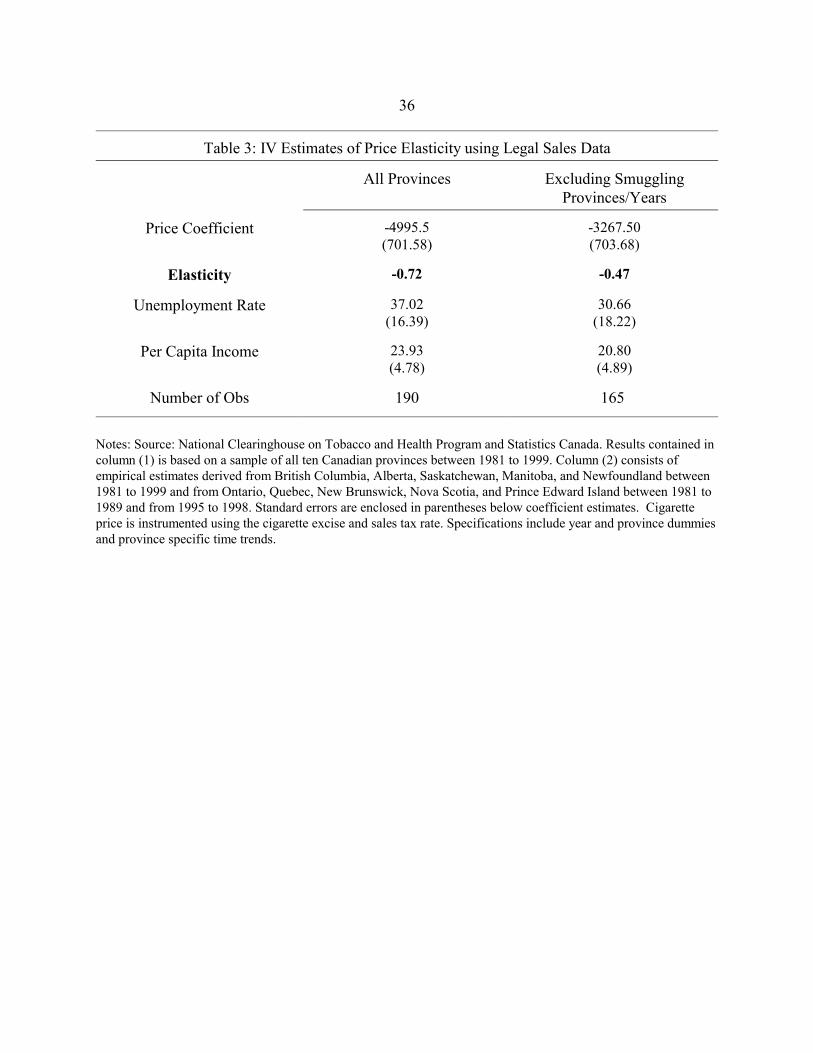
Our basic estimates from the legal sales data, with no attempt to correct for smuggling,
are shown in the first two column of Table 3, which shows a linear model which relates cigarette
sales per capita to the price (instrumented by tax). We estimate that for every $1 rise in (real)
price, there is a 49.95 reduction in cigarette consumption per capita. The implied elasticity is -
0.72. This estimate is somewhat larger than the elasticity estimates for the U.S.; given that prices
17
are so much higher in Canada, the presumption discussed above was that the elasticity would
actually be lower. However, there is no correction for smuggling bias.
In column (2), we attempt our first correction: excluding the smuggling provinces (the
eastern provinces during the 1990-94 period). Doing so, as we expected, we find a fall in the
elasticity, which is now estimated to be -0.47. Thus, correcting for smuggling in this way does
appear to have an important impact on the estimated elasticities. In particular, it moves them into
the range estimated for the U.S.
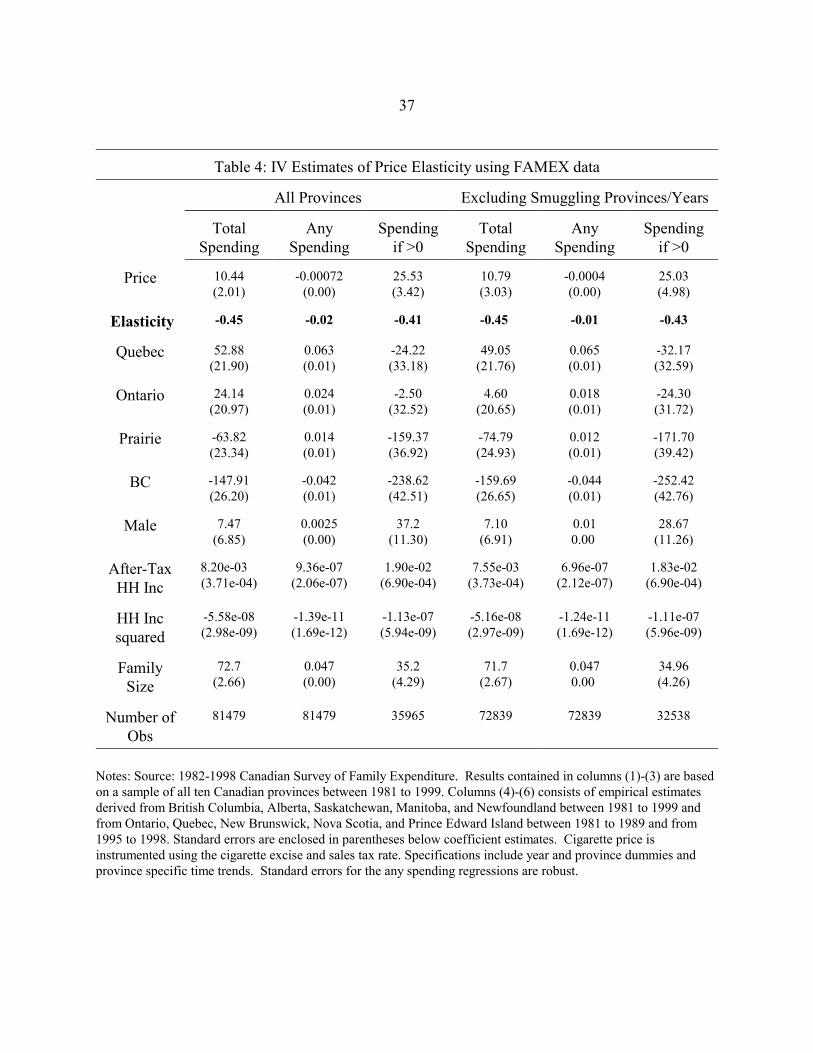
We then turn, in Table 4, to comparable estimates using the FAMEX consumption data.
Column (1) shows the estimated impact of price (instrumented by tax) on dollars of cigarette
expenditure. The coefficient estimates show the impact of a one dollar price increase on
expenditures; the standard errors are in parentheses. Below each estimate is the price elasticity of
sales implied by this consumption response, at the mean price and quantity; this elasticity is
computed as β/C - 1, where β is the estimated coefficient and C is the sample mean of
consumption. We estimate that each dollar price increase leads to an increase in annual cigarette
expenditures of 10 dollars, for an implied elasticity of -0.45.
Columns (2) and (3) decompose this response into its intensive and extensive margins.
We do so by modeling separately a dummy for the presence of any tobacco expenditure in the
household, and the level of spending conditional on there being any household spending
(elasticities are almost identical if we use log of conditional spending). We find that there is only
a small and insignificant effect of prices on the presence of any tobacco expenditure in the
family. But there is a large elasticity of conditional expenditures of -0.41. Thus, it appears that
almost all of the response of consumption to price changes occurs through reductions in
18
consumption and not quitting smoking; this stands in contrast to the U.S. evidence, which
suggests that both margins are responsible in similar proportions for the sensitivity of smoking to
price (e.g. Evans, Ringel and Stech, 1998).
In columns (4)-(6), we repeat these estimates, excluding once again the smuggling
province/years. This change in sample, interestingly, has essentially no effect on the estimated
elasticities. This suggests that the bias from mismeasured prices through smuggling is quite
modest.
Putting these two sets of estimates together, we have a well defined range of price
elasticities from -0.45 to -0.47. It is clear that the estimates obtained from the legal sales data,
without any correction for smuggling, are too large. But, once the smuggling provinces and years
are removed, the legal sales data estimates are comparable to those from the expenditure data.
The similarity of the estimates using these two alternative approaches is comforting and suggests
we are obtaining the “true” price elasticity that is not tainted by smuggling.
Part V: Estimates by Income Group
Motivation
A primary consideration in the policy debate over excise taxation is the potential
regressivity of tobacco taxes. Lower income groups spend a much larger share of their incomes
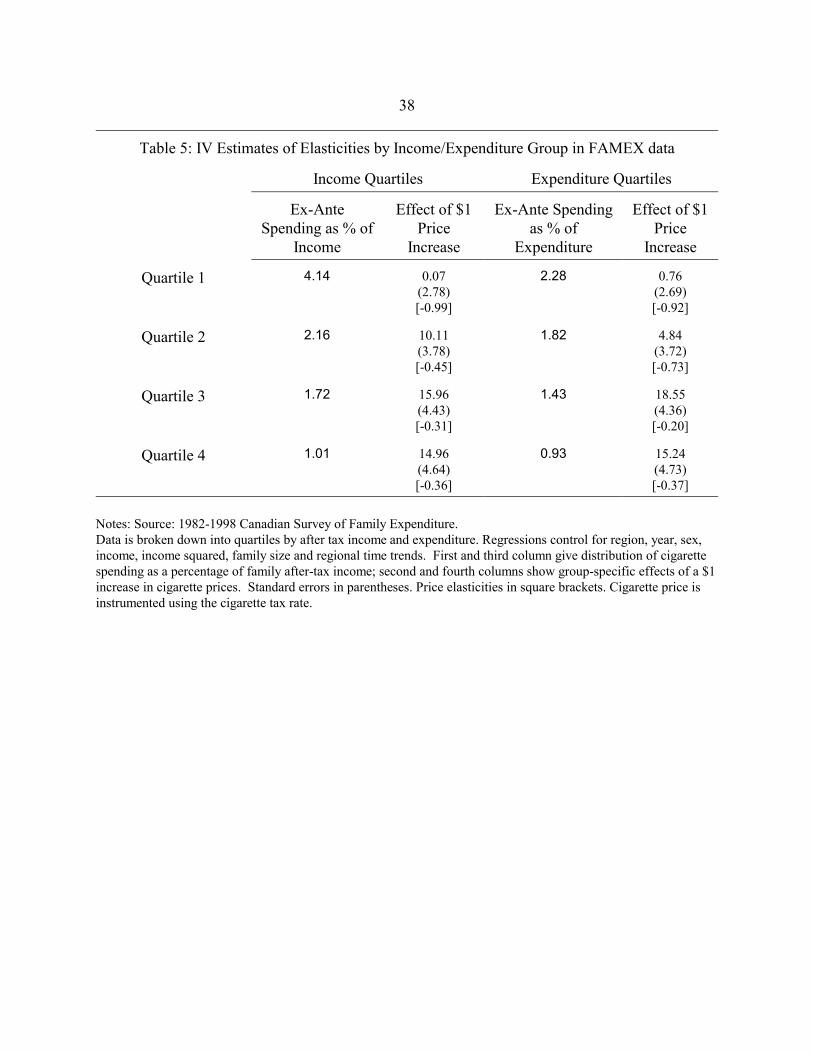
on cigarettes than do higher income groups. This is illustrated for Canada in Table 5. The first
column of this table shows the distribution of cigarette expenditures as a share of after-tax
income by after-tax income quartile in 1998. While the lowest income quartile spent 4% of after-
tax income on cigarettes, the highest income quartile spent only 1% of after tax income.
19
This seeming inequity is much smaller than it appears when considered from the lifetime
perspective, however. The lifetime burden of excise taxes is typically much smoother than the
annual incidence, since income levels vary more over a lifetime than smoking levels (Poterba,
1989). The third column of Table 5 follows Poterba (1989) in using cigarette expenditures as a
share of consumption expenditures (the appropriate proxy for lifetime income in the life cycle
model). The distribution of expenditures is much smoother with the lowest expenditure quartile
spending 2.3% on cigarettes and the highest quartile spending 0.9% on cigarettes.
These facts would suggest that a tax on cigarettes would be very regressive. But Gruber
and Koszegi (2002) question this traditional approach to tax incidence. They note that this
approach is only valid under the rational addiction model of Becker and Murphy (1988). This
model presumes that agents decide to smoke in the same way they decide on other things: they
trade off the long-term costs of smoking against the immediate pleasures, all the while taking
into account the addictive properties of nicotine. In particular, Becker and Murphy model the act
of smoking as the building of an addiction stock. The more cigarettes smoked today, the greater
the addiction capital tomorrow. High addiction capital lowers average utility but raises the
marginal utility to smoking. In this way, smoking lowers future utility but also increases the
craving for another cigarette. The key feature of any addiction model is on how people deal with
this intertemporal problem. In the original Becker-Murphy formulation individuals discounted
the future exponentially, meaning that they discount k-periods forward by δk, where δ is the per-
period time discount factor.
Gruber and Koszegi (2001,2002) develop an alternative to the Becker and Murphy model
which embeds within the Becker-Murphy stock addiction framework preferences that are time
20
inconsistent, following Laibson (1997) and O’Donoghue and Rabin (1999). In this quasi-
hyperbolic formulation, next period is discounted by βδ, the following period by βδ2, and k
periods in the future by βδk, where β<1 is an extra discount factor that changes the discounting of
this period relative to the entire future. The key feature of such a hyperbolic model is that
individuals will have self-control problems. Specifically, a sophisticated hyperbolic individual
(one who knows that he discounts hyperbolically) would like to smoke less in the future than he
actually can. The problem arises because he is patient about the future (the relative discount rate
between future periods is δ), but impatient about the present (the relative discount rate between
today and tomorrow is βδ<δ). This means that when the future arrives he will end up making
more impatient choices (i.e. smoke more) than he would like to from today's vantage point.
As Gruber and Koszegi show, the discounted utility of a sophisticated hyperbolic consumer can
rise if a tax is imposed. The reason is that the tax serves as a self-commitment device. By forcing
a reduction in the smoking in the future, the tax allows the sophisticated hyperbolic agent to do
something they would not be otherwise be able to do.
Distinguishing these models empirically is difficult, as they both predict that smokers
would be price sensitive. So the evidence in this paper does not speak to the appropriate model.
But the available evidence is much more consistent with the Gruber and Koszegi formulation.
Laboratory experiments document overwhelmingly that consumers are time inconsistent
(Ainslee, 1992). In experimental settings, consumers consistently reveal a lower discount rate
when making decisions over time intervals further away than for ones closer to the present,
raising the specter of inter-personal conflict over decisions that have implications for the future.
In the context of smoking, there is indirect evidence for time inconsistency that is

21
10An alternative formulation of time inconsistency is the naive case, where individuals do not recognizetheir own self-control problems (O’Donoghue and Rabin, 1999). One feature that distinguishes naive time-consistent agents from time-inconsistent agents is an inability to realize desired future levels of smoking. In fact,unrealized intentions to quit at some future date are a common feature of stated smoker preferences. For example,among high school seniors who smoke more than one pack/day, the smoking rate five years later among those whostated that they would not be smoking (74 percent) is actually higher than the smoking rate among those who statedthat they would be smoking (72 percent) (U.S. Department of Health and Human Services, 1994).
reviewed in Gruber and Koszegi (2001,2002). A hallmark of time inconsistency is the use of
self-control devices. And there is substantial evidence that self-control devices are frequently
employed to quit smoking; people regularly set up socially managed incentives to refrain from
smoking by betting with others, telling others about the decision, and otherwise making it
embarrassing to smoke (Prochaska et al., 1982). Various punishment and self-control strategies
are recommended by both academic publications (Grabowski and Hall, 1985) and self-help
books (CDC, various years). Such self-control devices are not needed by a time consistent agent;
while such an agent would obviously like to make quitting as costless as possible, lowering the
utility of an undesired alternative is irrelevant for decision making.10
A final piece of evidence is an econometric test in Gruber and Mullainathan (2002). They
argue that one means of empirically distinguishing time inconsistent agents from time consistent
agents is the impact of cigarette taxation on their measured well-being. Time consistent smokers
will be made worse off by cigarette taxation, by the standard arguments that underlie the
Becker-Murphy model. But time inconsistent agents can be made better off by higher taxes, as
they provide the self-control device the agents demand. Gruber and Mullainathan use data on
self-reported well-being from the General Social Surveys of the United States and Canada,
matched to information on cigarette excise taxes, to show that higher levels of excise taxes raise
reported well-being among smokers, but not among others, which provides some empirical
22
support for the time inconsistent model.
Gruber and Koszegi (2002) show that, if smokers are time inconsistent, the standard
measures of tax incidence are wrong. In particular, the incidence of a tax is no longer simply
proportional to the ex ante distribution of expenditure shares. Rather, the self-control benefits of
the tax across income groups must be taken into account. If a tax provides self-control benefits,
then the fact that the poor smoke more means that they derive a larger self-control benefit from a
higher tax. That is, since the tax now serves a positive role in reducing unwanted smoking, the
larger is the share of income spent on unwanted smoking, the larger is the benefit from taxation.
Moreover, the self-control benefits of taxation rise with the differences in price elasticity
of demand across groups. Groups that are more price sensitive derive a larger self-control benefit
from cigarette taxation, since higher taxes will more likely to cause them to quit. Thus, if lower
income groups are more price sensitive, it further mitigates the regressivity of the tax. In fact, in
the U.S., where lower income groups are about three times as price elastic as higher income
groups, Gruber and Koszegi (2002) find that cigarette taxes are actually progressive for many
parameter values, and for all parameter values are much less regressive than traditionally thought.
While we cannot do a similar calibration exercise here, if we also find great differences in
elasticities by income group in Canada, it suggests that parallel results may obtain in the
Canadian context.
Results
Table 5 shows estimates of the demand equation by after-tax income quartile, and
consumption quartile, in our FAMEX data; we show the results for all years and provinces, as
23
excluding the smuggling provinces does not appear to have much of an impact on our FAMEX
estimates. It is quite clear that in our data, as in the U.S., there is a much larger price elasticity of
demand among lower income smokers. In the bottom income quartile, there is no effect of
higher taxes on cigarette spending, with an estimated elasticity of demand close to -1. This
elasticity falls to -0.45 in the second quartile, and then to -0.31 in the third quartile before rising
again to -0.36 in the top quartile. Divided by consumption quartiles, the elasticity pattern is
similar, except that the big drop-off is between the second and third quartiles, and the elasticity
rises significantly from the third to top quartiles.
In either case, in Table 5 there is a clear pattern of much higher elasticities for the lower
income groups than for the higher income groups. These results are very consistent with those
found in the U.S. by Gruber and Koszegi; indeed, the fall in elasticities as income/expenditure
rise in Canada is somewhat steeper than in the U.S. This suggests that the type of calibration
results obtained by Gruber and Koszegi for the U.S. might well hold in Canada as well, so that
cigarette taxes are actually progressive (or not very regressive) under their alternative model of
the smoking decision.
Part VI: Effect on Alcohol Consumption
Another key issue that has not been explored in the Canadian context, and has also been
relatively unexplored in the U.S. context as well, is the substitutability or complementarity of
cigarette and alcohol consumption. Ex ante, it is not clear if these activities will be
complementary or substitutable. If there is a fixed demand for such “vice” activities, then when
cigarette prices go up, individuals will substitute into drinking. But, if the activities are pursued
24
together, or if individuals assign a fixed budget to such activities, then as cigarette prices go up,
alcohol consumption may fall. In the U.S. context, Dee (1999) finds that smoking and drinking
are complementary for youth; we are aware of no studies for overall consumption. There is also
no evidence on this point of which we are aware for Canada.
If these activities are substitutes/complements, then it suggests that (a) the large tax
increases of the early 1990s increased/decreased consumption of alcohol and (b) the smuggling
that resulted decreased/increased consumption of alcohol. To the extent that consumption of
alcohol is a “bad”, such as smoking, this could imply potentially important spillover effects on
welfare from cigarette taxation.
We can investigate this issue directly in both our legal sales and expenditure data, by
modeling alcohol consumption as a function of cigarette prices. One problem that we face in the
legal sales data, however, is that, unlike cigarettes, alcohol is not a uniform product that can
simply aggregated; different products have very different alcoholic content. Thus, we rely
specifically on beer consumption and prices, since this is a relatively homogenous good like
cigarettes. Beer sales represent 80% of total alcohol sales, so that this should provide a good
representation of the effects on alcohol consumption; our results are in fact quite similar if we
use total volume of alcohol sales as well.
Our price measure is beer price per litre, which is computed by dividing the value of beer
sales by the volume of sales, using data from CANSIM. Ideally, we would instrument beer
prices with taxes as we do for cigarettes. Unfortunately, beer tax data are not available for our
full sample period. Since our focus is on cigarette prices/taxes in any case, we therefore use
uninstrumented beer prices. Our results for cigarette cross-price effects are insensitive to
25
whether beer prices are included in the model.
When examining own price effects of cigarette prices on cigarette consumption, we
expected (and found) an increase in the absolute value of the elasticity due to smuggling. But,
for cross-price effects of cigarette prices on alcohol consumption, we expect a decrease in the
absolute value of the elasticity from smuggling; a given price rise for cigarettes has less of an
effect on alcohol consumption because its effects are muted by smuggling. Thus, if alcohol and
cigarettes are substitutes, smuggling will reduce the the positive effect of cigarette prices on
alcohol consumption; if they are complements, smuggling will mitigate the negative effect from
rising cigarette prices.
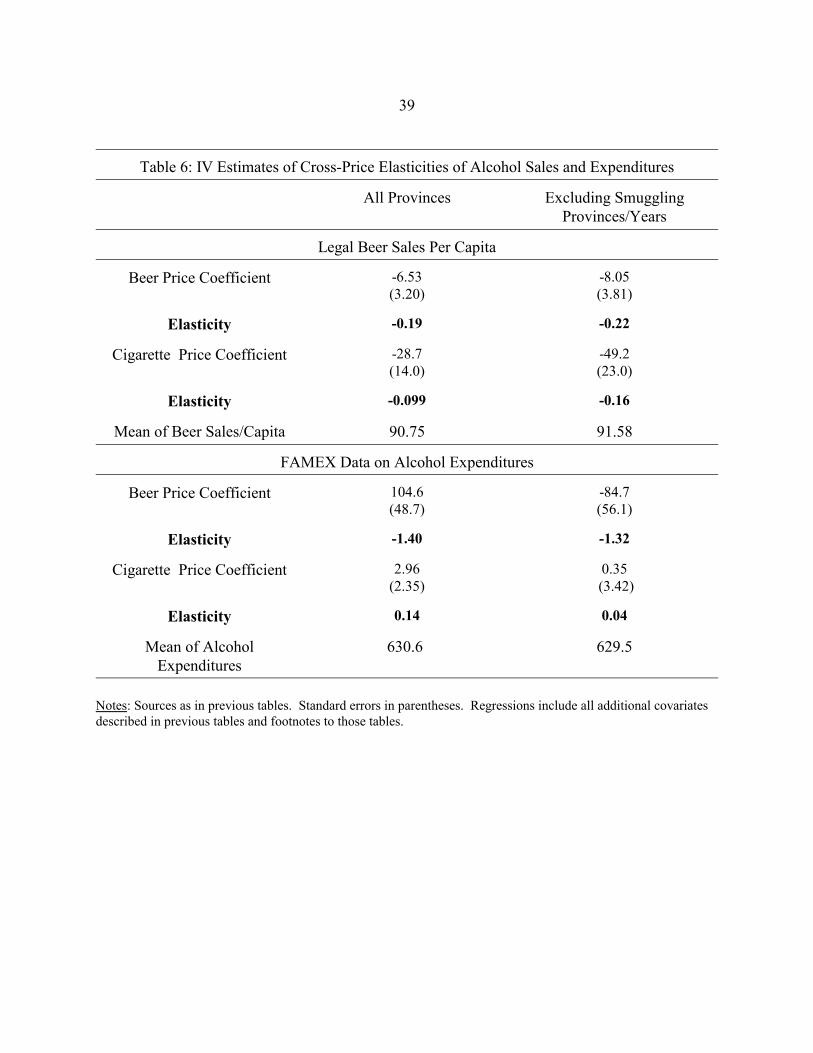
The results of this analysis for legal beer sales are presented in the top panel of Table 6.
The regression framework is identical to equation (1), except that the dependent variable is now
beer sales, and there are variables for both the cigarette and beer price. We find strong evidence
here that cigarettes and alcohol are complements. There is a significant negative effect of
cigarette prices on beer consumption, with a cross-price elasticity of -0.099. The own price
elasticity, which admittedly is less well identified since we do not have beer tax data, is roughly
twice as large.
In the next column, we once again exclude the smuggling provinces. And, as expected,
there is a rise in absolute value of the estimated cross-price elasticity, which roughly doubles
when the smuggling provinces are excluded. This confirms that cigarettes and alcohol are
complements. Moreover, it suggests that smuggling significantly increased the sales of alcohol,
by increasing sales of cigarettes.
We next turn to an investigation of the impact of cigarette prices on alcohol in the
26
FAMEX data. In FAMEX, unfortunately, we don’t have beer expenditures, but rather only
information on total alcohol expenditures. Once again, we follow an identical approach to that
used earlier, with the exception of (a) changing the dependent variable to alcohol expenditures
and (b) including a beer price regressor. The results are shown in the bottom panel of Table 6.
In this case, we do not find any evidence for complementarity between cigarettes and
alcohol; there is a positive effect of cigarette prices on alcohol consumption, but it is highly
insignificant, both with the smuggling provinces in and with them out. At the same time, we find
a much larger own price elasticity of alcohol consumption, although once again this coefficient is
rendered somewhat suspect by the lack of satisfactory instrument.
It is unclear why we found consistent results across our data sets for own cigarette price
effects and inconsistent results for cross-price effects. This may have something to do with the
fact that we have beer consumption directly in the legal sales data, but only total alcohol
expenditures in the FAMEX data; but, as noted above, our legal sales results are quite similar if
we use total alcohol volumes. In any case, this leaves us unable to clearly conclude that
cigarettes and alcohol are complements. But we can clearly conclude that these substances are
not substitutes. This mitigates concerns that higher cigarette taxes will simply serve to drive up
use of alcohol.
Part VII: Conclusion
A central parameter for designing public policy towards smoking is the price elasticity of
demand for cigarettes. While there are numerous credible attempts to estimate this parameter in
the U.S., there is much less evidence for Canada. Partly this is because the key period of price
27
variation in Canada is a period of significant smuggling.
We have presented two approaches to surmounting the bias to estimated elasticities from
smuggling. The first is to use legal sales data, and exclude the regions and years where the
smuggling problem was the worst. The second is to use micro-data on consumer cigarette
expenditures, where there is an opposite-signed bias from smuggling. Our estimated elasticities
from these two approaches are strikingly similar, in the range of -0.45 to -0.47. This suggests
that a fairly reliable estimate of the elasticity of demand for cigarettes can be provided for Canada
despite the large smuggling problem.
Further, we examine differences in the demand elasticities by income and consumption
quartile. We find that demand elasticities are much higher for lower income or consumption
quartiles, ranging from -1 for the lowest income quartile to -.3 for the highest income quartiles.
These estimates are consistent with those found in the U.S. literature. They suggest, under the
alternative time inconsistent model of smoking developed by Gruber and Koszegi (2001,2002),
that taxes on cigarettes may not be very regressive, as more price sensitive lower income groups
derive a greater self-control benefit from higher cigarette prices.
Finally, we show that there is little reason to be concerned that higher taxes on cigarettes
will drive consumers into drinking as an alternative source of “pleasure”. Depending on the data
set, we either find that cigarettes and alcohol are complements, or that their consumption is
independent. Thus, smuggling may not have only served to raise cigarette consumption; it may
have led to higher consumption of alternative “bads”, such as alcohol, as well.
28
References
Ainslie, G. (1992). Picoeconomics: The Strategic Interaction of Successive Motivational Stateswithin the Person. Cambridge, UK: Cambridge University Press.
Becker, G., and Murphy, K.M. (1988). “A Theory of Rational Addiction,” Journal of PoliticalEconomy, 96(4), pp.675-700.
Becker, G., Grossman, M., and Murphy, K.M. (1994). “An Empirical Analysis of CigaretteAddiction.” American Economic Review, 84(3), pp.396-418.
Burns, J. (1992). “Looking to the Future,” in Special Report: Business and Health, J. Burns, ed.,pp.21-22, Medical Economics Publishing.
CDC (various years), “You Can Quit Smoking,” Tobacco Information and Prevention Source,Webpage: www.cdc.gov/tobacco.
Canadian Manufacturer’s Council (1993). Summary of Canadian and American Tobacco Sales,including sales of Canadian Contraband.
Chaloupka, Frank, and Warner, Kenneth E.(2001). “The Economics of Smoking”, in The Handbookof Health Economics, edited by Joseph P. Newhouse and Anthony J. Cuyler, New York: North-Holland, Elsevier Science B.V., pp. 1539-1627.
Dee, Thomas (1999). “The Complementarity of Teen Smoking and Drinking,” Journal Of HealthEconomics, (18)6, 769-793
Evans, W., Ringel, J, and Stech, D. (1999). “Tobacco Taxes and Public Policy to DiscourageSmoking,” in Tax Policy and the Economy, J. Poterba, Cambridge, MA: MIT press, p. 1-56.
Farrelly, Matthew C., Chaloupka, Frank, and Pechacek, Terry F. (2001). “The Impact of TobaccoControl Program Expenditures on Aggregate Sales: 1981-1998.” NBER Working Paper 8691,December 2001.
Galbraith, John W and Kaiserman, Murray (1997). “Taxation, Smuggling and Demand forCigarettes in Canada: Evidence from Time-Series Data.” Journal of Health Economics, 16(3), 287-301.
Grabowski, J., and Hall, S.M. (1985). “Tobacco Use, Treatment Strategies and PharmacologicalAdjuncts: An Overview,” in Pharmacological Adjuncts in Smoking Cessation, J. Grabowski, andS. Hall, ed., National Institute on Drug Abuse Monograph 53, p. 1-13.
Green LW. (1997). “Taxes and the tobacco wars,.” Canadian Medical Association Journal, 156(2),
29
pp. 205-6.
Gruber, J., and Koszegi, B. (2000). “Is Addiction “Rational”? Theory and Evidence.” NBERWorking Paper 7507.
Gruber, J., and Koszegi, B. (2001). “Is Addiction “Rational”? Theory and Evidence.” QuarterlyJournal of Economics, 116(4), 1261-1305.
Gruber, J., and Koszegi, B. (2002). “A Theory of Government Regulation of Addictive Bads:Optimal Tax Levels and Tax Incidence for Cigarette Taxation,” NBER Working Paper #8777,February 2002.
Gruber, J., and Mullainathan, S. (2002). “Do Cigarette Taxes Make Smokers Happier?” NBERWorking Paper #8872, April 2002.
Gunby P. (1994). “Canada reduces cigarette tax to fight smuggling,” Journal of the AmericanMedical Association, 271(9), p. 647.
Hamilton V.H., Levinton C, St-Pierre Y., and Grimard, F. (1997a). “The effect of tobacco tax cutson cigarette smoking in Canada.” Canadian Medical Association Journal, 156(2), 187-91.
Hamilton V.H., Levinton C, St-Pierre Y., and Grimard, F. (1997b). “An Economic Analysis of PoorSmokers,” NHRDP Working Paper, Project No. 6605-4870-801, March.
Imasco Ltd. (1996). “Annual Report 1995”.
Laibson, D. (1997). “Golden Eggs and Hyperbolic Discounting,” Quarterly Journal of Economics,112, 443-477.
Lanoie, Paul and Leclair, Paul (1998). “Taxation or Regulation: Looking for a Good Anti-smokingPolicy.” Economics Letters, 58(1), 85-89.
Lindquist, Avey, MacDonald, and Baskerville (1993). “1992 Contraband Estimate-An Update.”September 27th, 1993.
Lindquist, Avey, MacDonald, and Baskerville, “The Impact of Reducing Tobacco Taxes on theContraband Market.” June 27th 1994.
Non-Smokers’ Rights Association, “Cigarette Smuggling: A Global Weapon against Public HealthMeasures.”, http://www.nsra-adnf.ca/english/smuggling.html, November, 2001.
O’Donoghue, T., and Rabin, M. (1999). “Doing It Now or Later,” American Economic Review,89(1), 103-124.
30
Prochaska, J.O., Crimi, P., Lapsanski, D., Martel, L., Reid, P (1982). “Self-Change Process, Self-Efficacy and Self-Concept in Relapse and Maintenance of Cessation and Smoking,” PsychologicalReports, 51, 983-990.
Reinhardt, Frank S; Giles, David E A.(2001). “Are Cigarette Bans Really Good Economic Policy?”Applied Economics, 33(11), 1365-68.
Robinson, Robert A. (1998). “Cigarette Smuggling: Information on Interstate and U.S.-CanadianActivity.” Statement Before the Senate Democratic Task Force on Tobacco, May 4th, 1998.
Stephens, Thomas, Pederson, Linda L., Koval, John J., Kim, Charles (1997). “The relationship ofcigarette prices and no-smoking bylaws to the prevalence of smoking in Canada.” American Journalof Public Health, 87(9), 1519-1521 .
Thursby, J., and Thursby, M. (2000). “Interstate Cigarette Bootlegging: Extent Revenue Losses, andEffects of Federal Intervention,” National Tax Journal, 53(1), pp.59-77.
U.S. Department of Health and Human Services (1994). Preventing Tobacco Use Among YoungPeople: A Report of the Surgeon General. National Center for Chronic Disease Prevention andHealth Promotion, Office on Smoking and Health.
Yurekli, A., and Zhang, P. (2000). “The Impact of Clean Indoor-Air Laws and Cigarette Smugglingon Demand for Cigarettes: An Empirical Model,” Health Economics, 9(2), 159-70.
31
Figure 1: Exports and Legal Sales
010000000200000003000000040000000500000006000000070000000
1980
1982
1984
1986
1988
1990
1992
1994
1996
1998
Year
Cig
aret
tes
ExportsLegal Sales
Source: National Clearing House on Tobacco and Statistics Canada
32
Figure 2: Exports as a Proportion of Legal Sales
0
0.1
0.2
0.3
0.4
0.5
0.6
1980
1982
1984
1986
1988
1990
1992
1994
1996
1998
Year
Prop
ortio
n
Exports
Source: National Clearing House on Tobacco and Statistics Canada
33
Figure 3: National Average Cigarette Tax
05
10152025303540
1981
1983
1985
1987
1989
1991
1993
1995
1997
1999
Year
Cur
rent
$
Average Tax
Source: National Clearing House on Tobacco and Statistics Canada
34
Table 1: Cigarette Taxes, Price and Sales Over Time and Across Smuggling and Non-Smuggling Provinces
Per Capita CigaretteConsumption for
Population aged 15 andover
Tax Per 200 Cigarettes($1992)
Price Per 200 Cigarettes($1992)
Non-Smuggling
Smuggling Non-Smuggling
Smuggling Non-Smuggling
Smuggling
1981Levels
3449.6 3371.76 8.99 8.87 15.89 16.44
% Change,1981-89
-42.4 -37.07 181.29 153.09 104.64 90.86
% Change,1990-93
-25.199 -40.65 55.62 55.63 50.219 49.44
% Change,1993-94
-0.03 63.96 -14.94 -51.71 -12.28 -35.33
% Change, 1995-99
5.75 -5.61 -5.26 17.31 -0.36 13.49
1999Levels
1434.83 1873.21 28.79 18.04 40.66 31.59
Source: Statistics Canada and National Clearinghouse on Tobacco and Health Program
35
Table 2: Means
Mean Std. Deviation Minimum Maximum
Province/Year Data
Cigarettes PerCapita
2118.8 813.18 817.82 4612.9
Real Price 31.21 10.25 11.95 57.92
Real Excise andSales Tax
21.28 9.04 5.31 42.91
UnemploymentRate
11.01 3.75 3.9 20.8
Real Per CapitaIncome
15528.32 1911.41 10510.26 19641.91
FAMEX data
CigaretteExpenditures
552.91 934 0 10800
% with anyCig Expenditure
44.14 50 .00 0 1
Mean Cig Expendif >0
1252.61 1048.75 1.84 10800
Real Excise &Sales Tax
20.93 8.54 8.14 39.04
Real Price 31.51 10 14.81 51.59
Maritime Provinces 0.24 0.43 0 1
Quebec 0.17 0.38 0 1
Ontario 0.2 0.4 0 1
Praries 0.27 0.44 0 1
British Columbia 0.12 0.33 0 1
After-Tax HHIncome
35714.42 22468.62 -122915 356228.4
Family Size 2.65 1.39 1 15
Total FamilyExpenditure
42849.45 28182.89 57.09 356225.6
Notes: Source is National Clearinghouse on Tobacco and Health Program and 1982-1998 FAMEX. For regions themean represents the proportion of the survey in each cell. All dollar amounts are in 1992 Canadian dollars.
36
Table 3: IV Estimates of Price Elasticity using Legal Sales Data
All Provinces Excluding SmugglingProvinces/Years
Price Coefficient -4995.5(701.58)
-3267.50 (703.68)
Elasticity -0.72 -0.47
Unemployment Rate 37.02(16.39)
30.66(18.22)
Per Capita Income 23.93(4.78)
20.80(4.89)
Number of Obs 190 165
Notes: Source: National Clearinghouse on Tobacco and Health Program and Statistics Canada. Results contained incolumn (1) is based on a sample of all ten Canadian provinces between 1981 to 1999. Column (2) consists ofempirical estimates derived from British Columbia, Alberta, Saskatchewan, Manitoba, and Newfoundland between1981 to 1999 and from Ontario, Quebec, New Brunswick, Nova Scotia, and Prince Edward Island between 1981 to1989 and from 1995 to 1998. Standard errors are enclosed in parentheses below coefficient estimates. Cigaretteprice is instrumented using the cigarette excise and sales tax rate. Specifications include year and province dummiesand province specific time trends.
37
Table 4: IV Estimates of Price Elasticity using FAMEX data
All Provinces Excluding Smuggling Provinces/Years
TotalSpending
AnySpending
Spendingif >0
TotalSpending
AnySpending
Spendingif >0
Price 10.44(2.01)
-0.00072(0.00)
25.53(3.42)
10.79(3.03)
-0.0004(0.00)
25.03(4.98)
Elasticity -0.45 -0.02 -0.41 -0.45 -0.01 -0.43
Quebec 52.88(21.90)
0.063(0.01)
-24.22(33.18)
49.05(21.76)
0.065(0.01)
-32.17(32.59)
Ontario 24.14(20.97)
0.024(0.01)
-2.50(32.52)
4.60(20.65)
0.018(0.01)
-24.30(31.72)
Prairie -63.82(23.34)
0.014(0.01)
-159.37(36.92)
-74.79(24.93)
0.012(0.01)
-171.70(39.42)
BC -147.91(26.20)
-0.042(0.01)
-238.62(42.51)
-159.69(26.65)
-0.044(0.01)
-252.42(42.76)
Male 7.47(6.85)
0.0025(0.00)
37.2(11.30)
7.10(6.91)
0.010.00
28.67(11.26)
After-TaxHH Inc
8.20e-03 (3.71e-04)
9.36e-07(2.06e-07)
1.90e-02(6.90e-04)
7.55e-03(3.73e-04)
6.96e-07(2.12e-07)
1.83e-02(6.90e-04)
HH Incsquared
-5.58e-08(2.98e-09)
-1.39e-11(1.69e-12)
-1.13e-07(5.94e-09)
-5.16e-08(2.97e-09)
-1.24e-11(1.69e-12)
-1.11e-07(5.96e-09)
FamilySize
72.7(2.66)
0.047(0.00)
35.2(4.29)
71.7(2.67)
0.0470.00
34.96(4.26)
Number ofObs
81479 81479 35965 72839 72839 32538
Notes: Source: 1982-1998 Canadian Survey of Family Expenditure. Results contained in columns (1)-(3) are basedon a sample of all ten Canadian provinces between 1981 to 1999. Columns (4)-(6) consists of empirical estimatesderived from British Columbia, Alberta, Saskatchewan, Manitoba, and Newfoundland between 1981 to 1999 andfrom Ontario, Quebec, New Brunswick, Nova Scotia, and Prince Edward Island between 1981 to 1989 and from1995 to 1998. Standard errors are enclosed in parentheses below coefficient estimates. Cigarette price isinstrumented using the cigarette excise and sales tax rate. Specifications include year and province dummies andprovince specific time trends. Standard errors for the any spending regressions are robust.
38
Table 5: IV Estimates of Elasticities by Income/Expenditure Group in FAMEX data
Income Quartiles Expenditure Quartiles
Ex-AnteSpending as % of
Income
Effect of $1Price
Increase
Ex-Ante Spendingas % of
Expenditure
Effect of $1Price
Increase
Quartile 1 4.14 0.07(2.78)[-0.99]
2.28 0.76(2.69)[-0.92]
Quartile 2 2.16 10.11(3.78)[-0.45]
1.82 4.84(3.72)[-0.73]
Quartile 3 1.72 15.96(4.43)[-0.31]
1.43 18.55(4.36)[-0.20]
Quartile 4 1.01 14.96(4.64)[-0.36]
0.93 15.24(4.73)[-0.37]
Notes: Source: 1982-1998 Canadian Survey of Family Expenditure.Data is broken down into quartiles by after tax income and expenditure. Regressions control for region, year, sex,income, income squared, family size and regional time trends. First and third column give distribution of cigarettespending as a percentage of family after-tax income; second and fourth columns show group-specific effects of a $1increase in cigarette prices. Standard errors in parentheses. Price elasticities in square brackets. Cigarette price isinstrumented using the cigarette tax rate.
39
Table 6: IV Estimates of Cross-Price Elasticities of Alcohol Sales and Expenditures
All Provinces Excluding SmugglingProvinces/Years
Legal Beer Sales Per Capita
Beer Price Coefficient -6.53(3.20)
-8.05 (3.81)
Elasticity -0.19 -0.22
Cigarette Price Coefficient -28.7(14.0)
-49.2 (23.0)
Elasticity -0.099 -0.16
Mean of Beer Sales/Capita 90.75 91.58
FAMEX Data on Alcohol Expenditures
Beer Price Coefficient 104.6(48.7)
-84.7 (56.1)
Elasticity -1.40 -1.32
Cigarette Price Coefficient 2.96(2.35)
0.35 (3.42)
Elasticity 0.14 0.04
Mean of AlcoholExpenditures
630.6 629.5
Notes: Sources as in previous tables. Standard errors in parentheses. Regressions include all additional covariatesdescribed in previous tables and footnotes to those tables.


