Environmental Impact Assessment andReview of Effluent Disposal Options for Eastern Treatment Plant
CSIRO Environmental Projects Office
Final ReportJune 1999
EM
SF
INA
LR
EP
OR
T 1999
CS
IRO

Environmental Impact Assessment andReview of Effluent Disposal Options for Eastern Treatment Plant
Prepared for Melbourne Water Corporation
Authors:Brian Newell, Robert Molloy and David FoxCSIRO Environmental Projects Office.
© CSIRO, 1999Private Bag, PO Wembley, WA 6014, Australiahttp://www.epo.csiro.au/projects/boags
ISBN 0 643 06060 X
Limitations Statement
The sole purpose of this report and the associated services performed by CSIRO is to provide scientific knowledge for Melbourne WaterCorporation to prepare an Effluent Management Strategy for Eastern Treatment Plant. Work was carried out in accordance with the scope ofservices identified in the agreement dated November 9 1996, between Melbourne Water Corporation (‘the Client’) and the CommonwealthScientific and Industrial Research Organisation (CSIRO).
The findings and recommendations presented in this report are derived primarily from information and data supplied to CSIRO by the Client andfrom field investigations and research conducted by CSIRO, other agencies and consultants. The passage of time, manifestation of latentconditions or impacts of future events may require further exploration and subsequent data analysis, and re-evaluation of the findings,observations, conclusions, and recommendations expressed in this report.
This report has been prepared on behalf of and for the exclusive use of the Client, and is subject to and issued in connection with theprovisions of the agreement between CSIRO and the Client. CSIRO accepts no liability or responsibility whatsoever for or in respect of any useof or reliance upon this report by any third party.
Final ReportJune 1999
Effluent Management Study, Eastern Treatment Plant

Foreword
i
Final Report June 1999
I have pleasure in writing this foreword for this major environmental study managed by the CSIROEnvironmental Projects Office.
This Effluent Management Study is the second major environmental study undertaken forMelbourne Water by CSIRO's Environmental Project Office. The knowledge and skills that wereacquired during the Port Phillip Bay Environmental Study proved to be invaluable in developing adetailed understanding of the local ecosystem at Boags Rocks. However, unlike the Port PhillipBay Environmental Study, the Effluent Management Study was concerned with addressing aknown and specific environmental issue comprising two major themes: (i) impact assessment ofocean disposal of treated effluent; and (ii) investigation of feasible alternative disposal andtreatment options.
During the course of this study, we brought together scientists from within CSIRO as well asexperts from local universities, government research organisations, and private companies. Theydeveloped and executed a program of field work to address knowledge gaps and construct adetailed scientific understanding of the ecology and physical processes that dominate the hostileenvironment at Boags Rocks. Significant insights from these investigations have been obtainedand these form the basis of this final report.
CSIRO acknowledges the contributions made by many individuals, research teams andorganisations involved in this study. We are grateful to Melbourne Water who provided us with theresources needed to complete these investigations. We are equally appreciative of the open andconstructive participation of officers of the Environment Protection Authority whose input at variousstages of the study allowed us to identify and prioritise issues of concern.
Environmental issues are invariably complex and usually defy simple remedies. The situation atBoags Rocks is certainly no exception. Contained in the pages of this report are the results ofdetailed scientific investigations that shed considerable light on the environmental status of BoagsRocks, impacts on the local ecosystem, and alternative disposal options. The remaining challengefor Melbourne Water, the Environment Protection Authority and the public is to integrate thescientific outcomes presented here with other equally important considerations relating to social,economic, and environmental values to identify an appropriate management response toeffluent disposal from Eastern Treatment Plant.
Dr. Nan Bray
Chief CSIRO Marine Research(Chair of Environmental Projects Office Steering Committee)
This report draws heavily from and synthesises the results of a number of scientific investigationsundertaken over the past two and half years. We are indebted to the critical role played by theTechnical Group in ensuring the scientific integrity of the Study and of its outputs.
This Study could not have been undertaken without the significant contributions made by each ofthe contractors and CSIRO Divisions who undertook individual scientific tasks. The dedication andcommitment at both an individual and organisational level to the delivery of quality scientificoutcomes is reflected in the pages of this report.
The Victorian EPA provided valuable input throughout the Study. Their contributions at variousstages of the project are greatly appreciated.
Finally, we are appreciative of the resources committed by Melbourne Water to enable this study.We are particularly appreciative of the assistance provided by Melbourne Water Project Manager,Margo Kozicki for making herself available to answer our many questions and provide the CSIROteam with the data and information they needed.
CSIRO Technical Group:
Dr Graeme Batley, Centre for Advanced Analytical ChemistryDr David Fox, Mathematical and Information SciencesDr Jeanette Gomboso, Land and WaterDr John Parslow, Marine ResearchDr Sebastian Rainer, Marine ResearchDr Jenny Stauber, Centre for Advanced Analytical ChemistryDr Stephen Walker, Marine Research
Acknowledgments
ii
Environmental Impact Assessment and Review of Effluent Disposal Options for Eastern Treatment Plant
Summary
iii
Final Report June 1999
Melbourne Water engaged the CSIROEnvironmental Projects Office to manage andconduct an environmental impact assessmentand review of land and marine effluentdisposal options for the Eastern TreatmentPlant (ETP).
The plant, situated on a 1000 ha site at Carrum,treats about 42% of Melbourne’s sewage. Thesecondary treated effluent, is chlorinated priorto discharge into Bass Strait at Boags Rocksnear Cape Schanck.
As part of the Study a series of scientific taskswas carried out between January 1997 andOctober 1998 to provide data to assess thenature and extent of the environmental impactof the existing ocean outfall, and to evaluatealternative disposal options. This reportsummarises the results of those tasks andprovides a discussion of the scientific issues toconsider when developing an EffluentManagement Strategy.
Biological monitoring was conducted to assessthe extent of the effluent’s impact on theseabed communities offshore from thedischarge point. This work included diver-assisted surveys to establish the distributionand abundance of plants and animals alongthe rocky reef that runs parallel to the shore.Other work in the offshore zone includedsampling of the soft seabed to ascertain thenature of the infauna. To complete thebiological monitoring, a series of seasonalsurveys was undertaken to examine thedistribution and abundance of macroalgae onintertidal rocky platforms at Boags Rocks andother locations between Cape Schanck andPoint Nepean.
The rocky platform at the outfall site has beendenuded of its original brown algal cover. Ofnote is the loss of Hormosira banksii (Neptune’snecklace) and Durvilleae potatorum (Bull kelp).Several opportunistic green algae,invertebrates and a spionid worm (Boccardia
proboscidea) have partially occupied the void.However, we were unable to detect anylongitudinal gradient of effect against thediverse assemblages present, which havenatural longshore variation on all examinedrocky platforms. Many of the species presentexhibit seasonal and year-to-year variation,which confounds the impact assessment.
An attempt was made to establish the extent ofimpact along the coast by identifying andcounting fauna in samples of beach sands.However, the preliminary investigation of fourbeaches found that the fauna exhibited widevariation in species present and that they werepresent in low abundances. To assess outfallrelated impacts would require an excessivelylarge sampling program, which wasconsidered to be inappropriate. Instead, anoffshore sampling program was conducted.This revealed that there was lower diversity ofinfauna within about 660 m of the outfall,which may be an effect of the discharge.Further afield, impacts were difficult toestablish due to natural spatial and temporalvariation in fauna and seabed conditions.
A survey of the offshore reef, which is about600 to 800 m from and running roughlyparallel to the shore, revealed abundant floraand fauna but also exhibited longitudinalvariability, which masks any effluent effects.Based on the results of this single survey, itwas postulated that effluent discharge was afactor affecting the biological characteristics ofthe reef to a distance of 1100 m from the line ofthe outfall, and that a lesser impact may occurout to about 1400 m.
With any effluent discharge there is concernover the potential contamination of seafoodthrough toxicant bioaccumulation. For thisStudy, samples of abalone, wrasse (parrot fish)and sea squirts (cunjevoi) were collected justoffshore from the discharge point and analysedfor a suite of contaminants. The results were
iv
Environmental Impact Assessment and Review of Effluent Disposal Options for Eastern Treatment Plant
similar to previous studies carried out byMelbourne Water, and suggested thatcontamination was insignificant and posednegligible risk to human health.
To obtain a direct measure of the potentialimpact of ETP effluent, bioassays wereconducted using a battery of local test speciesincluding a bacterium, microalga, macroalgae,invertebrate and fish larvae. The resultsshowed that the effluent discharged from ETPwas non-toxic to bacteria, 1-3 day old fishlarvae and macroalgal fertilisation. It wasmildly toxic to 4-5 week old fish, and inhibitedboth diatom and macroalgal growth. Theeffluent was most toxic to scallop larvae. Theecotoxicology studies suggested that a 300times dilution of effluent would satisfyinternationally accepted guidelines for nohazard to 95% of species. Subsequentlaboratory testing identified ammonia as theprincipal toxic agent, although the freshwaternature of the effluent has a synergistic effect.
Receiving water quality was measured byunderway sampling and spot samples to assessthe concentration of nutrients (ammonia,nitrate, nitrite, phosphate and silicate) andassociated parameters (chlorophyll a, salinity,temperature and dissolved oxygen), and forthe presence of toxicants. None of the heavymetals or common organic pollutants testedexceeded recommended water qualityguidelines, however undissociated ammonialevels did exceed existing EPA limits. No algalblooms have been recorded in the area and thesampling for chlorophyll a indicated that itwas not above normal coastal levels. Thesampling also showed that dissolved oxygenin the water column was always above 90%saturation and often above100% saturation.
In a parallel project, Melbourne Water engagedMonash University to undertake a literaturereview on the health effects of ocean outfallsand to review the results from routine E.colisampling by Melbourne Water, and additionalsampling for Enterococcus spp. and totalcoliforms. Based on these data it was
concluded that surfers appear to be at noadditional risk of contracting disease fromsurfing in the area when compared to otherbeaches studied.
It is difficult to establish the level of changethat has occurred in the biologicalcommunities without having reference to“before discharge” data. However, the changesthat have been noted in both the near and farfields, are likely to be due to a combination offreshwater, ammonia toxicity, and nutrientload.
The second part of the Study was the review ofland and marine effluent disposal options. Thisincluded evaluation of flow reduction (reuse)opportunities, treatment improvements andbetter dispersion through an outfall extension.
Some 14 options for volume reduction wereassessed. These offered an array ofmanagement strategies for flow reductionsranging from less than 1% for industrial orgreywater re-use to approximately 95% forindirect potable re-use. Costs ranged from 10cto $9.86 per kilolitre of flow reduction. Thereview suggested that a concerted program ofeffluent re-use could reduce effluent dischargesignificantly over time and, for the future,indirect potable reuse should be considered inpreference to building new dams.
Sewage treatment engineers modelled optionsfor ETP treatment process modifications. Theresults indicated that ammonia levels could bereduced by a factor of six and total nitrogenhalved. Concomitant improvements in otherproperties of the effluent would also beachieved. Cost estimates largely depended onthe degree of peak flow management adoptedbut were in the range $40 to $100 million.
The engineering feasibility and cost ofextending the existing outfall from the currentshoreline discharge to a point further offshorewas investigated. Costs ranged from $26million for a 1.3 km extension to $46 millionfor a 3.1 km extension. It was calculated thatall options are practicable without additional
v
Final Report June 1999
pumping, provided that the final 10 km of theexisting pipeline was sealed in order toincrease the head pressure necessary to allowthe effluent to discharge at a depth of 32 mbelow sea level. The outfall extension wouldconsist of twin 1.5 m diameter steel pipes withterminal diffusers giving greater than 50:1initial dilution.
The effectiveness of extending the outfall toincrease dispersion was assessed through thedevelopment of a three-dimensionalhydrodynamic model with a water qualitymodule, which was applied to six hypotheticaloutfall configurations located from 1 to 3 kmoffshore. The results indicated that the averagedilution at the shoreline would be increasedsignificantly through offshore discharge, withgreater performance from the longer outfall.This would reduce the impact due to bothfreshwater and ammonia toxicity and wouldallow measurable recovery of the ecosystem atBoags Rocks. However the nutrient load to theregion, which contributes to far-field effectswould not be reduced and the risk of algalblooms occurring in the region would not besignificantly modified.
Treatment improvements would reduce theconcentrations of ammonia and total nitrogen(nutrient load), which would allow the far-field impacts to the subtidal communities andplatforms towards Cape Schanck to bereduced. However there would still be a levelof toxic impact at Boags Rocks as a result of thefreshwater continuing to be discharged. Itshould be noted that both freshwater andammonia have a synergistic effect. If one wereremoved the toxic impact presently observedon the platforms adjacent to the outfall wouldbe reduced.
In summary, treatment improvements andincreased re-use provide a compromisebetween cost, sustainability and environmentalimprovement. The far-field impacts of thedischarge seen on the rocky platforms towardsCape Schanck and the offshore seabed wouldbe reduced, but we are unlikely to see full
recovery at Boags Rocks as the freshwaterimpact (though significantly less thanammonia) will still be present. Extending theoutfall would enable the biologicalcommunities at Boags Rocks to recover tosome extent, but would not lead to a reductionin the overall nutrient load being discharged.Total re-use would eliminate the need for anydischarge, therefore avoiding any impact to themarine environment.
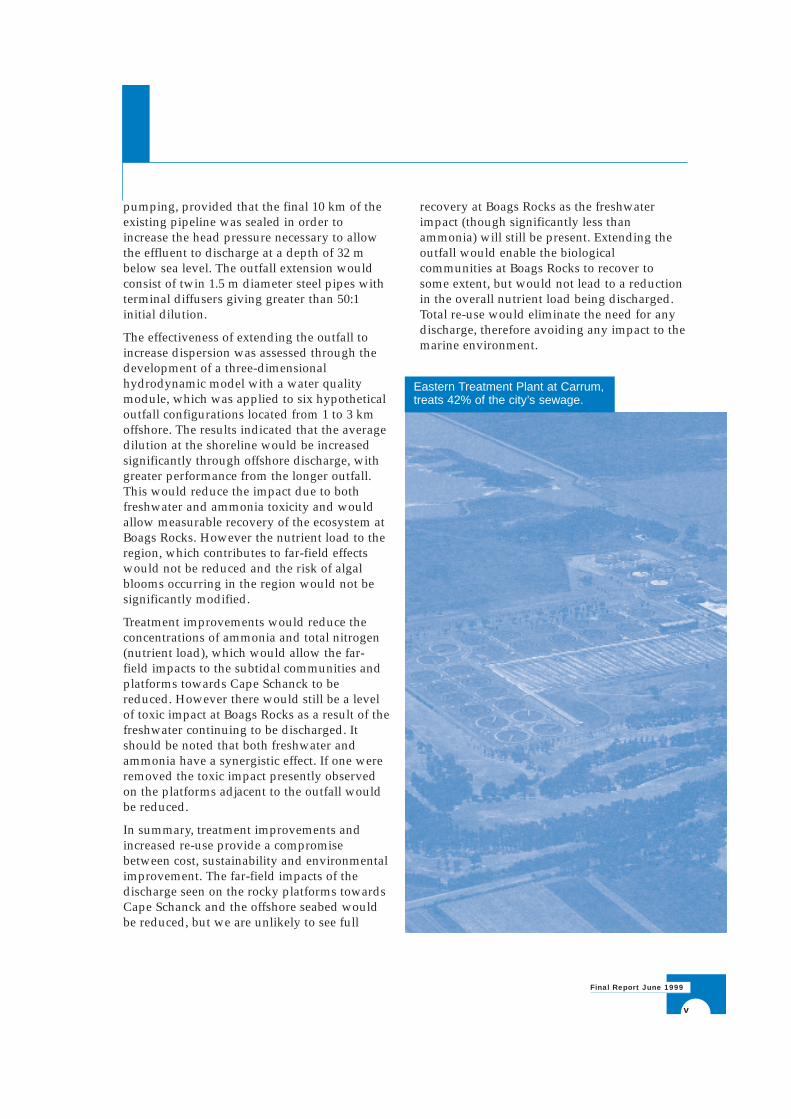
Eastern Treatment Plant at Carrum,treats 42% of the city’s sewage.

ContentsForeword i
Acknowledgments ii
Summary iii
1 INTRODUCTION 1
1.1 The Study Objectives and Approach 11.2 Study Management 11.3 List of Consultants and Researchers 31.4 Community Consultation Process 4
2 BACKGROUND 5
2.1 Eastern Treatment Plant (ETP) 52.2 History 52.3 Eastern Treatment Plant Discharge Licence 8
2.3.1 Discharges to Water 82.3.2 Mixing Zones 102.3.3 Water Quality Indicators and Objectives 11
2.4 Discharge Volume and Quality 122.5 Site Description and Physical Environment 14
2.5.1 Boags Rocks 142.5.2 Winds 142.5.3 Tides 162.5.4 Waves 162.5.5 Currents 16
3 RESEARCH 17
3.1 Biological Monitoring 173.1.1 Intertidal Rocky Platforms 173.1.2 Intertidal Beach Sediments 183.1.3 Subtidal Reefs 223.1.4 Subtidal Infauna 28
3.2 Bioaccumulation 333.3 Toxicity Assessment 373.4 Receiving Water Quality 42
3.4.1 Toxicants 423.4.2 Nutrients 44
3.5 The Hydrodynamic Model 463.6 An Extended Ocean Outfall 483.7 Effluent Flow Reduction (Re-use) Study 513.8 Treatment Improvement Options 553.9 Microbiological Health Risk Assessment 56
4 CONCLUSIONS 57
5 RECOMMENDATIONS 59
6 MONITORING 61
7 GLOSSARY 63
8 REFERENCES 66

1 Introduction
1
Final Report June 1999
Melbourne Water Corporation is licensed bythe Victorian Environment ProtectionAuthority (EPA) to discharge treated effluentfrom its Eastern Treatment Plant into the oceanat Boags Rocks and onto land in specified areasat the plant.
The Licence (EW 367) specifies the conditionsunder which effluent may be discharged andlists the minimum standard that the effluentmust be treated to prior to discharge. It alsospecifies the scope of the monitoring programrequired to demonstrate environmentalperformance.
The Licence (Section 3.7) required MelbourneWater to undertake an investigation andconsultation program to evaluate treatmentmethods, effluent re-use and offshoredischarge in order to improve environmentalperformance.
To fulfill these requirements Melbourne Waterengaged the services of the CSIROEnvironmental Projects Office to manage andconduct an environmental impact assessmentand review of land and marine effluentdisposal options for the Eastern TreatmentPlant. This project is also referred to as theEffluent Management Study for EasternTreatment Plant.
1.1 The Study Objectives andApproach
The objective of the Study was to establishwhat impact the current method of effluentdisposal is having on the environment in thevicinity of Boags Rocks and the adjacentwaters of Bass Strait and what the benefits ofalternative disposal options would be.
The results of the Study will assist with theevaluation of strategic options anddevelopment of an Effluent ManagementStrategy by Melbourne Water for EasternTreatment Plant.
The Study was designed in two stages thatrelated to the two key questions presentingthemselves in the environmental impactassessment. These were:
1) What is the nature and magnitude of theenvironmental effect of the effluent, if any?
2) If an effect exists, how can it best beremoved or adequately mitigated byimprovements in treatment technology,better dispersion offshore or alternativedisposal paths?
The first stage of the Study focused onassessing the environmental impact of theeffluent discharge on the marine environment.It included: biological monitoring,bioaccumulation, toxicity assessment, andtesting of receiving water quality.
In the second stage alternative disposal optionswere assessed. This included a review of flowreduction and effluent re-use opportunities,treatment improvements, and modelling anddesign of various lengths of extended outfall toimprove dispersion.
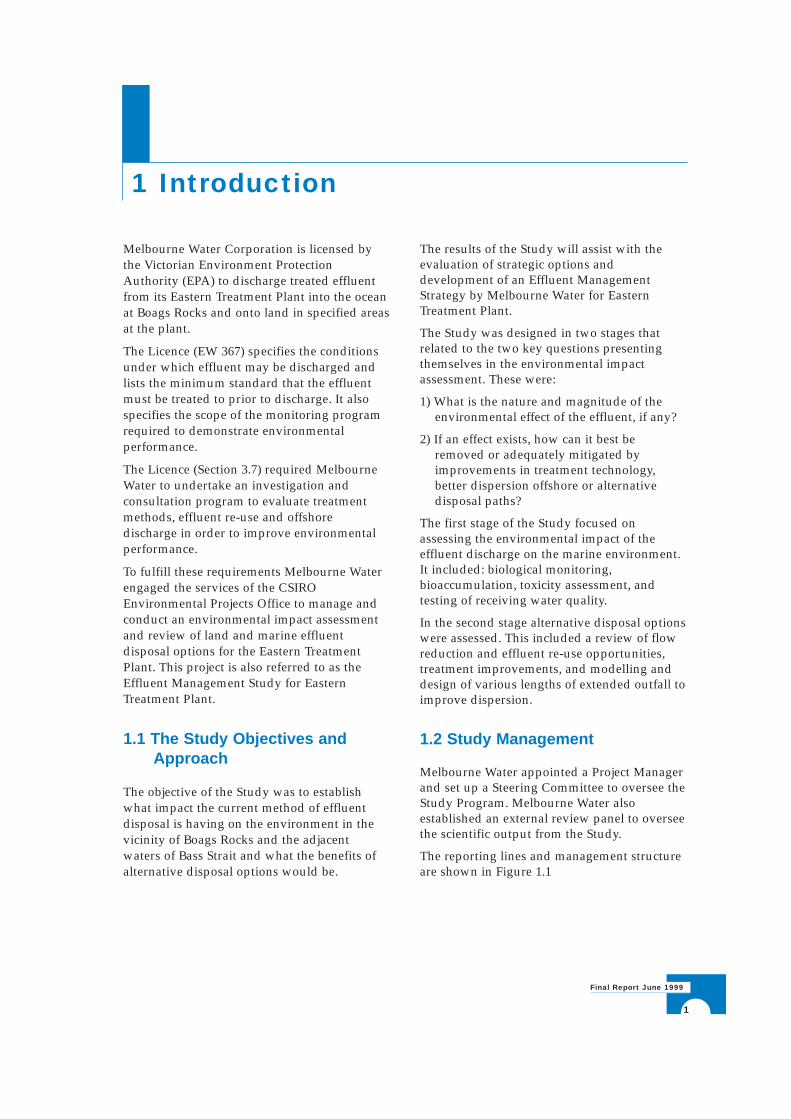
1.2 Study Management
Melbourne Water appointed a Project Managerand set up a Steering Committee to oversee theStudy Program. Melbourne Water alsoestablished an external review panel to overseethe scientific output from the Study.
The reporting lines and management structureare shown in Figure 1.1
2
Environmental Impact Assessment and Review of Effluent Disposal Options for Eastern Treatment Plant
To monitor the individual components of thestudy program, CSIRO set up an internal peerreview panel (Technical Group) whichcomprised scientists from a broadcross section of scientific fields.
They met and corresponded with theresearchers throughout the course of theStudy, to discuss and evaluate the results ofthe research.
Dr Graeme Batley, Centre for Advanced Analytical Chemistry Toxicant chemistryDr David Fox, Mathematical and Information Sciences Environmental statisticsDr Jeanette Gomboso, Land and Water Water resource managementDr John Parslow, Marine Research Water quality and modellingDr Sebastian Rainer, Marine Research Marine biologyDr Jenny Stauber, Centre for Advanced Analytical Chemistry Toxicity testingDr Stephen Walker, Marine Research Hydrodynamic modelling
Members of the CSIRO Technical Group and their area of expertise were:
The external review panel included:
Steering Committee (Melb Water)
M Kozicki Melb Water Project Manager
G Harris 1 D FoxCSIRO Project Director
CSIROTechnical Group
Figure 1.1 Study management structure
B NewellCSIRO Project Adviser
R MolloyCSIRO Project Coordinator
Research Tarsks (Subcontractors)
Community Consultation Program External Review Panel
Dr Des Lord, Des Lord & Assocs. Oceanography and water quality
Dr Ian Law, CH2M Hill consultants, Sydney Treatment, effluent re-use and outfall engineering
Dr Arthur McComb, Murdoch University, WA Biology and water qualityDr Jason Middleton, University of NSW Hydrodynamic modellingDr Nancy Millis, University of Melbourne Toxicity and biology
1 Note: D Fox replaced G Harris as Project Director in Aug 1998.
3
Final Report June 1999
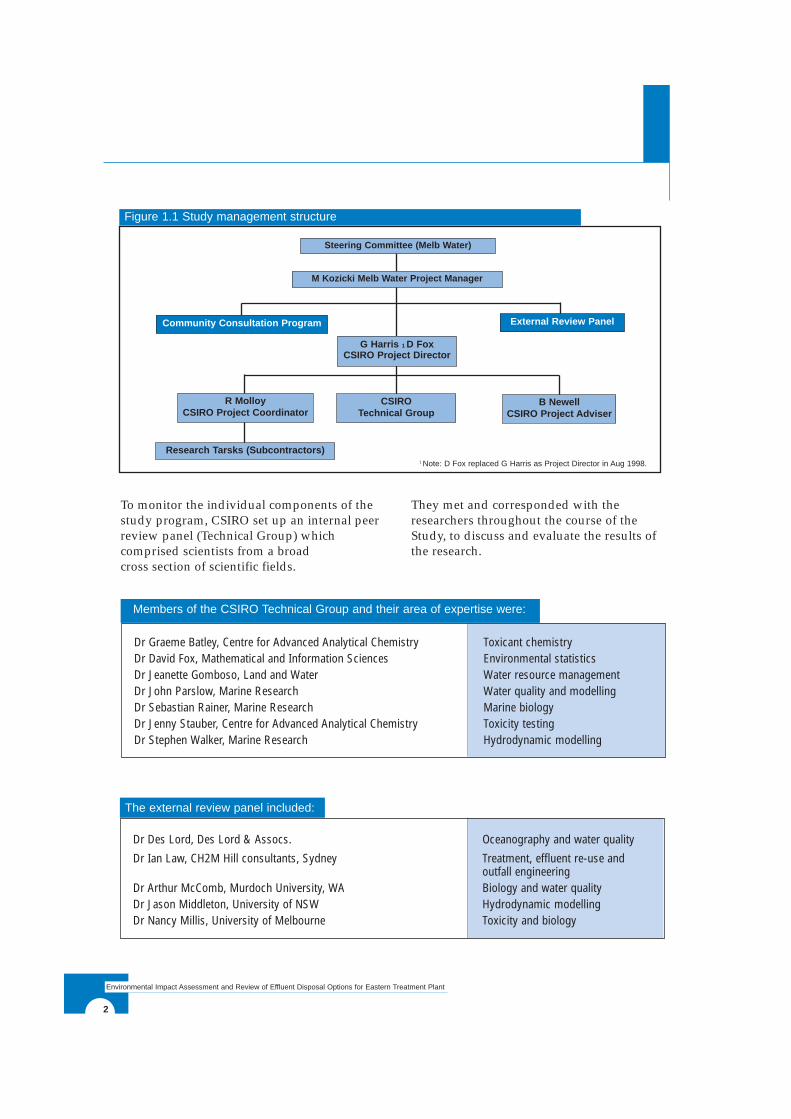
A combination of academic institutes, localconsultants and CSIRO scientists carried out thevarious data collection and research activities forthe Study (Table 1.1).
1.3 List of Consultants and Researchers
Table 1.1 List of study tasks and organisations responsible
Major Contractors
Biological MonitoringBeach infauna feasibility study • Museum of VictoriaSubtidal biological surveys (sandy seabed and reef) • Consulting Environmental Engineers P/LShoreline platforms seasonal algal surveys • Monash University, Biological Sciences
BioaccumulationSeafood contaminant levels • Marine & Freshwater Resources Institute
Toxicity AssessmentToxicity testing of effluent • CSIRO Centre for Advanced Analytical Chemistry
• Marine & Freshwater Resources Institute• RMIT University, Dept of Applied Biology• Victoria University, School of Life Sciences
Hormosira banksii bioassay research • Monash University, Biological Sciences
Toxicity identification evaluation tests • CSIRO Centre for Advanced Analytical Chemistry
Receiving Water QualityUnderway analysis - Nutrients • Marine & Freshwater Resources Institute
Point sampling - Toxicants • Marine & Freshwater Resources Institute
Microbiological health risk assessment • Monash University, Dept of Epidemiology
(managed by Melb Water) and Preventive Medicine
Flow Reduction (Re-Use) Study • CSIRO Land and Water
• Gutterridge, Haskins and Davey P/L
Oceanographic StudiesMeasuring currents • Marine & Freshwater Resources Institute
Monthly profiles (salinity, temperature and dissolved oxygen) • Marine & Freshwater Resources Institute
Measuring winds at Gunnamatta • TTS Systems P/L
Hydrodynamic and water quality modelling • CSIRO Marine Research
Extended outfall design and costing • Consulting Environmental Engineers P/L
Treatment Improvement Review • CMPS&F Environmental P/L
(managed by Melb Water)
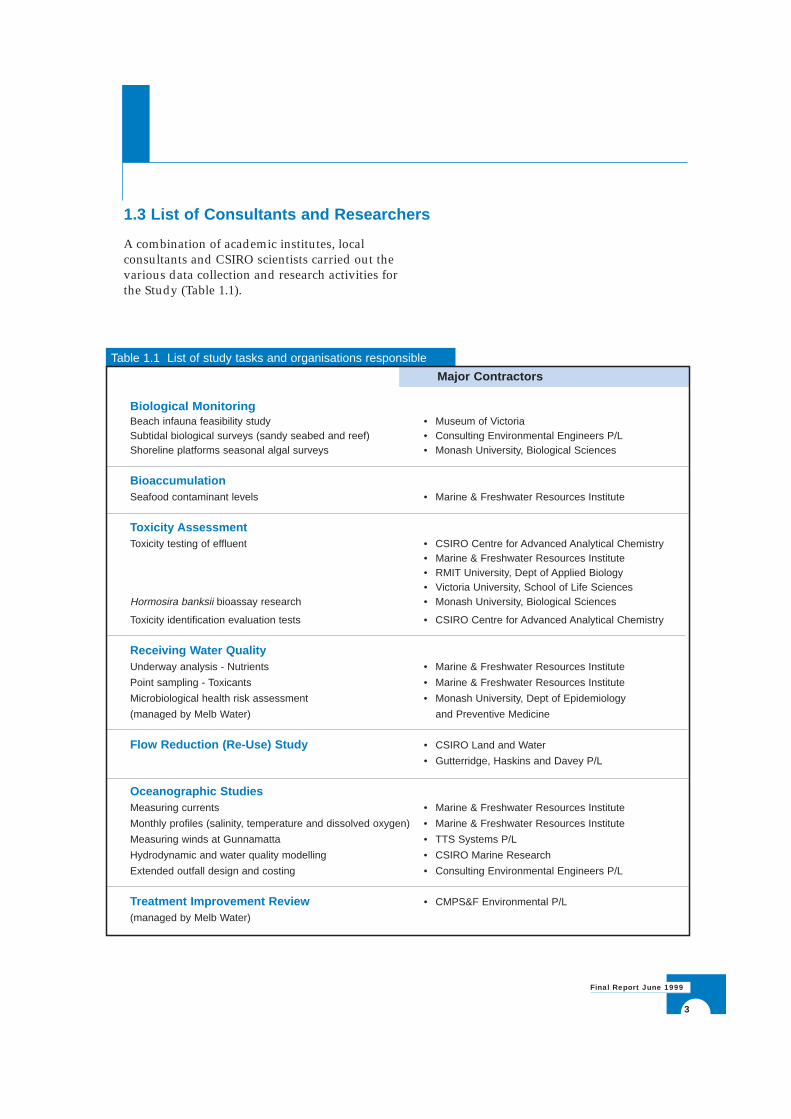
Members of the Reference Groups were provided with tours of ETP
1.4 Community ConsultationProcess
Melbourne Water implemented a communityconsultation program, which providedopportunity for interest groups, environmentalgroups, stakeholders and the widercommunity to have input into the Study and tobe kept regularly informed of the progress andoutcomes of the various tasks beingundertaken. Regular briefings, newsletters,media releases, public displays and a websitewere all part of the extensive consultationprocess.
Some of the issues raised through theconsultation process included:
• The loss of seaweed species from theimmediate area around the outfall.
• The level of toxicity and cumulative effectof the effluent on the flora and fauna of themarine environment.
• Establishing whether the treated effluenthas an impact on human health,particularly surfers who are in the water
considerably longer than other beach users.
• Reducing the volume of effluent beingdisposed of at Boag’s Rock through re-useoptions and community education.
• The long-term objective of eliminatingocean outfalls through alternative methodsof disposal.
• Ensuring the Study tasks and outcomesmeet the environmental objectives set bythe EPA.
• The impact of the Study outcomes on long-term planning issues, particularly as theyrelate to sewerage management and thewater retail companies.
As an outcome of the community consultationprogram, Melbourne Water conducted a seriesof oral history interviews with peopleidentified by the reference groups. Eachinterview was recorded and the transcripts(Melbourne Water 1999) provided to CSIRO forreference.
4
Environmental Impact Assessment and Review of Effluent Disposal Options for Eastern Treatment Plant
2 Background
5
Final Report June 1999
2.1 Eastern Treatment Plant (ETP)
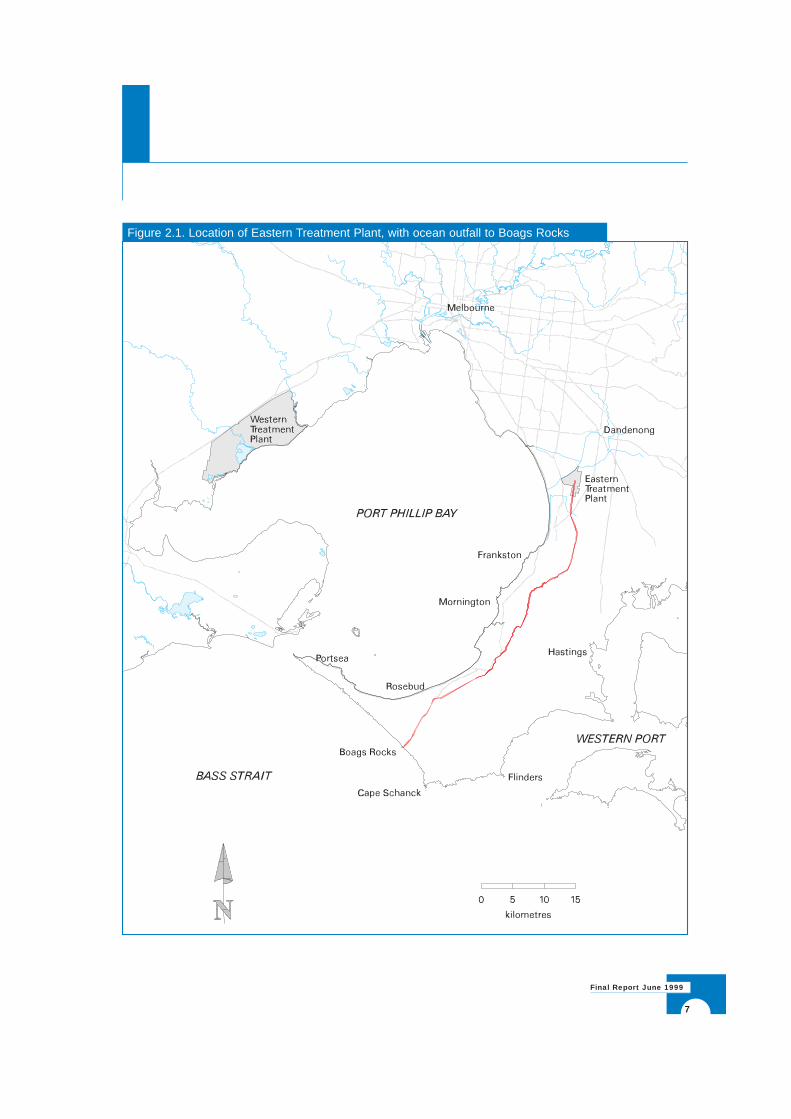
Melbourne Water is responsible for thetransfer, treatment and disposal of sewagesupplied by Melbourne’s retail waterbusinesses - City West Water, South East Waterand Yarra Valley Water. Eastern TreatmentPlant (ETP), which is owned and operated byMelbourne Water, treats and disposes of flowfrom two of these businesses (South East Waterand Yarra Valley Water).
ETP is situated on a 1000 hectare site atCarrum (Fig 2.1). It treats about 42% ofMelbourne’s sewage. The average flow isabout 370 megalitres per day (ML/day), and isdelivered by the South-Eastern, Chelsea-Frankston and Dandenong Valley TrunkSewers.
The activated sludge treatment plant producesa secondary treated effluent, which is thenchlorinated prior to discharge. The treatedeffluent is transferred via an outfall pumpingstation through a ten kilometre rising main tothe gravity-fed South Eastern Outfall. Theoutfall discharges to Bass Strait at Boags Rocksnear Cape Schanck, 56 km from the Plant. The2.75m diameter outfall pipe terminates in aconcrete discharge structure below the low tidemark.
About 20 ML/day is added to the outfall fromthree local treatment plants (Mornington 12ML/day, Rosebud 6 ML/day, and Hastings 2ML/day) which are operated by South EastWater. Each of these plants operates underseparate EPA licences.
2.2 History
The following history has been compiled usingthe book by Tony Dingle and CarolynRasmussen, “Vital Connections”, whichcovered the history of the Melbourne andMetropolitan Board of Works (1891 - 1991).
In 1891 the Melbourne and Metropolitan Boardof Works was formed. Its charter was to builda sewerage system and take over operation ofthe water supply system. Funding for the newBoard was provided through rates levied onproperty owners.
The new Board was presented with a seweragesystem designed by an English consultant,James Mansergh. He recommended twosewage treatment farms be established atMordialloc and Werribee. An alternative wasan ocean outfall to Cape Schanck.
In 1892, work commenced on designing andconstructing a network of gravity fed sewersthat would service the inner ring of Melbounesuburbs. The Board had opted for a single farmat Werribee (now known as the WesternTreatment Plant), with a pumping station atSpotswood.
By the 1950s Melbourne had continued todevelop its urban sprawl. The number ofunsewered properties continued to increaseand the sewerage system struggled to copewith wet weather flows. Five alternatives werepresented to the Board; a secondary treatmentplant at Carrum with an outfall to Port PhillipBay, Western Port or Bass Strait; an outfallsewer to Bass Strait without treatment; and aprimary treatment plant at Carrum withdischarge to Western Port via a pondagesystem.
As part of the evaluation of a discharge to BassStrait, the Board commissioned a study ofocean currents in the area. During 1953-54radar was used to track floats released offshorefrom Boags Rocks. There had been aperception that the tides would take thesewage back into Port Phillip Bay, but thestudies showed the predominant currentsflowed to the east. Also as part of theinvestigation, Board surveyors did a levellingrun from Boags Rocks to Keysborough.However the construction of the outfall wasconsidered too costly, given the shortage of
6
Environmental Impact Assessment and Review of Effluent Disposal Options for Eastern Treatment Plant
finances. Instead the capacity of the existingsystem was increased.
In 1963 there were 117,000 unsewered housesin the metropolitan area; 38,000 of them reliedon septic tanks, while the remainder used thepan system. This inadequate situation had ledto the gross pollution of metropolitan drainsand creeks. Melbourne’s residential expansionwas being concentrated in the east andsoutheast, and it was becoming increasinglydifficult to connect these areas to Werribee.
The Board decided in 1964 to build a majorsewerage treatment plant at Carrum. Effluentdisposal was to be either by an outfall pipelineinto Port Phillip Bay (discharging 2km offshorefrom Carrum Beach) or to Boags Rocks. Thelatter option though twice the price was thepreferred option, however by 1967 thecontinued financial uncertainty and thegrowing sewerage backlog forced a re-appraisal of the alternative discharge to PortPhillip Bay.
The impact to Port Phillip Bay of the increaseddischarge of effluent with a high nutrient loadwas unknown. This prompted the 1968-71Phase One Environmental Study of Port PhillipBay, for which the Board provided substantialfunding. However, before the study wascompleted, key unions threatened to black banthe scheme if effluent went to the Bay and withan election looming, the State Governmentvetoed the scheme. The more expensive oceanoutfall was to be funded by an increase inrates. Design work for the outfall wasrecommenced and the Board purchased theland abutting the foreshore reserve at BoagsRocks in July 1971.
The Eastern Treatment Plant (then known asthe South Eastern Purification Plant) wascommissioned on 19 September, 1975, and wasthe centrepiece of the entire $204 millionsewerage system upgrade. It also included the33 km South Eastern Trunk Sewer carryingsewage by gravity from Kew to Carrum;intercepting sewers diverting waste fromexisting main sewers into the trunk and theoutfall to Bass Strait.
Apart from providing many areas in the outersoutheastern suburbs with urgently neededsewerage facilities, the new system gavetemporary respite to the Western TreatmentPlant. It allowed flows from variousoverloaded sewers in Brighton, Caulfield,Moorabbin, Oakleigh and Sandringham to bediverted. It also relieved the load on theBraeside Purification Plant, which wasultimately phased out of operation.
Construction of the sewers and the outfallpipeline were mammoth tasks involving theuse of tunnelling machines through rock andsoft ground. The most challenging part ofconstructing the ocean outfall was at BoagsRocks, where pipes had to be laid underwater,and there were risks associated with theunpredictable behaviour of the surf.
With the aid of compressed air, a tunnel wasdriven beneath the shoreline cliffs and belowsea level. The 2.75 m steel pipeline wasassembled on rails within the tunnel, whichwas then flooded. At the same time, using apreviously constructed jetty as a workplatform, a submarine trench was dredgedthrough the surf zone. Before excavation, pileswere driven along both sides of the full lengthof the proposed trench. Sheet piling was thendriven between the piles until both sides andthe seaward end were closed in. A deck sectionwas placed on top of the piles to allow anexcavator to operate. After excavation, the railswere extended from the tunnel to the end ofthe trench and the final section of the outfallpipeline was secured and the trench backfilledwith mass concrete topped with largeboulders. The work platform and otherconstruction equipment were removed.
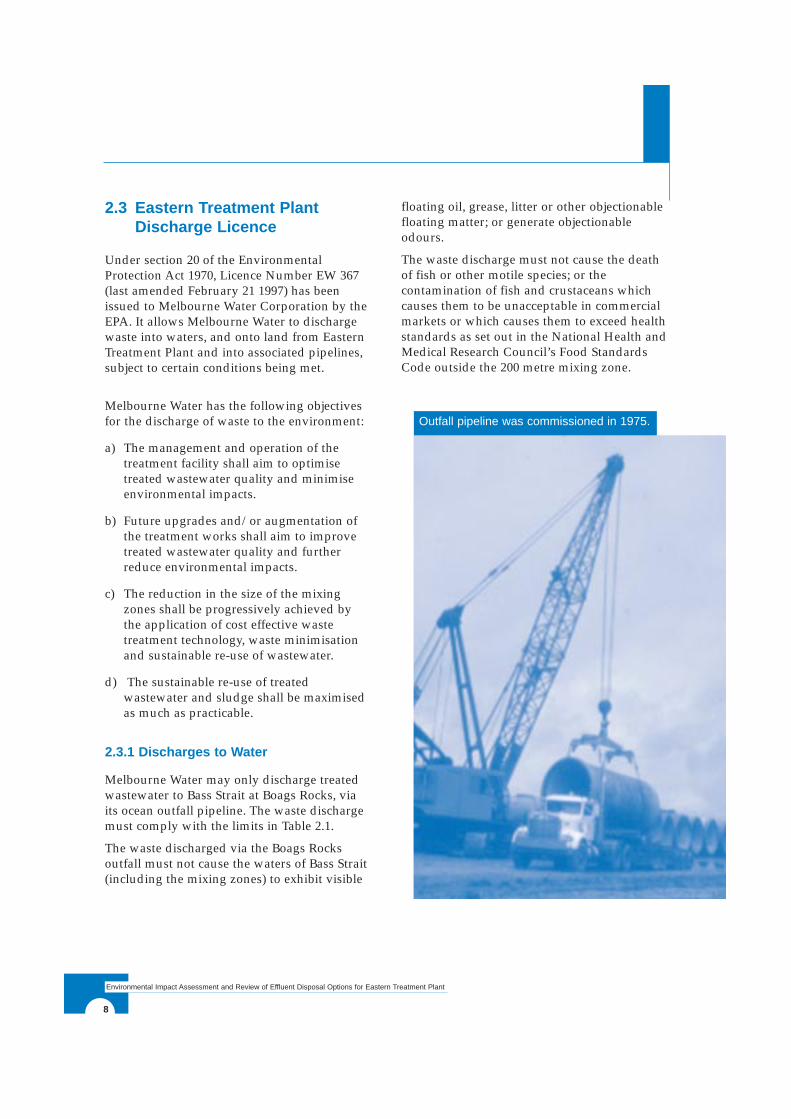
Effluent discharge commenced in 1975, underlicence from the EPA. Since then, MelbourneWater has carried out various monitoring ofthe effluent-receiving environment as part ofthose licence requirements
7
Final Report June 1999
Figure 2.1. Location of Eastern Treatment Plant, with ocean outfall to Boags Rocks
8
Environmental Impact Assessment and Review of Effluent Disposal Options for Eastern Treatment Plant
2.3 Eastern Treatment PlantDischarge Licence
Under section 20 of the EnvironmentalProtection Act 1970, Licence Number EW 367(last amended February 21 1997) has beenissued to Melbourne Water Corporation by theEPA. It allows Melbourne Water to dischargewaste into waters, and onto land from EasternTreatment Plant and into associated pipelines,subject to certain conditions being met.
Melbourne Water has the following objectivesfor the discharge of waste to the environment:
a) The management and operation of thetreatment facility shall aim to optimisetreated wastewater quality and minimiseenvironmental impacts.
b) Future upgrades and/or augmentation ofthe treatment works shall aim to improvetreated wastewater quality and furtherreduce environmental impacts.
c) The reduction in the size of the mixingzones shall be progressively achieved bythe application of cost effective wastetreatment technology, waste minimisationand sustainable re-use of wastewater.
d) The sustainable re-use of treatedwastewater and sludge shall be maximisedas much as practicable.
2.3.1 Discharges to Water
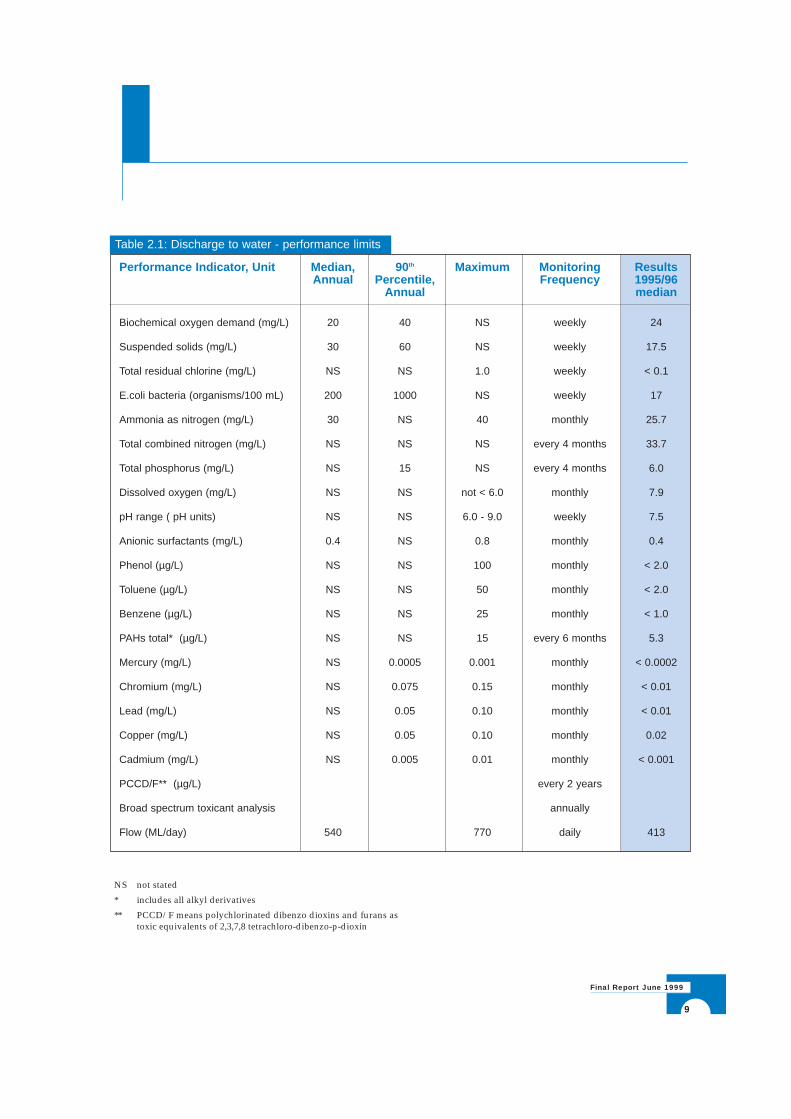
Melbourne Water may only discharge treatedwastewater to Bass Strait at Boags Rocks, viaits ocean outfall pipeline. The waste dischargemust comply with the limits in Table 2.1.
The waste discharged via the Boags Rocksoutfall must not cause the waters of Bass Strait(including the mixing zones) to exhibit visible
floating oil, grease, litter or other objectionablefloating matter; or generate objectionableodours.
The waste discharge must not cause the deathof fish or other motile species; or thecontamination of fish and crustaceans whichcauses them to be unacceptable in commercialmarkets or which causes them to exceed healthstandards as set out in the National Health andMedical Research Council’s Food StandardsCode outside the 200 metre mixing zone.
Outfall pipeline was commissioned in 1975.
9
Final Report June 1999
Table 2.1: Discharge to water - performance limits
Performance Indicator, Unit Median, 90 th Maximum Monitoring Results Annual Percentile, Frequency 1995/96
Annual median
Biochemical oxygen demand (mg/L) 20 40 NS weekly 24
Suspended solids (mg/L) 30 60 NS weekly 17.5
Total residual chlorine (mg/L) NS NS 1.0 weekly < 0.1
E.coli bacteria (organisms/100 mL) 200 1000 NS weekly 17
Ammonia as nitrogen (mg/L) 30 NS 40 monthly 25.7
Total combined nitrogen (mg/L) NS NS NS every 4 months 33.7
Total phosphorus (mg/L) NS 15 NS every 4 months 6.0
Dissolved oxygen (mg/L) NS NS not < 6.0 monthly 7.9
pH range ( pH units) NS NS 6.0 - 9.0 weekly 7.5
Anionic surfactants (mg/L) 0.4 NS 0.8 monthly 0.4
Phenol (µg/L) NS NS 100 monthly < 2.0
Toluene (µg/L) NS NS 50 monthly < 2.0
Benzene (µg/L) NS NS 25 monthly < 1.0
PAHs total* (µg/L) NS NS 15 every 6 months 5.3
Mercury (mg/L) NS 0.0005 0.001 monthly < 0.0002
Chromium (mg/L) NS 0.075 0.15 monthly < 0.01
Lead (mg/L) NS 0.05 0.10 monthly < 0.01
Copper (mg/L) NS 0.05 0.10 monthly 0.02
Cadmium (mg/L) NS 0.005 0.01 monthly < 0.001
PCCD/F** (µg/L) every 2 years
Broad spectrum toxicant analysis annually
Flow (ML/day) 540 770 daily 413
NS not stated
* includes all alkyl derivatives
** PCCD/F means polychlorinated dibenzo dioxins and furans as toxic equivalents of 2,3,7,8 tetrachloro-dibenzo-p-dioxin
10
Environmental Impact Assessment and Review of Effluent Disposal Options for Eastern Treatment Plant
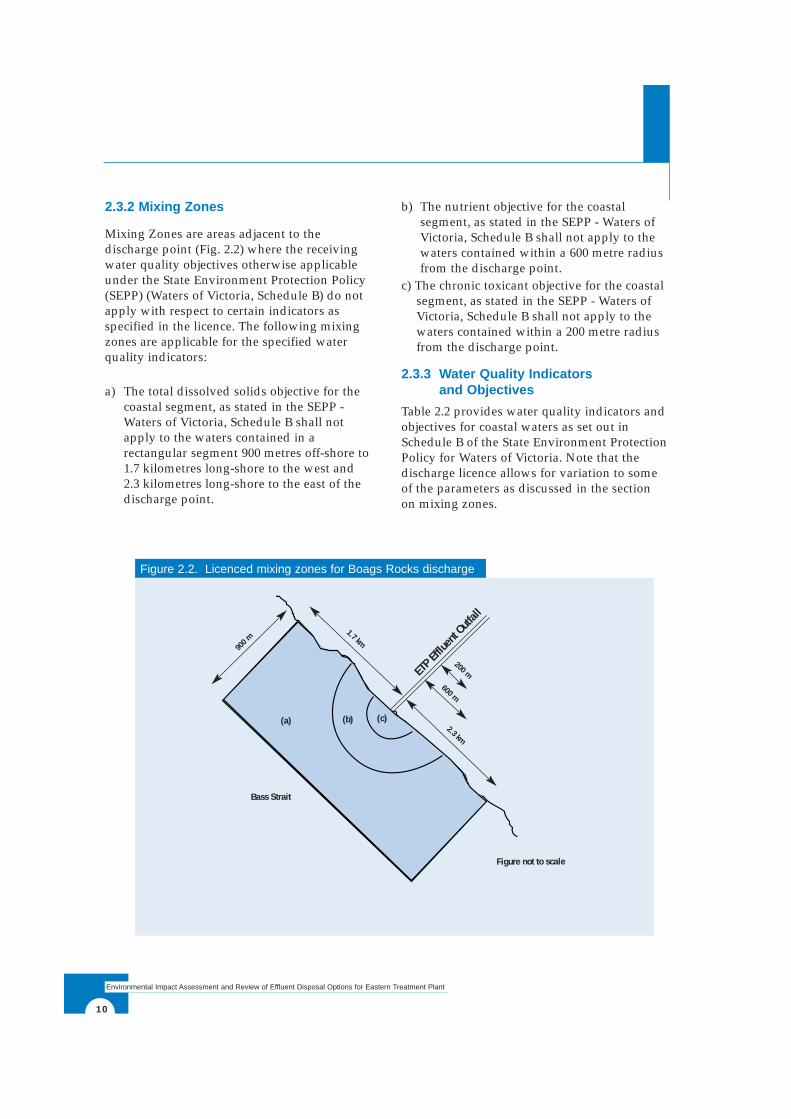
2.3.2 Mixing Zones
Mixing Zones are areas adjacent to thedischarge point (Fig. 2.2) where the receivingwater quality objectives otherwise applicableunder the State Environment Protection Policy(SEPP) (Waters of Victoria, Schedule B) do notapply with respect to certain indicators asspecified in the licence. The following mixingzones are applicable for the specified waterquality indicators:
a) The total dissolved solids objective for thecoastal segment, as stated in the SEPP -Waters of Victoria, Schedule B shall notapply to the waters contained in arectangular segment 900 metres off-shore to1.7 kilometres long-shore to the west and2.3 kilometres long-shore to the east of thedischarge point.
b) The nutrient objective for the coastalsegment, as stated in the SEPP - Waters ofVictoria, Schedule B shall not apply to thewaters contained within a 600 metre radiusfrom the discharge point.
c) The chronic toxicant objective for the coastalsegment, as stated in the SEPP - Waters ofVictoria, Schedule B shall not apply to thewaters contained within a 200 metre radiusfrom the discharge point.
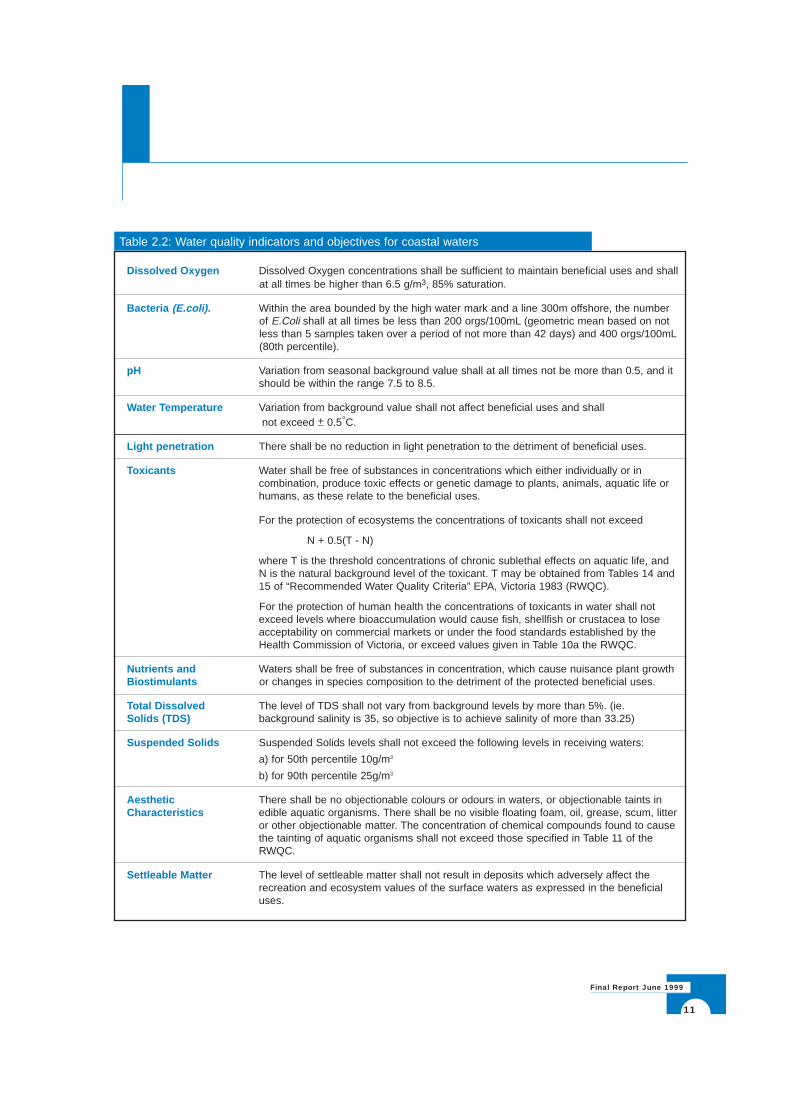
2.3.3 Water Quality Indicators and Objectives
Table 2.2 provides water quality indicators andobjectives for coastal waters as set out inSchedule B of the State Environment ProtectionPolicy for Waters of Victoria. Note that thedischarge licence allows for variation to someof the parameters as discussed in the sectionon mixing zones.
Figure 2.2. Licenced mixing zones for Boags Rocks discharge
ETP Ef
fluen
t Outf
all
Figure not to scale
Bass Strait
(a) (b) (c)
200 m
600 m
2.3 km
1.7 km90
0 m
11
Final Report June 1999
Dissolved Oxygen Dissolved Oxygen concentrations shall be sufficient to maintain beneficial uses and shallat all times be higher than 6.5 g/m3, 85% saturation.
Bacteria (E.coli). Within the area bounded by the high water mark and a line 300m offshore, the number of E.Coli shall at all times be less than 200 orgs/100mL (geometric mean based on not less than 5 samples taken over a period of not more than 42 days) and 400 orgs/100mL(80th percentile).
pH Variation from seasonal background value shall at all times not be more than 0.5, and it should be within the range 7.5 to 8.5.
Water Temperature Variation from background value shall not affect beneficial uses and shallnot exceed + 0.5°C.
Light penetration There shall be no reduction in light penetration to the detriment of beneficial uses.
Toxicants Water shall be free of substances in concentrations which either individually or in combination, produce toxic effects or genetic damage to plants, animals, aquatic life or humans, as these relate to the beneficial uses.
For the protection of ecosystems the concentrations of toxicants shall not exceed
N + 0.5(T - N)
where T is the threshold concentrations of chronic sublethal effects on aquatic life, and N is the natural background level of the toxicant. T may be obtained from Tables 14 and 15 of “Recommended Water Quality Criteria” EPA, Victoria 1983 (RWQC).
For the protection of human health the concentrations of toxicants in water shall not exceed levels where bioaccumulation would cause fish, shellfish or crustacea to lose acceptability on commercial markets or under the food standards established by the Health Commission of Victoria, or exceed values given in Table 10a the RWQC.
Nutrients and Waters shall be free of substances in concentration, which cause nuisance plant growth Biostimulants or changes in species composition to the detriment of the protected beneficial uses.
Total Dissolved The level of TDS shall not vary from background levels by more than 5%. (ie. Solids (TDS) background salinity is 35, so objective is to achieve salinity of more than 33.25)
Suspended Solids Suspended Solids levels shall not exceed the following levels in receiving waters:
a) for 50th percentile 10g/m3
b) for 90th percentile 25g/m3
Aesthetic There shall be no objectionable colours or odours in waters, or objectionable taints in Characteristics edible aquatic organisms. There shall be no visible floating foam, oil, grease, scum, litter
or other objectionable matter. The concentration of chemical compounds found to cause the tainting of aquatic organisms shall not exceed those specified in Table 11 of the RWQC.
Settleable Matter The level of settleable matter shall not result in deposits which adversely affect the recreation and ecosystem values of the surface waters as expressed in the beneficial uses.
Table 2.2: Water quality indicators and objectives for coastal waters
12
Environmental Impact Assessment and Review of Effluent Disposal Options for Eastern Treatment Plant
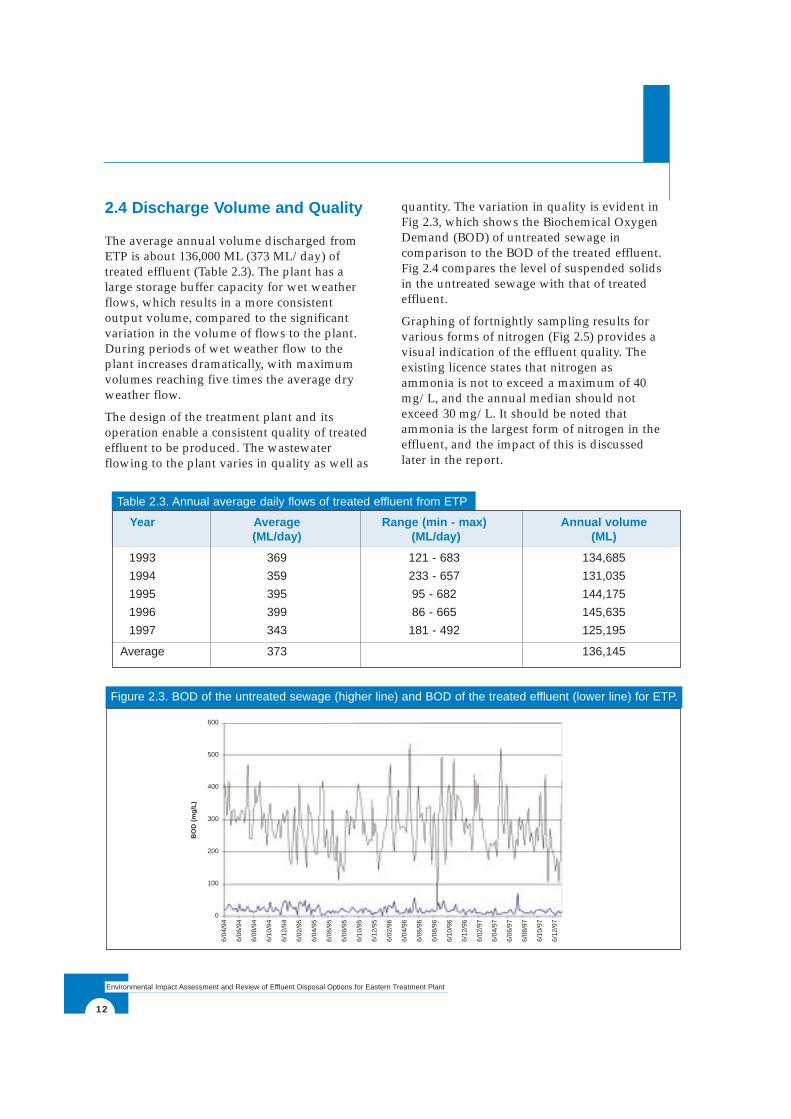
2.4 Discharge Volume and Quality
The average annual volume discharged fromETP is about 136,000 ML (373 ML/day) oftreated effluent (Table 2.3). The plant has alarge storage buffer capacity for wet weatherflows, which results in a more consistentoutput volume, compared to the significantvariation in the volume of flows to the plant.During periods of wet weather flow to theplant increases dramatically, with maximumvolumes reaching five times the average dryweather flow.
The design of the treatment plant and itsoperation enable a consistent quality of treatedeffluent to be produced. The wastewaterflowing to the plant varies in quality as well as
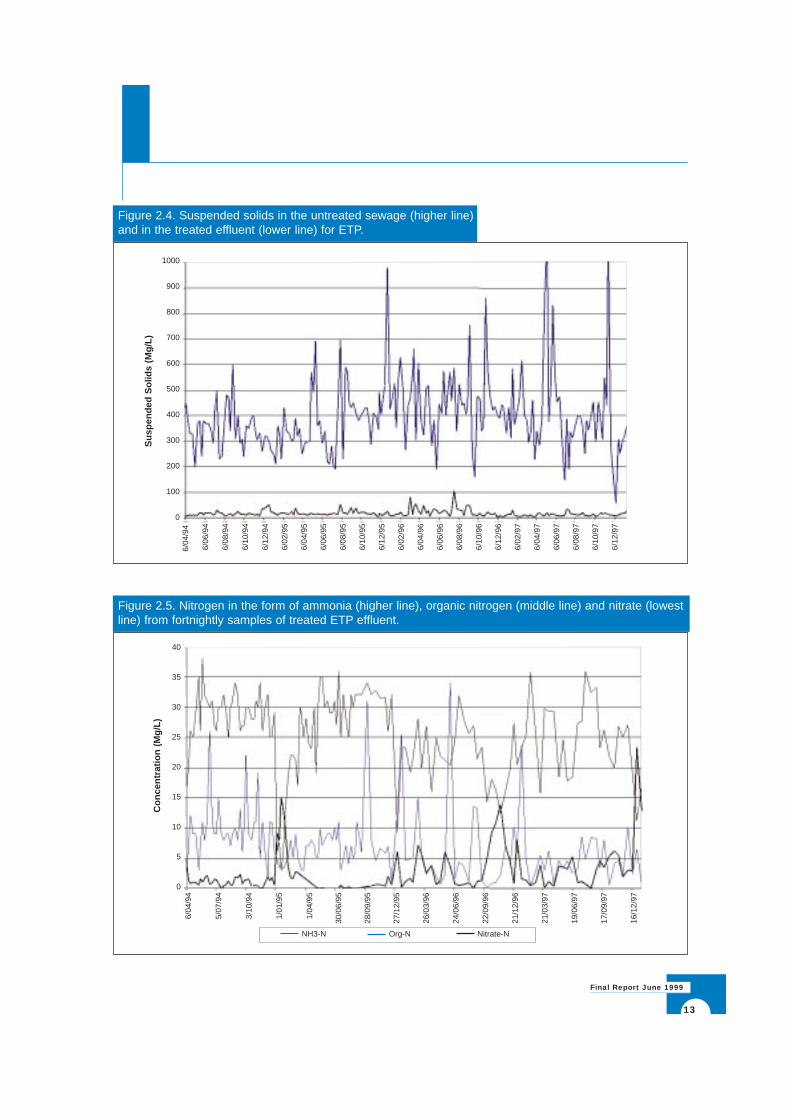
quantity. The variation in quality is evident inFig 2.3, which shows the Biochemical OxygenDemand (BOD) of untreated sewage incomparison to the BOD of the treated effluent.Fig 2.4 compares the level of suspended solidsin the untreated sewage with that of treatedeffluent.
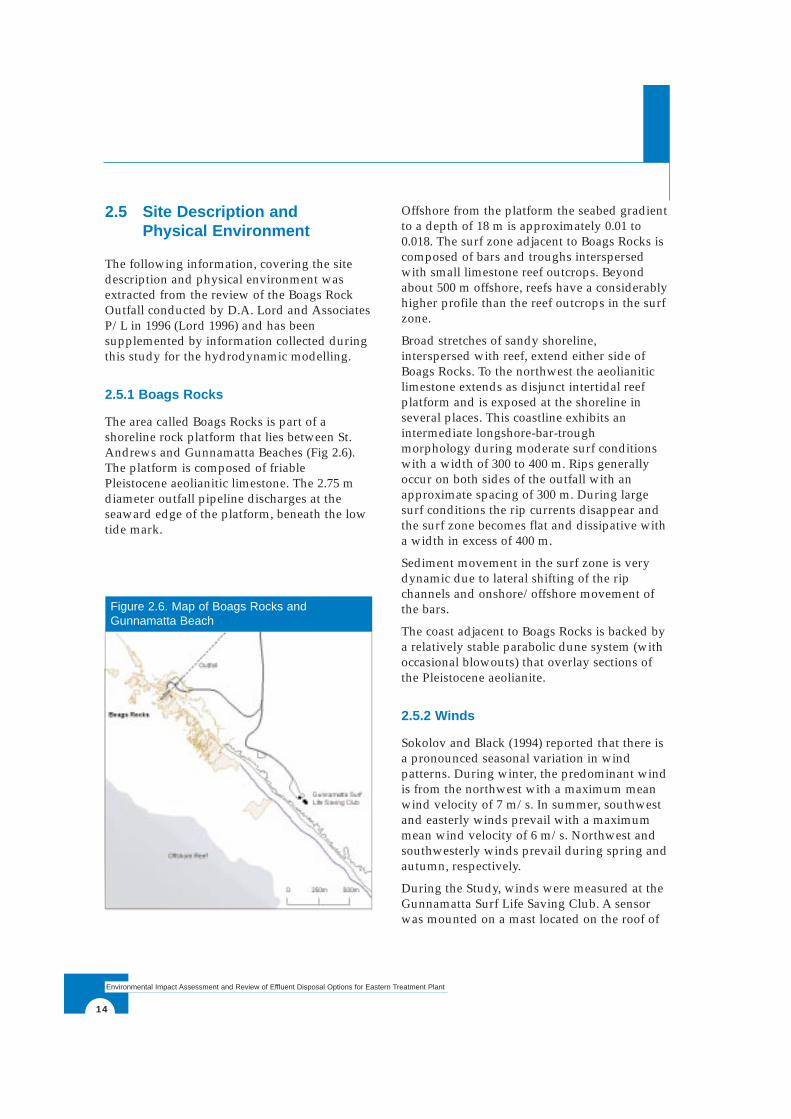
Graphing of fortnightly sampling results forvarious forms of nitrogen (Fig 2.5) provides avisual indication of the effluent quality. Theexisting licence states that nitrogen asammonia is not to exceed a maximum of 40mg/L, and the annual median should notexceed 30 mg/L. It should be noted thatammonia is the largest form of nitrogen in theeffluent, and the impact of this is discussedlater in the report.
Table 2.3. Annual average daily flows of treated effluent from ETP
Year Average Range (min - max) Annual volume (ML/day) (ML/day) (ML)
1993 369 121 - 683 134,685
1994 359 233 - 657 131,035
1995 395 95 - 682 144,175
1996 399 86 - 665 145,635
1997 343 181 - 492 125,195
Average 373 136,145
Figure 2.3. BOD of the untreated sewage (higher line) and BOD of the treated effluent (lower line) for ETP.
6/04
/94
6/06
/94
6/08
/94
6/10
/94
6/12
/94
6/02
/95
6/04
/95
6/06
/95
6/08
/95
6/10
/95
6/12
/95
6/02
/96
6/04
/96
6/06
/96
6/08
/96
6/10
/96
6/12
/96
6/02
/97
6/04
/97
6/06
/97
6/08
/97
6/10
/97
6/12
/97
BO
D (
mg/
L)
600
500
400
300
200
100
0
13
Final Report June 1999
Figure 2.4. Suspended solids in the untreated sewage (higher line)and in the treated effluent (lower line) for ETP.
Figure 2.5. Nitrogen in the form of ammonia (higher line), organic nitrogen (middle line) and nitrate (lowestline) from fortnightly samples of treated ETP effluent.
6/04
/94
6/06
/94
6/08
/94
6/10
/94
6/12
/94
6/02
/95
6/04
/95
6/06
/95
6/08
/95
6/10
/95
6/12
/95
6/02
/96
6/04
/96
6/06
/96
6/08
/96
6/10
/96
6/12
/96
6/02
/97
6/04
/97
6/06
/97
6/08
/97
6/10
/97
6/12
/97
6/04
/94
5/07
/94
3/10
/94
1/01
/95
1/04
/95
30/0
6/95
28/0
9/95
27/1
2/95
26/0
3/96
24/0
6/96
22/0
9/96
21/1
2/96
21/0
3/97
19/0
6/97
17/0
9/97
16/1
2/97
1000
900
800
700
600
500
400
300
200
100
0
Sus
pend
ed S
olid
s (M
g/L)
Con
cent
ratio
n (M
g/L)
40
35
30
25
20
15
10
5
0
NH3-N Org-N Nitrate-N
14
Environmental Impact Assessment and Review of Effluent Disposal Options for Eastern Treatment Plant
2.5 Site Description and Physical Environment
The following information, covering the sitedescription and physical environment wasextracted from the review of the Boags RockOutfall conducted by D.A. Lord and AssociatesP/L in 1996 (Lord 1996) and has beensupplemented by information collected duringthis study for the hydrodynamic modelling.
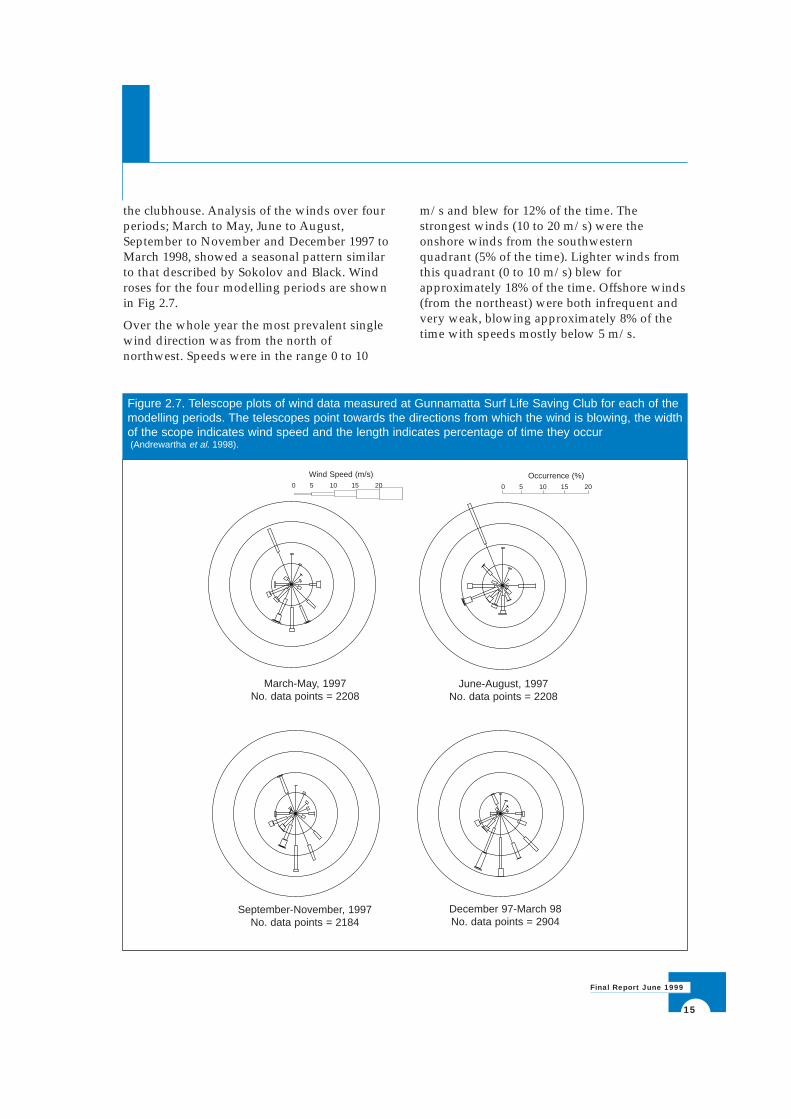
2.5.1 Boags Rocks
The area called Boags Rocks is part of ashoreline rock platform that lies between St.Andrews and Gunnamatta Beaches (Fig 2.6).The platform is composed of friablePleistocene aeolianitic limestone. The 2.75 mdiameter outfall pipeline discharges at theseaward edge of the platform, beneath the lowtide mark.
Offshore from the platform the seabed gradientto a depth of 18 m is approximately 0.01 to0.018. The surf zone adjacent to Boags Rocks iscomposed of bars and troughs interspersedwith small limestone reef outcrops. Beyondabout 500 m offshore, reefs have a considerablyhigher profile than the reef outcrops in the surfzone.
Broad stretches of sandy shoreline,interspersed with reef, extend either side ofBoags Rocks. To the northwest the aeolianiticlimestone extends as disjunct intertidal reefplatform and is exposed at the shoreline inseveral places. This coastline exhibits anintermediate longshore-bar-troughmorphology during moderate surf conditionswith a width of 300 to 400 m. Rips generallyoccur on both sides of the outfall with anapproximate spacing of 300 m. During largesurf conditions the rip currents disappear andthe surf zone becomes flat and dissipative witha width in excess of 400 m.
Sediment movement in the surf zone is verydynamic due to lateral shifting of the ripchannels and onshore/offshore movement ofthe bars.
The coast adjacent to Boags Rocks is backed bya relatively stable parabolic dune system (withoccasional blowouts) that overlay sections ofthe Pleistocene aeolianite.
2.5.2 Winds
Sokolov and Black (1994) reported that there isa pronounced seasonal variation in windpatterns. During winter, the predominant windis from the northwest with a maximum meanwind velocity of 7 m/s. In summer, southwestand easterly winds prevail with a maximummean wind velocity of 6 m/s. Northwest andsouthwesterly winds prevail during spring andautumn, respectively.
During the Study, winds were measured at theGunnamatta Surf Life Saving Club. A sensorwas mounted on a mast located on the roof of
Figure 2.6. Map of Boags Rocks andGunnamatta Beach
15
Final Report June 1999
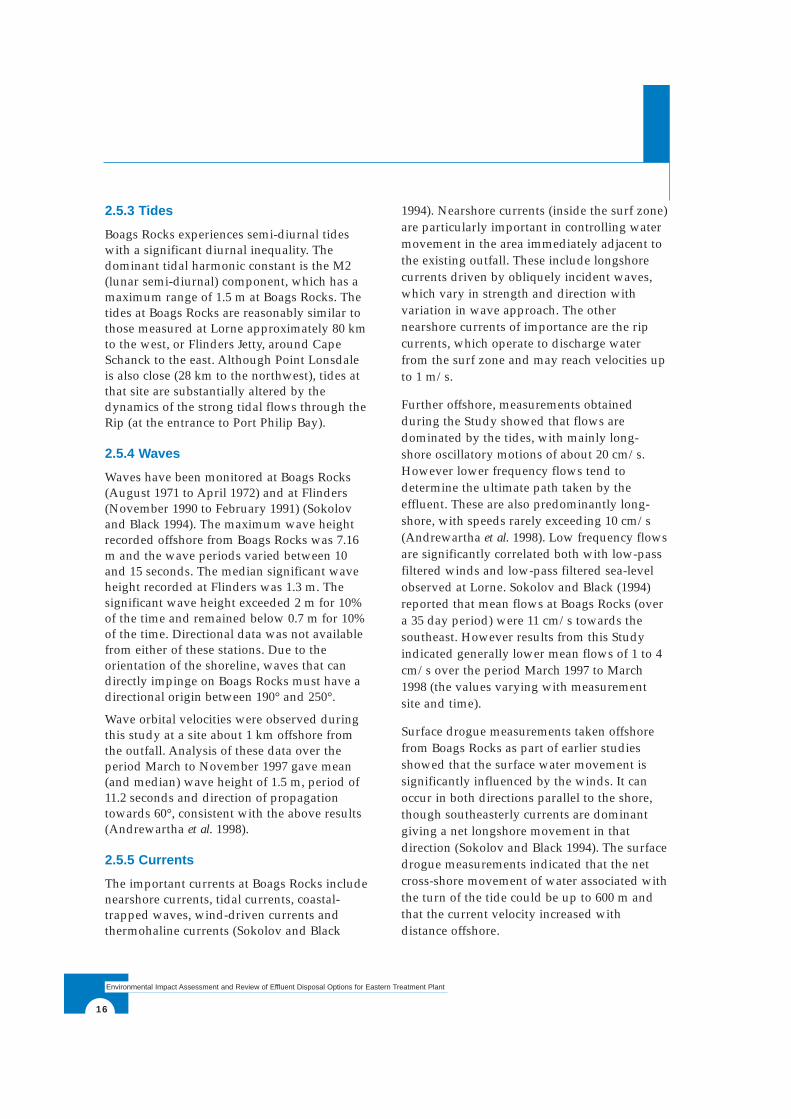
the clubhouse. Analysis of the winds over fourperiods; March to May, June to August,September to November and December 1997 toMarch 1998, showed a seasonal pattern similarto that described by Sokolov and Black. Windroses for the four modelling periods are shownin Fig 2.7.
Over the whole year the most prevalent singlewind direction was from the north ofnorthwest. Speeds were in the range 0 to 10
m/s and blew for 12% of the time. Thestrongest winds (10 to 20 m/s) were theonshore winds from the southwesternquadrant (5% of the time). Lighter winds fromthis quadrant (0 to 10 m/s) blew forapproximately 18% of the time. Offshore winds(from the northeast) were both infrequent andvery weak, blowing approximately 8% of thetime with speeds mostly below 5 m/s.
Figure 2.7. Telescope plots of wind data measured at Gunnamatta Surf Life Saving Club for each of themodelling periods. The telescopes point towards the directions from which the wind is blowing, the widthof the scope indicates wind speed and the length indicates percentage of time they occur(Andrewartha et al. 1998).
March-May, 1997No. data points = 2208
June-August, 1997No. data points = 2208
December 97-March 98No. data points = 2904
September-November, 1997No. data points = 2184
Wind Speed (m/s)0 5 10 15 20
Occurrence (%)0 5 10 15 20
16
Environmental Impact Assessment and Review of Effluent Disposal Options for Eastern Treatment Plant
2.5.3 Tides
Boags Rocks experiences semi-diurnal tideswith a significant diurnal inequality. Thedominant tidal harmonic constant is the M2(lunar semi-diurnal) component, which has amaximum range of 1.5 m at Boags Rocks. Thetides at Boags Rocks are reasonably similar tothose measured at Lorne approximately 80 kmto the west, or Flinders Jetty, around CapeSchanck to the east. Although Point Lonsdaleis also close (28 km to the northwest), tides atthat site are substantially altered by thedynamics of the strong tidal flows through theRip (at the entrance to Port Philip Bay).
2.5.4 Waves
Waves have been monitored at Boags Rocks(August 1971 to April 1972) and at Flinders(November 1990 to February 1991) (Sokolovand Black 1994). The maximum wave heightrecorded offshore from Boags Rocks was 7.16m and the wave periods varied between 10and 15 seconds. The median significant waveheight recorded at Flinders was 1.3 m. Thesignificant wave height exceeded 2 m for 10%of the time and remained below 0.7 m for 10%of the time. Directional data was not availablefrom either of these stations. Due to theorientation of the shoreline, waves that candirectly impinge on Boags Rocks must have adirectional origin between 190° and 250°.
Wave orbital velocities were observed duringthis study at a site about 1 km offshore fromthe outfall. Analysis of these data over theperiod March to November 1997 gave mean(and median) wave height of 1.5 m, period of11.2 seconds and direction of propagationtowards 60°, consistent with the above results(Andrewartha et al. 1998).
2.5.5 Currents
The important currents at Boags Rocks includenearshore currents, tidal currents, coastal-trapped waves, wind-driven currents andthermohaline currents (Sokolov and Black
1994). Nearshore currents (inside the surf zone)are particularly important in controlling watermovement in the area immediately adjacent tothe existing outfall. These include longshorecurrents driven by obliquely incident waves,which vary in strength and direction withvariation in wave approach. The othernearshore currents of importance are the ripcurrents, which operate to discharge waterfrom the surf zone and may reach velocities upto 1 m/s.
Further offshore, measurements obtainedduring the Study showed that flows aredominated by the tides, with mainly long-shore oscillatory motions of about 20 cm/s.However lower frequency flows tend todetermine the ultimate path taken by theeffluent. These are also predominantly long-shore, with speeds rarely exceeding 10 cm/s(Andrewartha et al. 1998). Low frequency flowsare significantly correlated both with low-passfiltered winds and low-pass filtered sea-levelobserved at Lorne. Sokolov and Black (1994)reported that mean flows at Boags Rocks (overa 35 day period) were 11 cm/s towards thesoutheast. However results from this Studyindicated generally lower mean flows of 1 to 4cm/s over the period March 1997 to March1998 (the values varying with measurementsite and time).
Surface drogue measurements taken offshorefrom Boags Rocks as part of earlier studiesshowed that the surface water movement issignificantly influenced by the winds. It canoccur in both directions parallel to the shore,though southeasterly currents are dominantgiving a net longshore movement in thatdirection (Sokolov and Black 1994). The surfacedrogue measurements indicated that the netcross-shore movement of water associated withthe turn of the tide could be up to 600 m andthat the current velocity increased withdistance offshore.
3 Research
17
Final Report June 1999
3.1 Biological Monitoring
The objectives of the biological monitoringwere to assess the extent of impact of thetreated effluent on the rocky and sandybiological assemblages and to determinewhether the extent of the impact wasincreasing or decreasing.
A standard approach to biological monitoringis to compare impacted sites with control sitesthat are of similar characteristics and areassumed to be unimpacted (Underwood 1989).An alternative approach is to make anassessment of the change at a specific site overtime. Ideally these surveys commence prior toimpact occurring.
Along this coast the high level of naturalvariability due to differing substrata and oceandynamics means suitable control sites couldnot be identified for comparative purposes.The other confounding factor for Boags Rocksis that monitoring undertaken prior tocommissioning of the outfall (Manning 1979)was insufficient to allow reliable ‘before andafter’ type comparisons to be made.
These issues mean that assessing the extent ofimpact and determining whether it isincreasing or decreasing is a difficult objectiveto meet. Both past and present results haveproduced ambiguous results and only theimpact in the immediate vicinity of the outfallis irrefutable.
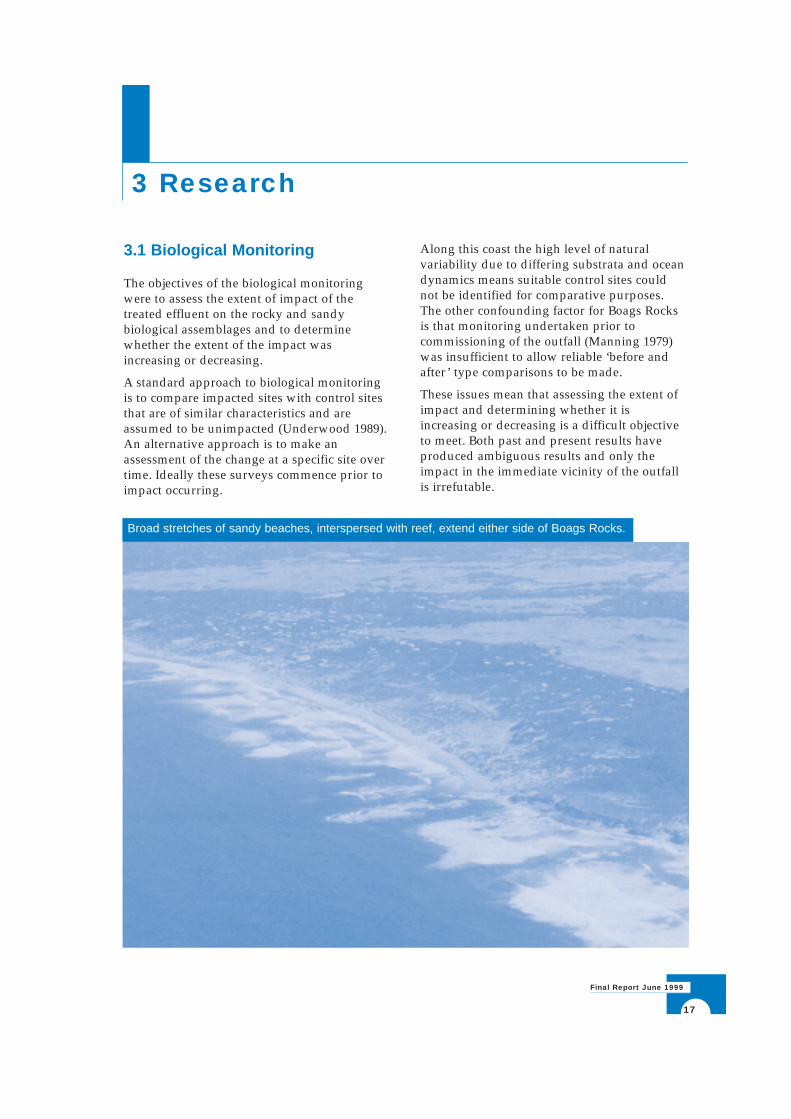
Broad stretches of sandy beaches, interspersed with reef, extend either side of Boags Rocks.
18
Environmental Impact Assessment and Review of Effluent Disposal Options for Eastern Treatment Plant
3.1.1 Intertidal Rocky Platforms
Considerable effort has been expended since1975 in surveying the rocky platforms alongthe coast between Point Nepean and CapeSchanck. Manning (1979) undertook surveys atfour sites - one at the outfall site itself, two at700 m (Boags Rocks East) and 5 km (FingalsBeach) southeast respectively and one situated16 km to the northwest (Sorrento). Twosurveys were conducted before dischargebegan and six afterwards, from July 1975, toAugust 1976. Manning commented that beforedischarge the four sites displayed differencesin algal and mollusc species composition with“considerable differences in the relativedensity of many common mollusc species”.After discharge commenced, the mostnoticeable effect was a decline in abundance ofbrown algae at the outfall site with someattendant changes in other taxa. Manning alsoreported similar effects at Boags Rocks East.
From 1980 to 1994 numerous other surveyswere conducted at a total of eleven sites,including some of those of Manning, togetherwith supplementary sites. All were on theaccessible rocky platforms. Seven reports wereprepared, elaborating and refining the earlyfindings of Manning.
Quinn and Haynes (1996) reviewed all thepublished material in a report to MelbourneWater. They posed the question “is the biota,including measures of temporal change, at theBoags Rocks sites within or outside the rangeof natural variation in biota betweenunimpacted sites?” They concluded that thestatistical tests applied by the various workerswere either inadequate or inappropriate toanswer this question with the data available.
They also commented that Manning’s pre-discharge surveys were too limited toovercome the marked temporal changes nowknown to occur in most taxa, especiallyHormosira banksii. Their overall conclusion wasthat rocky platforms do not provide a usefulsubstrate for assessing the extent of biologicaleffects of the outfall even on the basis of
comparing the outfall site with supposed“control” sites. They tested this latterconclusion by applying univariate analysis ofvariance (ANOVA) and non-metricmultidimensional scaling (NMDS) to the datacollected by Melbourne Water in 1993-4.
The ANOVA analysis showed only that theappearance of one opportunistic alga (Ulvarigida) could be considered to be due to effectsfrom the outfall. The NMDS plots showedsome evidence of separation of the BoagsRocks site from others on the basis ofmacroalgal percentage cover and faunalabundance but the distant control sites werealso different from intermediate sites. Quinnand Haynes attribute differences mainly tochanges in abundance of common taxa ratherthan presence/absence.
Quinn and Haynes recommended that moresophisticated statistical analysis be applied tothe 20 year collection of data in the hope thatsignificant patterns might emerge. All data andreports were therefore sent to CSIROMathematical and Information Sciences,Envirometrics Project. The resulting report(Shao 1997) reiterates many of Quinn andHaynes reservations about deficiencies inmethodology. Based on a CorrespondenceAnalysis (Greenacre 1984) of four macroalgaeand nine invertebrates Shao concluded that:
• The largest differences are between BoagsRocks and the site at Number Sixteen (7kmto the northwest).
• Boags Rocks East and Fingals Beach can begrouped together for some variablessuggesting that they are quite similar interms of time profiles
• Boags Rocks is more similar to Boags RocksEast than Fingals Beach.
• The similarity between Boags Rocks Eastand Fingals Beach is comparable with thatbetween Fingals Beach and Number Sixteenbut the latter two are clearly different.
19
Final Report June 1999
The net result of these investigations suggeststhat there are effects of the effluent at theoutfall site, but that longshore and temporaldifferences confound attempts to assess theextent of this effect or temporal trends onintertidal rocky platforms either side of theoutfall. One solution would be closer interval
sampling along the coast but sufficient suitablesites for sampling do not exist. Of course theexisting data would provide an excellent“before” baseline if the volume or quality ofthe effluent were significantly changed or theoutfall were to be extended.
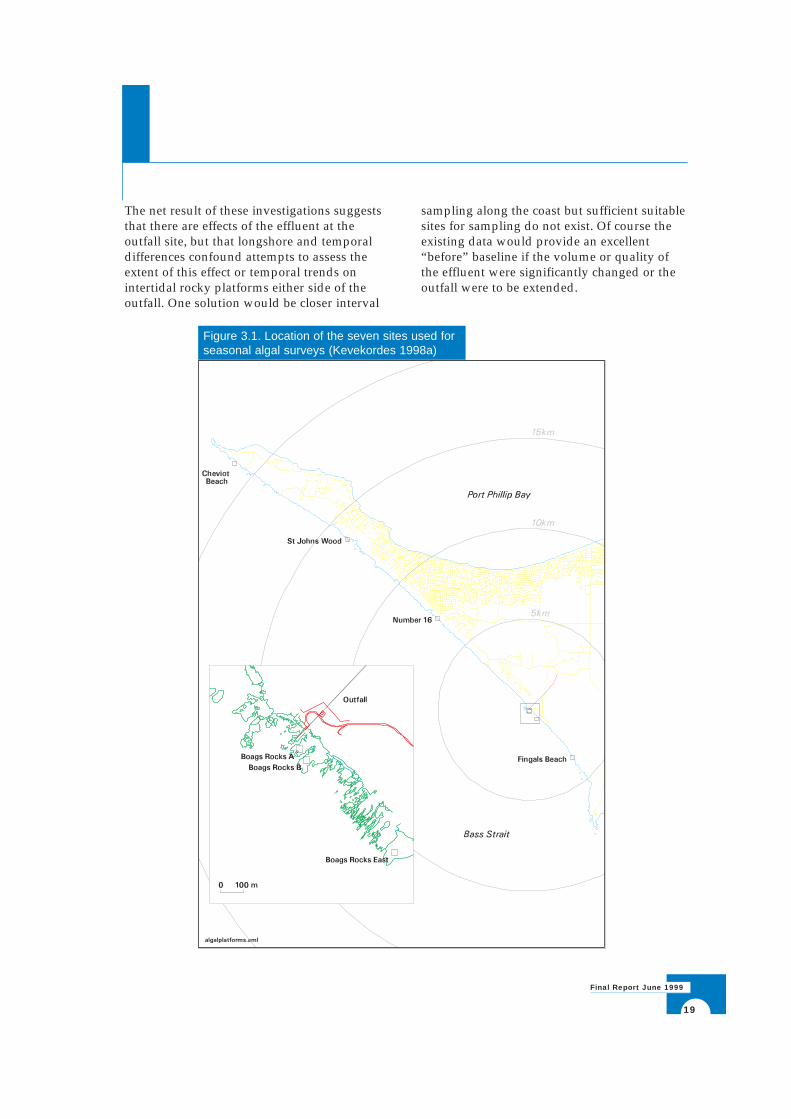
Figure 3.1. Location of the seven sites used forseasonal algal surveys (Kevekordes 1998a)
20
Environmental Impact Assessment and Review of Effluent Disposal Options for Eastern Treatment Plant
It is generally acknowledged that at the outfallsite important habitat forming brown algae(including Hormosira banksii and Durvilleapotatorum) and some red algae havedisappeared, together with their associatedfaunal communities. Their place has beentaken by green algal turfs and high densities ofa few species of limpets and gastropods.Furthermore, a tube-building spionidpolychaete, Boccardia proboscidea, has colonisedthe rocks. Anecdotal evidence suggests that theabove two brown algae have diminished inabundance or become absent on platforms tothe east of the outfall (DKO Services 1998).
The confounding of effluent effects and naturalvariation has also been noted during rockyplatform surveys of macroalgae at seven sites(Fig. 3.1) conducted by Kevekordes (1998a) aspart of the present Study. Thirty 0.25 m2
quadrats were haphazardly chosen within a 20by 20 m area adjacent to the lower edge of theintertidal rock platform. The taxa within eachquadrat were identified and their percentagecover measured. The surveys were conductedin autumn, winter and spring, 1997, andsummer, 1998.
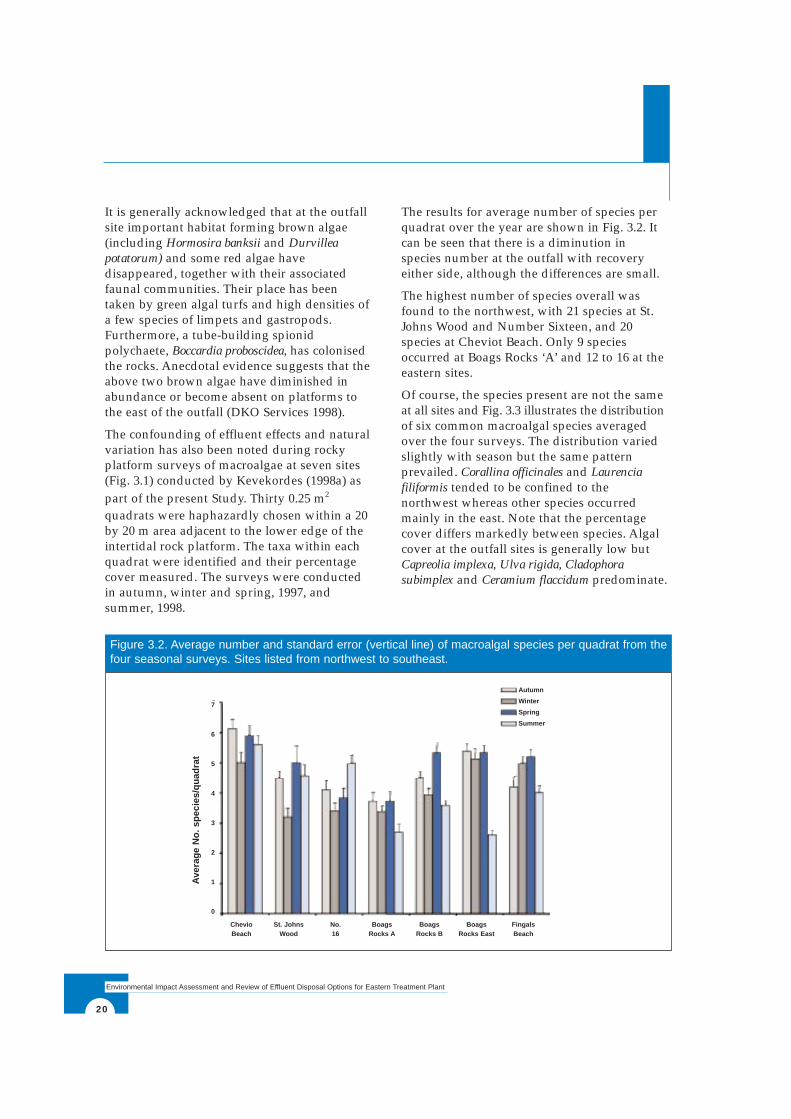
The results for average number of species perquadrat over the year are shown in Fig. 3.2. Itcan be seen that there is a diminution inspecies number at the outfall with recoveryeither side, although the differences are small.
The highest number of species overall wasfound to the northwest, with 21 species at St.Johns Wood and Number Sixteen, and 20species at Cheviot Beach. Only 9 speciesoccurred at Boags Rocks ‘A’ and 12 to 16 at theeastern sites.
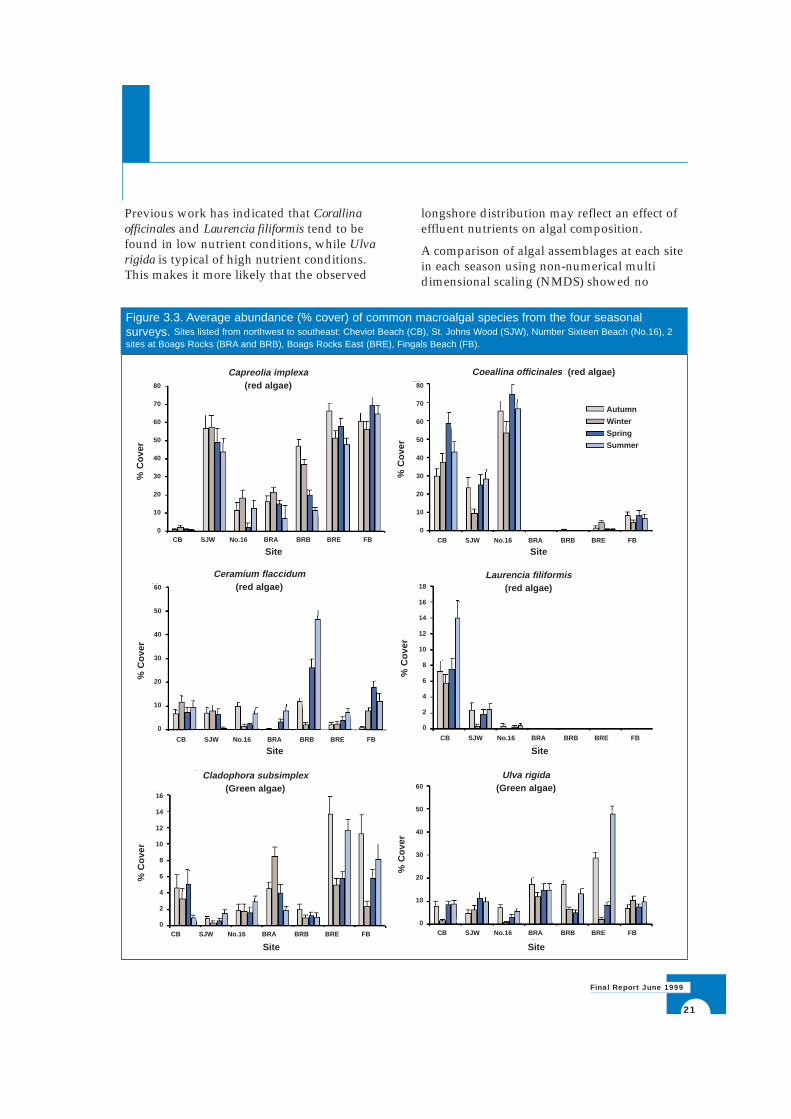
Of course, the species present are not the sameat all sites and Fig. 3.3 illustrates the distributionof six common macroalgal species averagedover the four surveys. The distribution variedslightly with season but the same patternprevailed. Corallina officinales and Laurenciafiliformis tended to be confined to thenorthwest whereas other species occurredmainly in the east. Note that the percentagecover differs markedly between species. Algalcover at the outfall sites is generally low butCapreolia implexa, Ulva rigida, Cladophorasubimplex and Ceramium flaccidum predominate.
Figure 3.2. Average number and standard error (vertical line) of macroalgal species per quadrat from thefour seasonal surveys. Sites listed from northwest to southeast.
Chevio St. Johns No. Boags Boags Boags FingalsBeach Wood 16 Rocks A Rocks B Rocks East Beach
Ave
rage
No.
spe
cies
/qua
drat
Autumn
Winter
Spring
Summer
7
6
5
4
3
2
1
0
21
Final Report June 1999
Previous work has indicated that Corallinaofficinales and Laurencia filiformis tend to befound in low nutrient conditions, while Ulvarigida is typical of high nutrient conditions.This makes it more likely that the observed
longshore distribution may reflect an effect ofeffluent nutrients on algal composition.
A comparison of algal assemblages at each sitein each season using non-numerical multidimensional scaling (NMDS) showed no
Figure 3.3. Average abundance (% cover) of common macroalgal species from the four seasonalsurveys. Sites listed from northwest to southeast: Cheviot Beach (CB), St. Johns Wood (SJW), Number Sixteen Beach (No.16), 2sites at Boags Rocks (BRA and BRB), Boags Rocks East (BRE), Fingals Beach (FB).
Cladophora subsimplex(Green algae)
% C
over
% C
over
% C
over
% C
over
% C
over
% C
over
Ceramium flaccidum(red algae)
Site Site
Site Site
Site Site
Laurencia filiformis(red algae)
CB SJW No.16 BRA BRB BRE FB
80
70
60
50
40
30
20
10
0
80
70
60
50
40
30
20
10
0
60
50
40
30
20
10
0
60
50
40
30
20
10
0
18
16
14
12
10
8
6
4
2
0
16
14
12
10
8
6
4
2
0
CB SJW No.16 BRA BRB BRE FB
CB SJW No.16 BRA BRB BRE FB
CB SJW No.16 BRA BRB BRE FB CB SJW No.16 BRA BRB BRE FB
CB SJW No.16 BRA BRB BRE FB
Autumn
Winter
Spring
Summer
Coeallina officinales (red algae)Capreolia implexa(red algae)
Ulva rigida(Green algae)
22
Environmental Impact Assessment and Review of Effluent Disposal Options for Eastern Treatment Plant
grouping or gradient, all sites being differentfrom each other. The same pattern emerges asin previous work, namely, that of a definitesignal of selection of species and poor cover atthe outfall site against a complex naturallongitudinal variation.
3.1.2 Intertidal Beach Sediments
Both Quinn and Haynes (1996) and Shao (1997)recommended alternative sampling methods.One such method was to examine intertidalbeach sediments between the rocky platformsto provide a more continuous regular profile.To this end, the Museum of Victoria wereengaged to sample intertidal beach sedimentsand report on the feasibility of usingmacrofauna to assess the extent of effluentimpact (Heisler et al. 1996).
The Museum scientists collected five cores (150mm diameter) to a depth of 150 mm at lowtide and mid-tide level at four beaches (40total). The beaches were situated 15 km(Sorrento), 4 km (Rye) and 50 m northwest ofthe outfall and 250 m southeast. The coreswere washed through a 1 mm sieve and thefauna collected for examination.
Very few individuals or species were found.Only one isopod, three amphipod and threepolychaete species occurred and these in verylow numbers. Distribution was also veryirregular with some cores yielding noorganisms at all and the highest count wasonly five. As excessive quantities of sedimentwould be required to obtain enough organismsto assess potential effluent impacts on infauna,this method of assessment was consideredinappropriate.
3.1.3 Subtidal Reefs
Three workshops were convened through1996-97 to consider other alternative samplingregimes. These meetings were attended byvarious representatives of CSIRO, MelbourneWater, the EPA and Monash University, some
of whom also held further discussions onspecial aspects of the monitoring problem.There was general consensus that intertidalrocky platform sampling was not suitable forestablishing the extent of impact and thatoffshore subtidal surveys be attempted.
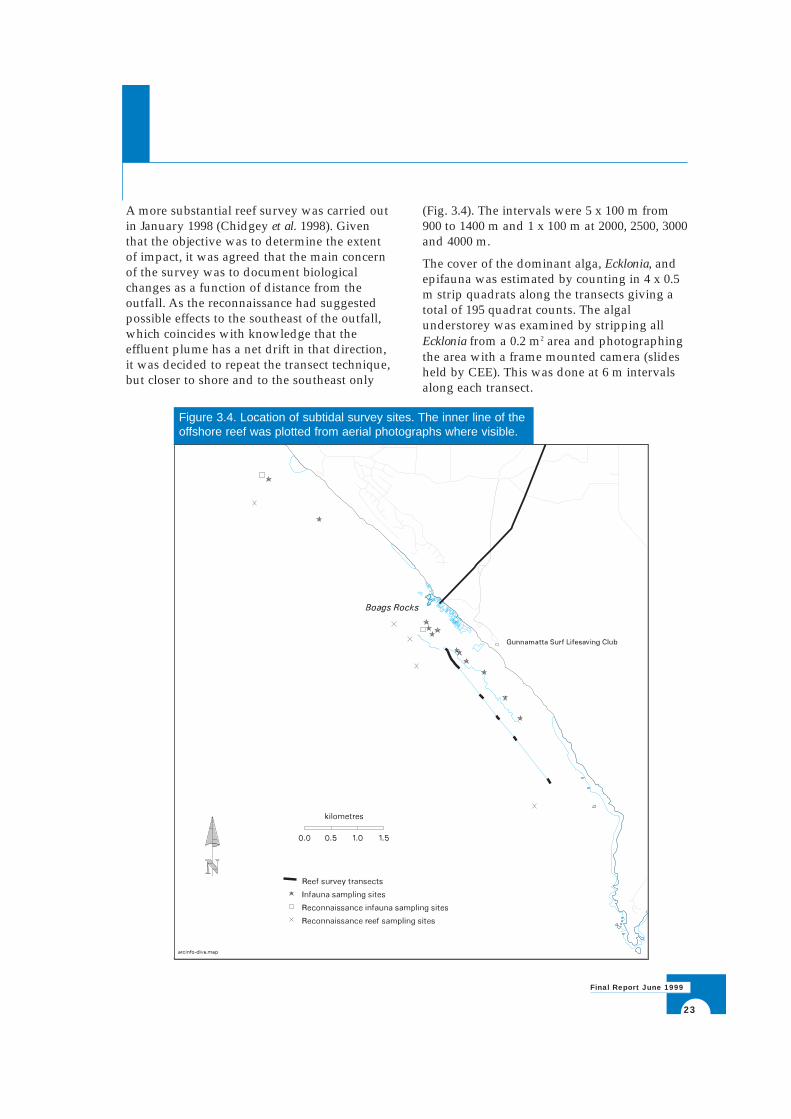
Consulting Environment Engineers P/L (CEE)were engaged to conduct a reconnaissancesurvey along the reef situated offshore fromthe coast and along the stretch of sand betweenthe shore and the offshore reef.
The limestone reef commences about 800 mfrom shore although the boundary is irregularand closer to shore in the east. The reef is oflow relief with numerous fissures and hasareas covered with sand. The reefreconnaissance used four sites situated at 4 kmnorthwest of the outfall, off the outfall and 500m and 4 km southeast of the outfall (Fig. 3.4).Distances from shore varied slightly but allsites were in 18 m depth of water. At each sitea 100 m transect was laid down and a videorecord taken (video held by CEE). Organismswere identified and counted or cover estimatedin 0.9 m2 quadrats of which five were placedhaphazardly at each 20 m interval along thetransect.
The reef communities were characterised bythe kelp Ecklonia radiata, which formed apatchy forest. Smaller red and green algalspecies covered most of the remaining reef,with a variety of fixed animal species alsopresent including sea squirts (cunjevoi),sponges, seastars, bryozoans and molluscssuch as periwinkles and abalone. It wasconcluded that the reef communities weremoderately diverse with generally similarassemblages in both directions. With thelimited data provided from the reconnaissancesurvey, it was not possible to determinewhether the differences seen were an effluenteffect or not. However more detailed samplingand analysis of reef community structure andabundance of common species may provide anindication of the effect of the effluentdischarge.
23
Final Report June 1999
A more substantial reef survey was carried outin January 1998 (Chidgey et al. 1998). Giventhat the objective was to determine the extentof impact, it was agreed that the main concernof the survey was to document biologicalchanges as a function of distance from theoutfall. As the reconnaissance had suggestedpossible effects to the southeast of the outfall,which coincides with knowledge that theeffluent plume has a net drift in that direction,it was decided to repeat the transect technique,but closer to shore and to the southeast only
(Fig. 3.4). The intervals were 5 x 100 m from900 to 1400 m and 1 x 100 m at 2000, 2500, 3000and 4000 m.
The cover of the dominant alga, Ecklonia, andepifauna was estimated by counting in 4 x 0.5m strip quadrats along the transects giving atotal of 195 quadrat counts. The algalunderstorey was examined by stripping allEcklonia from a 0.2 m2 area and photographingthe area with a frame mounted camera (slidesheld by CEE). This was done at 6 m intervalsalong each transect.
Figure 3.4. Location of subtidal survey sites. The inner line of theoffshore reef was plotted from aerial photographs where visible.
24
Environmental Impact Assessment and Review of Effluent Disposal Options for Eastern Treatment Plant
As in the reconnaissance, the reef was found tosupport a rich and diverse biologicalassemblage. Ecklonia radiata was the dominantmacroalga, with its understorey space beinginhabitated by smaller algae and numerousreef animals. The predominant animalsincluded abalone, rock lobsters, seastars andmolluscs. The fish included wrasse, hula fish,leatherjackets, magpie perch, sweep, boarfishand old wife. The most common benthic
animals were filter feeding solitary ascidians(sea squirts) with Herdmania and Cnemidocarpathe most abundant.
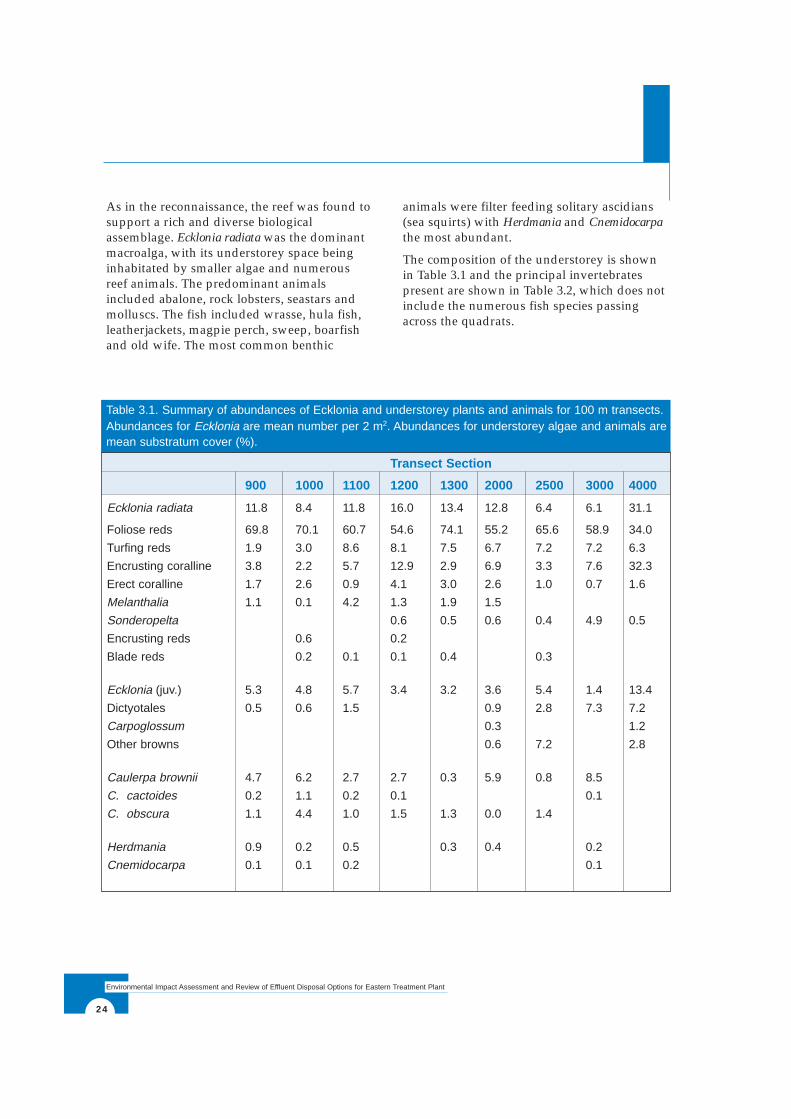
The composition of the understorey is shownin Table 3.1 and the principal invertebratespresent are shown in Table 3.2, which does notinclude the numerous fish species passingacross the quadrats.
Table 3.1. Summary of abundances of Ecklonia and understorey plants and animals for 100 m transects.Abundances for Ecklonia are mean number per 2 m2. Abundances for understorey algae and animals aremean substratum cover (%).
Transect Section
900 1000 1100 1200 1300 2000 2500 3000 4000
Ecklonia radiata 11.8 8.4 11.8 16.0 13.4 12.8 6.4 6.1 31.1
Foliose reds 69.8 70.1 60.7 54.6 74.1 55.2 65.6 58.9 34.0
Turfing reds 1.9 3.0 8.6 8.1 7.5 6.7 7.2 7.2 6.3
Encrusting coralline 3.8 2.2 5.7 12.9 2.9 6.9 3.3 7.6 32.3
Erect coralline 1.7 2.6 0.9 4.1 3.0 2.6 1.0 0.7 1.6
Melanthalia 1.1 0.1 4.2 1.3 1.9 1.5
Sonderopelta 0.6 0.5 0.6 0.4 4.9 0.5
Encrusting reds 0.6 0.2
Blade reds 0.2 0.1 0.1 0.4 0.3
Ecklonia (juv.) 5.3 4.8 5.7 3.4 3.2 3.6 5.4 1.4 13.4
Dictyotales 0.5 0.6 1.5 0.9 2.8 7.3 7.2
Carpoglossum 0.3 1.2
Other browns 0.6 7.2 2.8
Caulerpa brownii 4.7 6.2 2.7 2.7 0.3 5.9 0.8 8.5
C. cactoides 0.2 1.1 0.2 0.1 0.1
C. obscura 1.1 4.4 1.0 1.5 1.3 0.0 1.4
Herdmania 0.9 0.2 0.5 0.3 0.4 0.2
Cnemidocarpa 0.1 0.1 0.2 0.1
25
Final Report June 1999
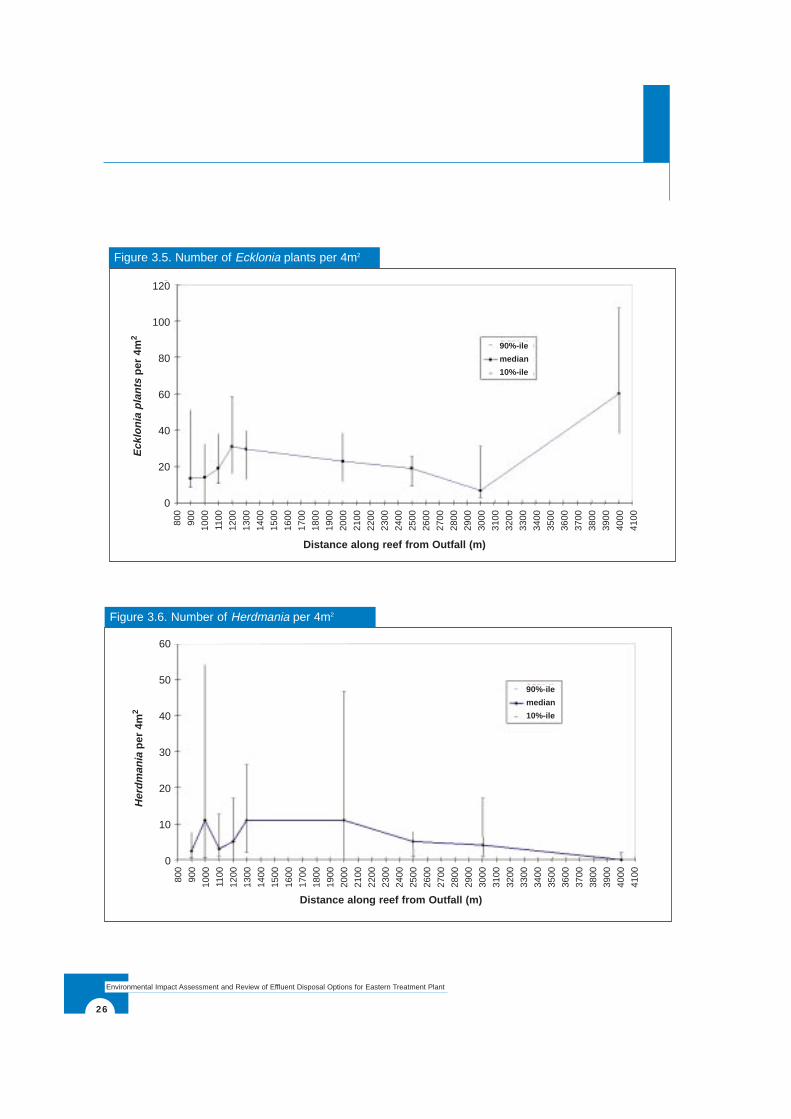
The abundances of the plants and animalsmeasured along the transect showed a highdegree of variation. This is evident in the plotsof results for the large brown kelp Ecklonia andfor the ascidian Herdmania (Figs. 3.5 and 3.6).For most species examined, patterns and trendsin abundances were evident at a range ofspatial scales. To examine patterns and trends atlarger spatial scales, the ‘noise’ of smaller scalevariation was smoothed using lowess (robustlocally weighted regression). This method canbe effective at elucidating patterns from withinvery noisy data, without underlyingassumptions about the distribution andvariance of the data (Ellison 1993).
Most of the transect was covered by a canopyof the large brown kelp Ecklonia, with densitiesmostly above 10 plants per 4 m2. However,
density was patchy, with large changes indensity occurring over short distances. Theaverage density of plants appeared to bereduced between 2500 m and 3100 m. Densitieswere consistently higher from 4000 m, with aminimum density of 36 plants per 4 m2.
The ascidian Herdmania tended to occur indiscrete clumps along the transect, with thedensity and spatial extent of the clumps beingquite variable. Exceptionally high densitieswere present at 1076, 1084 and 2096 m from theoutlet, with over 50 individuals per 4 m2. Theclumps generally had 10-20 individuals per 4m2 and extended 8 to 40 m along the transect.Average densities appeared to be lower at 900-1000 m, 2500-2600 m and 4000-4100 m.
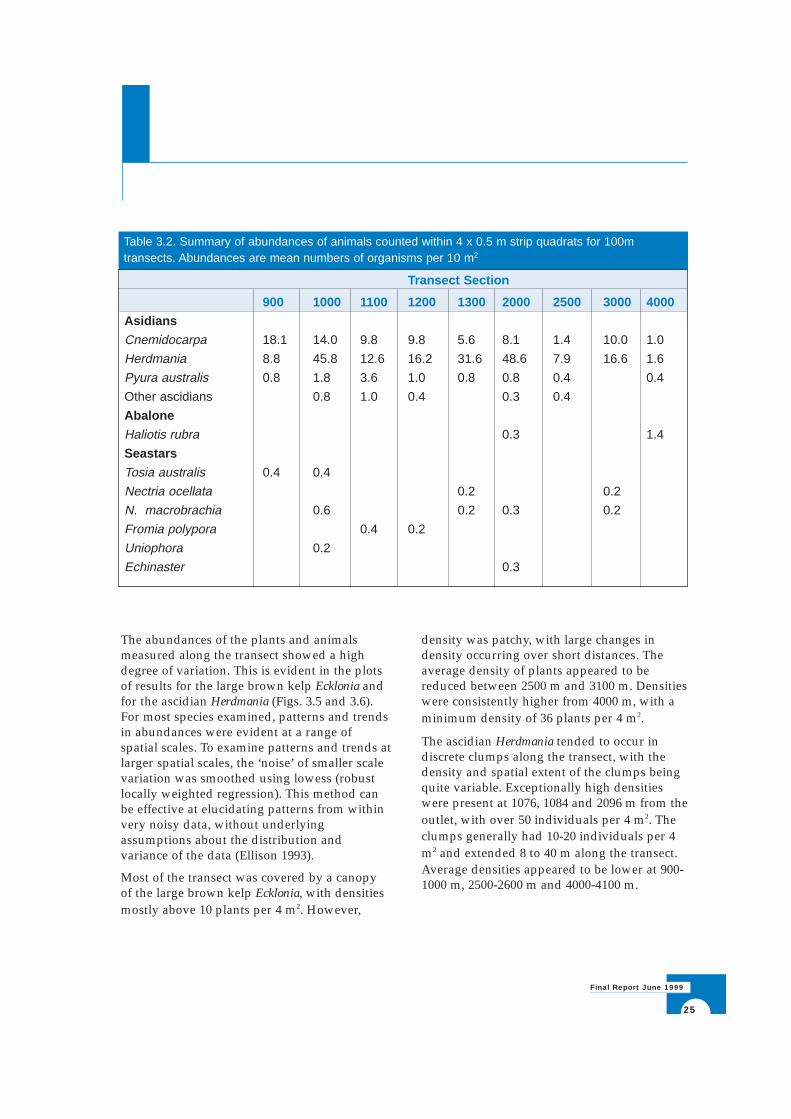
Table 3.2. Summary of abundances of animals counted within 4 x 0.5 m strip quadrats for 100mtransects. Abundances are mean numbers of organisms per 10 m2
Transect Section
900 1000 1100 1200 1300 2000 2500 3000 4000Asidians
Cnemidocarpa 18.1 14.0 9.8 9.8 5.6 8.1 1.4 10.0 1.0
Herdmania 8.8 45.8 12.6 16.2 31.6 48.6 7.9 16.6 1.6
Pyura australis 0.8 1.8 3.6 1.0 0.8 0.8 0.4 0.4
Other ascidians 0.8 1.0 0.4 0.3 0.4
Abalone
Haliotis rubra 0.3 1.4
Seastars
Tosia australis 0.4 0.4
Nectria ocellata 0.2 0.2
N. macrobrachia 0.6 0.2 0.3 0.2
Fromia polypora 0.4 0.2
Uniophora 0.2
Echinaster 0.3
26
Environmental Impact Assessment and Review of Effluent Disposal Options for Eastern Treatment Plant
Figure 3.5. Number of Ecklonia plants per 4m2
Figure 3.6. Number of Herdmania per 4m2
Distance along reef from Outfall (m)
90%-ile
median
10%-ile
Eck
loni
a pl
ants
per
4m2
800
900
1000
1100
1200
1300
1400
1500
1600
1700
1800
1900
2000
2100
2200
2300
2400
2500
2600
2700
2800
2900
3000
3100
3200
3300
3400
3500
3600
3700
3800
3900
4000
4100
Distance along reef from Outfall (m)
90%-ile
median
10%-ile
Her
dman
iape
r 4m
2
800
900
1000
1100
1200
1300
1400
1500
1600
1700
1800
1900
2000
2100
2200
2300
2400
2500
2600
2700
2800
2900
3000
3100
3200
3300
3400
3500
3600
3700
3800
3900
4000
4100
120
100
80
60
40
20
0
60
50
40
30
20
10
0
27
Final Report June 1999
In addition an analysis of community structurewas made. The 15 understorey algal groupswere subjected to Bray-Curtis dissimilarityindex calculation followed by non-metricmultidimensional scaling and calculation ofKruskal stress. This analysis showed a clearseparation of communities, that is a differencein floral composition - along the survey trackfrom 900 to 3000 m.
If the effluent discharge has a biologicalimpact, it is envisaged that the effects couldalso lead to spatial gradients anddiscontinuities in populations near the outfall.This was tested by use of spatialautocorrelation analysis (Mantel cross productstests and Mantel r correlograms) using thedensities of Ecklonia, Cnemidocarpa andHerdmania, the percent cover of foliose redalgae, turfing algae and encrusting corallinealgae and the understorey algal communitystructure. The results confirmed the trends forEcklonia, Herdmania and the foliose red algae. Italso disclosed an increasing density away fromthe outfall for encrusting coralline algae andconfirmed the gradual changes in understoreycommunity structure.
It should be noted that while the observedtrends would seem to show a gradient awayfrom the outfall this may reflect natural factorsof reef substrate and consequent competition.However, the following general conclusionsmay be drawn (Chidgey et al. 1998).
There are several spatial patterns in thedistribution of biota on the reefs offshore fromBoags Rocks to Cape Schanck. These patternsinclude:
• Changes over tens of metres due tobiological patchiness and interaction, andhabitat variation.
• Changes over hundreds of metres possiblydue to effluent effects, biologicalinteractions and habitat variation.
• Changes over kilometres possibly due toeffluent effects and physical regional
boundaries such as changes in reeftopography and wave climate.
To capture these spatial patterns, four zonesare proposed:
• First Biological Zone < 1100 m from theoutfall. This zone had relatively lowabundance of turfing red algae andencrusting coralline algae, low to mediumabundance of Ecklonia kelp and Herdmaniasea squirts, medium abundance of foliosered algae, and relatively high abundance ofCnemidocarpa sea squirts. It is consideredthat effluent is a factor affecting thebiological characteristics in this zone.
• Second Zone 1100 - 1400 m from theoutfall. This zone had high abundance ofturfing red algae; erect coralline algae,Ecklonia, Herdmania and foliose red algae;and comparatively low coverage ofencrusting coralline algae. It is consideredthat this zone is affected, but less so thanthe first zone.
• Third Zone 2000 - 3100 m. This zone hadmedium abundance of Ecklonia, turfing redalgae, Cnemidocarpa, Herdmania and erectcoralline and turfing red algae. It isconsidered that any effect of effluent withinthis zone would be largelyindistinguishable from other factorsaffecting the biological variationdocumented at sites within this zone.
• Fourth Zone > 4000 m. An abrupt changein community structure from 3100 to 4000m southeast, particularly an increase inabundance of Ecklonia, suggests asubstantial change in factors affecting thecommunity structure. While effluentexposure is expected to decrease slightlybetween these two locations, we considermore prominent changes in seabedstructure and higher wave exposure may bemajor factors affecting the change inbiological community structure betweenthe third and fourth zones. This
28
Environmental Impact Assessment and Review of Effluent Disposal Options for Eastern Treatment Plant
discontinuity was considered an effect ofnatural processes rather than an effluentimpact related pattern.
3.1.4 Subtidal Infauna
As part of the subtidal reconnaissance, infaunawas investigated at two sites between theoffshore reef and the shoreline. One site was640 m offshore directly opposite the outfall, theother was a similar distance offshore but 4.2km to the northwest (a “control” site) (Fig. 3.4).The seabed at both sites was hard packedwhite sand with wave ripples andresuspension by surge energy. No epifaunawere observed at either site. The seabed at thesite opposite the outfall was slightly grey incolour, which was assumed to be due toaccumulation of sewage particles. However,later work (see below) casts doubt on thisassumption.
Eight hand driven cores (100 mm diameter by150 mm depth) were taken at the northwesternsite but bad weather allowed only three coresto be collected at the outfall site. This latter sitewas revisited six weeks later and eight corescollected. This glitch in the program proved tobe useful in demonstrating marked temporalvariation in the composition of the infauna.
Ampeliscid amphipods were present in allsamples and dominated the population butwere significantly higher at the site directlyopposite the outfall. Distribution was verypatchy with numbers ranging from zero to 84per core. Spionid polychaetes were the nextmost abundant taxon, especially at the outfallsite, but in the second sampling they haddisappeared. Other polychaete species werepresent but in very low numbers. All otherbiota were sparse and patchy.
A cumulative percent abundance plot ofspecies at both sites showed the outfall site tobe numerically dominated by fewer speciesthan the control site (4.2km NW). It wasevident that the high variability and sparsenumbers of the infauna would require much
larger samples before any conclusions could bedrawn on likely effluent effects.
To provide further information a moreextensive survey was conducted (Chidgey et al.1998). Divers sampled twelve sites on April 51998. The sites were located between 4000 mnorthwest and 3000 m southeast of the outfall,along the 10 m depth contour (Fig. 3.4).Sediment cores 200 mm in diameter and 200mm deep were obtained using a frame pushedinto the sand. The sediment was collected intoa 500 µM mesh bag with an airlift suctiondevice. Five cores were collected from eachsite, with an additional sample for analysis ofgrain size and organic content.
Infauna were sorted, identified to the familytaxonomic level and counted. Total wet-biomass was also determined for each sample.Grain size composition of the sediments wasdetermined by sieving and total organic matterwas determined by loss on ignition at 550°C.
The infauna were compared between sites forpatterns which correspond with the location ofthe outfall. The data were examined for trendsin abundance’s of common taxa as well astrends in community structure. Communitystructure was examined and compared usingdiversity statistics, dominance curves andmultivariate ordination. Relationships betweenbiological assemblages and the physicalenvironment, particularly total organic matterand particle size composition were alsoexamined.
The infauna (Fig. 3.7) was generally composedof polychaete bristle worms, shell-like ostracodcrustaceans, decapod shrimps and shrimp-likecumaceans, amphipods and isopods. Thecommon polychaete worms included thedeposit feeding spionids, which live in mucuslined tubes and have long palps to gather foodparticles. The lumberinid and sigalionidworms are burrowing predators with eversible,fang-like mandibles. Ostracods, cumaceans,isopods and amphipods are small crustaceansthat burrow through the sediments for smallorganic particles. The decapod crustaceans
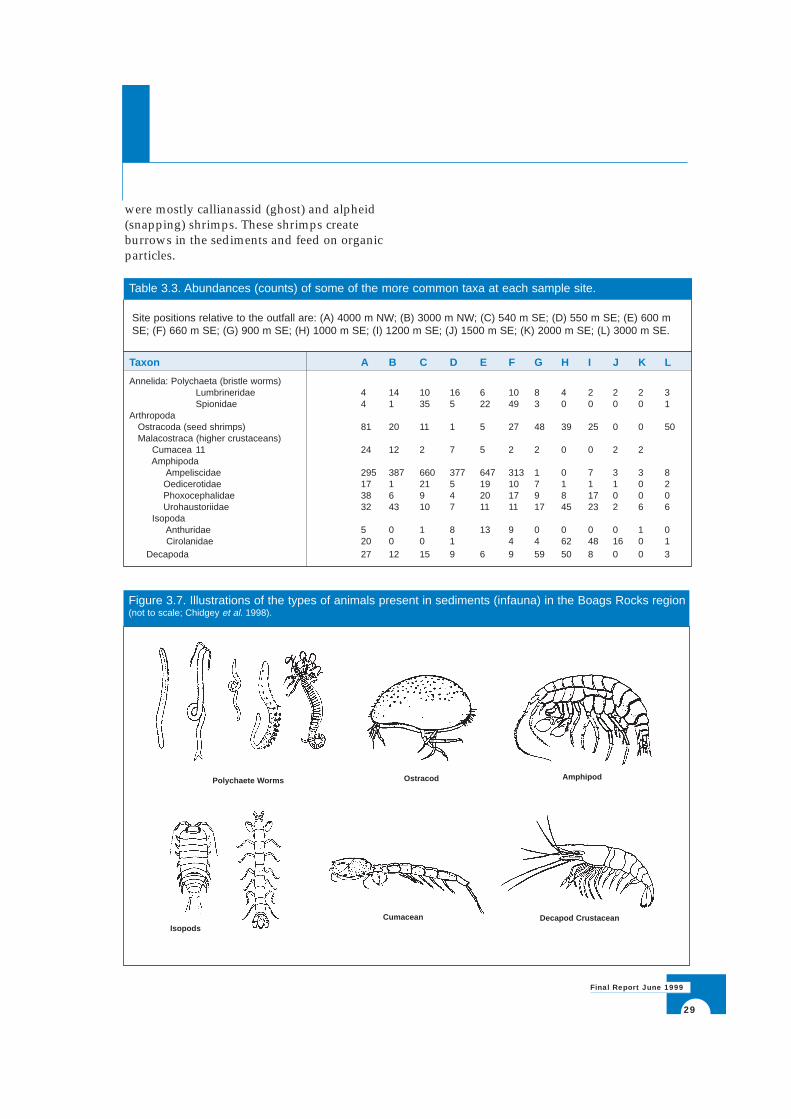
29
Final Report June 1999
were mostly callianassid (ghost) and alpheid(snapping) shrimps. These shrimps createburrows in the sediments and feed on organicparticles.
Table 3.3. Abundances (counts) of some of the more common taxa at each sample site.
Taxon A B C D E F G H I J K L
Annelida: Polychaeta (bristle worms)Lumbrineridae 4 14 10 16 6 10 8 4 2 2 2 3Spionidae 4 1 35 5 22 49 3 0 0 0 0 1
ArthropodaOstracoda (seed shrimps) 81 20 11 1 5 27 48 39 25 0 0 50Malacostraca (higher crustaceans)
Cumacea 11 24 12 2 7 5 2 2 0 0 2 2Amphipoda
Ampeliscidae 295 387 660 377 647 313 1 0 7 3 3 8Oedicerotidae 17 1 21 5 19 10 7 1 1 1 0 2Phoxocephalidae 38 6 9 4 20 17 9 8 17 0 0 0Urohaustoriidae 32 43 10 7 11 11 17 45 23 2 6 6
IsopodaAnthuridae 5 0 1 8 13 9 0 0 0 0 1 0Cirolanidae 20 0 0 1 4 4 62 48 16 0 1
Decapoda 27 12 15 9 6 9 59 50 8 0 0 3
Figure 3.7. Illustrations of the types of animals present in sediments (infauna) in the Boags Rocks region(not to scale; Chidgey et al. 1998).
Polychaete Worms
IsopodsCumacean
Ostracod
Decapod Crustacean
Amphipod
Site positions relative to the outfall are: (A) 4000 m NW; (B) 3000 m NW; (C) 540 m SE; (D) 550 m SE; (E) 600 mSE; (F) 660 m SE; (G) 900 m SE; (H) 1000 m SE; (I) 1200 m SE; (J) 1500 m SE; (K) 2000 m SE; (L) 3000 m SE.
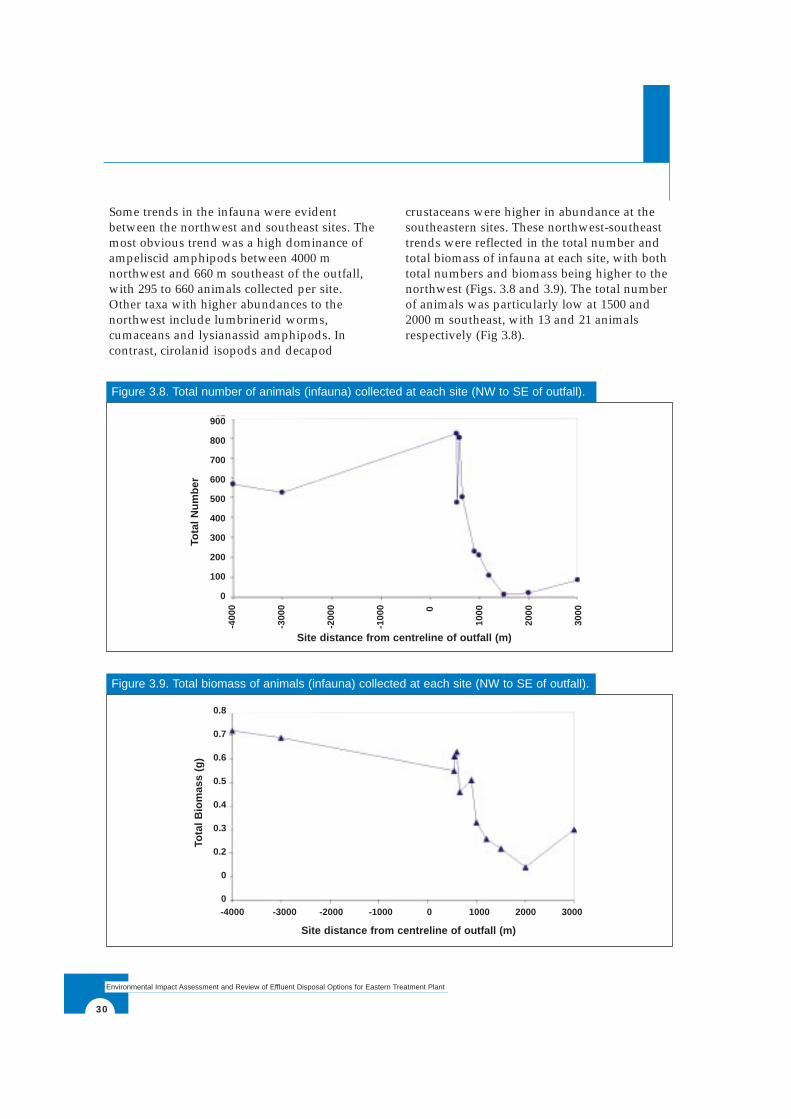
30
Environmental Impact Assessment and Review of Effluent Disposal Options for Eastern Treatment Plant
Some trends in the infauna were evidentbetween the northwest and southeast sites. Themost obvious trend was a high dominance ofampeliscid amphipods between 4000 mnorthwest and 660 m southeast of the outfall,with 295 to 660 animals collected per site.Other taxa with higher abundances to thenorthwest include lumbrinerid worms,cumaceans and lysianassid amphipods. Incontrast, cirolanid isopods and decapod
crustaceans were higher in abundance at thesoutheastern sites. These northwest-southeasttrends were reflected in the total number andtotal biomass of infauna at each site, with bothtotal numbers and biomass being higher to thenorthwest (Figs. 3.8 and 3.9). The total numberof animals was particularly low at 1500 and2000 m southeast, with 13 and 21 animalsrespectively (Fig 3.8).
Figure 3.8. Total number of animals (infauna) collected at each site (NW to SE of outfall).
Figure 3.9. Total biomass of animals (infauna) collected at each site (NW to SE of outfall).
Site distance from centreline of outfall (m)
Tota
l Num
ber
-400
0
-300
0
-200
0
-100
0 0
1000
2000
3000
900
800
700
600
500
400
300
200
100
0
Site distance from centreline of outfall (m)
Tota
l Bio
mas
s (g
)
-4000 -3000 -2000 -1000 0 1000 2000 3000
0.8
0.7
0.6
0.5
0.4
0.3
0.2
0
0

31
Final Report June 1999
Species diversity and evenness is a measure ofthe distribution of individuals among speciescomprising a community. A community withhigher species diversity has a more evendistribution of individuals among species.These measures are often used as indicators ofecosystem health (biodiversity). In unhealthysystems, the overall biomass (living matter) isdominated by a limited number of species of aparticular function group. As the number ofspecies (biodiversity) and functional diversity
increases, so to does biomass, productivity,nutrient retention and stability within theecosystem. This also allows a natural resilienceto perturbation to develop.
For the infauna, diversity and dominance wereexamined by calculation of the Shannon H’and Pielou’s Evenness J’ statistics. Diversityand evenness were least at the sites nearest theoutfall (540, 550, 600 and 660 m south east)(Fig. 3.10).
When community structure was examined,with appropriate transformations (fourth-roottransformed and use of Bray-Curtisdissimilarity index), the non-metricmultidimensional scaling (MDS) plot in Fig.3.11 was obtained. The community structuresat 1500 m southeast and 2000 m southeast
(Sites J & K) were quite different from theother sites. The sites closest to the outlet, 540 to660 m southeast (Sites C-F), were similar inassemblage structure. Sites further southeast ofthe outlet (> 660 m; Sites G, H, I & L) hadassemblages different to the sites near theoutlet. The two distant northwest sites (A & B)
Figure 3.10. Comparison of infaunal diversity and evenness between sites (NW to SE of outfall).
a. Shannon’s Diversity b. Pielou’s Evenness
H1
J1
Site Site
N 4
000
N 3
000
S 5
40
S 5
50
S 6
00
S 6
60
S 9
00
S 1
000
S 1
200
S 1
500
S 2
000
S 3
000
N 4
000
N 3
000
S 5
40
S 5
50
S 6
00
S 6
60
S 9
00
S 1
000
S 1
200
S 1
500
S 2
000
S 3
000
2.5
2.0
1.5
1.0
0.5
1.0
0.9
0.8
0.7
0.6
0.5
0.4
0.3
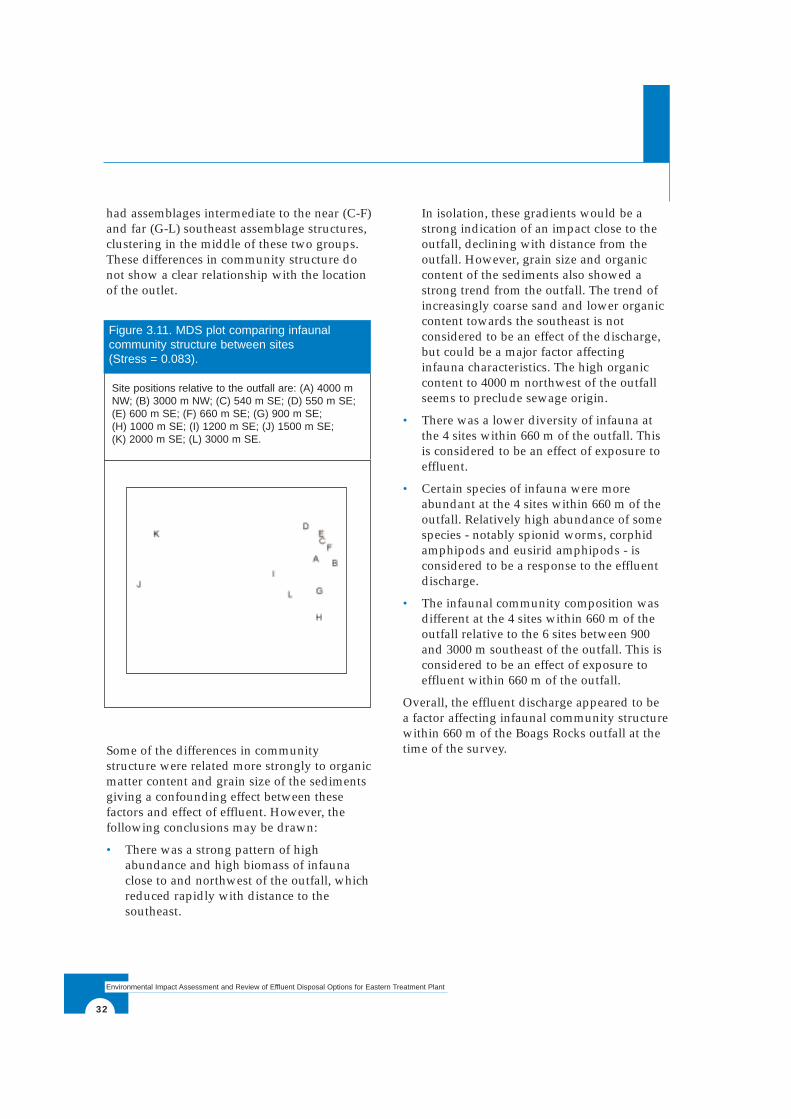
32
Environmental Impact Assessment and Review of Effluent Disposal Options for Eastern Treatment Plant
had assemblages intermediate to the near (C-F)and far (G-L) southeast assemblage structures,clustering in the middle of these two groups.These differences in community structure donot show a clear relationship with the locationof the outlet.
Some of the differences in communitystructure were related more strongly to organicmatter content and grain size of the sedimentsgiving a confounding effect between thesefactors and effect of effluent. However, thefollowing conclusions may be drawn:
• There was a strong pattern of highabundance and high biomass of infaunaclose to and northwest of the outfall, whichreduced rapidly with distance to thesoutheast.
In isolation, these gradients would be astrong indication of an impact close to theoutfall, declining with distance from theoutfall. However, grain size and organiccontent of the sediments also showed astrong trend from the outfall. The trend ofincreasingly coarse sand and lower organiccontent towards the southeast is notconsidered to be an effect of the discharge,but could be a major factor affectinginfauna characteristics. The high organiccontent to 4000 m northwest of the outfallseems to preclude sewage origin.
• There was a lower diversity of infauna atthe 4 sites within 660 m of the outfall. Thisis considered to be an effect of exposure toeffluent.
• Certain species of infauna were moreabundant at the 4 sites within 660 m of theoutfall. Relatively high abundance of somespecies - notably spionid worms, corphidamphipods and eusirid amphipods - isconsidered to be a response to the effluentdischarge.
• The infaunal community composition wasdifferent at the 4 sites within 660 m of theoutfall relative to the 6 sites between 900and 3000 m southeast of the outfall. This isconsidered to be an effect of exposure toeffluent within 660 m of the outfall.
Overall, the effluent discharge appeared to bea factor affecting infaunal community structurewithin 660 m of the Boags Rocks outfall at thetime of the survey.
Figure 3.11. MDS plot comparing infaunalcommunity structure between sites(Stress = 0.083).
Site positions relative to the outfall are: (A) 4000 mNW; (B) 3000 m NW; (C) 540 m SE; (D) 550 m SE;(E) 600 m SE; (F) 660 m SE; (G) 900 m SE; (H) 1000 m SE; (I) 1200 m SE; (J) 1500 m SE; (K) 2000 m SE; (L) 3000 m SE.
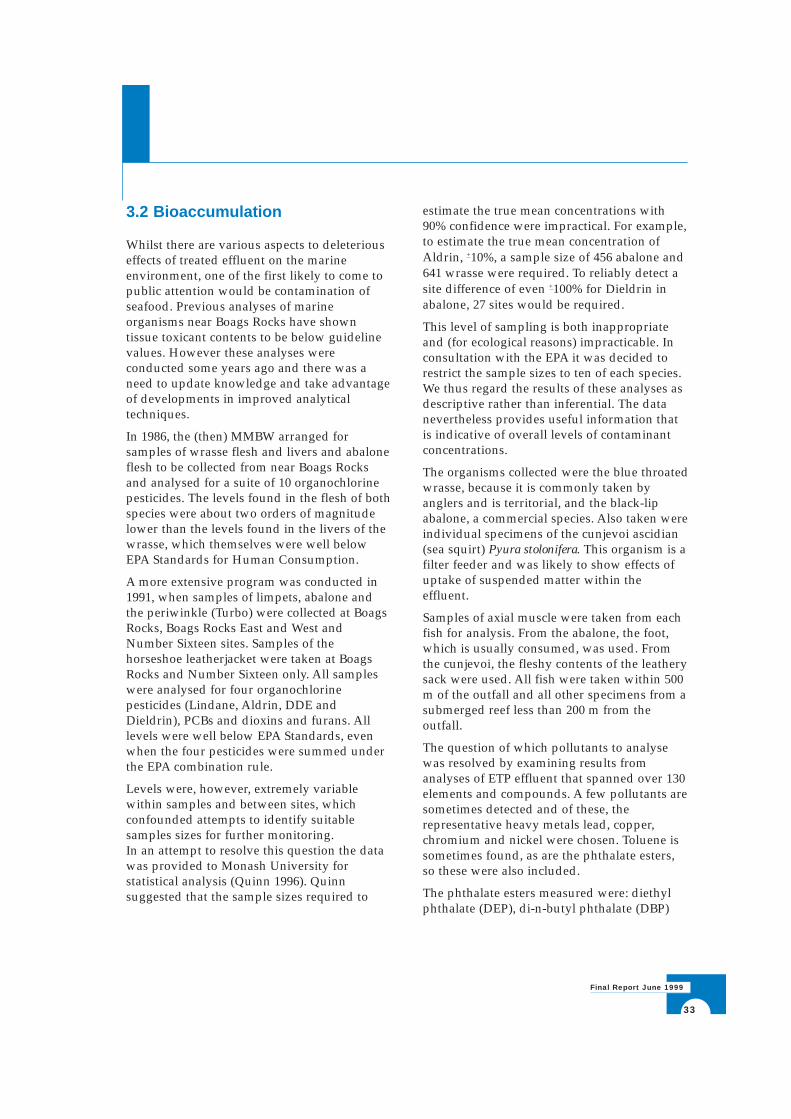
33
Final Report June 1999
3.2 Bioaccumulation
Whilst there are various aspects to deleteriouseffects of treated effluent on the marineenvironment, one of the first likely to come topublic attention would be contamination ofseafood. Previous analyses of marineorganisms near Boags Rocks have showntissue toxicant contents to be below guidelinevalues. However these analyses wereconducted some years ago and there was aneed to update knowledge and take advantageof developments in improved analyticaltechniques.
In 1986, the (then) MMBW arranged forsamples of wrasse flesh and livers and abaloneflesh to be collected from near Boags Rocksand analysed for a suite of 10 organochlorinepesticides. The levels found in the flesh of bothspecies were about two orders of magnitudelower than the levels found in the livers of thewrasse, which themselves were well belowEPA Standards for Human Consumption.
A more extensive program was conducted in1991, when samples of limpets, abalone andthe periwinkle (Turbo) were collected at BoagsRocks, Boags Rocks East and West andNumber Sixteen sites. Samples of thehorseshoe leatherjacket were taken at BoagsRocks and Number Sixteen only. All sampleswere analysed for four organochlorinepesticides (Lindane, Aldrin, DDE andDieldrin), PCBs and dioxins and furans. Alllevels were well below EPA Standards, evenwhen the four pesticides were summed underthe EPA combination rule.
Levels were, however, extremely variablewithin samples and between sites, whichconfounded attempts to identify suitablesamples sizes for further monitoring.In an attempt to resolve this question the datawas provided to Monash University forstatistical analysis (Quinn 1996). Quinnsuggested that the sample sizes required to
estimate the true mean concentrations with90% confidence were impractical. For example,to estimate the true mean concentration ofAldrin, +10%, a sample size of 456 abalone and641 wrasse were required. To reliably detect asite difference of even +100% for Dieldrin inabalone, 27 sites would be required.
This level of sampling is both inappropriateand (for ecological reasons) impracticable. Inconsultation with the EPA it was decided torestrict the sample sizes to ten of each species.We thus regard the results of these analyses asdescriptive rather than inferential. The datanevertheless provides useful information thatis indicative of overall levels of contaminantconcentrations.
The organisms collected were the blue throatedwrasse, because it is commonly taken byanglers and is territorial, and the black-lipabalone, a commercial species. Also taken wereindividual specimens of the cunjevoi ascidian(sea squirt) Pyura stolonifera. This organism is afilter feeder and was likely to show effects ofuptake of suspended matter within theeffluent.
Samples of axial muscle were taken from eachfish for analysis. From the abalone, the foot,which is usually consumed, was used. Fromthe cunjevoi, the fleshy contents of the leatherysack were used. All fish were taken within 500m of the outfall and all other specimens from asubmerged reef less than 200 m from theoutfall.
The question of which pollutants to analysewas resolved by examining results fromanalyses of ETP effluent that spanned over 130elements and compounds. A few pollutants aresometimes detected and of these, therepresentative heavy metals lead, copper,chromium and nickel were chosen. Toluene issometimes found, as are the phthalate esters,so these were also included.
The phthalate esters measured were: diethylphthalate (DEP), di-n-butyl phthalate (DBP)
34
Environmental Impact Assessment and Review of Effluent Disposal Options for Eastern Treatment Plant
and di-(2-ethylhexyl) phthalate (DEHP).Phthalate esters are used in the production ofplastic to reduce brittleness and increaseflexibility. They are widely used in theproduction of packaging, building materials,furnishings, clothing and kitchenware.Although not especially toxic they are on thelist of endocrine disruptors and their impact inthe marine environment is being investigated.
Whilst the polychlorinated dibenzo-p-dioxins(PCDDs) and polychlorinated dibenzofurans(PCDFs) are not detected in the effluent, theywere included in this exercise because even atextremely low levels they can accumulate infatty tissues and are commonly seen as“typical” industrial pollutants.
Cunjevoi samples were analysed for heavymetals, as only limited research has beencarried out on this organism giving a limitedunderstanding of their metabolism.
The sampling and analyses were conducted bythe Marine and Freshwater Resources Institute(MAFRI). For those analyses for which MAFRIdid not have NATA certification, samples weresent to laboratories that were certified. Theresults are given in Tables 3.4 and 3.5 (Bradyand Fabris 1997a).
It can be seen that heavy metal levels in thefish and abalone were mainly low (sometimesundetectable) and are mostly below theNational Food Authority Standard and EPAWater Quality Guidelines given in the Table3.4. Nickel levels in abalone showed the mostvariability; with levels ranging fromundetectable to 12.6 µg/g. There are noNational Food Authority Standards for nickelin abalone. However, the US Food and Drug
Administration suggest that the danger levelfor a person consuming shellfish on acontinuous daily basis would be 80 µg/g,nearly seven times the maximum levelidentified in the samples taken.
The cunjevoi copper levels were compared toanalyses made on specimens collected off theNSW coast (Florence et al. 1997). The mean of4.45 µg/g is at the mid range found in thelatter which varied from 1.6 in a pristineenvironment to 13.1 µg/g in a bay close to aprimary treated sewage outfall. The range ofvalues in the 10 replicates was fairly small.
Of the organic pollutants, only DEHP wasdetectable in all fish, DEP and DEHP only inone abalone, DEP in two fish and DBP in onefish. All levels were close to the detection limit.
Phthalate esters vary in their chemicalstructure, but all readily biodegrade and hencedo not accumulate in the food chain. phthalateesters are also removed from the environmentby photooxidation and microbial activity. Itwas concluded that the levels of phthalateesters found were unliklely to lead toendocrine disruption in organisms present.
The dioxin-furan levels were three orders ofmagnitude lower than the internationalstandard in fish and over 300 times lower thanthe standard in abalone.
It was concluded that bioaccumulation offBoags Rocks is too negligible to present ahuman health hazard. The scientistsconducting the assessment, also suggested thatif a long term monitoring program is initiated,that a well studied filter feeder such as thecommon mussel be used in place of the fishand invertebrates studied here.
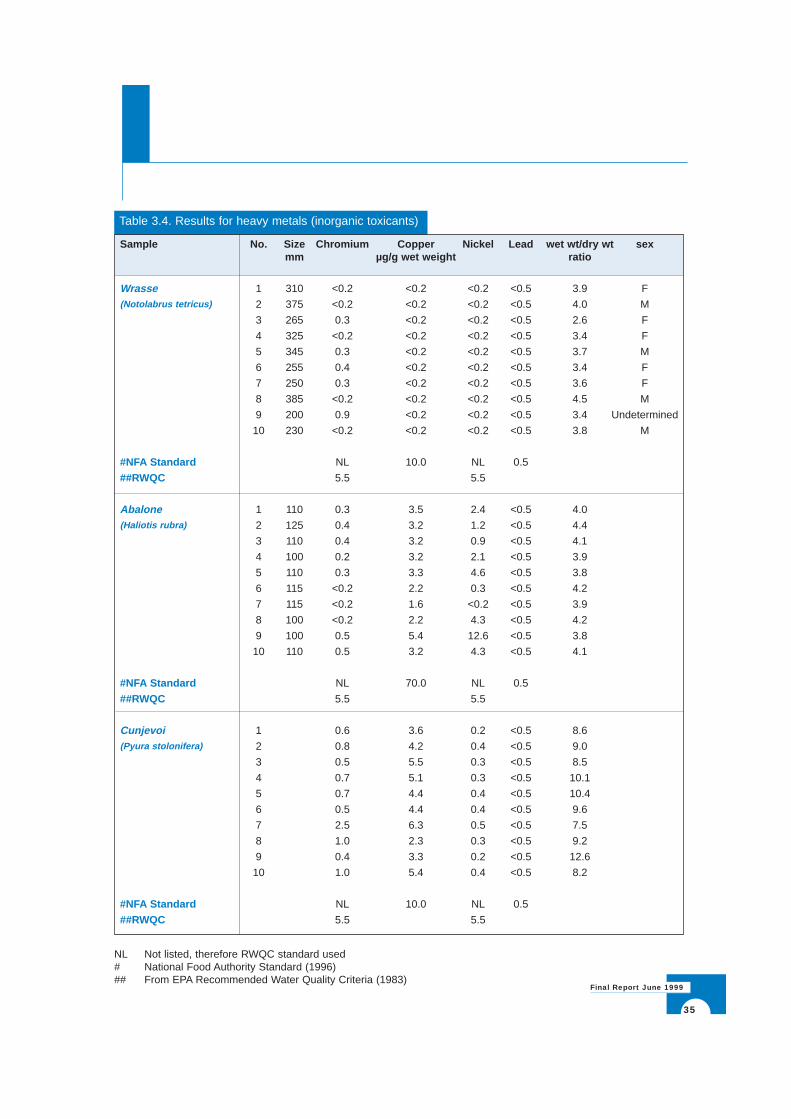
35
Final Report June 1999
Table 3.4. Results for heavy metals (inorganic toxicants)
Sample No. Size Chromium Copper Nickel Lead wet wt/dry wt sexmm µg/g wet weight ratio
Wrasse 1 310 <0.2 <0.2 <0.2 <0.5 3.9 F(Notolabrus tetricus) 2 375 <0.2 <0.2 <0.2 <0.5 4.0 M
3 265 0.3 <0.2 <0.2 <0.5 2.6 F
4 325 <0.2 <0.2 <0.2 <0.5 3.4 F
5 345 0.3 <0.2 <0.2 <0.5 3.7 M
6 255 0.4 <0.2 <0.2 <0.5 3.4 F
7 250 0.3 <0.2 <0.2 <0.5 3.6 F
8 385 <0.2 <0.2 <0.2 <0.5 4.5 M
9 200 0.9 <0.2 <0.2 <0.5 3.4 Undetermined
10 230 <0.2 <0.2 <0.2 <0.5 3.8 M
#NFA Standard NL 10.0 NL 0.5
##RWQC 5.5 5.5
Abalone 1 110 0.3 3.5 2.4 <0.5 4.0(Haliotis rubra) 2 125 0.4 3.2 1.2 <0.5 4.4
3 110 0.4 3.2 0.9 <0.5 4.1
4 100 0.2 3.2 2.1 <0.5 3.9
5 110 0.3 3.3 4.6 <0.5 3.8
6 115 <0.2 2.2 0.3 <0.5 4.2
7 115 <0.2 1.6 <0.2 <0.5 3.9
8 100 <0.2 2.2 4.3 <0.5 4.2
9 100 0.5 5.4 12.6 <0.5 3.8
10 110 0.5 3.2 4.3 <0.5 4.1
#NFA Standard NL 70.0 NL 0.5
##RWQC 5.5 5.5
Cunjevoi 1 0.6 3.6 0.2 <0.5 8.6(Pyura stolonifera) 2 0.8 4.2 0.4 <0.5 9.0
3 0.5 5.5 0.3 <0.5 8.5
4 0.7 5.1 0.3 <0.5 10.1
5 0.7 4.4 0.4 <0.5 10.4
6 0.5 4.4 0.4 <0.5 9.6
7 2.5 6.3 0.5 <0.5 7.5
8 1.0 2.3 0.3 <0.5 9.2
9 0.4 3.3 0.2 <0.5 12.6
10 1.0 5.4 0.4 <0.5 8.2
#NFA Standard NL 10.0 NL 0.5
##RWQC 5.5 5.5
NL Not listed, therefore RWQC standard used# National Food Authority Standard (1996)## From EPA Recommended Water Quality Criteria (1983)
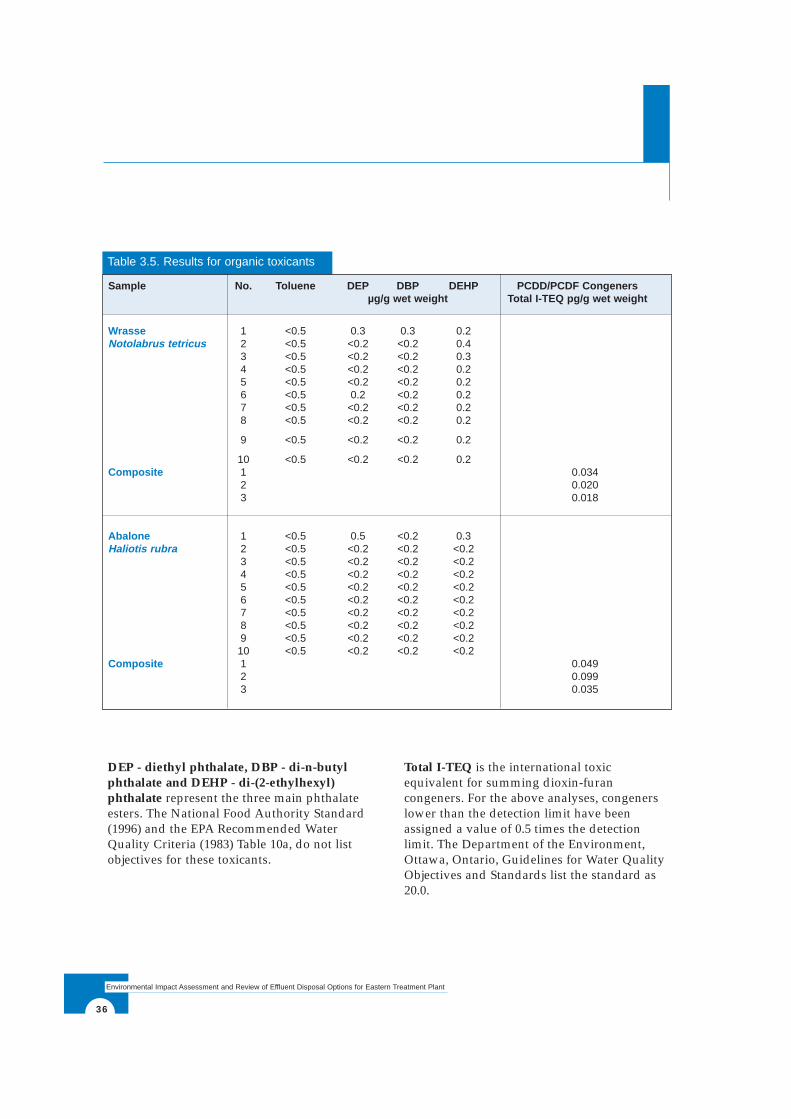
36
Environmental Impact Assessment and Review of Effluent Disposal Options for Eastern Treatment Plant
DEP - diethyl phthalate, DBP - di-n-butylphthalate and DEHP - di-(2-ethylhexyl)phthalate represent the three main phthalateesters. The National Food Authority Standard(1996) and the EPA Recommended WaterQuality Criteria (1983) Table 10a, do not listobjectives for these toxicants.
Total I-TEQ is the international toxicequivalent for summing dioxin-furancongeners. For the above analyses, congenerslower than the detection limit have beenassigned a value of 0.5 times the detectionlimit. The Department of the Environment,Ottawa, Ontario, Guidelines for Water QualityObjectives and Standards list the standard as20.0.
Table 3.5. Results for organic toxicants
Sample No. Toluene DEP DBP DEHP PCDD/PCDF Congenersµg/g wet weight Total I-TEQ pg/g wet weight
Wrasse 1 <0.5 0.3 0.3 0.2Notolabrus tetricus 2 <0.5 <0.2 <0.2 0.4
3 <0.5 <0.2 <0.2 0.34 <0.5 <0.2 <0.2 0.25 <0.5 <0.2 <0.2 0.26 <0.5 0.2 <0.2 0.27 <0.5 <0.2 <0.2 0.28 <0.5 <0.2 <0.2 0.2
9 <0.5 <0.2 <0.2 0.2
10 <0.5 <0.2 <0.2 0.2Composite 1 0.034
2 0.0203 0.018
Abalone 1 <0.5 0.5 <0.2 0.3Haliotis rubra 2 <0.5 <0.2 <0.2 <0.2
3 <0.5 <0.2 <0.2 <0.24 <0.5 <0.2 <0.2 <0.25 <0.5 <0.2 <0.2 <0.26 <0.5 <0.2 <0.2 <0.27 <0.5 <0.2 <0.2 <0.28 <0.5 <0.2 <0.2 <0.29 <0.5 <0.2 <0.2 <0.2
10 <0.5 <0.2 <0.2 <0.2Composite 1 0.049
2 0.0993 0.035
3.3 Toxicity Assessment
The extensive program of bioassaysundertaken in this Study was conducted fortwo reasons. Firstly Melbourne Water isrequired to monitor the toxicity of the effluent.Secondly there has been difficulty indetermining the extent and trend of changes inbiological assemblages along the coast thatmay be effluent related. This problem wasdiscussed in Section 3.1 of this report.
It was reasoned that if several test species ofcommon marine flora and fauna weresubjected to effluent exposure under controlledconditions and the effluent concentrationshaving no toxic effect were determined, thenthe extent of toxic effect could be estimatedfrom the known dilution pattern of the effluentplume.
CSIRO’s Centre for Advanced AnalyticalChemistry (CAAC) coordinated and reported(Stauber et al. 1998) on the assessmentprogram, which involved three otherinstitutions.
The respective roles were: -
CSIRO CAAC: Coordination and reporting / Microtox® test / Microalgal growth bioassay
MAFRI: Sample preparation, analysis and dispatch / Doughboy scallop larval development bioassay
RMIT University: Fish larval mortality bioassay
Monash University: Macroalgal fertilisation and growth bioassay
The choice of test organisms for the toxicity-testing program was based on their seasonalavailability; the availability of establishedbioassays with indigenous species and theneed for both acute and chronic tests. Acute
tests essentially measures short-term effects(both lethal and sub-lethal) whilst the chronictests indicate long term detrimental effects orimpacts on early life stages.
The acute tests were performed on Vibriofischeri, a bacterium whose luminescencedecreases in response to toxicants and larvalfish, either Australian Bass (Macquarianovemaculata) or estuarine perch (Macquariacolonorum).
The chronic tests were carried out withNitzschia closterium a unicellular marine alga(diatom) common in Australian waters, larvaeof the doughboy scallop (Chlamys asperrima)and early life stages of the brown macroalgaHormosira banksii common on intertidal rockplatforms along the Victorian coast. This latterorganism provided three test stages -fertilisation of the eggs, germination at 48hours and cell division (growth) at 72 hours.
The protocol of sample preparation andexperimental procedures is very precise andstandardised so that bioassays on the sameorganisms may be compared at different placesor times. A full description of procedures isgiven in the report by Stauber et al. (1998).Because the large volumes of effluent required(100 litres) precluded sampling at the outfall,samples were collected from the rising mainleaving ETP. This excludes a small contribution(20 ML/day or about 5% of total discharge) oftreated effluent from three local sewage plantsinto the pipeline between ETP and the outfall.However, a comparison of routine chemicalanalyses of effluent at ETP and Boags Rocksdoes not show any obvious differences ineffluent composition.
The organisms were subjected to variousconcentrations of effluent, produced bydiluting effluent (pre-adjusted to 33 %°salinity) with filtered natural seawater orartificial seawater. This was done to separatethe effects of toxicants from the impact onmarine organisms of salinity changes causedby the discharge of large volumes of
37
Final Report June 1999
38
Environmental Impact Assessment and Review of Effluent Disposal Options for Eastern Treatment Plant
freshwater effluent. This latter effect has beenstudied at Monash University and VictoriaUniversity of Technology (VUT) and someresults of this will also be discussed.
The toxicity results are expressed asLC50/EC50 %, LOEC and NOEC. The firstmeasure gives the percentage concentration ofeffluent at which the test organism shows only50% of the control response. For example, inthe case of the microalga Nitzschia, wheregrowth is measured over 72 hours (3 to 4doublings of cell numbers in seawatercontrols), the EC50 is that concentration ofeffluent in which only half this growth rate isachieved. Similarly, in the fish bioassays, the
LC50 is the concentration of effluent in whichhalf the fish have died after 96 hours. TheLOEC is the Lowest Observable EffectConcentration where statistical testing of theresults indicates the smallest significantdifference from the controls. NOEC is the NoObservable Effect Concentration where nosignificant toxic effects are detectable.
A summary of the results over three samplings(June, September and November 1997) is givenin Table 3.6. The NOEC values only are givensince this is the level at which organisms areunaffected and which may be used to calculate“safe” dilution of the effluent.
Test Species Endpoint NOEC (%)
June September November
Nitzschia closterium 72-h Growth 25 12.5 12.5(microalga)
Hormosira banksii Fertilisation >100 >100 >100
48-h Germination 6.25 6.25 6.25
72-h Cell Division 6.25 6.25 6.25
Chlamys asperrima 48-h Development 6.25 0.5 0.5(scallop larvae)
Vibrio fischeri 15-min Light Output >90 >90 >90(bacteria)
Macquaria spp 96-h Mortality 50 50 6.25(fish larvae)
Table 3.6. Comparison of no observed effect concentrations (NOEC) to test speciesfor the three sampling events
(macroalga)
NB: For the November fish larvae test, 4-5 week old larvae were used rather than the preferred 1-3 day old larvae,which were seasonally unavailable.
39
Final Report June 1999
It can be seen that bacterial luminescence andHormosira fertilisation are not affected by evenundiluted effluent. Fish larvae 1-3 days old arealso little affected. They all survived in effluentof 50% dilution. In November when 4-5 weekold bass larvae were used, the results indicatedthat the effluent was more toxic. However, thismay not have been a true indication ofincreased toxicity. It was observed that theolder larvae, having exhausted their normalfood sources, consumed the sewage particles.Such particles were likely to have many of thecontaminants adsorbed to them and thusuptake of chemicals would have been via thegut as well as the gills. Some substances wouldthus be made more bioavailable and possiblymore toxic (such as lipophilic ones that wouldnot be in the water column). It is likely that inopen waters the fish would be more selectivein their choice of food.
The germination of Hormosira and subsequentcell division were affected but only inconcentrations of effluent above 6.25%, i.e.dilutions of less than 16 times. Growth of thediatom, Nitzschia closterium, was inhibitedunless at least an 8 times dilution was used.Most sensitive were the scallop larvae wheresome abnormal development occurred unlessthe effluent was diluted 16 times in June and200 times in September and November.
We have previously mentioned that VUTconducted toxicity testing on ETP effluent andtheir results were made available to this Study(Shir and Burridge 1998). The VUT work usedthree species of macroalgae - Hormosira banksii,Macrocystis angustifolia and Phyllospora comosa.For the first two, the criteria of 48 hourgermination, 96 hour embryo mortality and 1and 2 week embryo growth were used. In thecase of Phyllospora, zoospore germination, 48hour germ tube growth, 19 day sporophyteproduction and 20 day sporophyte growthwere used. Samples of primary treated effluentand secondary treated effluent before and afterchlorination, were tested over a two yearperiod. Samples were tested with and without
salinity adjustment to determine the effects ofboth chemical toxicants and salinity reduction.
The results show that primary effluent is about5 times more toxic than secondary effluentsuggesting that most toxicants are destroyed inthe secondary treatment process or locked upin the sludge. Chlorination slightly increasedtoxicity in some cases. Adjusting effluent toseawater salinity decreases toxicity althoughthis was not as significant for primary treatedeffluent. Comparison of the VUT and Monashresults on Hormosira is problematical becauseof differences in procedures but EC50, LOECand NOEC levels for the Monash work werewithin the range determined by VUT.
As mentioned earlier, one objective of thetoxicity assessment program was to determinewhether effluent concentrations along the coasteither side of Boags Rocks were likely toproduce loss of biological assemblages, and ifso, to what extent. We now have a total of 32bioassay results (including VUT results) todraw on for such an estimate. The questionarises as to which risk assessmentmethodology should be used.
The most sensitive organism tested in theprogram was the scallop larva, which gave aNOEC of 0.5% or 200 times dilution. However,some authorities believe that a further safetyfactor is desirable. Stauber et al. (1998) usedtwo additional approaches, one depending onthe range of EC50 results from chronic testsand the other on NOEC results from all tests.The former gives a required dilution of up to333. The latter gives a dilution of 250 forprotection of 95% of species with 50%confidence. Based on experimental data, theysuggest a compromise figure of 300 timesdilution for no significant measurable effect.
The hydrodynamic model of plume dispersionwas used to generate contours of effluentconcentration from the present outfall(Andrewartha et al. 1998). The shape of theplume is highly variable, depending on localmeteorological and oceanographic conditions,
40
Environmental Impact Assessment and Review of Effluent Disposal Options for Eastern Treatment Plant
sometimes moving longshore as a discreteband, other times moving offshore. Withonshore winds the effluent tends to ‘pool’along the coast.
Taking two simulations made for March andJune 1997, validated with MAFRI underwaysurveys, it would seem that the 1:300 dilutioncontour at the coast occurred about 3kmnorthwest and 4km southeast of the outfall on18th March and about 2km northwest and 6kmsoutheast on 20th June. Model simulationscommonly show exposure to effluent dilutionsless than 300:1 over a distance of about 4 - 5kmeither side of the outfall along the coast, withsome bias towards the south-east. Lowerdilutions (higher effluent concentrations) andmore frequent exposure occur closer to theoutfall.
To gain a better understanding of whatsubstance (or substances) present in theeffluent is causing the toxicity, MonashUniversity and CSIRO carried out furtherexperiments. Monash University researchersconducted Hormosira banksii reference toxicantexperiments using ammonia, phenol, chlorineand a surfactant to explain the measuredtoxicity. From their limited results it was clearthat ammonia was one of the principalsubstances creating a toxic impact.
The US EPA has recently pioneered marineToxicity Identification Evaluation (TIE) teststhat can provide clearer understanding of whatcauses toxicity. TIE is a three phase approachthat combines toxicity tests withchemical/physical manipulations to identifyspecific toxicants in complex effluents. Basedon the US EPA procedures, CSIRO havedeveloped TIE tests using the diatom, Nitzschiaclosterium.
In September 1998, TIE tests were carried outusing ETP effluent. The results (Stauber et al.1999) indicate that the majority of toxicity iscaused by ammonia, however an unidentifiednon-polar organic may also be involved.Toxicity was not due to particulate matter,
volatiles, hydrogen sulfide, metals, surfactants,oxidants such as chlorine, phthalates, PAHs,organochlorine or organophosphate pesticides.
Reference has been made to the freshwaterimpact of the effluent. Considerable work hasbeen carried out on this aspect at MonashUniversity and was continued under thisStudy. There is a very profound synergismbetween salinity and effluent toxicity as shownin Fig. 3.12. The findings from the spring seriesof tests were consistent for all three bioassaysused and provided similar results to thoseobtained during winter, summer and autumn(Kevekordes 1998b).
Fig. 3.12 shows results from exposure ofHormosira banksii fertilised eggs to fivesolutions of varying mixes of seawater andeffluent. SC34 and S34 are control solutionsmade from artificial seawater and having noeffluent. S21 is also made from artificialseawater but it is diluted with UHQ water to asalinity of 21%°. This level of salinityapproximates that found immediately adjacentto the existing outfall, which is a result of a40% effluent and 60% seawater mix. E34 is 40%effluent mixed with 60% seawater with saltadded to reach normal seawater salinity of34%°. E21 is 40% effluent mixed with 60%seawater giving the solution a salinity of 21%°.
Alone, salinity reduction reduced macroalgalgermination and growth by about a third.Effluent adjusted to seawater salinity (34%°)was even more toxic, reducing macroalgalgermination and growth by about threequarters. This reduction was due to chemicaltoxicity of the effluent e.g ammonia. Acombination of effluent and low salinitycompletely depressed macroalgal germinationand growth. The results show that acombination of effluent and low salinity hasthe most depressing effect on macroalgalgermination and growth.
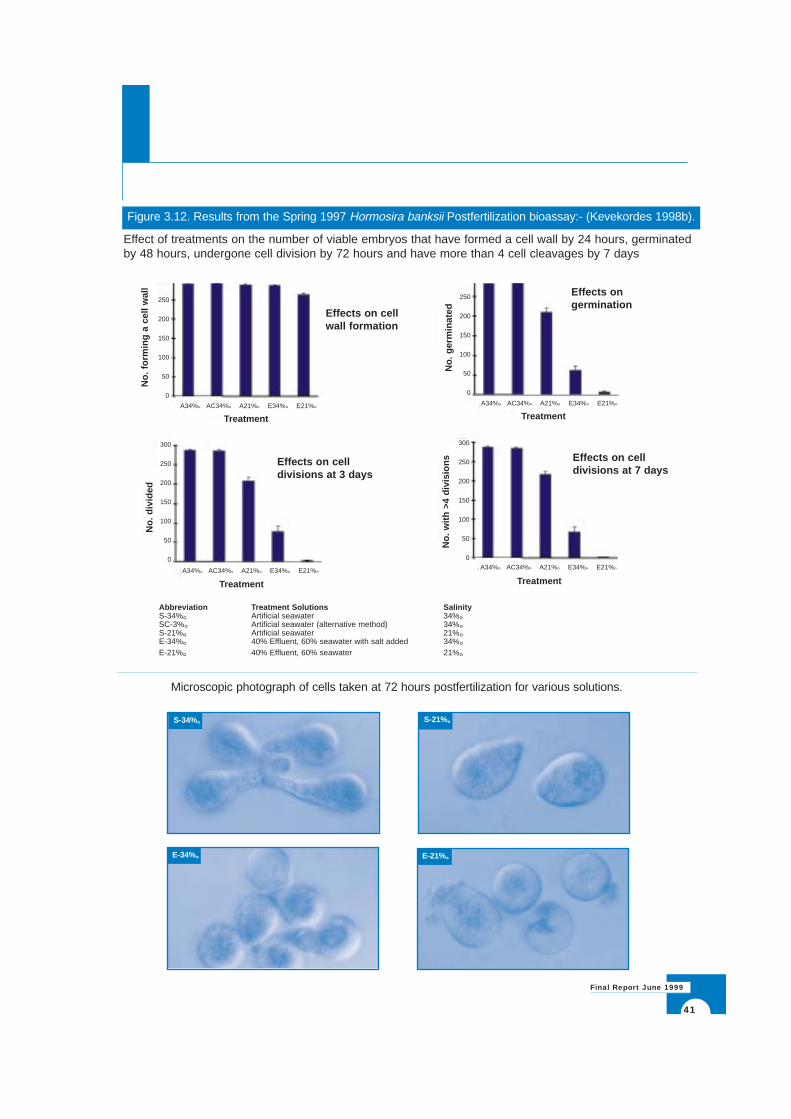
41
Final Report June 1999
Figure 3.12. Results from the Spring 1997 Hormosira banksii Postfertilization bioassay:- (Kevekordes 1998b).
Abbreviation Treatment Solutions SalinityS-34%° Artificial seawater 34%°SC-3%° Artificial seawater (alternative method) 34%°S-21%° Artificial seawater 21%°E-34%° 40% Effluent, 60% seawater with salt added 34%°E-21%° 40% Effluent, 60% seawater 21%°
Effects on cell divisions at 3 days
Effects on cell divisions at 7 days
Effects on cellwall formation
Effects on germination
Effect of treatments on the number of viable embryos that have formed a cell wall by 24 hours, germinatedby 48 hours, undergone cell division by 72 hours and have more than 4 cell cleavages by 7 days
E-21%°E-34%°
S-21%°S-34%°
Microscopic photograph of cells taken at 72 hours postfertilization for various solutions.
No.
form
ing
a ce
ll w
all
No.
div
ided
No.
ger
min
ated
No.
with
>4
divi
sion
s
Treatment
Treatment
Treatment
TreatmentA34%° AC34%° A21%° E34%° E21%°
A34%° AC34%° A21%° E34%° E21%°
A34%° AC34%° A21%° E34%° E21%°A34%° AC34%° A21%° E34%° E21%°
250
200
150
100
50
0
250
200
150
100
50
0
300
250
200
150
100
50
0
300
250
200
150
100
50
0
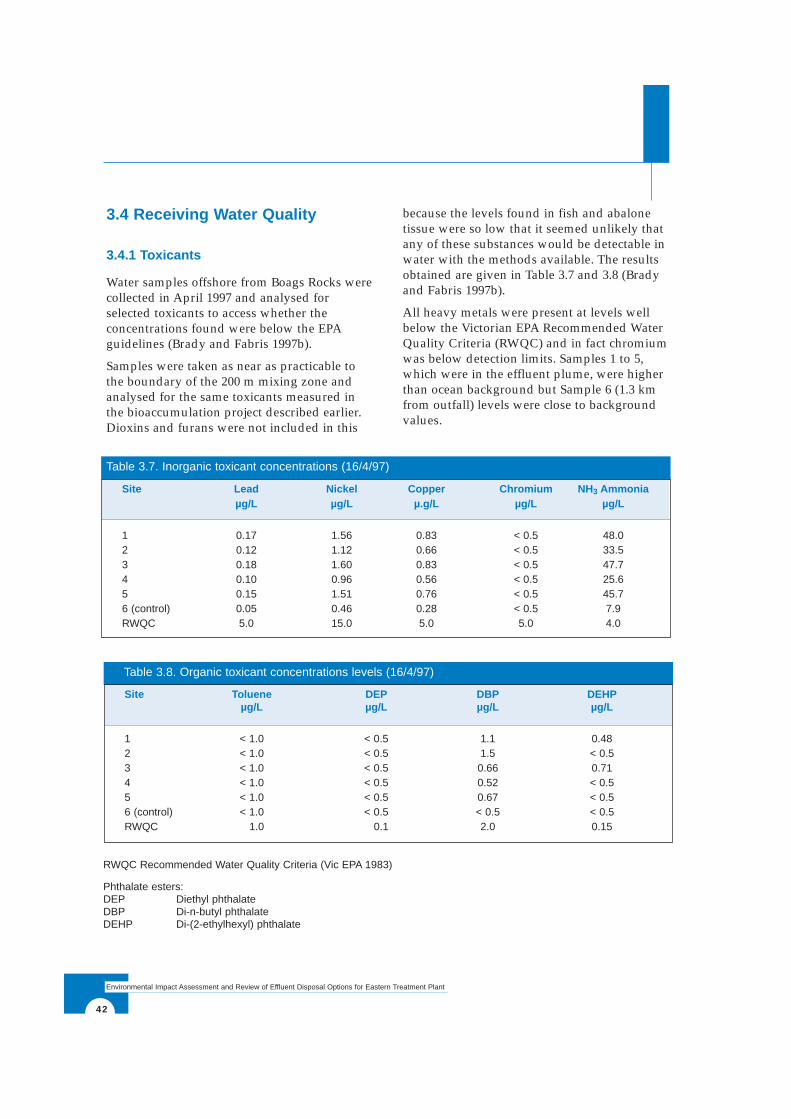
42
Environmental Impact Assessment and Review of Effluent Disposal Options for Eastern Treatment Plant
3.4 Receiving Water Quality
3.4.1 Toxicants
Water samples offshore from Boags Rocks werecollected in April 1997 and analysed forselected toxicants to access whether theconcentrations found were below the EPAguidelines (Brady and Fabris 1997b).
Samples were taken as near as practicable tothe boundary of the 200 m mixing zone andanalysed for the same toxicants measured inthe bioaccumulation project described earlier.Dioxins and furans were not included in this
because the levels found in fish and abalonetissue were so low that it seemed unlikely thatany of these substances would be detectable inwater with the methods available. The resultsobtained are given in Table 3.7 and 3.8 (Bradyand Fabris 1997b).
All heavy metals were present at levels wellbelow the Victorian EPA Recommended WaterQuality Criteria (RWQC) and in fact chromiumwas below detection limits. Samples 1 to 5,which were in the effluent plume, were higherthan ocean background but Sample 6 (1.3 kmfrom outfall) levels were close to backgroundvalues.
Table 3.7. Inorganic toxicant concentrations (16/4/97)
Site Lead Nickel Copper Chromium NH 3 Ammonia µg/L µg/L µ.g/L µg/L µg/L
1 0.17 1.56 0.83 < 0.5 48.02 0.12 1.12 0.66 < 0.5 33.53 0.18 1.60 0.83 < 0.5 47.74 0.10 0.96 0.56 < 0.5 25.65 0.15 1.51 0.76 < 0.5 45.76 (control) 0.05 0.46 0.28 < 0.5 7.9RWQC 5.0 15.0 5.0 5.0 4.0
Table 3.8. Organic toxicant concentrations levels (16/4/97)
Site Toluene DEP DBP DEHPµg/L µg/L µg/L µg/L
1 < 1.0 < 0.5 1.1 0.482 < 1.0 < 0.5 1.5 < 0.53 < 1.0 < 0.5 0.66 0.714 < 1.0 < 0.5 0.52 < 0.55 < 1.0 < 0.5 0.67 < 0.56 (control) < 1.0 < 0.5 < 0.5 < 0.5RWQC 1.0 0.1 2.0 0.15
RWQC Recommended Water Quality Criteria (Vic EPA 1983)
Phthalate esters:DEP Diethyl phthalateDBP Di-n-butyl phthalateDEHP Di-(2-ethylhexyl) phthalate
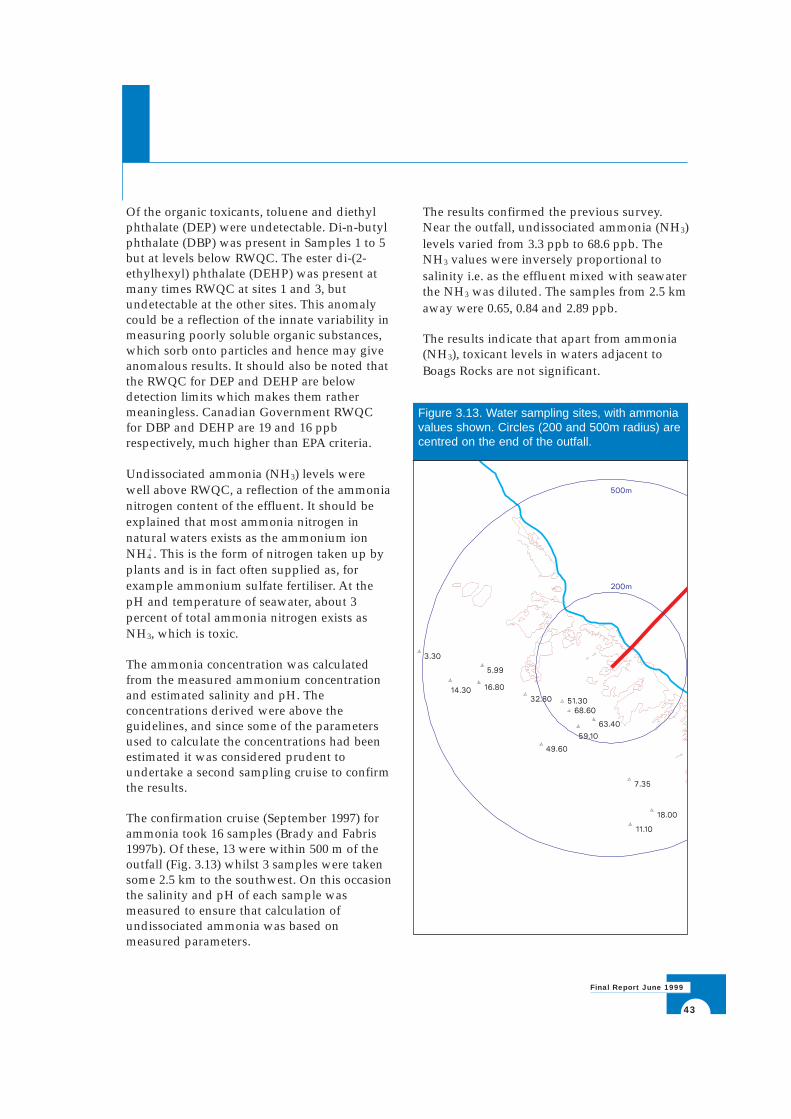
43
Final Report June 1999
Of the organic toxicants, toluene and diethylphthalate (DEP) were undetectable. Di-n-butylphthalate (DBP) was present in Samples 1 to 5but at levels below RWQC. The ester di-(2-ethylhexyl) phthalate (DEHP) was present atmany times RWQC at sites 1 and 3, butundetectable at the other sites. This anomalycould be a reflection of the innate variability inmeasuring poorly soluble organic substances,which sorb onto particles and hence may giveanomalous results. It should also be noted thatthe RWQC for DEP and DEHP are belowdetection limits which makes them rathermeaningless. Canadian Government RWQCfor DBP and DEHP are 19 and 16 ppbrespectively, much higher than EPA criteria.
Undissociated ammonia (NH3) levels werewell above RWQC, a reflection of the ammonianitrogen content of the effluent. It should beexplained that most ammonia nitrogen innatural waters exists as the ammonium ionNH4
+ . This is the form of nitrogen taken up byplants and is in fact often supplied as, forexample ammonium sulfate fertiliser. At thepH and temperature of seawater, about 3percent of total ammonia nitrogen exists asNH3, which is toxic.
The ammonia concentration was calculatedfrom the measured ammonium concentrationand estimated salinity and pH. Theconcentrations derived were above theguidelines, and since some of the parametersused to calculate the concentrations had beenestimated it was considered prudent toundertake a second sampling cruise to confirmthe results.
The confirmation cruise (September 1997) forammonia took 16 samples (Brady and Fabris1997b). Of these, 13 were within 500 m of theoutfall (Fig. 3.13) whilst 3 samples were takensome 2.5 km to the southwest. On this occasionthe salinity and pH of each sample wasmeasured to ensure that calculation ofundissociated ammonia was based onmeasured parameters.
The results confirmed the previous survey.Near the outfall, undissociated ammonia (NH3)levels varied from 3.3 ppb to 68.6 ppb. TheNH3 values were inversely proportional tosalinity i.e. as the effluent mixed with seawaterthe NH3 was diluted. The samples from 2.5 kmaway were 0.65, 0.84 and 2.89 ppb.
The results indicate that apart from ammonia(NH3), toxicant levels in waters adjacent toBoags Rocks are not significant.
Figure 3.13. Water sampling sites, with ammoniavalues shown. Circles (200 and 500m radius) arecentred on the end of the outfall.
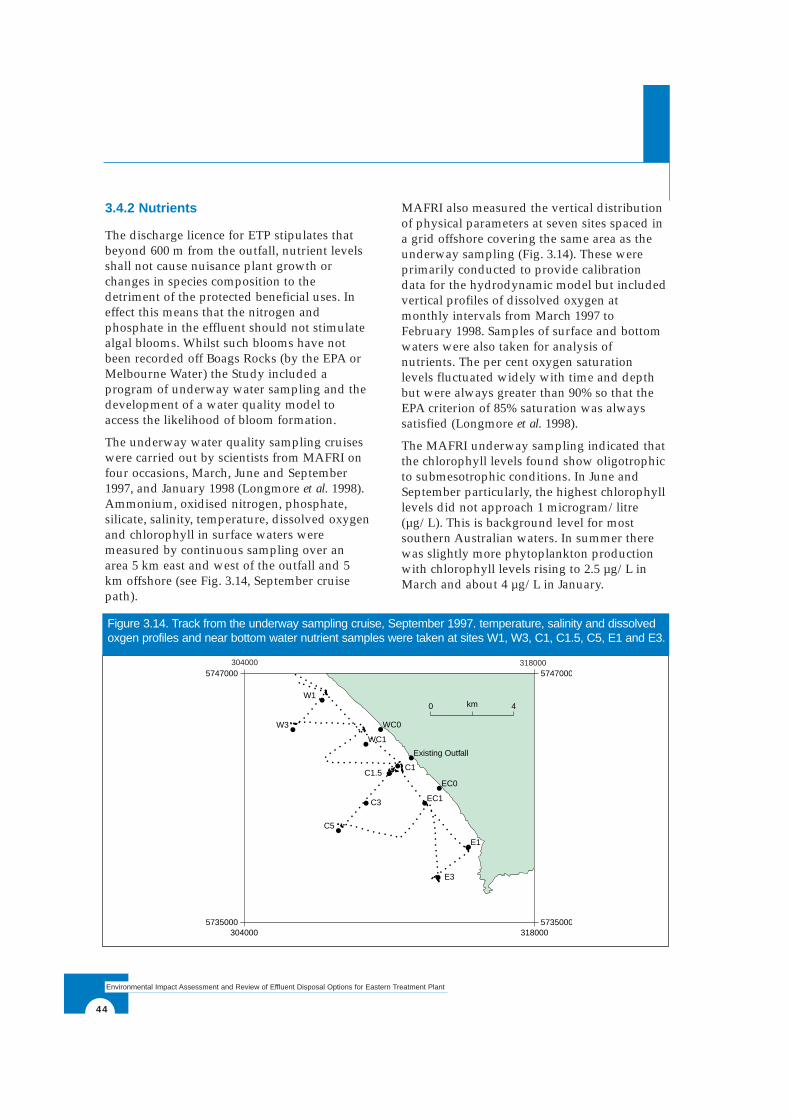
44
Environmental Impact Assessment and Review of Effluent Disposal Options for Eastern Treatment Plant
3.4.2 Nutrients
The discharge licence for ETP stipulates thatbeyond 600 m from the outfall, nutrient levelsshall not cause nuisance plant growth orchanges in species composition to thedetriment of the protected beneficial uses. Ineffect this means that the nitrogen andphosphate in the effluent should not stimulatealgal blooms. Whilst such blooms have notbeen recorded off Boags Rocks (by the EPA orMelbourne Water) the Study included aprogram of underway water sampling and thedevelopment of a water quality model toaccess the likelihood of bloom formation.
The underway water quality sampling cruiseswere carried out by scientists from MAFRI onfour occasions, March, June and September1997, and January 1998 (Longmore et al. 1998).Ammonium, oxidised nitrogen, phosphate,silicate, salinity, temperature, dissolved oxygenand chlorophyll in surface waters weremeasured by continuous sampling over anarea 5 km east and west of the outfall and 5km offshore (see Fig. 3.14, September cruisepath).
MAFRI also measured the vertical distributionof physical parameters at seven sites spaced ina grid offshore covering the same area as theunderway sampling (Fig. 3.14). These wereprimarily conducted to provide calibrationdata for the hydrodynamic model but includedvertical profiles of dissolved oxygen atmonthly intervals from March 1997 toFebruary 1998. Samples of surface and bottomwaters were also taken for analysis ofnutrients. The per cent oxygen saturationlevels fluctuated widely with time and depthbut were always greater than 90% so that theEPA criterion of 85% saturation was alwayssatisfied (Longmore et al. 1998).
The MAFRI underway sampling indicated thatthe chlorophyll levels found show oligotrophicto submesotrophic conditions. In June andSeptember particularly, the highest chlorophylllevels did not approach 1 microgram/litre(µg/L). This is background level for mostsouthern Australian waters. In summer therewas slightly more phytoplankton productionwith chlorophyll levels rising to 2.5 µg/L inMarch and about 4 µg/L in January.
304000 318000
304000 318000
5735000
5747000
5735000
5747000
Existing Outfall
C1C1.5
C3
C5
W1
W3
E1
E3
WC0
WC1
EC0
EC1
0 4km
Figure 3.14. Track from the underway sampling cruise, September 1997. temperature, salinity and dissolvedoxgen profiles and near bottom water nutrient samples were taken at sites W1, W3, C1, C1.5, C5, E1 and E3.
304000 318000
45
Final Report June 1999
The zone off Boags Rocks behaves somewhatlike an estuary with a high nutrient freshwaterinput mixing conservatively with a lownutrient high salinity receiving water. Ifammonium, nitrate, phosphate or silicatevalues are plotted against salinity for any ofthe four surveys, a linear (straight line)relationship is observed. The relationship ofchlorophyll to salinity is linear at low salinitiesindicating little or no primary productionduring mixing. Once the high backgroundsalinities are reached, however, chlorophyllvalues show considerable variation suggestingpatchy primary production.
The MMBW carried out nutrient monitoringlongshore from 1974 to 1979 with furthermonitoring in 1987 - 88. The Marine ChemistryUnit of the Ministry for Conservation alsomeasured nutrients and chlorophyll in 1976.Most of this material was reviewed by theVictorian Institute of Marine Science (Blackand Hatton 1994) and by Camp, Scott Furphyand Consulting Environment Engineers (1992).Their purpose, however, was mainly todelineate plume mixing patterns. No one hasyet examined secular trends so that we do notknow how the increase in volume, from 140ML/day to the present 390 ML/day orchanges in effluent composition, have affectedthe shape of the plume or contours of nutrientconcentration.
Plots of salinity contours show that the licencerequirement that total dissolved solids (TDS)levels should not deviate by more than 5%from background beyond 900m offshore,1.7km to the west and 2.3km to the east cannotbe met exactly because the plume does notdiffuse uniformly through such an envelope.Rather, a core of lower salinity water movesback and forth mixing laterally and occupyingless area than the above envelope.
A water quality model based on thehydrodynamic model (Murray and Parslow1998) predicts elevated concentrations ofdissolved inorganic nitrogen (ammonium andnitrate), exceeding 5 µM, over a region
extending up to several kilometres either sideof, and offshore from, the outfall. Thesenutrient concentrations are sufficient topotentially support dense phytoplanktonblooms, and/or to modify benthic plantcommunities. Because nutrients behaveapproximately conservatively at highconcentrations, the predicted concentrations(supported by MAFRI’s observations) dependonly on the dilution factors predicted by thehydrodynamic model.
The hydrodynamic model showed that theeffective flushing time of the extended regionaround the outfall varies with wind conditions,but periods of low flushing, sufficient to allowphytoplankton blooms to develop, occur on asemi-regular basis. The water quality modelcan only reproduce the low chlorophyllconcentrations observed by MAFRI (Longmoreet al. 1998) by assuming tight coupling ofzooplankton grazing with phytoplanktongrowth, suggesting that phytoplankton may bedominated by smaller cells susceptible tograzing. Diatom blooms may not occurbecause silicate concentrations in the effluentare low relative to nitrogen and phosphorous.The observed spatial distribution ofchlorophyll also suggests a delay or inhibitionof phytoplankton growth in the vicinity of theoutfall.
Because these elevated nutrient concentrationsoccur over a region extending severalkilometres from the outfall (out to dilutions ofabout 400:1), the risk of algal blooms wouldnot be significantly modified by outfallextensions in the order of 1 to 3 km in length.Extending the outfall further out to sea and toa deeper depth would be a substantially largerproject than the one discussed later in thisreport.
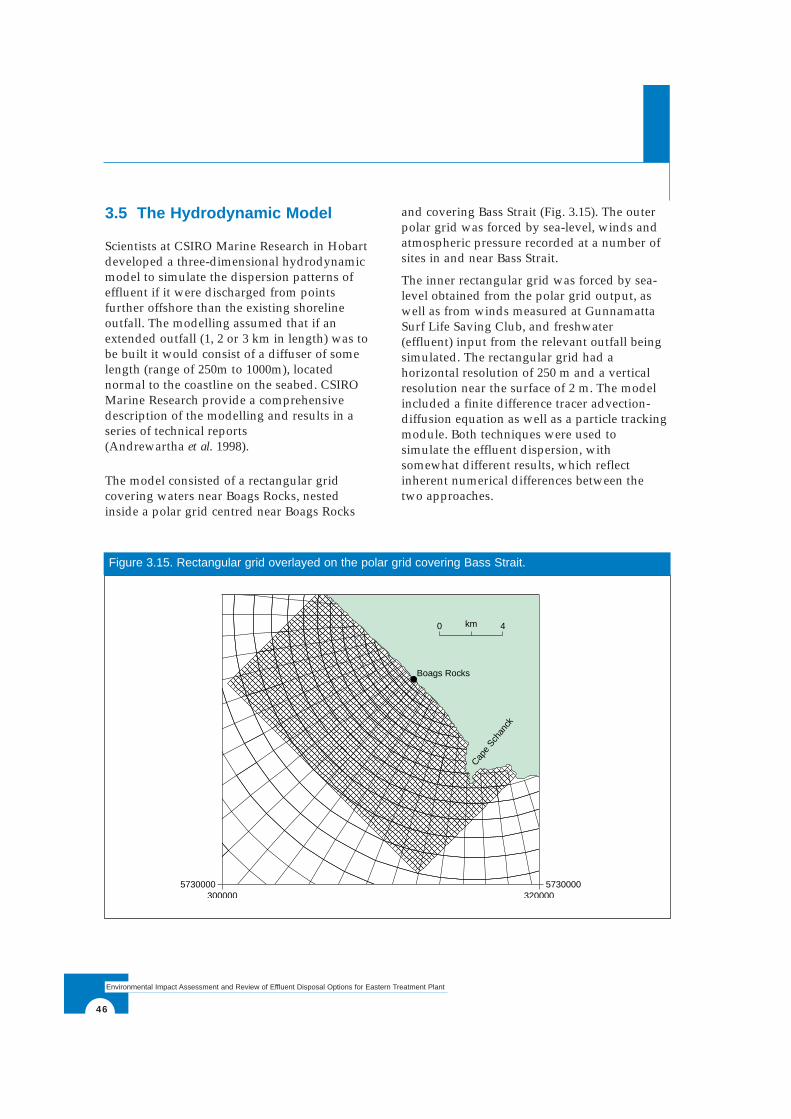
46
Environmental Impact Assessment and Review of Effluent Disposal Options for Eastern Treatment Plant
3.5 The Hydrodynamic Model
Scientists at CSIRO Marine Research in Hobartdeveloped a three-dimensional hydrodynamicmodel to simulate the dispersion patterns ofeffluent if it were discharged from pointsfurther offshore than the existing shorelineoutfall. The modelling assumed that if anextended outfall (1, 2 or 3 km in length) was tobe built it would consist of a diffuser of somelength (range of 250m to 1000m), locatednormal to the coastline on the seabed. CSIROMarine Research provide a comprehensivedescription of the modelling and results in aseries of technical reports(Andrewartha et al. 1998).
The model consisted of a rectangular gridcovering waters near Boags Rocks, nestedinside a polar grid centred near Boags Rocks
and covering Bass Strait (Fig. 3.15). The outerpolar grid was forced by sea-level, winds andatmospheric pressure recorded at a number ofsites in and near Bass Strait.
The inner rectangular grid was forced by sea-level obtained from the polar grid output, aswell as from winds measured at GunnamattaSurf Life Saving Club, and freshwater(effluent) input from the relevant outfall beingsimulated. The rectangular grid had ahorizontal resolution of 250 m and a verticalresolution near the surface of 2 m. The modelincluded a finite difference tracer advection-diffusion equation as well as a particle trackingmodule. Both techniques were used tosimulate the effluent dispersion, withsomewhat different results, which reflectinherent numerical differences between thetwo approaches.
300000 3200005730000 5730000
Boags Rocks
Cape
Schan
ck
0 4km
Figure 3.15. Rectangular grid overlayed on the polar grid covering Bass Strait.
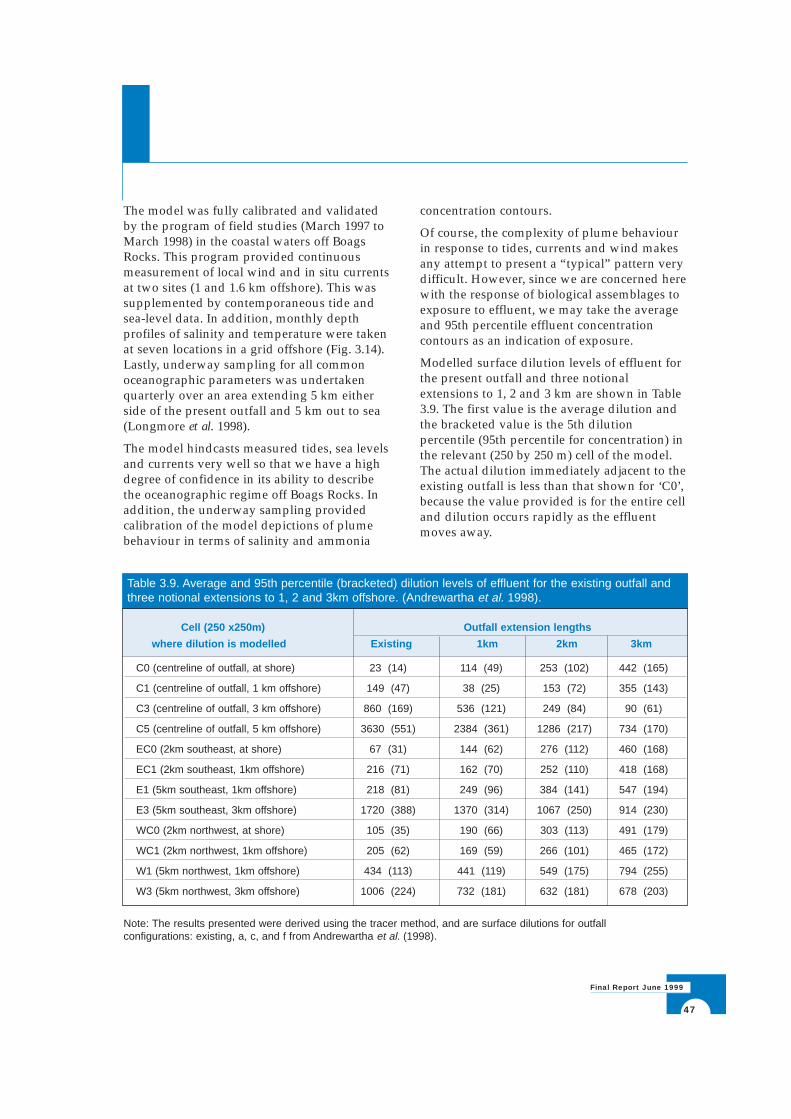
47
Final Report June 1999
The model was fully calibrated and validatedby the program of field studies (March 1997 toMarch 1998) in the coastal waters off BoagsRocks. This program provided continuousmeasurement of local wind and in situ currentsat two sites (1 and 1.6 km offshore). This wassupplemented by contemporaneous tide andsea-level data. In addition, monthly depthprofiles of salinity and temperature were takenat seven locations in a grid offshore (Fig. 3.14).Lastly, underway sampling for all commonoceanographic parameters was undertakenquarterly over an area extending 5 km eitherside of the present outfall and 5 km out to sea(Longmore et al. 1998).
The model hindcasts measured tides, sea levelsand currents very well so that we have a highdegree of confidence in its ability to describethe oceanographic regime off Boags Rocks. Inaddition, the underway sampling providedcalibration of the model depictions of plumebehaviour in terms of salinity and ammonia
concentration contours.
Of course, the complexity of plume behaviourin response to tides, currents and wind makesany attempt to present a “typical” pattern verydifficult. However, since we are concerned herewith the response of biological assemblages toexposure to effluent, we may take the averageand 95th percentile effluent concentrationcontours as an indication of exposure.
Modelled surface dilution levels of effluent forthe present outfall and three notionalextensions to 1, 2 and 3 km are shown in Table3.9. The first value is the average dilution andthe bracketed value is the 5th dilutionpercentile (95th percentile for concentration) inthe relevant (250 by 250 m) cell of the model.The actual dilution immediately adjacent to theexisting outfall is less than that shown for ‘C0’,because the value provided is for the entire celland dilution occurs rapidly as the effluentmoves away.
Table 3.9. Average and 95th percentile (bracketed) dilution levels of effluent for the existing outfall andthree notional extensions to 1, 2 and 3km offshore. (Andrewartha et al. 1998).
Cell (250 x250m) Outfall extension lengths
where dilution is modelled Existing 1km 2km 3km
C0 (centreline of outfall, at shore) 23 (14) 114 (49) 253 (102) 442 (165)
C1 (centreline of outfall, 1 km offshore) 149 (47) 38 (25) 153 (72) 355 (143)
C3 (centreline of outfall, 3 km offshore) 860 (169) 536 (121) 249 (84) 90 (61)
C5 (centreline of outfall, 5 km offshore) 3630 (551) 2384 (361) 1286 (217) 734 (170)
EC0 (2km southeast, at shore) 67 (31) 144 (62) 276 (112) 460 (168)
EC1 (2km southeast, 1km offshore) 216 (71) 162 (70) 252 (110) 418 (168)
E1 (5km southeast, 1km offshore) 218 (81) 249 (96) 384 (141) 547 (194)
E3 (5km southeast, 3km offshore) 1720 (388) 1370 (314) 1067 (250) 914 (230)
WC0 (2km northwest, at shore) 105 (35) 190 (66) 303 (113) 491 (179)
WC1 (2km northwest, 1km offshore) 205 (62) 169 (59) 266 (101) 465 (172)
W1 (5km northwest, 1km offshore) 434 (113) 441 (119) 549 (175) 794 (255)
W3 (5km northwest, 3km offshore) 1006 (224) 732 (181) 632 (181) 678 (203)
Note: The results presented were derived using the tracer method, and are surface dilutions for outfallconfigurations: existing, a, c, and f from Andrewartha et al. (1998).
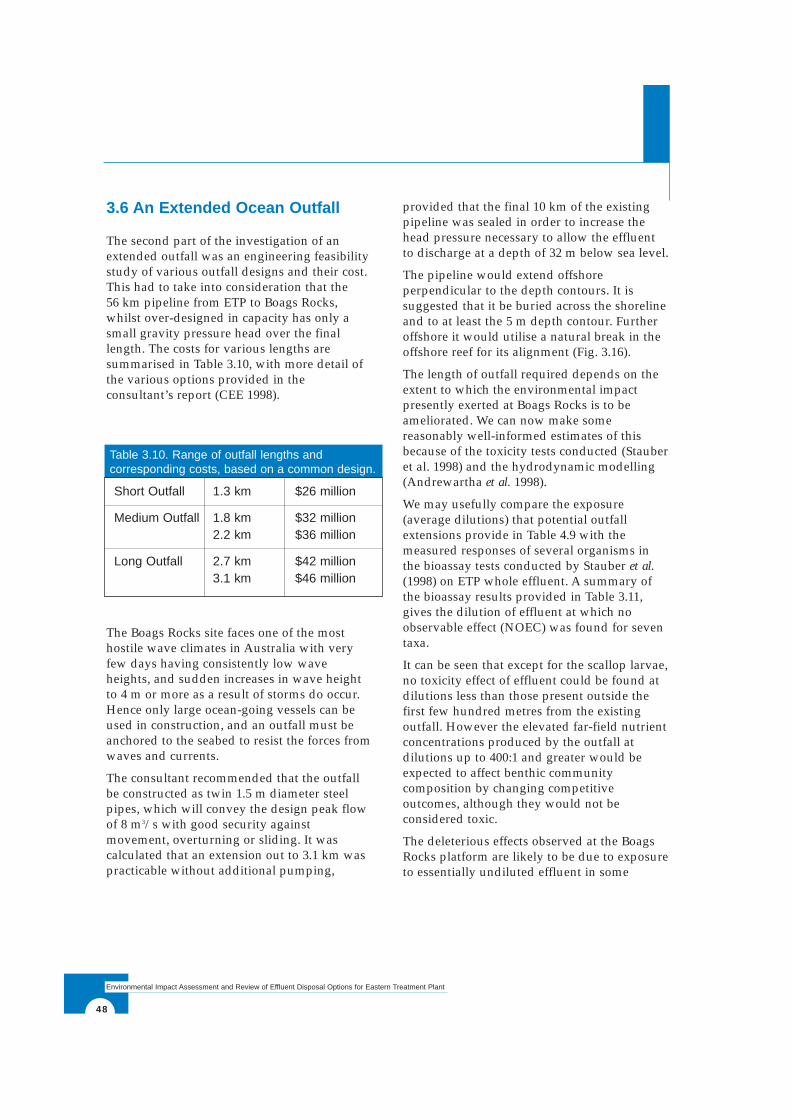
3.6 An Extended Ocean Outfall
The second part of the investigation of anextended outfall was an engineering feasibilitystudy of various outfall designs and their cost.This had to take into consideration that the 56 km pipeline from ETP to Boags Rocks,whilst over-designed in capacity has only asmall gravity pressure head over the finallength. The costs for various lengths aresummarised in Table 3.10, with more detail ofthe various options provided in theconsultant’s report (CEE 1998).
The Boags Rocks site faces one of the mosthostile wave climates in Australia with veryfew days having consistently low waveheights, and sudden increases in wave heightto 4 m or more as a result of storms do occur.Hence only large ocean-going vessels can beused in construction, and an outfall must beanchored to the seabed to resist the forces fromwaves and currents.
The consultant recommended that the outfallbe constructed as twin 1.5 m diameter steelpipes, which will convey the design peak flowof 8 m3/s with good security againstmovement, overturning or sliding. It wascalculated that an extension out to 3.1 km waspracticable without additional pumping,
provided that the final 10 km of the existingpipeline was sealed in order to increase thehead pressure necessary to allow the effluentto discharge at a depth of 32 m below sea level.
The pipeline would extend offshoreperpendicular to the depth contours. It issuggested that it be buried across the shorelineand to at least the 5 m depth contour. Furtheroffshore it would utilise a natural break in theoffshore reef for its alignment (Fig. 3.16).
The length of outfall required depends on theextent to which the environmental impactpresently exerted at Boags Rocks is to beameliorated. We can now make somereasonably well-informed estimates of thisbecause of the toxicity tests conducted (Stauberet al. 1998) and the hydrodynamic modelling(Andrewartha et al. 1998).
We may usefully compare the exposure(average dilutions) that potential outfallextensions provide in Table 4.9 with themeasured responses of several organisms inthe bioassay tests conducted by Stauber et al.(1998) on ETP whole effluent. A summary ofthe bioassay results provided in Table 3.11,gives the dilution of effluent at which noobservable effect (NOEC) was found for seventaxa.
It can be seen that except for the scallop larvae,no toxicity effect of effluent could be found atdilutions less than those present outside thefirst few hundred metres from the existingoutfall. However the elevated far-field nutrientconcentrations produced by the outfall atdilutions up to 400:1 and greater would beexpected to affect benthic communitycomposition by changing competitiveoutcomes, although they would not beconsidered toxic.
The deleterious effects observed at the BoagsRocks platform are likely to be due to exposureto essentially undiluted effluent in some
48
Environmental Impact Assessment and Review of Effluent Disposal Options for Eastern Treatment Plant
Table 3.10. Range of outfall lengths andcorresponding costs, based on a common design.
Short Outfall 1.3 km $26 million
Medium Outfall 1.8 km $32 million2.2 km $36 million
Long Outfall 2.7 km $42 million3.1 km $46 million
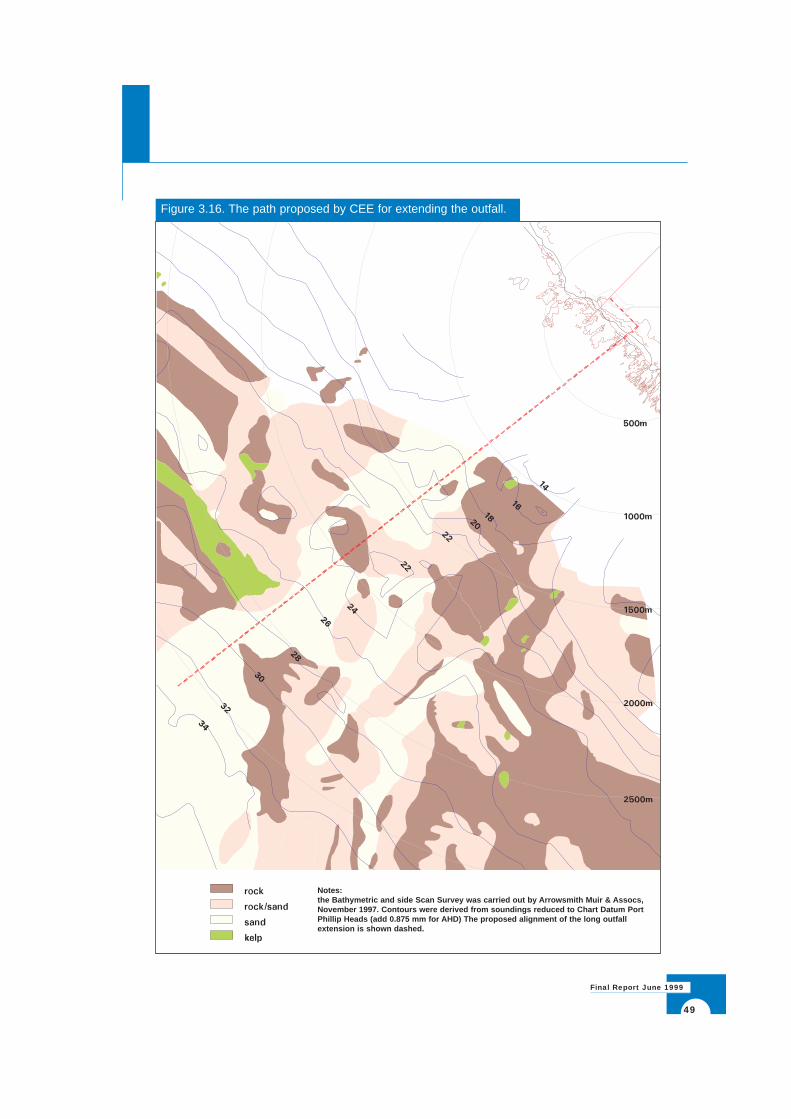
49
Final Report June 1999
Figure 3.16. The path proposed by CEE for extending the outfall.
Notes: the Bathymetric and side Scan Survey was carried out by Arrowsmith Muir & Assocs,November 1997. Contours were derived from soundings reduced to Chart Datum PortPhillip Heads (add 0.875 mm for AHD) The proposed alignment of the long outfallextension is shown dashed.
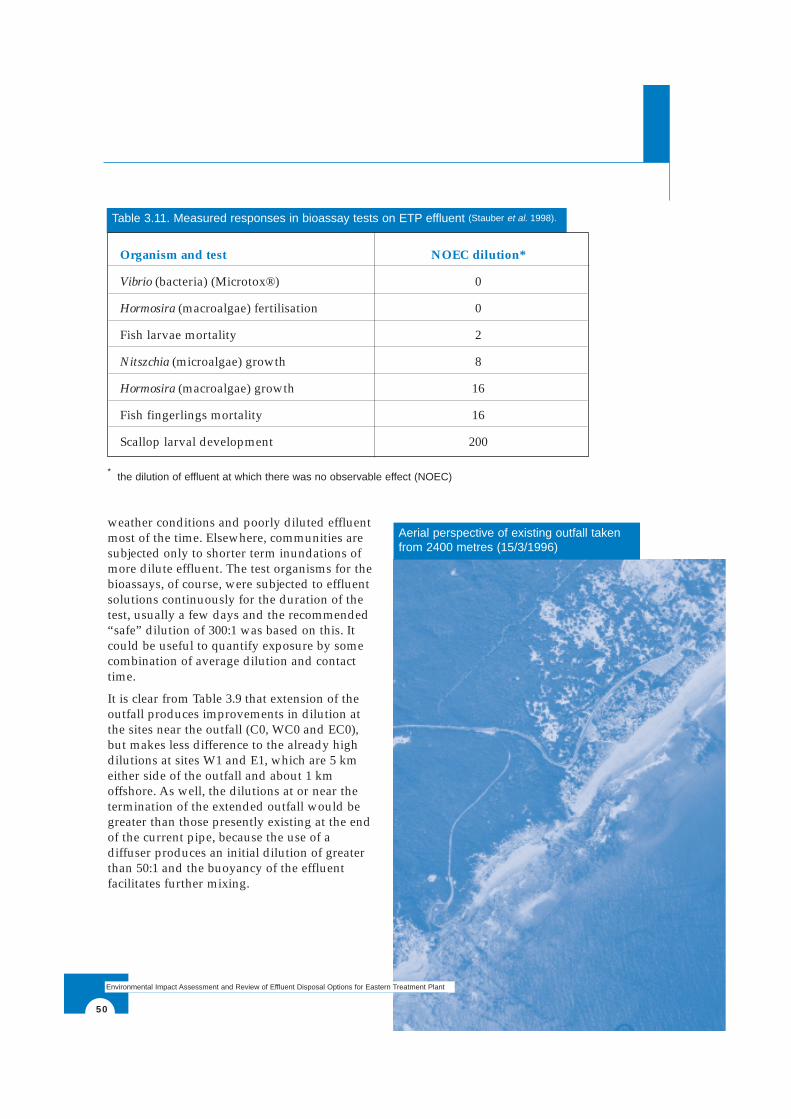
50
Environmental Impact Assessment and Review of Effluent Disposal Options for Eastern Treatment Plant
weather conditions and poorly diluted effluentmost of the time. Elsewhere, communities aresubjected only to shorter term inundations ofmore dilute effluent. The test organisms for thebioassays, of course, were subjected to effluentsolutions continuously for the duration of thetest, usually a few days and the recommended“safe” dilution of 300:1 was based on this. Itcould be useful to quantify exposure by somecombination of average dilution and contacttime.
It is clear from Table 3.9 that extension of theoutfall produces improvements in dilution atthe sites near the outfall (C0, WC0 and EC0),but makes less difference to the already highdilutions at sites W1 and E1, which are 5 kmeither side of the outfall and about 1 kmoffshore. As well, the dilutions at or near thetermination of the extended outfall would begreater than those presently existing at the endof the current pipe, because the use of adiffuser produces an initial dilution of greaterthan 50:1 and the buoyancy of the effluentfacilitates further mixing.
Table 3.11. Measured responses in bioassay tests on ETP effluent (Stauber et al. 1998).
Organism and test NOEC dilution*
Vibrio (bacteria) (Microtox®) 0
Hormosira (macroalgae) fertilisation 0
Fish larvae mortality 2
Nitszchia (microalgae) growth 8
Hormosira (macroalgae) growth 16
Fish fingerlings mortality 16
Scallop larval development 200
* the dilution of effluent at which there was no observable effect (NOEC)
Aerial perspective of existing outfall takenfrom 2400 metres (15/3/1996)
51
Final Report June 1999
3.7 Effluent Flow Reduction (Re-use) Study
CSIRO Land and Water in conjunction withGutteridge, Haskins and Davey P/L.,undertook an investigation of 14 possibleapproaches to volume reduction (Gomboso etal. 1998). Of these, 6 were concerned withreduced input to ETP and 8 with alternativedisposal paths for treated effluent from theplant.
The investigation covered engineeringfeasibility, cost, environmental impact, socialacceptance, commercial aspects, governmentpolicy and quantitative contribution.
The fourteen options could be ranked in orderof this latter aspect as percentage reduction inflow or in order of cost but this rather
simplistic approach concealed other importantfactors listed above. In the end it proved mosteffective to list options in order of cost, sincethis largely governs practicability, and thenexamine each option in the light of the otherfactors. The options investigated are listed inTable 3.12.
In order to derive a comparative cost basis, allcapital, operating, maintenance and/orreplacement costs were calculated over a 30year period. Total costs were then discountedto the beginning of year 1 using a real discountrate of 7% to give a Net Present Value (NPV)for each option. The NPV was then amortisedto give an equivalent annuity over the 30 yearperiod again using a 7% discount rate. Thisannuity was then divided by the flowreduction achieved to give relative cost perkilolitre.
Table 3.12. Effluent re-use and influent flow reduction and re-use options investigated and costed(Gomboso et al. 1998).
Option Cost* ($/kL) Volume reduction (%)
Water demand management 0.10 1-12
Industrial use of reclaimed water 0.16 < 1
Land Irrigation 0.20 8-10
Aquifer storage (Bridgewater) 0.31 10-20
Diversion to Western Treatment Plant 0.34 1-12
Indirect potable re-use (Cardinia Reservoir) 0.39 ~~ 95
Woodlots irrigation 0.42 2
Constructed wetlands 0.59 2-2.5
Detention/sewer mining with local re-use 0.66 0.2
Untreated greywater use 0.72 < 1
Non-potable new lots (third pipe) 0.99 5
Sewer inflow/infiltration reduction 1.93 6
Non-potable retrofit (third pipe) 1.99 5
Treated greywater use 9.86 < 1
*Costs were discounted to the beginning of year 1 (7% discount rate) to give NPV, which was then amortised to giveequivalent annuity over 30 year period (7% discount rate) then divided by flow reduction to give cost/kL.
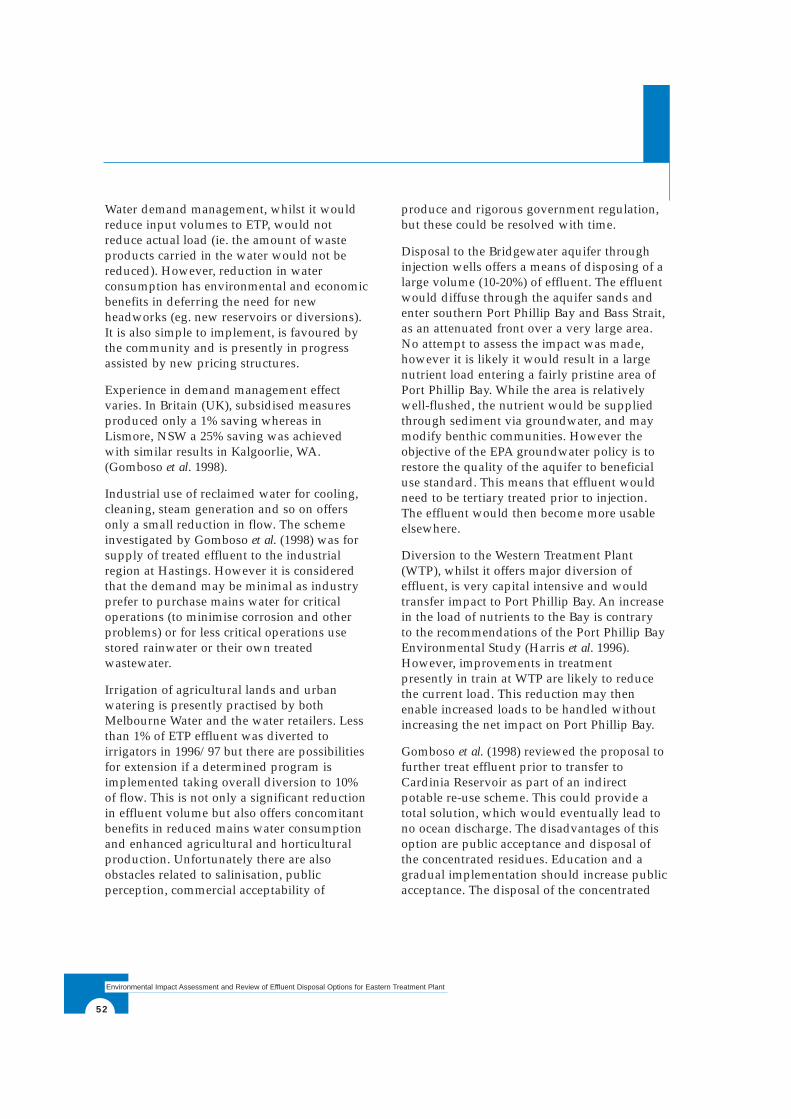
52
Environmental Impact Assessment and Review of Effluent Disposal Options for Eastern Treatment Plant
Water demand management, whilst it wouldreduce input volumes to ETP, would notreduce actual load (ie. the amount of wasteproducts carried in the water would not bereduced). However, reduction in waterconsumption has environmental and economicbenefits in deferring the need for newheadworks (eg. new reservoirs or diversions).It is also simple to implement, is favoured bythe community and is presently in progressassisted by new pricing structures.
Experience in demand management effectvaries. In Britain (UK), subsidised measuresproduced only a 1% saving whereas inLismore, NSW a 25% saving was achievedwith similar results in Kalgoorlie, WA.(Gomboso et al. 1998).
Industrial use of reclaimed water for cooling,cleaning, steam generation and so on offersonly a small reduction in flow. The schemeinvestigated by Gomboso et al. (1998) was forsupply of treated effluent to the industrialregion at Hastings. However it is consideredthat the demand may be minimal as industryprefer to purchase mains water for criticaloperations (to minimise corrosion and otherproblems) or for less critical operations usestored rainwater or their own treatedwastewater.
Irrigation of agricultural lands and urbanwatering is presently practised by bothMelbourne Water and the water retailers. Lessthan 1% of ETP effluent was diverted toirrigators in 1996/97 but there are possibilitiesfor extension if a determined program isimplemented taking overall diversion to 10%of flow. This is not only a significant reductionin effluent volume but also offers concomitantbenefits in reduced mains water consumptionand enhanced agricultural and horticulturalproduction. Unfortunately there are alsoobstacles related to salinisation, publicperception, commercial acceptability of
produce and rigorous government regulation,but these could be resolved with time.
Disposal to the Bridgewater aquifer throughinjection wells offers a means of disposing of alarge volume (10-20%) of effluent. The effluentwould diffuse through the aquifer sands andenter southern Port Phillip Bay and Bass Strait,as an attenuated front over a very large area.No attempt to assess the impact was made,however it is likely it would result in a largenutrient load entering a fairly pristine area ofPort Phillip Bay. While the area is relativelywell-flushed, the nutrient would be suppliedthrough sediment via groundwater, and maymodify benthic communities. However theobjective of the EPA groundwater policy is torestore the quality of the aquifer to beneficialuse standard. This means that effluent wouldneed to be tertiary treated prior to injection.The effluent would then become more usableelsewhere.
Diversion to the Western Treatment Plant(WTP), whilst it offers major diversion ofeffluent, is very capital intensive and wouldtransfer impact to Port Phillip Bay. An increasein the load of nutrients to the Bay is contraryto the recommendations of the Port Phillip BayEnvironmental Study (Harris et al. 1996).However, improvements in treatmentpresently in train at WTP are likely to reducethe current load. This reduction may thenenable increased loads to be handled withoutincreasing the net impact on Port Phillip Bay.
Gomboso et al. (1998) reviewed the proposal tofurther treat effluent prior to transfer toCardinia Reservoir as part of an indirectpotable re-use scheme. This could provide atotal solution, which would eventually lead tono ocean discharge. The disadvantages of thisoption are public acceptance and disposal ofthe concentrated residues. Education and agradual implementation should increase publicacceptance. The disposal of the concentrated
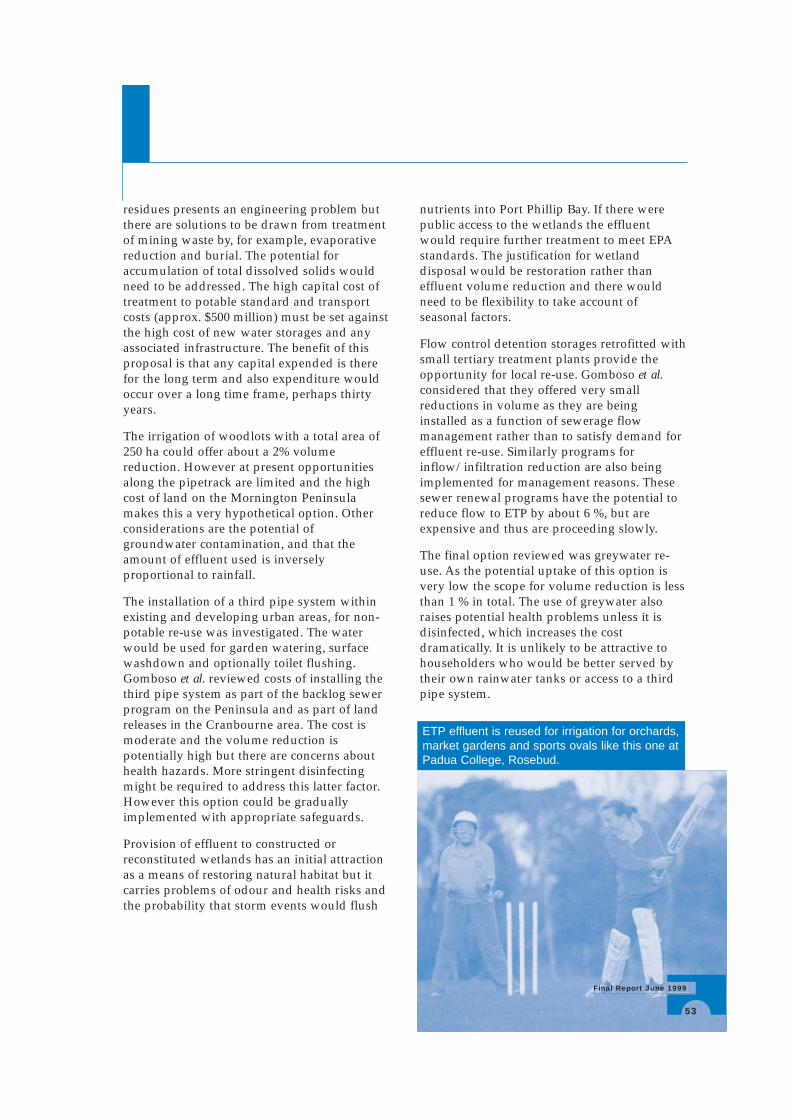
residues presents an engineering problem butthere are solutions to be drawn from treatmentof mining waste by, for example, evaporativereduction and burial. The potential foraccumulation of total dissolved solids wouldneed to be addressed. The high capital cost oftreatment to potable standard and transportcosts (approx. $500 million) must be set againstthe high cost of new water storages and anyassociated infrastructure. The benefit of thisproposal is that any capital expended is therefor the long term and also expenditure wouldoccur over a long time frame, perhaps thirtyyears.
The irrigation of woodlots with a total area of250 ha could offer about a 2% volumereduction. However at present opportunitiesalong the pipetrack are limited and the highcost of land on the Mornington Peninsulamakes this a very hypothetical option. Otherconsiderations are the potential ofgroundwater contamination, and that theamount of effluent used is inverselyproportional to rainfall.
The installation of a third pipe system withinexisting and developing urban areas, for non-potable re-use was investigated. The waterwould be used for garden watering, surfacewashdown and optionally toilet flushing.Gomboso et al. reviewed costs of installing thethird pipe system as part of the backlog sewerprogram on the Peninsula and as part of landreleases in the Cranbourne area. The cost ismoderate and the volume reduction ispotentially high but there are concerns abouthealth hazards. More stringent disinfectingmight be required to address this latter factor.However this option could be graduallyimplemented with appropriate safeguards.
Provision of effluent to constructed orreconstituted wetlands has an initial attractionas a means of restoring natural habitat but itcarries problems of odour and health risks andthe probability that storm events would flush
nutrients into Port Phillip Bay. If there werepublic access to the wetlands the effluentwould require further treatment to meet EPAstandards. The justification for wetlanddisposal would be restoration rather thaneffluent volume reduction and there wouldneed to be flexibility to take account ofseasonal factors.
Flow control detention storages retrofitted withsmall tertiary treatment plants provide theopportunity for local re-use. Gomboso et al.considered that they offered very smallreductions in volume as they are beinginstalled as a function of sewerage flowmanagement rather than to satisfy demand foreffluent re-use. Similarly programs forinflow/infiltration reduction are also beingimplemented for management reasons. Thesesewer renewal programs have the potential toreduce flow to ETP by about 6 %, but areexpensive and thus are proceeding slowly.
The final option reviewed was greywater re-use. As the potential uptake of this option isvery low the scope for volume reduction is lessthan 1 % in total. The use of greywater alsoraises potential health problems unless it isdisinfected, which increases the costdramatically. It is unlikely to be attractive tohouseholders who would be better served bytheir own rainwater tanks or access to a thirdpipe system.
ETP effluent is reused for irrigation for orchards,market gardens and sports ovals like this one atPadua College, Rosebud.
Final Report June 1999
53
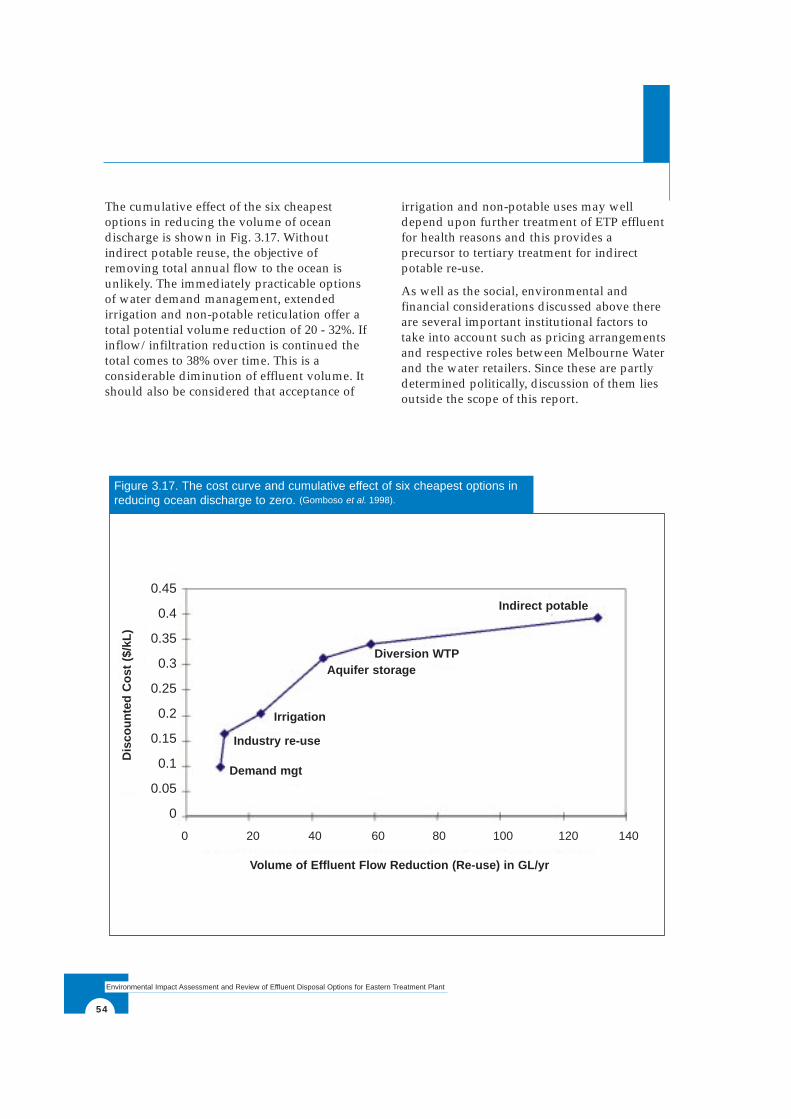
54
Environmental Impact Assessment and Review of Effluent Disposal Options for Eastern Treatment Plant
The cumulative effect of the six cheapestoptions in reducing the volume of oceandischarge is shown in Fig. 3.17. Withoutindirect potable reuse, the objective ofremoving total annual flow to the ocean isunlikely. The immediately practicable optionsof water demand management, extendedirrigation and non-potable reticulation offer atotal potential volume reduction of 20 - 32%. Ifinflow/infiltration reduction is continued thetotal comes to 38% over time. This is aconsiderable diminution of effluent volume. Itshould also be considered that acceptance of
irrigation and non-potable uses may welldepend upon further treatment of ETP effluentfor health reasons and this provides aprecursor to tertiary treatment for indirectpotable re-use.
As well as the social, environmental andfinancial considerations discussed above thereare several important institutional factors totake into account such as pricing arrangementsand respective roles between Melbourne Waterand the water retailers. Since these are partlydetermined politically, discussion of them liesoutside the scope of this report.
Figure 3.17. The cost curve and cumulative effect of six cheapest options inreducing ocean discharge to zero. (Gomboso et al. 1998).
Volume of Effluent Flow Reduction (Re-use) in GL/yr
Demand mgt
Industry re-use
Irrigation
Aquifer storageDiversion WTP
Indirect potable
0 20 40 60 80 100 120 140
Dis
coun
ted
Cos
t ($/
kL)
0.45
0.4
0.35
0.3
0.25
0.2
0.15
0.1
0.05
0
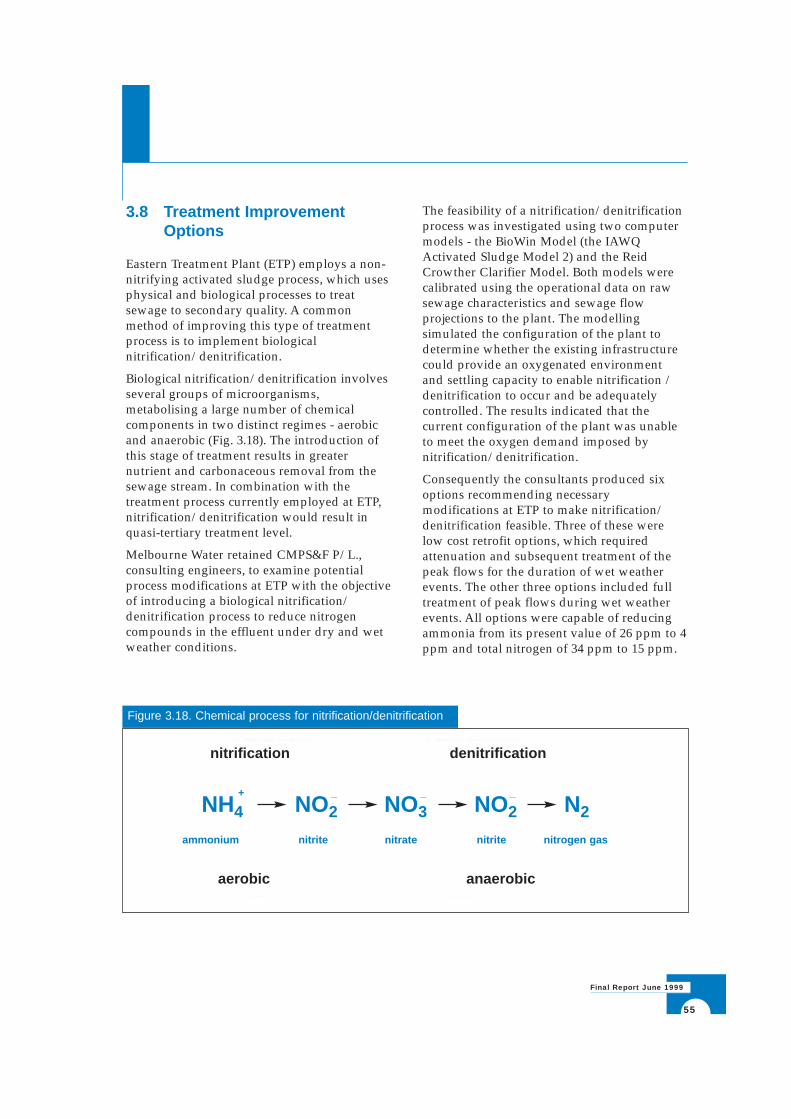
3.8 Treatment ImprovementOptions
Eastern Treatment Plant (ETP) employs a non-nitrifying activated sludge process, which usesphysical and biological processes to treatsewage to secondary quality. A commonmethod of improving this type of treatmentprocess is to implement biologicalnitrification/denitrification.
Biological nitrification/denitrification involvesseveral groups of microorganisms,metabolising a large number of chemicalcomponents in two distinct regimes - aerobicand anaerobic (Fig. 3.18). The introduction ofthis stage of treatment results in greaternutrient and carbonaceous removal from thesewage stream. In combination with thetreatment process currently employed at ETP,nitrification/denitrification would result inquasi-tertiary treatment level.
Melbourne Water retained CMPS&F P/L.,consulting engineers, to examine potentialprocess modifications at ETP with the objectiveof introducing a biological nitrification/denitrification process to reduce nitrogencompounds in the effluent under dry and wetweather conditions.
The feasibility of a nitrification/denitrificationprocess was investigated using two computermodels - the BioWin Model (the IAWQActivated Sludge Model 2) and the ReidCrowther Clarifier Model. Both models werecalibrated using the operational data on rawsewage characteristics and sewage flowprojections to the plant. The modellingsimulated the configuration of the plant todetermine whether the existing infrastructurecould provide an oxygenated environment and settling capacity to enable nitrification /denitrification to occur and be adequatelycontrolled. The results indicated that thecurrent configuration of the plant was unableto meet the oxygen demand imposed bynitrification/denitrification.
Consequently the consultants produced sixoptions recommending necessarymodifications at ETP to make nitrification/denitrification feasible. Three of these were low cost retrofit options, which requiredattenuation and subsequent treatment of thepeak flows for the duration of wet weatherevents. The other three options included fulltreatment of peak flows during wet weatherevents. All options were capable of reducingammonia from its present value of 26 ppm to 4ppm and total nitrogen of 34 ppm to 15 ppm.
55
Final Report June 1999
Figure 3.18. Chemical process for nitrification/denitrification
NH4 NO2 NO3 NO2 N2
ammonium nitrite nitrate nitrite nitrogen gas
+ _ _ _
aerobic anaerobic
nitrification denitrification
56
Environmental Impact Assessment and Review of Effluent Disposal Options for Eastern Treatment Plant
The estimated cost of retrofit options rangedfrom $5 million to $7 million, which mostlyreflected the augmentation cost of the existingaeration system. The cost of peak flowmanagement options varied from $35 millionto $94 million and in addition to the aerationsystem upgrade included augmentation of thehydraulic capacity of the plant throughconstructing additional aeration andsedimentation tanks.
It should be noted that the low cost options,although attractive economically, pose higherrisk from an operational and environmentalcompliance point of view due to the necessityof periodical storage of primary treatedsewage. Therefore, feasibility of these optionsshould be verified through a field trial toconfirm consistency of plant performance andto explore probable economic benefits.
3.9 Microbiological Health RiskAssessment
Monash University, Department ofEpidemiology and Preventive Medicine carriedout a microbiological Health Risk Assessmentfor the waters adjacent to the Outfall (Fairlyand Sinclair 1999). The objective was toindicate whether there is a likelihood ofdisease occurring from swimming and orsurfing at these beaches.
Assessment of the risk of disease fromswimming in polluted beaches can be derivedfrom either epidemiological studies or riskassessment modelling. Both approaches havetheir limitations and in the present context,epidemiological studies, which do not try toidentify the microorganism responsible fordisease, were considered more relevant.
Overall, epidemiological studies conductedelsewhere suggest an increased risk of diseaseassociated with swimming in waters
contaminated by sewerage or storm water,although levels of statistical significance werenot always reached. The diseases associatedwith swimming in these contaminated watersare varied and derive from direct contact withthe water (e.g. ear, eye and skin conditions) orfrom ingestion or inhalation of water (e.g.gastroenteritis and respiratory disease). Moststudies have concentrated on gastroenteritisdue to the primary concern over entericpathogens in sewage.
There is no general agreement on the indicatororganisms that are best able to assess thelikelihood of disease although E.coli, enterococcior faecal streptococci have been most closelycorrelated with an increase in disease risk. Theabsolute levels of these indicator organismsfound to be associated with disease varies indifferent studies.
As part of the licence requirements, MelbourneWater carry out routine sampling for E.coli atbeaches either side of the discharge pointevery six days. The nature of the relationshipbetween E.coli levels and the risk to swimmersis not a simple and direct one, as E.coli onlyindicates the likely presence of otherpotentially harmful organisms. Consequentlythe EPA has adopted conservative waterquality objectives. Data from the monitoringindicate that the E.coli levels are below thestandards set by the EPA.
Additional water samples taken duringJanuary and February 1998 were tested forenterococcus and total coliform counts inaddition to E.coli at sites where surfersgenerally swim (i.e. offshore). This data alsosupported the conclusion that it is veryunlikely that swimmers or surfers atGunnamatta Beach would be at increased riskof illness due to faecal microorganisms in thetreated effluent being discharged at BoagsRocks, compared to swimmers or surfers atother ocean beaches (Fairly and Sinclair 1999).
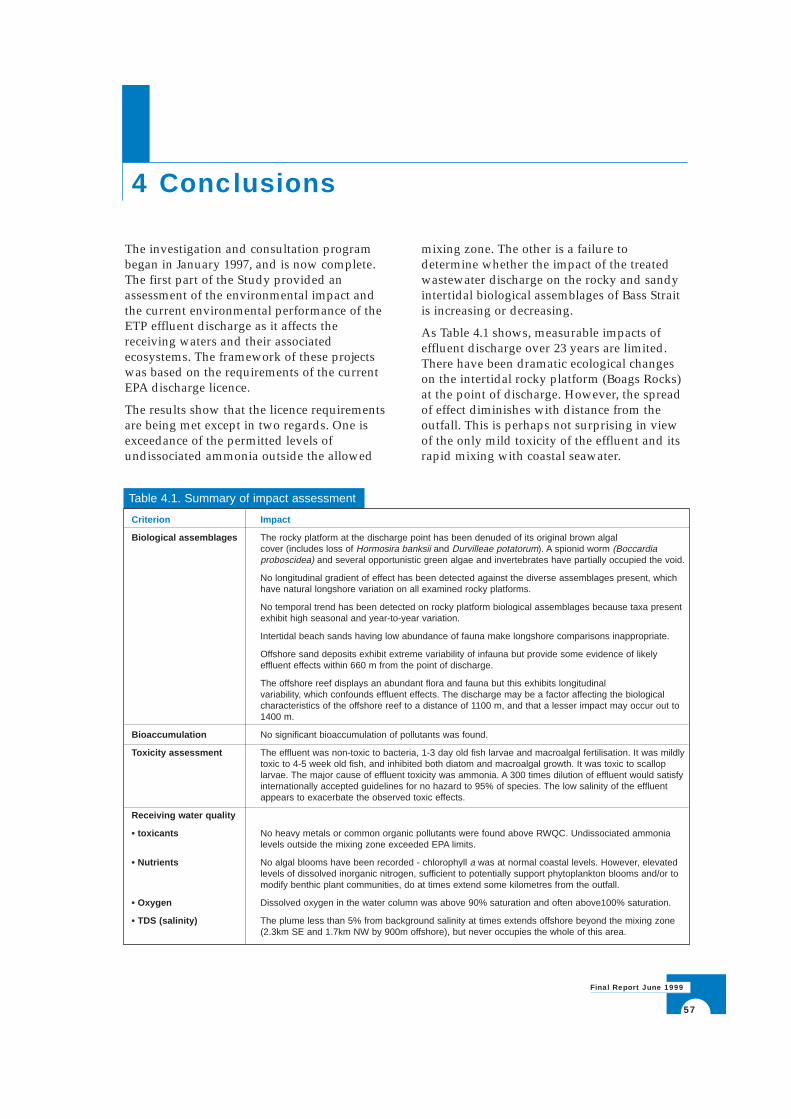
4 Conclusions
57
Final Report June 1999
The investigation and consultation programbegan in January 1997, and is now complete.The first part of the Study provided anassessment of the environmental impact andthe current environmental performance of theETP effluent discharge as it affects thereceiving waters and their associatedecosystems. The framework of these projectswas based on the requirements of the currentEPA discharge licence.
The results show that the licence requirementsare being met except in two regards. One isexceedance of the permitted levels ofundissociated ammonia outside the allowed
mixing zone. The other is a failure todetermine whether the impact of the treatedwastewater discharge on the rocky and sandyintertidal biological assemblages of Bass Straitis increasing or decreasing.
As Table 4.1 shows, measurable impacts ofeffluent discharge over 23 years are limited.There have been dramatic ecological changeson the intertidal rocky platform (Boags Rocks)at the point of discharge. However, the spreadof effect diminishes with distance from theoutfall. This is perhaps not surprising in viewof the only mild toxicity of the effluent and itsrapid mixing with coastal seawater.
Table 4.1. Summary of impact assessment
Criterion Impact
Biological assemblages The rocky platform at the discharge point has been denuded of its original brown algal cover (includes loss of Hormosira banksii and Durvilleae potatorum). A spionid worm (Boccardia proboscidea) and several opportunistic green algae and invertebrates have partially occupied the void.
No longitudinal gradient of effect has been detected against the diverse assemblages present, which have natural longshore variation on all examined rocky platforms.
No temporal trend has been detected on rocky platform biological assemblages because taxa present exhibit high seasonal and year-to-year variation.
Intertidal beach sands having low abundance of fauna make longshore comparisons inappropriate.
Offshore sand deposits exhibit extreme variability of infauna but provide some evidence of likely effluent effects within 660 m from the point of discharge.
The offshore reef displays an abundant flora and fauna but this exhibits longitudinal variability, which confounds effluent effects. The discharge may be a factor affecting the biological characteristics of the offshore reef to a distance of 1100 m, and that a lesser impact may occur out to 1400 m.
Bioaccumulation No significant bioaccumulation of pollutants was found.
Toxicity assessment The effluent was non-toxic to bacteria, 1-3 day old fish larvae and macroalgal fertilisation. It was mildly toxic to 4-5 week old fish, and inhibited both diatom and macroalgal growth. It was toxic to scallop larvae. The major cause of effluent toxicity was ammonia. A 300 times dilution of effluent would satisfy internationally accepted guidelines for no hazard to 95% of species. The low salinity of the effluent appears to exacerbate the observed toxic effects.
Receiving water quality
• toxicants No heavy metals or common organic pollutants were found above RWQC. Undissociated ammonia levels outside the mixing zone exceeded EPA limits.
• Nutrients No algal blooms have been recorded - chlorophyll a was at normal coastal levels. However, elevated levels of dissolved inorganic nitrogen, sufficient to potentially support phytoplankton blooms and/or to modify benthic plant communities, do at times extend some kilometres from the outfall.
• Oxygen Dissolved oxygen in the water column was above 90% saturation and often above100% saturation.
• TDS (salinity) The plume less than 5% from background salinity at times extends offshore beyond the mixing zone (2.3km SE and 1.7km NW by 900m offshore), but never occupies the whole of this area.
58
Environmental Impact Assessment and Review of Effluent Disposal Options for Eastern Treatment Plant
The major cause of effluent toxicity wasammonia, however the freshwater nature ofthe effluent also has some deleterious effect onsome taxa. Field studies suggest that mixing ofthe effluent with Bass Strait water is fairlyrapid and salinities low enough to affectmacroalgae are present only in the nearvicinity of the outfall. The residual chlorinefrom disinfection of the effluent is vanishinglysmall (less than 0.1ppm) and comparison ofeffluent toxicity to three macroalgal speciesshowed only a slight increase in toxicitybetween chlorinated and un-chlorinatedeffluent.
With regard to nutrient loads from the outfall,the Study was not able to make any definitiveassessment of impacts in the receivingenvironment due to elevated nutrient levels.The water quality modelling indicated thatproductivity in the region was likely to beinfluenced by the elevated nutrient levels,although it is unclear as to how this relates tochanges identified in benthic communities.
On the intertidal rock platform at Boags Rocksloss and reduction in original biologicalassemblages (eg. loss of Hormosira andDurvilleae) and replacement with opportunisticspecies (eg. Boccardia) is likely to be caused bya combination of low salinities, increasedorganic load and the toxic effect of highammonia concentrations. However, thechanges in macroalgal assemblages (reductionin Hormosira and loss of Durvilleae) towardsCape Schanck (Fingals Beach) is likely to beeither effects of nutrient loads, ammoniatoxicity, freshwater input or a combination ofthese.
It has been argued that lack of priorknowledge of the coastal ecosystem makes“before-and-after” comparison impossible sothat we will never know the full extent ofeffluent impact. The issue of not being able toidentify suitable control sites with which tocompare the extent of impact also confoundedthe situation. Against this however, it may beargued that we have clear evidence of impactat the outfall site but that this impact is much
less discernible either side of the outfall,especially to the west. Furthermore, 20 years ofrocky platform monitoring shows markedtemporal and spatial variability in both algaland invertebrate communities along the coastwith no clear trends to indicate the extent ofimpact and whether it is increasing.
As the effects of the effluent on the near-fieldenvironment are partly due to its freshwaternature, reductions in discharge throughincreased water conservation, effluent reuse orrecycling of wastewater should reduce theimpact incrementally as the volume is reduced.Reductions in the discharge volume will alsoreduce the nutrient load therefore reducing thefar-field impacts.
Ammonia was shown to be a major cause oftoxicity, and is suspected to be a major factorin the near-field impact. Changes in treatmentprocesses that lead to a reduction in volume ofammonia being discharged also have thebenefit of reducing the overall nutrient load.
Offshore discharge through an extendedoutfall with a diffuser providing initial dilutionof at least 50:1 would result in lowerconcentrations of effluent reaching theshoreline. This would lead to an immediateimprovement in aesthetic qualities (sight andodour) and should further reduce any risk tohuman health. However, evidence for healtheffects is presently largely anecdotal. It shouldalso be noted that the dilution of effluentreaching the shore from an extended outfallwould vary depending on the weather. Underonshore winds the plume would be pushedtowards the shore.
The water quality modelling indicated thatelevated concentrations of nutrients necessaryto increase productivity would at times remainwithin the area of impact even if an extendedoutfall of 3 km in length were constructed. TheStudy did not consider the environmentalimpact the engineering works would have oneither the foreshore or the marineenvironment. Nor was the specific impact onthe ecosystem along the diffuser considered.
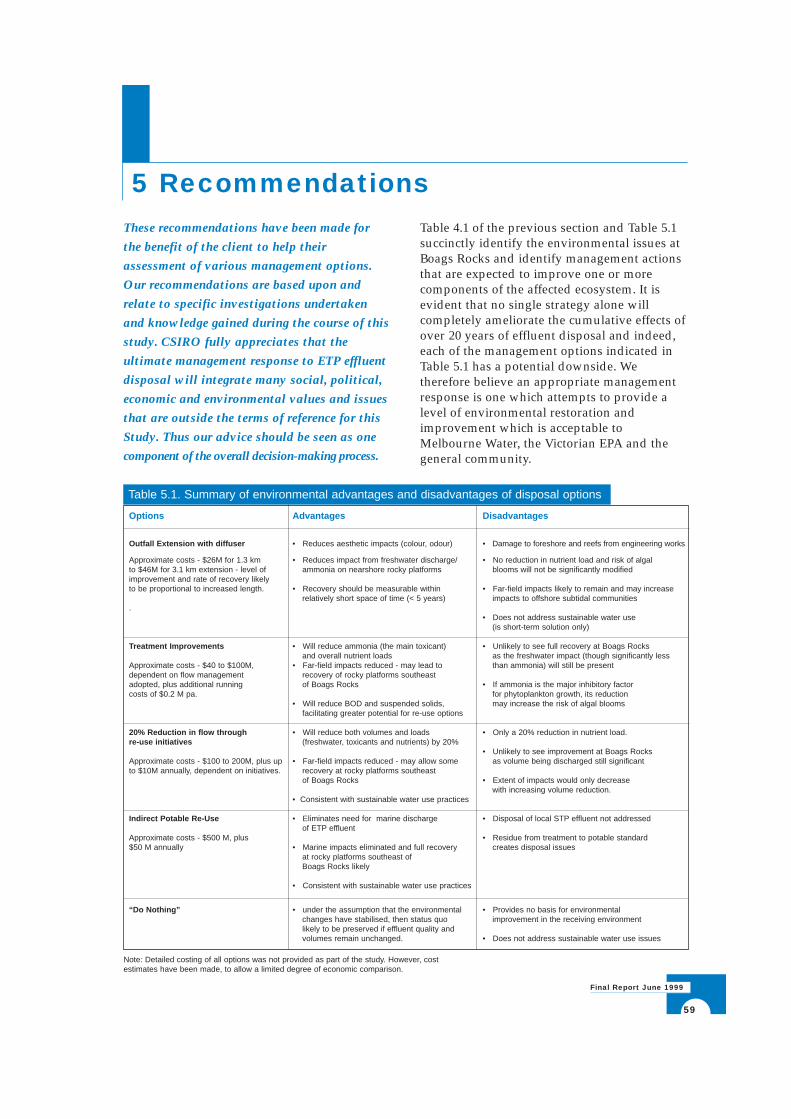
5 Recommendations
59
Final Report June 1999
These recommendations have been made for
the benefit of the client to help their
assessment of various management options.
Our recommendations are based upon and
relate to specific investigations undertaken
and knowledge gained during the course of this
study. CSIRO fully appreciates that the
ultimate management response to ETP effluent
disposal will integrate many social, political,
economic and environmental values and issues
that are outside the terms of reference for this
Study. Thus our advice should be seen as one
component of the overall decision-making process.
Table 4.1 of the previous section and Table 5.1succinctly identify the environmental issues atBoags Rocks and identify management actionsthat are expected to improve one or morecomponents of the affected ecosystem. It isevident that no single strategy alone willcompletely ameliorate the cumulative effects ofover 20 years of effluent disposal and indeed,each of the management options indicated inTable 5.1 has a potential downside. Wetherefore believe an appropriate managementresponse is one which attempts to provide alevel of environmental restoration andimprovement which is acceptable toMelbourne Water, the Victorian EPA and thegeneral community.
Table 5.1. Summary of environmental advantages and disadvantages of disposal options
Options Advantages Disadvantages
Outfall Extension with diffuser • Reduces aesthetic impacts (colour, odour) • Damage to foreshore and reefs from engineering works
Approximate costs - $26M for 1.3 km • Reduces impact from freshwater discharge/ • No reduction in nutrient load and risk of algalto $46M for 3.1 km extension - level of ammonia on nearshore rocky platforms blooms will not be significantly modifiedimprovement and rate of recovery likely to be proportional to increased length. • Recovery should be measurable within • Far-field impacts likely to remain and may increase
relatively short space of time (< 5 years) impacts to offshore subtidal communities.
• Does not address sustainable water use(is short-term solution only)
Treatment Improvements • Will reduce ammonia (the main toxicant) • Unlikely to see full recovery at Boags Rocksand overall nutrient loads as the freshwater impact (though significantly less
Approximate costs - $40 to $100M, • Far-field impacts reduced - may lead to than ammonia) will still be presentdependent on flow management recovery of rocky platforms southeast adopted, plus additional running of Boags Rocks • If ammonia is the major inhibitory factor costs of $0.2 M pa. for phytoplankton growth, its reduction
• Will reduce BOD and suspended solids, may increase the risk of algal bloomsfacilitating greater potential for re-use options
20% Reduction in flow through • Will reduce both volumes and loads • Only a 20% reduction in nutrient load.re-use initiatives (freshwater, toxicants and nutrients) by 20%
• Unlikely to see improvement at Boags RocksApproximate costs - $100 to 200M, plus up • Far-field impacts reduced - may allow some as volume being discharged still significantto $10M annually, dependent on initiatives. recovery at rocky platforms southeast
of Boags Rocks • Extent of impacts would only decreasewith increasing volume reduction.
• Consistent with sustainable water use practices
Indirect Potable Re-Use • Eliminates need for marine discharge • Disposal of local STP effluent not addressedof ETP effluent
Approximate costs - $500 M, plus • Residue from treatment to potable standard$50 M annually • Marine impacts eliminated and full recovery creates disposal issues
at rocky platforms southeast of Boags Rocks likely
• Consistent with sustainable water use practices
“Do Nothing” • under the assumption that the environmental • Provides no basis for environmentalchanges have stabilised, then status quo improvement in the receiving environmentlikely to be preserved if effluent quality and volumes remain unchanged. • Does not address sustainable water use issues
Note: Detailed costing of all options was not provided as part of the study. However, costestimates have been made, to allow a limited degree of economic comparison.
60
Environmental Impact Assessment and Review of Effluent Disposal Options for Eastern Treatment Plant
We cannot anticipate the relative weightingseach of these stakeholders places on thecomponents of Table 4.1 and thus we cannotrecommend a single preferred option.
To address the environmental concernsidentified in Table 4.1 would require amanagement response that integrated theindividual actions identified in Table 5.1. Wetherefore propose that the following activitiesbe considered:
Outfall Extension - offshore discharge wouldameliorate effects inshore to a degree varyingwith outfall length. Presently, both the subtidalinfauna and the reef epibiota show complexpatterns of richness and/or diversity withminimal impact from the outfall. It is unclearhow the offshore discharge would effect thesesubtidal communities. Extending the outfall isone disposal strategy that should reduce thecurrent environmental impacts close to thepresent discharge point.
Treatment Improvements - As ammonia is asignificant contributor to toxicity and nutrientload, an ammonia reduction process change atETP with concomitant peak flow handlingchanges should be considered. This wouldhave accompanying advantages of reducingBOD and suspended solids thereby facilitatinggreater potential for re-use. The processimprovements are also compatible with futuresystem upgrades necessary to achieve potablereuse.
Flow Reductions - As freshwater is known tobe a part contributor to the environmentaleffects of the effluent, along with the volume ofnutrients and concentration of toxicants, agradual implementation of flow reductionshould be pursued. Impact to the marineenvironment would be avoided altogether iftotal recycling of wastewater was achieved, butthis is unlikely in the short-term. The option ofrecycling the effluent for potable use should be
put on the public agenda for discussion andappraisal as a long-term goal. Importantprocesses for flow reductions include:
• Continuation and enhancement ofprograms of water demand management.
• Provision of effluent for all forms ofirrigation (agriculture, urban watering andwood lots).
• Investigation of the potential forreticulation of effluent for outdoor use onresidential, commercial, industrial andrecreational premises.
• Continuation of the present programs ofinflow/infiltration reduction.
• Monitoring of initiatives elsewhere withrespect to potable re-use.
In considering strategies for effluent disposal,it should be recognised that the costs oftreatment improvement and re-use schemeswill be partly offset by economic return on re-use of water. However, expenditure on anoutfall does not provide this advantage.
Whatever action is taken, a monitoringprogram should be designed and implementedto assess immediate and on-going changes inenvironmental condition as a result of themanagement response. The monitoring activityshould ensure sufficient spatial and temporalresolution to provide both an ‘early-warning’capability of dramatic change over short timeand space scales coupled with an ability todetect longer-term trends that can be isolatedwith confidence from background variation.The program will need to be a combination ofmonitoring activities, each focussing on aspecific habitat and known impact. The designshould be such that any impact as a result ofalterations in the nature and volume of effluentcan be quantified and measured against setobjectives.
6 Monitoring
61
Final Report June 1999
In order to assess whether the changes areproviding the desired results (improvement) itwill be necessary to have a well designedmonitoring program in place. The programshould have two focuses. The first should beinternal monitoring of the treatment processand environmental impact associated with theoperations at ETP. The second should be aprogram of monitoring that focuses on thecoastal impact. The coastal monitoring shouldbe implemented in conjunction with otherStatewide coastal monitoring initiatives.
The internal monitoring should ensure thatETP is operating within the constraints of itsoperating licence. As part of the program thevolume and composition of effluent beingdischarged to the outfall should be analysedregularly. The suite of parameters should bechosen in consultation with the EPA, butshould include ammonia on at least a weeklybasis. Ideally if ammonia could be measuredcontinuously this would provide a clearerpicture of the variability of the effluent andassociated toxicity.
A suggested coastal monitoring program isprovided in Table 6.1, as an indicative guideonly. The final program, designed inconsultation with the EPA, would bedependent on any changes proposed as part ofthe Effluent Management Strategy for ETP.
The subtidal sands and reef were surveyed forthe first time as part of this Study, whichmeans they provided only a single snapshot onwhich to base an assessment of impact. Inorder to support that initial assessment andallow continued change to be identified,further subtidal surveys are required. Initiallythe frequency should be at least annual,however this could be reduced dependent onresults found. Ideally the offshore monitoringprogram should be dovetailed into a Victoriancoastal monitoring program. The combinedresults would provide a greater knowledgebase upon which to assess background(natural) variation.
The numerous intertidal rocky platformsurveys that have been carried out over theyears provide a significant historicalbackground. However the difficulty of sitecomparisons and the ability to use these typesof surveys to assess the extent of impact hasbeen well documented by Quinn and Haynes(1996) and Shao (1997). Rather than usingplatforms to assess the extent of impact, theyshould be used to assess the rate of change,and whether that change is related to thedischarge of effluent. An alternative to thesampling surveys for assessing the level ofbiological impact would be to use the life formof a single algal species, which exhibitsmeasurable ranges of effluent impact.
The issue of bioaccumulation of toxicants inseafood is of continuing concern to thecommunity. Though the Study concluded thatbioaccumulation was insignificant, it wasacknowledged that further studies of thisnature may be necessary to satisfy publicconcern over risk to the quality of seafood.One program to be considered, would be theuse of the cultured mussel (Mytilus edulis),which is a well studied filter feeder often usedto assess the risk of bioaccumulation. Theresults could also be compared to other“mussel watch programs” for outfalls. Itshould be noted, however, that the existinglicence requires one commercially and onerecreationally harvested species from near theoutfall to be assessed for bioaccumulation.
The rapid dilution of effluent from the outfallis most relevant to the adjacent beach users. Toassess that appropriate mixing is occurring,water sampling in conjunction with the beachbacteriological monitoring program should beconsidered. The existing program consists ofwater samples at beaches either side of theoutfall (2 northwest and 4 southeast) beingtested for E.coli every six days. Considerationshould be given to including the measurementof ammonium, salinity and pH in each sample.
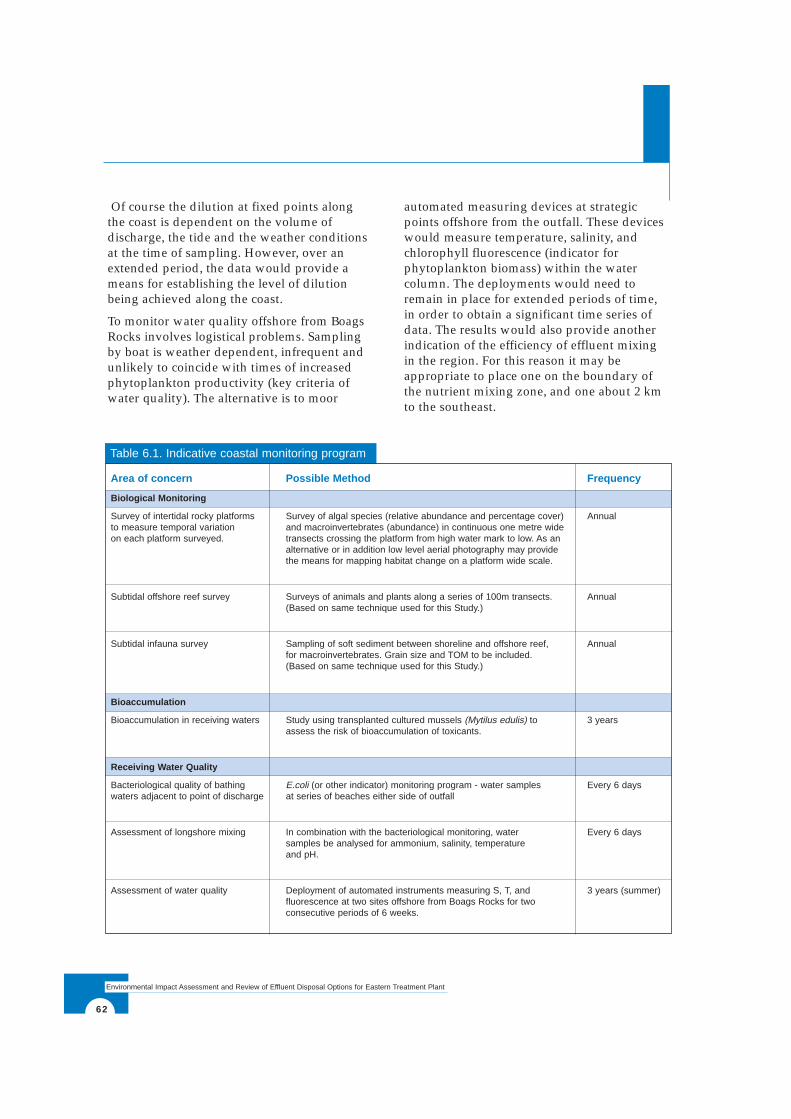
62
Environmental Impact Assessment and Review of Effluent Disposal Options for Eastern Treatment Plant
Of course the dilution at fixed points alongthe coast is dependent on the volume ofdischarge, the tide and the weather conditionsat the time of sampling. However, over anextended period, the data would provide ameans for establishing the level of dilutionbeing achieved along the coast.
To monitor water quality offshore from BoagsRocks involves logistical problems. Samplingby boat is weather dependent, infrequent andunlikely to coincide with times of increasedphytoplankton productivity (key criteria ofwater quality). The alternative is to moor
automated measuring devices at strategicpoints offshore from the outfall. These deviceswould measure temperature, salinity, andchlorophyll fluorescence (indicator forphytoplankton biomass) within the watercolumn. The deployments would need toremain in place for extended periods of time,in order to obtain a significant time series ofdata. The results would also provide anotherindication of the efficiency of effluent mixingin the region. For this reason it may beappropriate to place one on the boundary ofthe nutrient mixing zone, and one about 2 kmto the southeast.
Table 6.1. Indicative coastal monitoring program
Area of concern Possible Method Frequency
Biological Monitoring
Survey of intertidal rocky platforms Survey of algal species (relative abundance and percentage cover) Annualto measure temporal variation and macroinvertebrates (abundance) in continuous one metre wideon each platform surveyed. transects crossing the platform from high water mark to low. As an
alternative or in addition low level aerial photography may provide the means for mapping habitat change on a platform wide scale.
Subtidal offshore reef survey Surveys of animals and plants along a series of 100m transects. Annual(Based on same technique used for this Study.)
Subtidal infauna survey Sampling of soft sediment between shoreline and offshore reef, Annualfor macroinvertebrates. Grain size and TOM to be included.(Based on same technique used for this Study.)
Bioaccumulation
Bioaccumulation in receiving waters Study using transplanted cultured mussels (Mytilus edulis) to 3 yearsassess the risk of bioaccumulation of toxicants.
Receiving Water Quality
Bacteriological quality of bathing E.coli (or other indicator) monitoring program - water samples Every 6 dayswaters adjacent to point of discharge at series of beaches either side of outfall
Assessment of longshore mixing In combination with the bacteriological monitoring, water Every 6 dayssamples be analysed for ammonium, salinity, temperature and pH.
Assessment of water quality Deployment of automated instruments measuring S, T, and 3 years (summer)fluorescence at two sites offshore from Boags Rocks for two consecutive periods of 6 weeks.
7 Glossary
63
Final Report June 1999
Acute: Severe and short lived.
Aerobic: Presence of free oxygen in chemical process.
Algae: Large group of non-flowering plants, manymicroscopic, generally containing chlorophyll. Mostalgae are aquatic.
Algal bloom: Microalgae occurring in dense numbersin a water body, as a result of favourable conditions (ie.nutrient enrichment).
Ammonia: Compound consisting of a single nitrogenatom coupled with three hydrogen atoms. It is anitrogen source for algae.
Ammonium: The positively charged cation formedwhen ammonia is neutralised. It is a nitrogen sourcefor algae.
Anaerobic: A process conducted in the absence offree oxygen
ANOVA: Analysis of Variance. Statistical technique fortesting the equality of several population means.
Anoxic: Devoid of oxygen.
Autocorrelation: Statistical measure of the degree ofassociation between pairs of points separated by somefixed increment of time.
Benthic: Belonging to the sea floor.
Benthos: Organisms living on or in association withthe sea floor.
Bioaccumulation: Concentration of substances(especially toxicants) in the tissues of plants andanimals.
Biochemical: Chemical reactions occurring in livingorganisms.
Biodiversity: Measure of the number of speciesinhabiting a given area.
Biomass: The living weight of animal or plantpopulations or communities.
Biota: All living organisms of a region.
BOD: Biochemical Oxygen Demand. Measure of theamount of oxygen required by bacteria and othermicroorganisms engaged in breaking down organicmatter.
Chlorophyll: Green pigments of plants, which captureand use the energy from the sun to drive thephotosynthesis process.
Chronic: Over a long portion of the organism’s lifespan. Less severe and generally over a longer timespan than “acute”.
Conductivity: Electrical conductivity - the capacity ofwater to conduct electrical current; used to measurelevel of salinity.
Denitrification: Conversion of bound nitrogen toelemental (gaseous) form.
Detection limit: Minimum level of quantification for aparticular analytical method.
Diatom: Variety of microalga that has a siliceousskeleton.
Dioxins, furans: Toxic compounds, which arebyproducts of the manufacturing process of herbicidesand disinfectants, but also derived from other industrialprocesses.
Diversity: In statistical terms, a measure of thedistribution of items across a set of categories
E.coli (Escherichia coli): Bacteria/bacterium found inthe stomachs of mammals (eg. humans) and used asan indicator of recent faecal contamination.
Ecotoxicology: Study of the fate and adverse effectsof chemicals on the ecosystem.
Endocrine disruptor: Substance which has thecapacity to disrupt the normal functioning of theendocrine glands in animals.
EPA: In this report the EPA refers to the EnvironmentProtection Authority, which is a statutory bodyestablished under an Act of the Victorian Parliament.
Epidemiology: Science of statistically evaluating anddealing with diseases in populations.
ETP: Eastern Treatment Plant (located at Carrum,Victoria).
Eutrophic: Having an unnaturally high content of algaedue to excess nutrients.
Evenness: In statistical terms, a measure of therelative distribution of items across a set of categories;‘bunching’ of items in a few categories yields lowevenness.
Grazing: Eating of plants by animals. In water the termis associated with zooplankton grazing onphytoplankton.
Guideline values: Values (often concentrations)thought to represent safe conditions and chosen as aresult of available research.
64
Environmental Impact Assessment and Review of Effluent Disposal Options for Eastern Treatment Plant
Heavy metals: General term for cadmium, chromium,copper, iron, mercury, nickel, manganese, lead, zinc,arsenic and selenium.
Indicator species: Animals or plants which indicate aneffect or impact. eg. pollution or loss of habitat.
Infauna: Fauna that lives within benthic sediment.
Invertebrate: Animals without a backbone.
Macroalgae: Large algae, in this report used todescribe kelps and larger seaweeds.
Mesotrophic: Water body that has moderate nutrientand algal levels.
Microalgae: Single-celled plants. Less than 1/10thmillimetre in length or diameter.
Model: Mathematical equation or series of equationsthat provides simplified description of system orsituation devised to facilitate calculations or predictions.With use of a computer, can provide simulation of largescale environmental processes, eg. hydrodynamicmodel.
Multi-Dimensional Scaling (MDS): multivariatestatistical technique that attempts to portrayrelationships in high-dimensional space using muchfewer (typically two or three) dimensions.
Multivariate: Consisting of several varying factors.
Nitrate: The NO3 anion.
Nitrification: Formation of nitrate from reduced formsof nitrogen.
Nitrite: The NO2 anion.
Nutrients: Substances (eg. nitrogen and phosphorusin various forms) required for the growth of plants (likefertiliser).
Oligotrophic: Water body that has low nutrient andalgal levels.
Organochlorines: Complex organic molecules withchlorine atoms attached (eg. many pesticides).
Organophosphates: Group of pesticides chemicalscontaining phosphorus, which are intended to killinsects.
Oxic: Having oxygen present.
Particulates: Particles suspended in water.
pH: The negative logarithim of the hydrogen ionconcentration; an index of acidity or alkalinity.
Photooxidation: Breakdown of a chemical byoxidation in the presence of sunlight
Photosynthesis: Transformation of carbon dioxide andwater to organic matter and oxygen by means of lightenergy.
Phthalate esters: Substance used in the manufacturerof plastics to give flexibility. Given time they leach fromthe plastic, and become an environmental pollutant.
Phytoplankton: Microalgae that live in the watercolumn.
Polychaete: General term for a class of segmentedworms with several seta (bristles) per segment, whichare widespread in the marine environment.
Productivity: Creation of living matter out of inorganicor inanimate matter. In this report, primary productivityin the ocean is the making of organic matter fromcarbon dioxide, nutrients and water by algae living inthe marine environment.
Receiving waters: Waters that receive effluent from aparticular source.
RWQC: Recommended Water Quality Criteria as setby the Victorian EPA
Salinity: The salt content of seawater.
Sediment: Any solid material in water that sinks to thebottom.
Sewage: Strictly speaking household waste but looselyapplied to any waste sent to a treatment plant.
Sewage Treatment Plant: A place where human andindustrial wastes are treated before disposal to land orwater.
Primary treatment: Screening the solids fromthe water and allowing organic matter andsuspended solids to settle. This treatmenttypically removes one third of the BOD and twothird of suspended solids.
Secondary treatment: Achieves stabilisation ofbiodegradable material through biologicaldegradation. This treatment typically removes 85-90 % of the BOD.
Tertiary treatment: Typically removes nutrients(nitrogen and phosphorus) and the remainingsmall volume of organic matter and organisms.
Similarity Index: Statistical measure of the degree of‘closeness’ of two groups which have been measuredon a number of attributes.
65
Final Report June 1999
Standard error: Statistical measure of the uncertaintyassociated with an estimate of a true value.
Stress: Statistical measure of the ‘goodness of fit’between the placement of groups in a multi-dimensionalscaling (MDS) with a given number of dimensions;lowering the number of available dimensions increasesstress; stress values range from 0 to near 1
Suspended solids: See particulates.
Suspension feeder: Animal which lives by filteringparticles from the water.
Synergistic interaction: Interaction between two ormore factors that influence a process in the samedirection; their combined effects may be equal to orgreater than the sum of the two effects alone.
Taxa (taxon): General term for a class, order, speciesetc. of animals or plants.
Toxic: Poisonous.
Toxicant: A poison.
Toxicity: Level or concentration of toxicant to create atoxic response.
Trophic: Related to food chains and food webs.
US EPA: United States Environment ProtectionAgency.
Vertebrates: Animals with backbones.
WTP: Western Treatment Plant (located at Werribee,Victoria).
Zoobenthos: Animals living on the sea floor.
Zooplankton: Small animals living in the watercolumn, usually drifting with the water.
References
66
Environmental Impact Assessment and Review of Effluent Disposal Options for Eastern Treatment Plant
Andrewartha, J.R., Murray, A.G., Parslow, J.P., andWalker, S.J. (1998). Boags Rocks Environmental ImpactAssessment Task 6.4 - Field Data, Hydrodynamic andWater Quality Modelling Final Report. Report No. OMR-119/107, CSIRO Marine Research, Hobart.
Black, K. and D. Hatton (1994). South Eastern OceanOutfall Study. Volume 2. 3-dimensional hydrodynamicand dispersal (plume) modelling. Report for MelbourneWater Corporation by Victorian Institute of MarineSciences, Melbourne.
Brady, B.A. and Fabris, G.J. (1997a). Boags RocksEnvironmental Impact Assessment Task 2.1 - Seafoodcontaminant levels. Marine and Freshwater ResourcesInstitute, Queenscliff.
Brady, B.A. and Fabris, G.J. (1997b). Boags RocksEnvironmental Impact Assessment Task 4.2 - Pointsampling, toxicants. Marine and Freshwater ResourcesInstitute, Queenscliff.
Chidgey S.S., Edmunds M.J. and Willcox, S.T. (1998).Boags Rocks Environmental Impact Assessment Task1.1. Biological Assessment of the Offshore MarineBiota. Consulting Environmental Engineers, Melbourne.
Camp Scott Furphy/Consulting EnvironmentalEngineers (CSF/CEE). (1992). South Eastern EffluentOcean Outfall Study. Prepared for Melbourne Water.
CMPS&F. (1997). Eastern Treatment Plant TreatmentImprovement Options Review (2 Volumes).Consultantcy report for Melbourne Water. CMPS&FEnvironmental, Melbourne.
Consulting Environmental Engineers (CEE). (1998).Boags Rocks Environmental Impact Assessment Task6.5 - Outfall Extension Concepts and Costing for BoagsRocks Effluent Outfall. Consulting EnvironmentalEngineers, Melbourne.
Dingle, A.E. and Rasmussen, C. (1991). VitalConnections, Melbourne and its Board of Works, 1891-1991. McPhee Gribble, Melbourne.
DKO Services P/L. (1998). General description of thebiology of intertidal and shallow subtidal habitatsbetween Boags Rocks and Cape Schanck. Report forCSIRO Environmental Projects Office. DKO ServicesP/L, Melbourne.
Ellison, A.M. (1993). Exploratory data analysis andgraphic display. In: Scheiner S. M. & Gurevitch J., eds.Design and Analysis of Ecological Experiments.Chapman and Hall, New York, p 14-45.
Fairley C.K., and Sinclair, M.I. (1999). MicrobiologicalHealth Risk Assessment at Gunnamatta Beach. Reportfor Melbourne Water Corporation. Department ofEpidemiology and Preventive Medicine, MonashUniversity, Melbourne.
Florence T.M., Stauber J.L., Dale L.S. and Jones L.(1997) The silver content of the ascidian Pyurastolonifera as an indicator of sewage pollution of themetropolitan beaches of Sydney, Australia. ACSSymposium Series, 654, 49-56.
Gomboso, J., Ritchie V.A., Thomas, J.F., and White, C.(1998). Eastern Treatment Plant Effluent FlowReduction (Re-use) Study. Report prepared forMelbourne Water as part of CSIRO EffluentManagement Study for Eastern Treatment Plant byCSIRO Land and Water, Perth.
Greenacre, M. (1984). Theory and Applications ofCorrespondence Analysis, Academic Press Inc. Ltd.:London.
Harris, G., Batley, G., Fox, D., Hall, D., Jernakoff, P.,Molloy, R., Murray, A., Newell, B., Parslow, J., Skyring,G., and Walker, S. (1996) Port Phillip BayEnvironmental Study Final Report. CSIRO, Canberra,Australia.
Heisler, S., Hirst, A., and Wilson, R.S. (1996).Recommendations concerning the feasibility ofundertaking a biological monitoring program of sandy,intertidal macro-benthos at Boags Rocks, Victoria.Report for CSIRO Environmental Projects Office.Museum of Victoria, Melbourne.
Kevekordes K. (1998a). Boags Rocks EnvironmentalImpact Assessment Task 1.2 - Seasonal Algal Surveys1997/98. Biological Sciences, Monash University,Melbourne.
Kevekordes K. (1998b). Boags Rocks EnvironmentalImpact Assessment Task 3.2 - Research usingHormosira banksii (Phaeophyta) as a marine bioassaysystem. Report on Seasonal Variation. BiologicalSciences, Monash University, Melbourne.
Longmore, A.R., Cowdell, R.A. and Abbot, B. (1998).Boags Rocks Environmental Impact Assessment Task4.1 and Task 6.2 - Underway analysis - nutrients andmonthly CTD profiles. Marine and FreshwaterResources Institute, Queenscliff.
Lord, D.A. (1996). Melbourne Water Eastern TreatmentPlant effluent disposal review, Tech Rep. 96/028/1, D.A.Lord and Associates.

67
Final Report June 1999
Manning, P.F. (1979). The biological effects of thedischarge of secondary treated sewage effluent atBoags Rocks, Gunnamatta Beach, Victoria. Honorsthesis. Latrobe University, Melbourne.
Melbourne Water Corporation. (1999). Transcripts fromoral history interviews conducted as part of the EffluentManagement Study Community Consultation Program.Melbourne Water Corporation.
Murray, A.G., and Parslow J.P. (1998). Boags RocksEnvironmental Impact Assessment Task 6.4. WaterQuality Modelling. Report No. OMR-122/107, CSIROMarine Research, Hobart.
Quinn G.P. and Haynes D. (1996). Recommendationsfor Boags Rocks Biological Monitoring Program. Reportfor Melbourne Water Corporation. Department ofEcology and Evolutionary Biology, Monash University,Melbourne.
Quinn, G. (1996). Power calculations for toxicant datafrom Boags Rocks. Report for Melbourne WaterCorporation. Department of Ecology and EvolutionaryBiology, Monash University, Melbourne.
Shao Quanxi. (1997). South-Eastern Purification Plant:Biological Monitoring Program, Statistical Review andAnalysis. A discussion document prepared by CSIROMathematical and Information Sciences, Perth.
Shir, M., and Burridge, T. (1998). The effects of treatedsewage effluent on the early life stages of three marinemacroalgae. Report for Melbourne Water Corporation.School of Life Sciences and Technology, VictoriaUniversity of Technology, Melbourne.
Sokolov, S., and Black, K. (1994). South Eastern OceanOutfall Study, Part 1: Assessment of existing data.Report for Melbourne Water Corporation by VictorianInstitute of Marine Sciences, Melbourne.
Stauber, J., Gunthorpe, L., Anderson, I., Holdway, D.,Gulec, I., and Kevekordes, K. (1998). InvestigationReport CET/IR 61R Toxicity testing of MelbourneWater’s Eastern Treatment Plant Effluent - Final Report(BREIAP 3.1). CSIRO Energy Technology Centre forAdvanced Analytical Chemistry.
Stauber, J., Adams, M.S., Pablo, F., and Hogan, A.(1999) Investigation Report ET/IR 137R Toxicityidentification evaluation (TIE) of Melbourne Water’sEastern Treatment Plant sewage effluent using themarine microalga Nitzschia closterium. CSIRO EnergyTechnology Centre for Advanced Analytical Chemistry.
Underwood, A.J. (1989). The analysis of stress innatural populations. Biological Journal of the LinneanSociety 37:51-78.
http://www.epo.csiro.au
This is the final report for a major environmental study managed and coordinated by
the CSIRO Environmental Projects Office. The study commenced in January 1997,
cost $1.3 million dollars, and incorporated research undertaken by scientists and
engineers in CSIRO as well as local universities, government agencies and private
consultants. The study was part of the Eastern Treatment Plant Effluent Management
Study and was funded by Melbourne Water Corporation.
The study investigated the impact of effluent disposal from the Eastern Treatment
Plant on the coastal environment in the area of Boags Rocks, near Cape Schanck. It
included biological monitoring, bioaccumulation assessment, toxicology, evaluation of
water quality and the development of integrated hydrodynamic and nutrient models. In
addition the study evaluated effluent re-use opportunities and benefits of extending
the existing shoreline outfall to a point further offshore.
This reports draws together the knowledge gained from the individual research tasks,
and provides input for the development of an Effluent Management Strategy for
Eastern Treatment Plant.


