Download - Eng Mat Chapter 3

lecture #1c

Mechanical Properties of Materials
1. Strength2. Stiffness 3. Resilience4. Hardness5. Toughness6. Fatigue7. Creep

Relative Mechanical Properties of Materials at Room Temperature

Relative Mechanical Properties of Materials at Room Temperature

Mechanical Tests:1. Tension2. Compression3. Torsion4. Bending 5. Hardness6. Impact 7. Fatigue8. Creep

Tension Test
Strength(Ultimate Tensile Strength)
Ductility(Maximum Elongation)
Stiffness(Elastic modulus)
Poisson Ratio Work Hardening

Tensile Testing Machine

Tensile Test Specimen
(a) A standard tensile test specimen before and after pulling, showing original and final gage lengths.

Tensile Test Test specimen preparation – In the United
States, the specimen is prepared according to ASTM (Other standards: JIS, ISO-EN etc.)
The specimen is mounted between the grips of the tensile test machine.
Specimen are test different rates of deformation

Engineering Stress and Engineering Strain
Engineering Stress, () =
Average uniaxial tensile force, (P) divided by original cross-sectional area, (A0)
0A
P
Engineering Strain, (e) =
Ratio of a change of length (L) divided by the original length (L0) due an applied force
00
0
L
L
L
LLe

Load – Extension Stress - Strain

Mechanical Properties of Tensile Test:1. Elastic Modulus or Young’s
Moulus2. Yield Strength (0.2% Offset)3. Ultimate Tensile Strength4. Uniform Elongation (Total Strain
before necking)5. Elongation at fracture6.Reduction in area

Engineering Stress-Strain Curve
Started point that stress and strain are no longer proportional (proportional limit)

YOUNG' S MODULUS
The ratio of stress to strain in the elastic region is the modulus of elasticity or Young's modulus (E)-to measure the material stiffnessThe linear relationship is known as Hooke’s LawUnit: Quoted in GPa
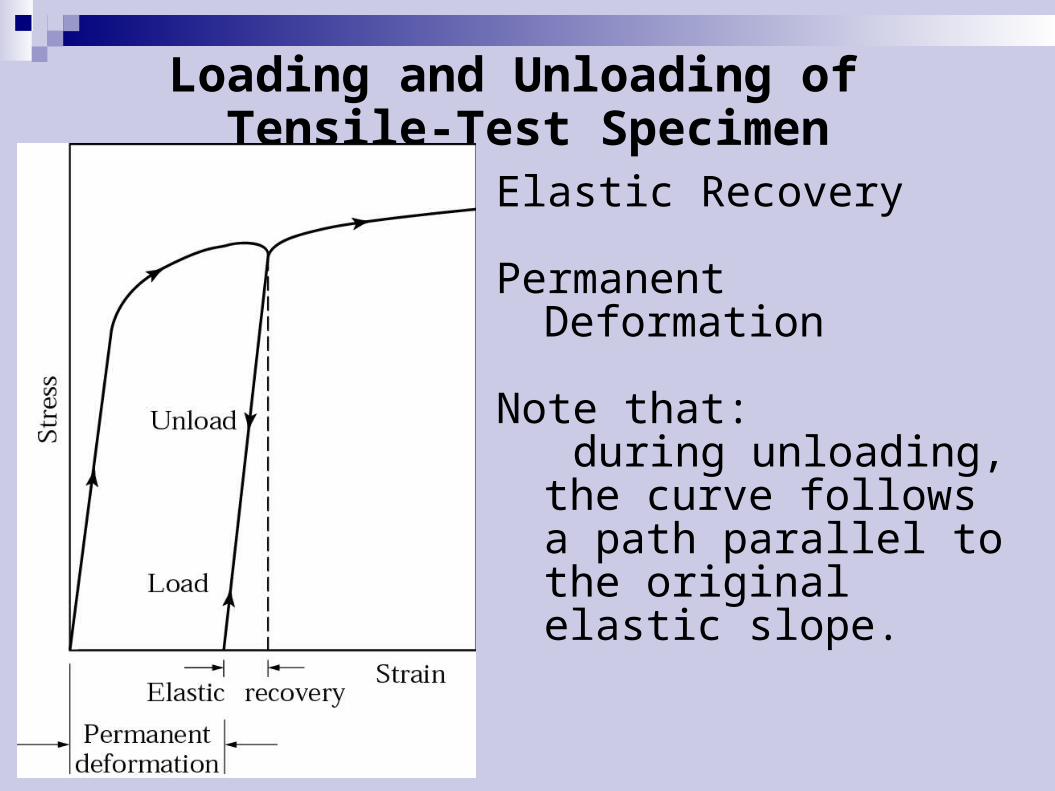
Loading and Unloading of Tensile-Test Specimen
Elastic Recovery
Permanent Deformation
Note that: during unloading, the
curve follows a path parallel to the original elastic slope.

Poisson's ratio
ν = Strain (lateral) Strain (longitudinal)
The elongation of specimen under tension is accompanied by lateral contraction.
Metal; 0.3
Ideal (Upper limit) = 0.5

DuctilityThe extent of plastic deformation that the material undergoes before fracture
2 common measurement
Elongation Reduction of Area
e.g The ductility chalk is zero, chewing gum stretch and necks before it fails
= (lf - lo)
lo
= - (Af – Ao)
Ao

Mechanical Properties of Various Materials at Room
Temperature
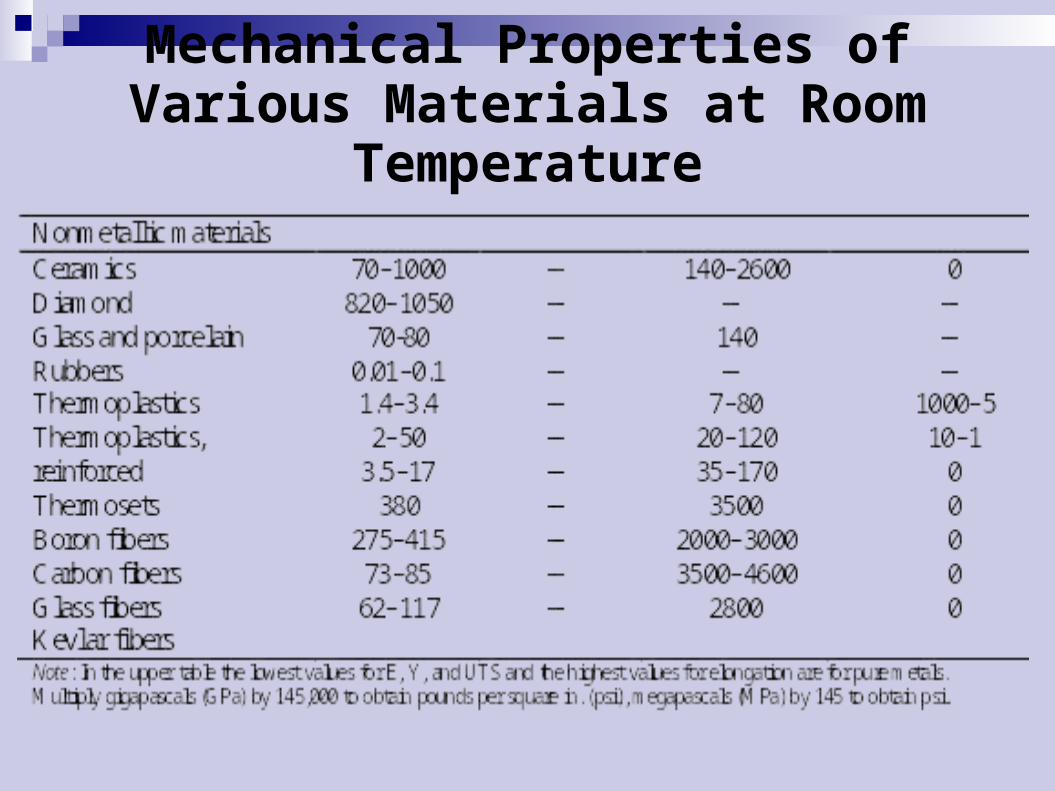
Mechanical Properties of Various Materials at Room
Temperature
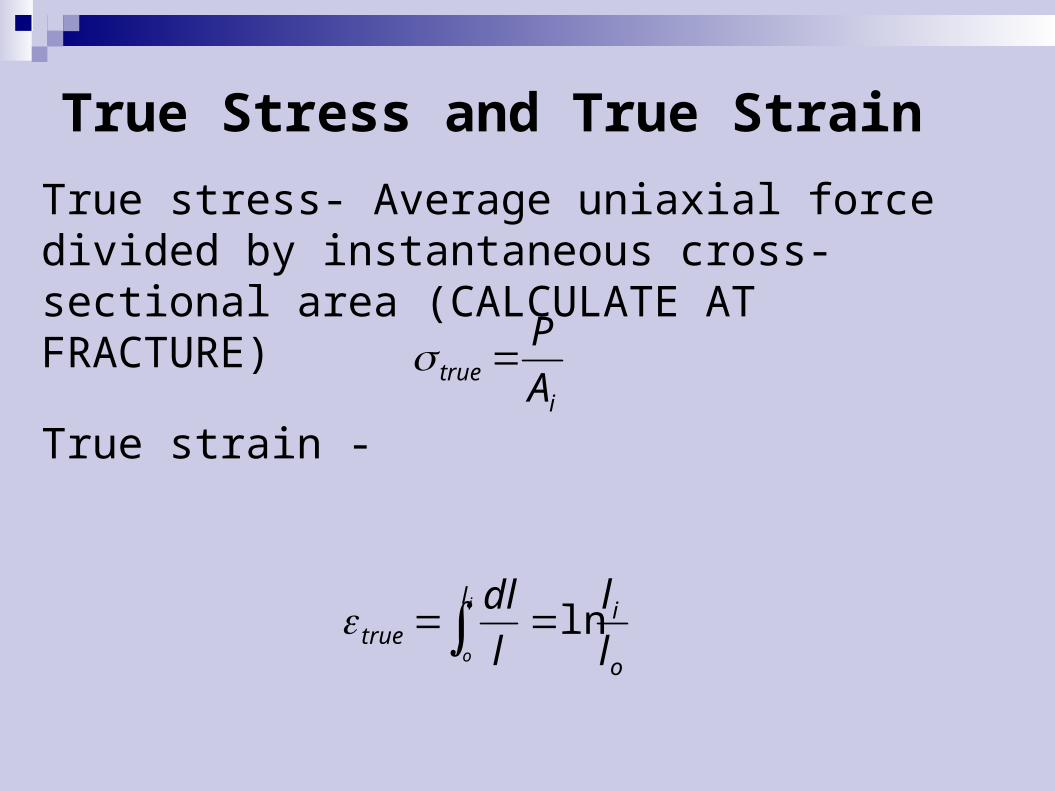
True Stress and True Strain
True stress- Average uniaxial force divided by instantaneous cross-sectional area (CALCULATE AT FRACTURE)
True strain - i
true A
P
o
il
ltrue l
l
l
dli
o
ln
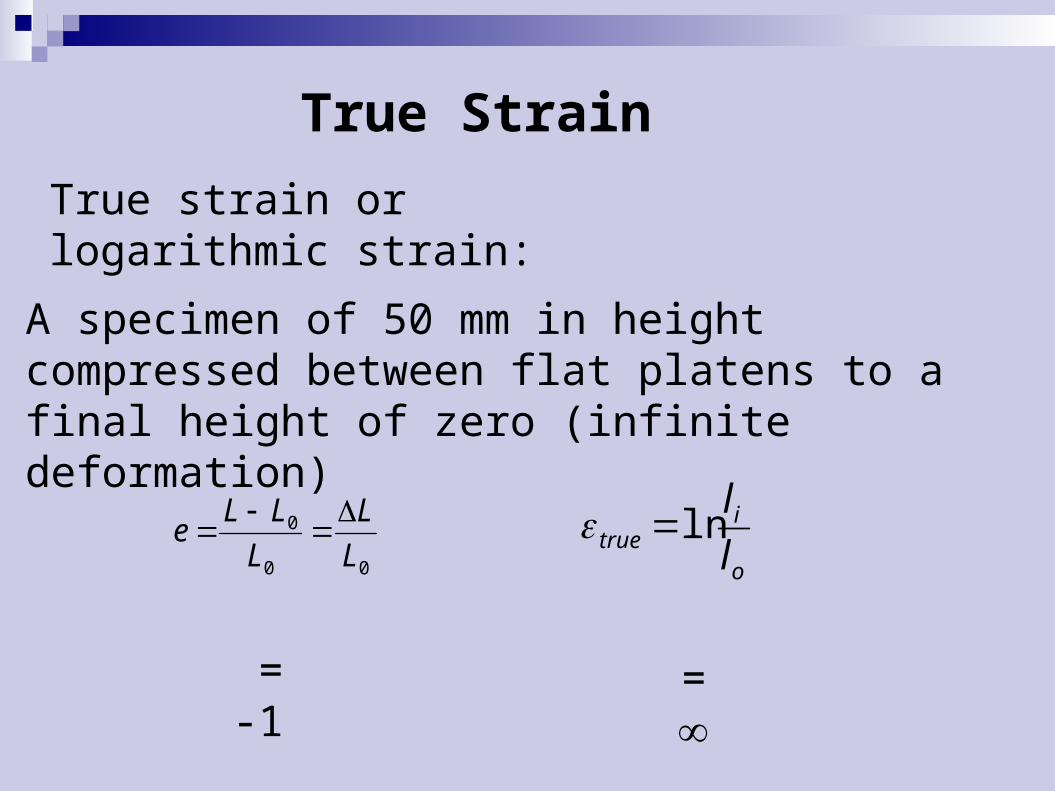
True Strain
True strain or logarithmic strain:
A specimen of 50 mm in height compressed between flat platens to a final height of zero (infinite deformation)
00
0
L
L
L
LLe
o
itrue l
lln
= -1 =

Construction of True Stress-True Strain Curve
The true properties are calculated from engineering properties:
The true stress-strain curve is useful only up to the ultimate load where necking is initiated. After the onset of necking, the length changes are localized in the neck, so the nominal strain, e, which involves a measurement using the entire gauge length cannot be used to calculate the true strain.(IN NECKING AREA)

Necking Corrections
Beyond maximum load the true stress should be determined from actual measurements of load and cross-sectional area.
Beyond maximum load the true strain should be based on actual area or diameter measurements.
*Learned in a more advance courses

Construction of True Stress-True Strain Curve
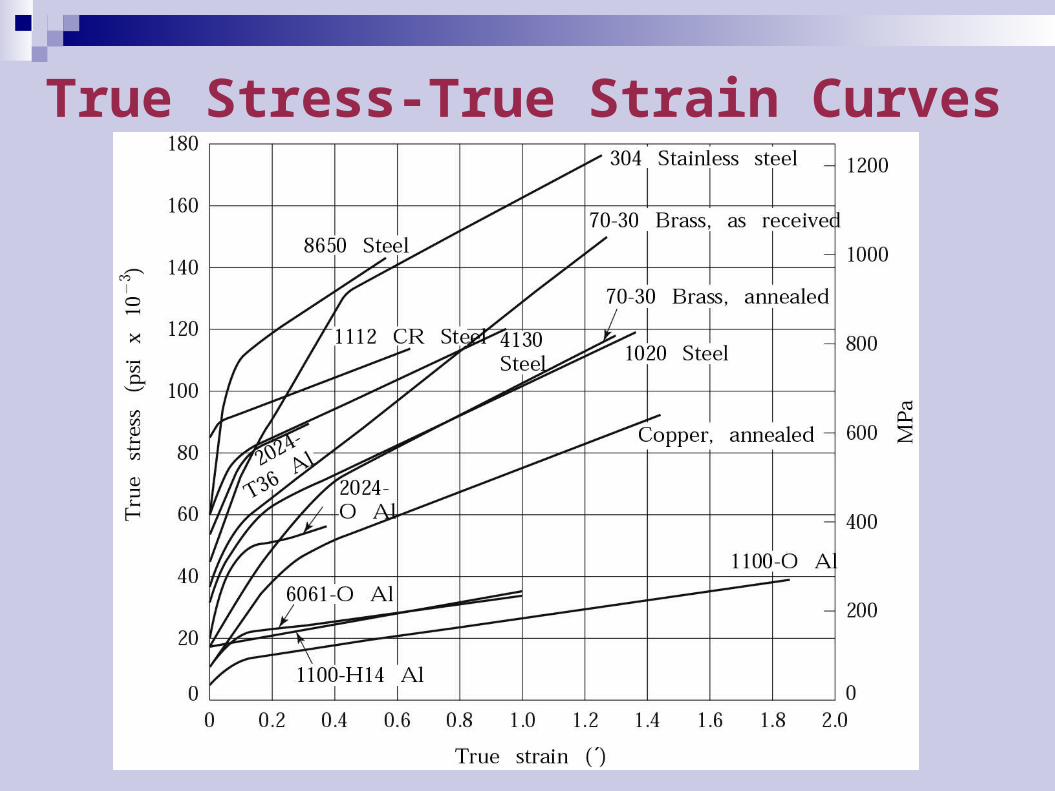
True Stress-True Strain Curves

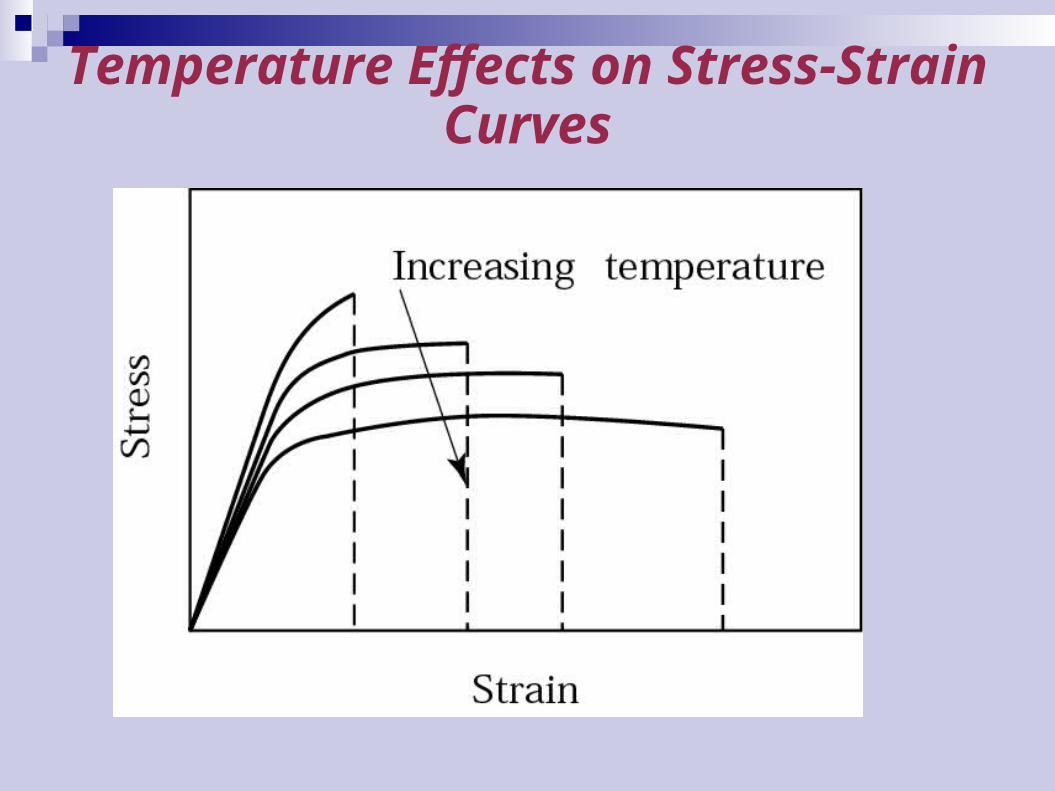
Temperature Effects on Stress-Strain Curves
Increasing temperature effects on stress-strain curves:
a. Raise ductility and toughnessb. Lower yield stress and the modulus of elasticityc. Lower the ultimate tensile strength, d. Lower the toughness (area under the curve) of materials.
Temperature Effects on Stress-Strain Curves

Rate of deformation effects
Deformation rate defined as the speed at which tension test is being carried in unit (m/s, ft/min)The strain rate function of the specimen length.Increase Ultimate Tensile Strength

Effect of Strain Rate on Ultimate Tensile Strength
Note: Combine temperature effect

Typical Ranges of Strain and Deformation Rate in Manufacturing
Processes
Process
True strain
Deformation rate (m/s)
Cold working Forging, rolling Wire and tube drawing
Explosive forming Hot working and warm working
Forging, rolling Extrusion
Machining Sheet-metal forming Superplastic forming
0.1–0.5
0.05–0.5 0.05–0.2
0.1–0.5
2–5 1–10
0.1–0.5 0.2–3
0.1–100 0.1–100 10–100
0.1–30 0.1–1
0.1–100 0.05–2
10-4
-10-2
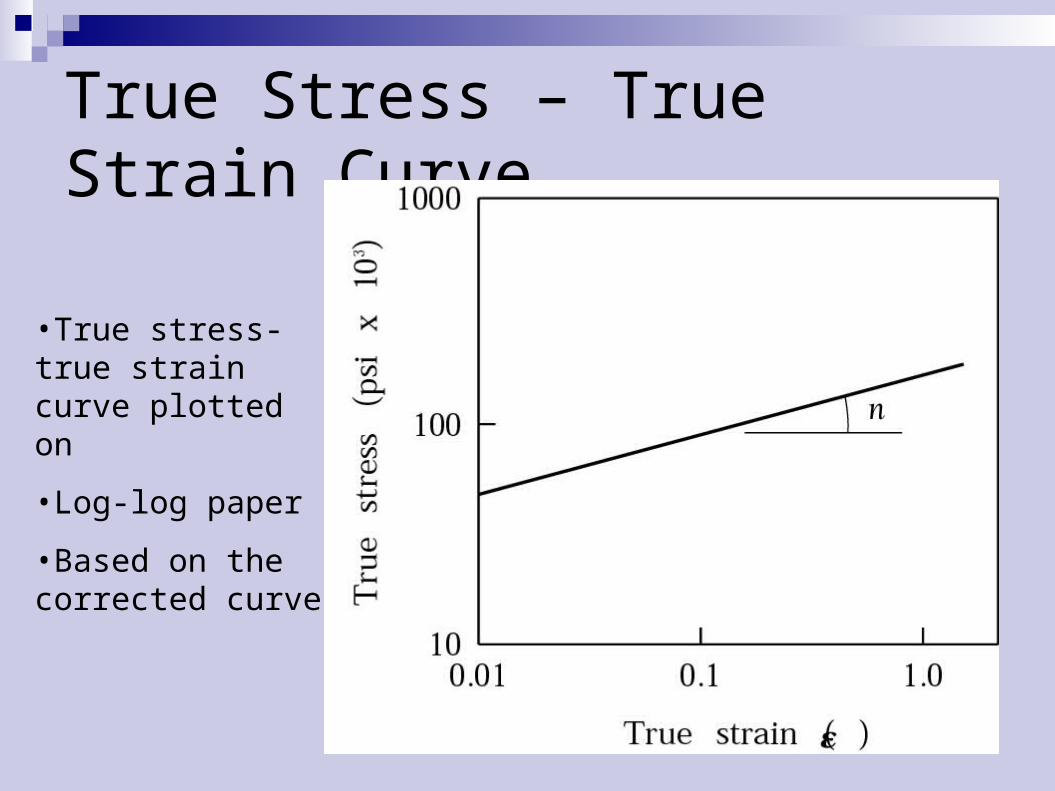
True Stress – True Strain Curve
•True stress-true strain curve plotted on
•Log-log paper
•Based on the corrected curve

Typical Values for K and n at Room Temperature
K (MPa) n Aluminum
1100–O 2024–T4 6061–O 6061–T6
Brass 70–30, annealed 85–15, cold-rolled
Copper, annealed Steel
Low-C annealed 304 stainless, annealed 410 stainless, annealed
180 690 205 410
900 580 315
530 1275 960
0.20 0.16 0.20 0.05
0.49 0.34 0.54
0.26 0.45 0.10

1. Calculate the engineering stress in SI units on a 2.00-cm-diameter rod that is subjected to a load of 1300 kg.
2. Calculate the engineering stress in SI units on a bar 15 cm long and having a cross section of 4.25 mm x 12.0 mm that is subjected to a load of 5000 kg.
Try this..
Problem
1. If the original gage length of a round, 15 mm tensile bar is 50 mm and the final gage length is 65 mm and the final diameter is 7 mm, determine the: i) Elongation, %ii) Ductility index (reduction in area,%)

Question:
1. A 0.500 diameter round sample of a 1030 carbon steel is pulled to failure in a tensile testing machine. The diameter of the sample was 0.343 in. at the fracture surface. Calculate the percent of reduction in area sample.

Assignment
1. Explain about tensile test? What can we understand from tensile test?
2. Define engineering stress and strain with true stress and true strain?
3. Define ductility. Give examples of metals that have good ductility.
4. Distinguish between elastic and plastic deformation?

5. The following engineering stress-strain data were obtained for a 0.2% C plain-carbon steel. (a) Plot the engineering stress-strain curve.
(b) Plot the true stress-strain curve (c) Determine the ultimate tensile strength of the alloy.(d) Determine the percent elongation at fracture.

Tutorials
● Distinguish between engineering stress and true stress● What is the reason that a yield strength is defined as 0.2% offset strength?

Thank You

CHAPTER 3
•Compression
•Torsions
•Bending
•Hardness
•Impact

Compression Test
Applies a load that squeezes the ends of a cylindrical specimen between two platens
Compression test:
(a) compression force applied to test piece in
(1) and (2) resulting change in height
Compression
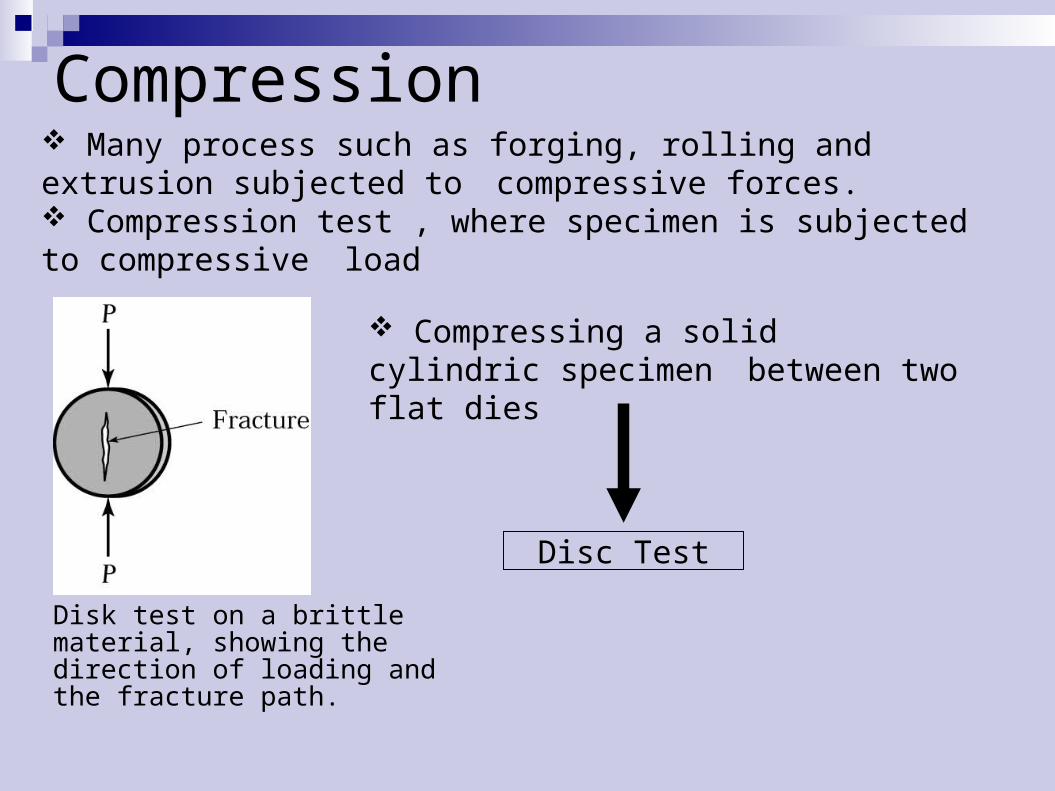
Disk test on a brittle material, showing the direction of loading and the fracture path.
Many process such as forging, rolling and extrusion subjected to compressive forces. Compression test , where specimen is subjected to compressive load
Compressing a solid cylindric specimen between two flat dies
Disc Test

Compression test: Setup for the test with size of test specimen
exaggeratedTensile testing machine can be used (lower section)

Engineering Stress in Compression
As the specimen is compressed, its height is reduced and cross‑sectional area is increased
oe A
F
where Ao = original area of the specimen

Engineering Strain in Compression
Engineering strain is defined
Since height is reduced during compression, value of e is negative (the negative sign is usually ignored when expressing compression strain)
o
o
hhh
e
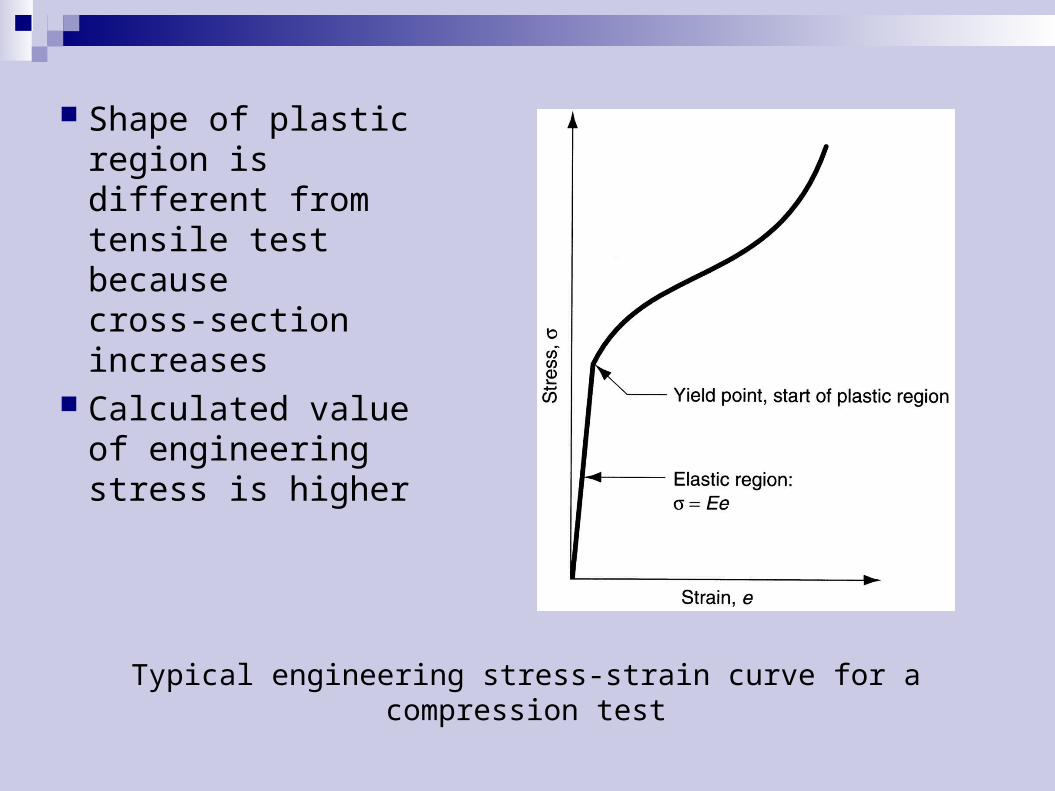
Shape of plastic region is different from tensile test because cross‑section increases
Calculated value of engineering stress is higher
Typical engineering stress‑strain curve for a compression test

Tensile Test vs. Compression Test
Although differences exist between engineering stress‑strain curves in tension and compression, the true stress‑strain relationships are nearly identical
Since tensile test results are more common, flow curve values (K and n) from tensile test data can be applied to compression operations
When using tensile K and n data for compression, ignore necking, which is a phenomenon peculiar to straining induced by tensile stresses
Torsional stressTwistingForce acting to turn one end around the
longitudinal axis of a rod while the other end remains fixed.
Torque = P (force) x r (radius), lb-ftTorque produces a shear stress and shear
deformation both at 90o and parallel to axis-
and separating stress at 45o , which causes brittle metals to fail (chalk)

Torsion-Test Specimen
Typical torsion-test specimen; it is mounted between the two heads of a testing machine and twisted. Note the shear deformation of an element in the reduced section of the specimen.

Shear Properties
Application of stresses in opposite directions on either side of a thin element
Shear (a) stress and (b) strain
Shear Stress and Strain
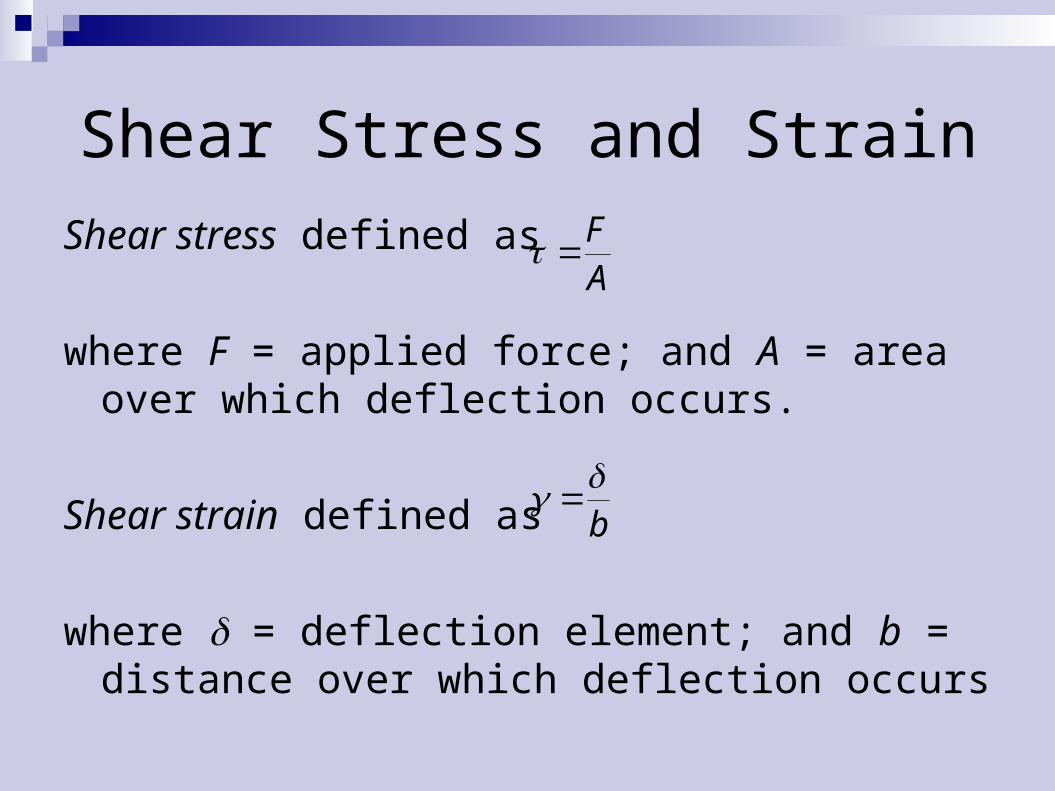
Shear stress defined as
where F = applied force; and A = area over which deflection occurs.
Shear strain defined as
where = deflection element; and b = distance over which deflection occurs
AF
b
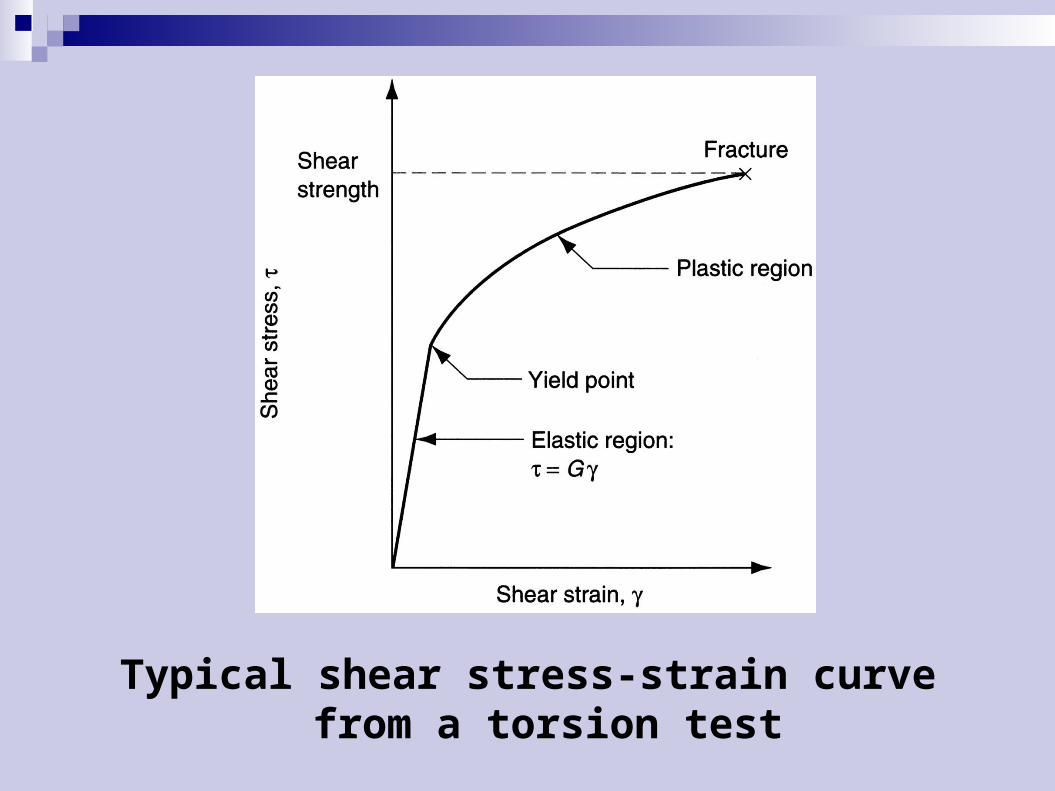
Typical shear stress‑strain curve from a torsion test

Shear Elastic Stress‑Strain Relationship
In the elastic region, the relationship is defined as
G
where G = shear modulus, or shear modulus of elasticity
• For most materials, G 0.4E, where E = elastic modulus

Shear Plastic Stress‑Strain Relationship
Relationship similar to flow curve Shear stress at fracture = shear strength S
Shear strength can be estimated from tensile strength: S 0.7(TS)
Since cross‑sectional area of test specimen in torsion test does not change as in tensile and compression, engineering stress‑strain curve for shear true stress‑strain curve

Bending
Two bend-test methods for brittle materials: (a)three-point bending; (b)four-point bending. The areas on the beams represent the bending-
moment diagrams, described in texts on mechanics of solids. Note the region of constant maximum bending moment in (b); by contrast, the maximum bending moment occurs only at the center of the specimen in (a).
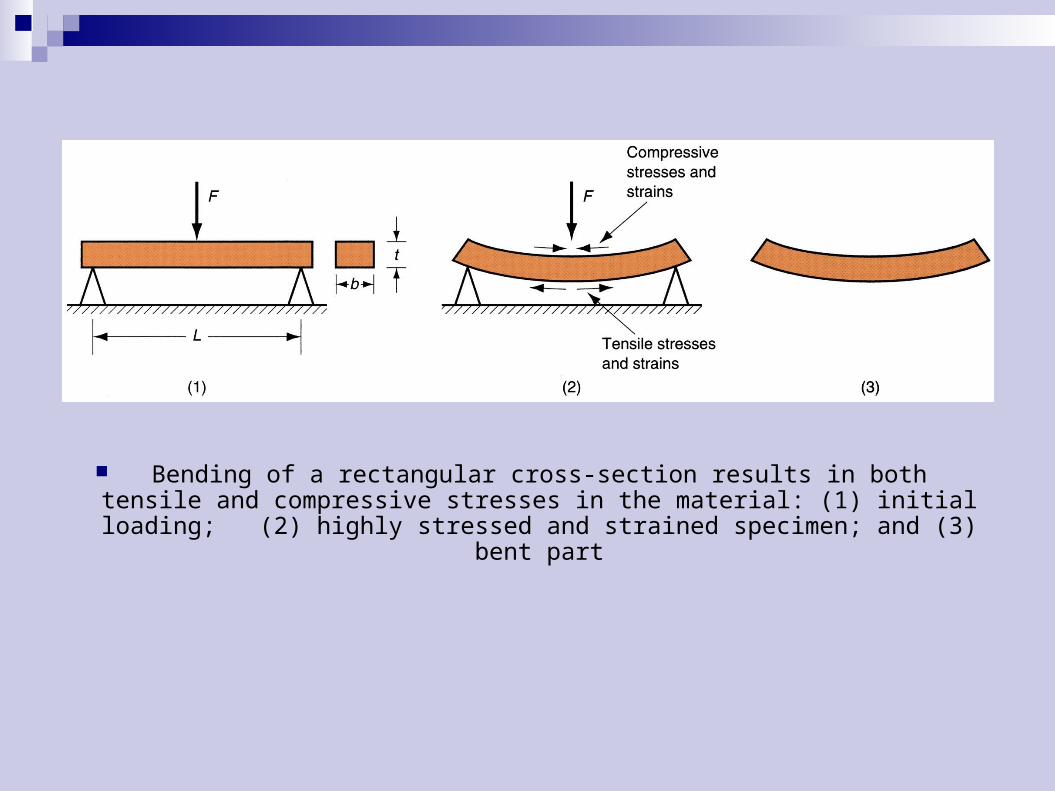
Bending of a rectangular cross‑section results in both tensile and compressive stresses in the material: (1) initial loading; (2) highly stressed and strained specimen; and (3) bent part

Testing of Brittle Materials
Hard brittle materials (e.g., ceramics) possess elasticity but little or no plasticity
Often tested by a bending test (also called flexure test)Specimen of rectangular cross‑section is
positioned between two supports, and a load is applied at its center

Testing of Brittle Materials
Brittle materials do not flex They deform elastically until fracture
Failure occurs because tensile strength of outer fibers of specimen are exceeded
Failure type: cleavage - common with ceramics and metals at low temperatures, in which separation rather than slip occurs along certain crystallographic planes
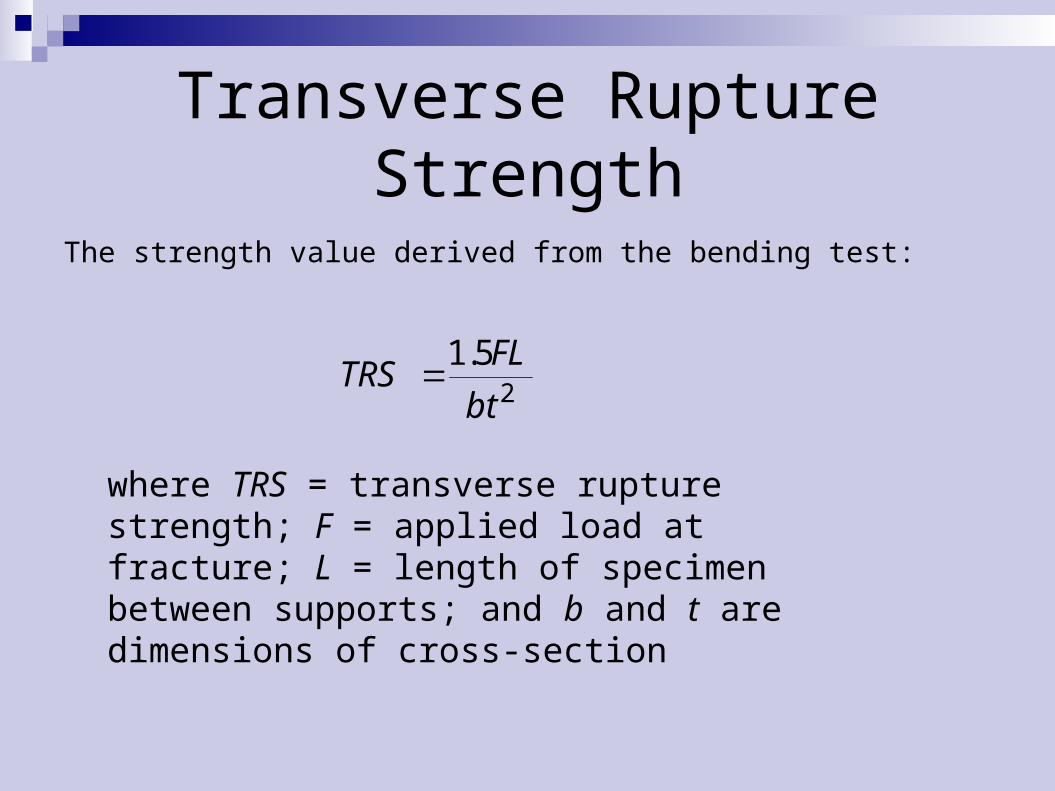
Transverse Rupture Strength
The strength value derived from the bending test:
2
51
bt
FLTRS
.
where TRS = transverse rupture strength; F = applied load at fracture; L = length of specimen between supports; and b and t are dimensions of cross-section
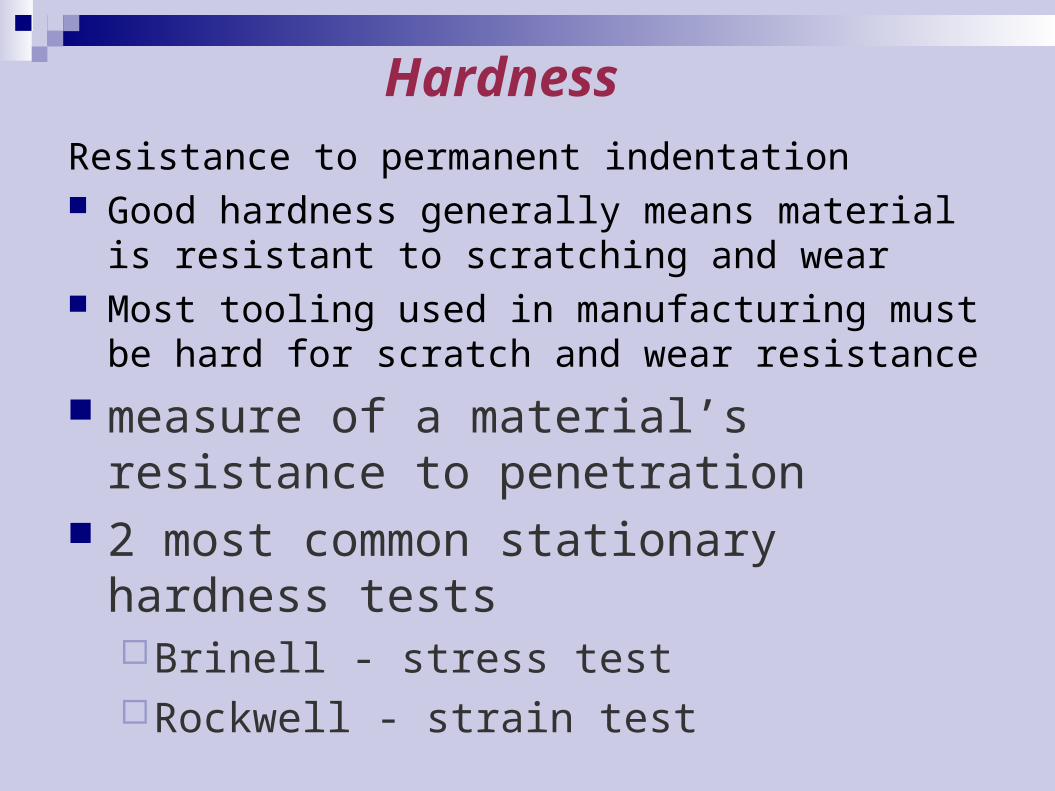
HardnessResistance to permanent indentation Good hardness generally means material is resistant
to scratching and wear Most tooling used in manufacturing must be hard for
scratch and wear resistance
measure of a material’s resistance to penetration
2 most common stationary hardness testsBrinell - stress testRockwell - strain test

Hardness Tests Commonly used for assessing material properties
because they are quick and convenient Variety of testing methods are appropriate due to
differences in hardness among different materials Vickers (HV) and Knoop (HK)- similar to Brinell
(stress tests), but microhardness Other test methods are also available, such as
Scleroscope, and durometer Scleroscope - rebound of a tup or hammer. Mohs - scratch test

Hardness Tests
Figure 2.12 General characteristics of hardness-testing methods and formulas for calculating hardness. The quantity P is the load applied. Source: H. W. Hayden, et al., The Structure and Properties of Materials, Vol. III (John Wiley & Sons, 1965).

Widely used for testing metals and nonmetals of low to medium hardness
A hard ball is pressed into specimen surface with a load of 500, 1500, or 3000 kg
Figure 3.14 ‑ Hardness testing methods: (a) Brinell
Brinell Hardness

Brinell Testing
(c)Indentation geometry in Brinell testing; (a) annealed metal; (b) work-hardened metal; (c) deformation of mild steel under a spherical indenter. Note that the depth of the permanently deformed zone is about one order of magnitude larger than the depth of indentation. For a hardness test to be valid, this zone should be fully developed in the material. Source: M. C. Shaw and C. T. Yang.

Brinell Hardness Number
Load divided into indentation area = Brinell Hardness Number (BHN)
)( 22
2
ibbb DDDD
FHB
where HB = Brinell Hardness Number (BHN), F = indentation load, kg; Db = diameter of ball, mm, and Di = diameter of indentation, mm

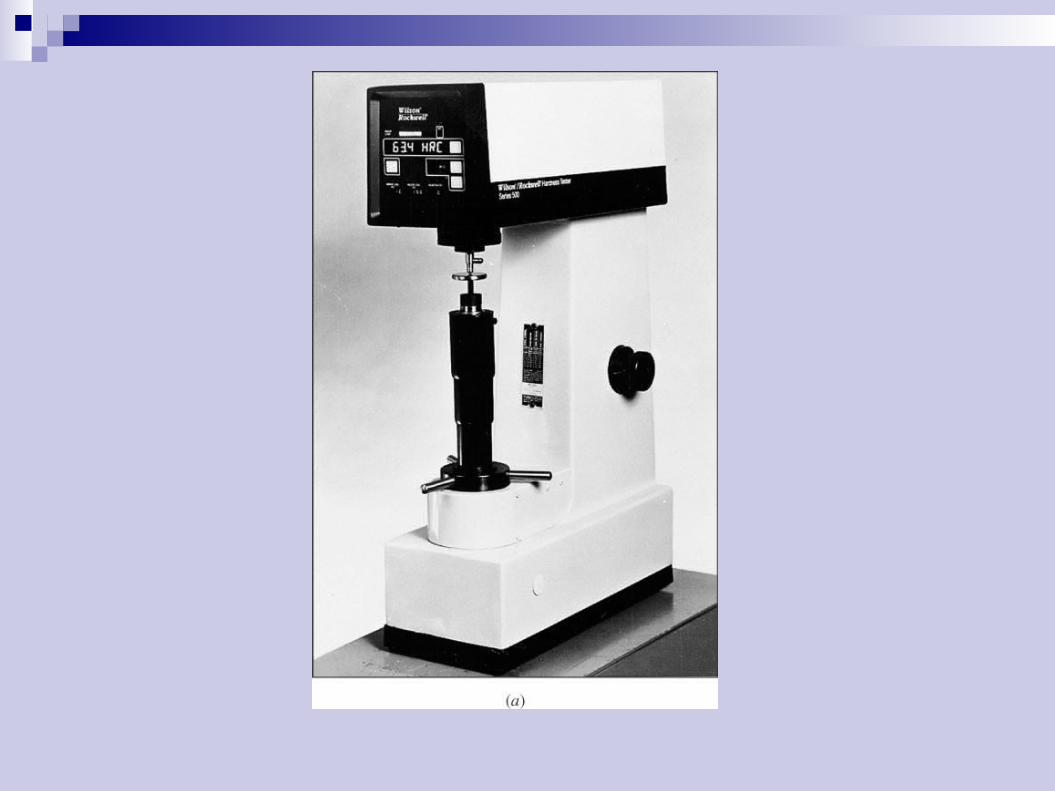
Rockwell Hardness Test
Another widely used test A cone shaped indenter is pressed into specimen
using a minor load of 10 kg, thus seating indenter in material
Then, a major load of 150 kg is applied, causing indenter to penetrate beyond its initial position
Additional penetration distance d is converted into a Rockwell hardness reading by the testing machine

Figure 3.14 ‑ Hardness testing methods: (b) Rockwell:
(1) initial minor load and (2) major load

Hardness Conversion Chart
Chart for converting various hardness scales. Note the limited range of most scales. Because of the many factors involved, these conversions are approximate.

Toughness
● Measure the amount of energy a material can absorb before fracturing● Ability of metal can withstand an impact load without fracturing● Experiment Impact test Izod & Charpy test

Impact Test Specimens
Impact test specimens: (a) Charpy; (b) Izod.
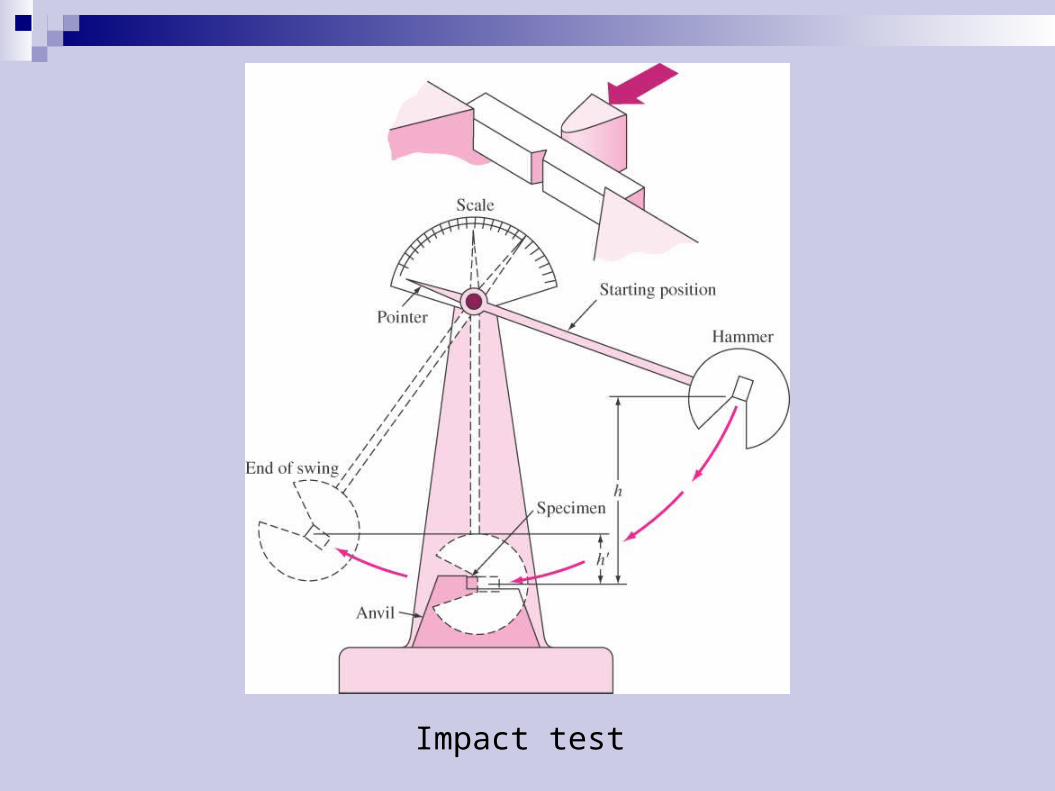
Impact test

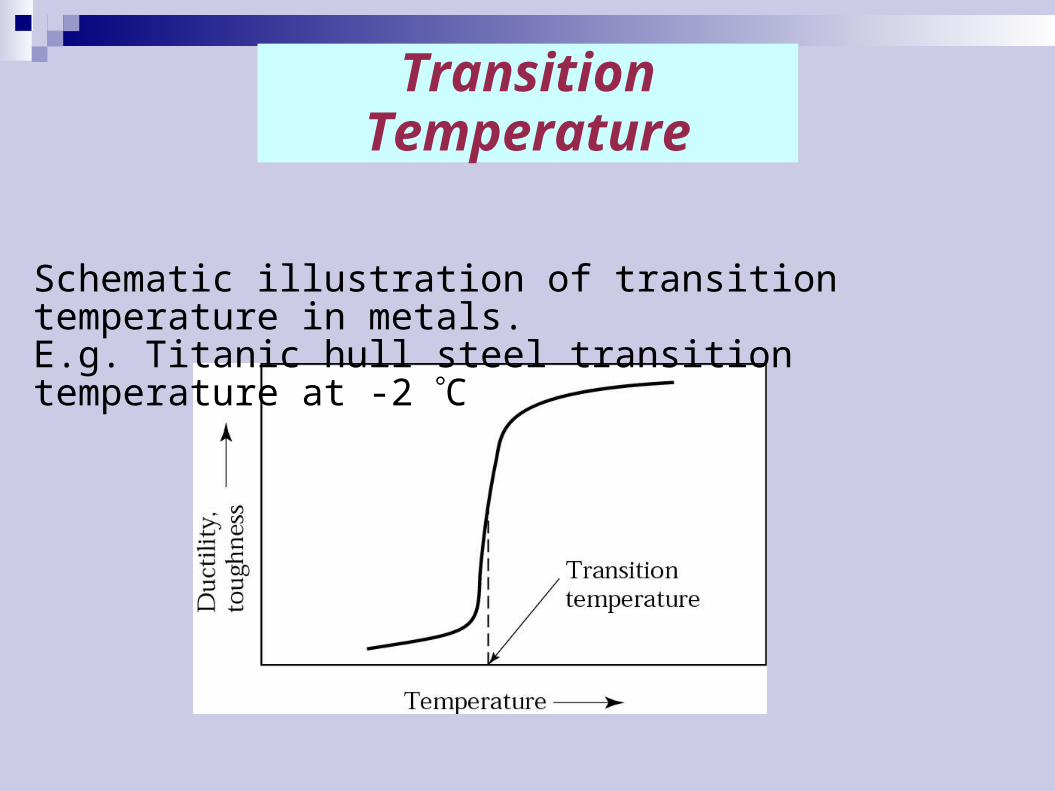
Transition Temperature
Schematic illustration of transition temperature in metals.E.g. Titanic hull steel transition temperature at -2 C
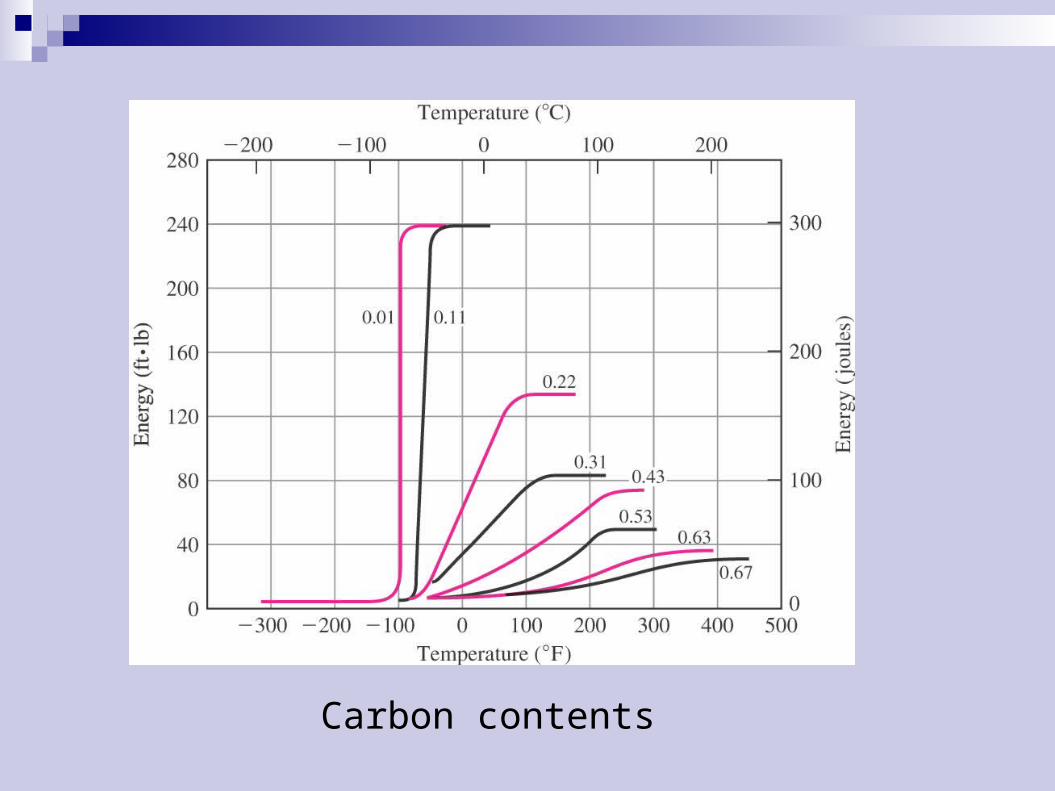
Carbon contents

Thank You

CHAPTER 3
•Fatigue of Metals
•Creep of Metals
•Fracture of Metals
Fatigue Failure
• Metal parts are often design under an assumption of a single static load with a factor of safety (e.g. 0.5 of yield stress).
• Metal parts in service are often subjected to repetitive loading.
• Failure occurs after repetitious or cyclic loading.• Examples: shafts, connecting rods and gears.• Fatigue crack surface:• Refer to Figure 6.19 (3rd Edition)
Fatigue Failure
• Example: Fatigue failure of keyed steel shaft.• A fatigue failure at a point of stress concentration (e.g.
sharp corners or notch).• Figure 6.19 (At the root of the keyway)• Stages of fatigue fracture are:
1. Nucleation.
2. Propagation (clamshell marks)
3. Fracture (Area under load are too small to support further load).
• Surface appearance: (1) smooth striations (clamshell marks) and (2) rough surface formed by fracture

Fatigue Test
R.R. Moore reversed-bending fatigue test machine

Fatigue Test
• E.g. R.R. Moore reversed-bending fatigue test machine.• The specimen is under bending load from the applied
weights.• Top surface is compressed and bottom part is stretched.• Rotation caused the bending stress to be alternated
between the top and bottom surface, i.e. cyclic loading• A revolution counter records when the fatigue failure
occurs in numbers of cycle (e.g. 106 cycles)• Test is repeated using a number of different loads to
cause different stress level.
S-N Curves
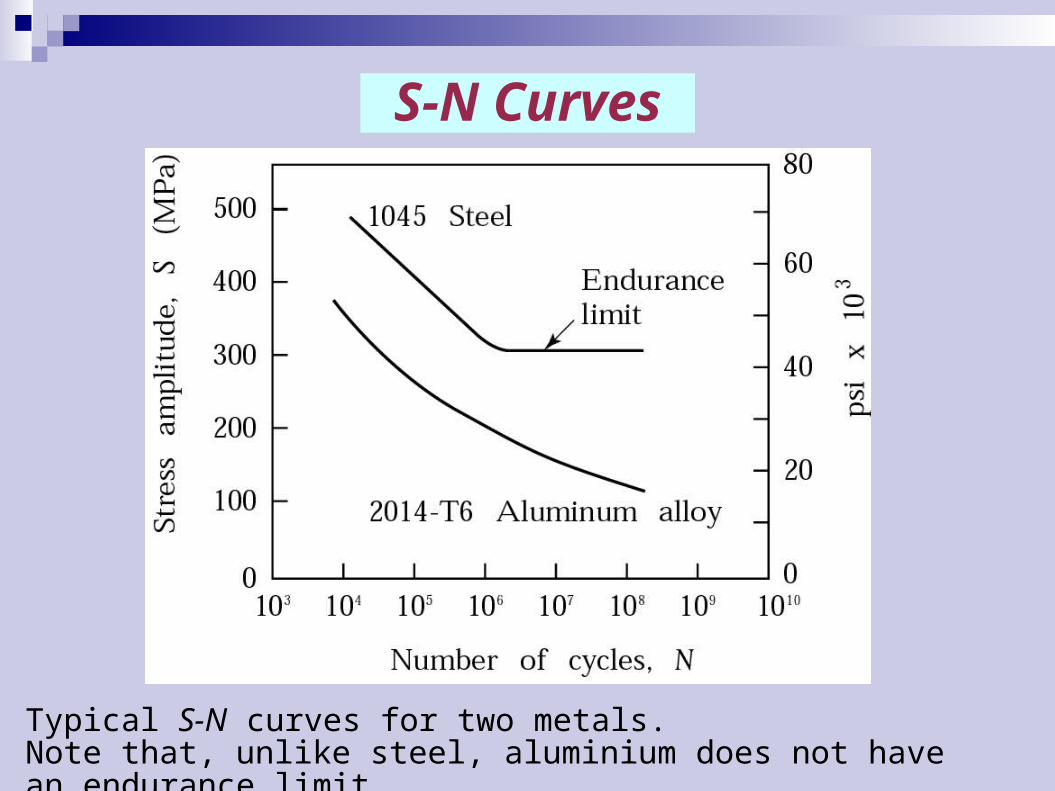
Typical S-N curves for two metals. Note that, unlike steel, aluminium does not have an endurance limit.

S-N Curves
• Data from the test are plotted as Stress (S) versus Number of cycles (N)• Figure 6.23
• There is a general decrease of the level of stress to cause failure as the number cycles is increased.
• For carbon steel, there is levelling off in the decrease.• The maximum stress that cause fatigue failure, regardless of the
number of cycles.
• Endurance limit of fatigue limit• Carbon steels have an endurance limit of 0.4-0.5 time its UTS
• A component can have an infinite life if design with stress level below the endurance limit

Endurance Limit/Tensile Strength versus Tensile Strength
●Infinite life design is not always possible.●E.g. Aluminium does not have an endurance limit.●Small cyclic stress can cause fatigue failure●Components need to be very light.
●Other methods are available for fatigue life calculation (Advance course!, Section 6.4).
●Aircraft parts are design to have finite life and need to be change at a specified intervals.

Factors that Affect the Fatigue Strength of Metals
• Stress concentration. Avoid sharp corners.
• Surface roughness. Ensure smooth surface finish.
• Surface conditions. Surface harden to avoid crack nucleation.
• Environment. Chemical attack on surface initiates cracks.

Creep
• Creep is a permanent deformation, under a constant static load over a period of time.
• A process of slow plastic deformation• Even though the static load initially does cause
permanent deformation (i.e. stress level below yield stress).
• At an elevated temperature (for most metals).• Polymers are very susceptible to creep even at room
temperature!• Creep is important in high temperature applications,
e.g. gas turbines, steam lines, nuclear reactors.

Creep• A creep test involves in subjecting a specimen to a
constant tensile load at a certain temperature.
• Measurements are taken for changes in length (strain) at various time increments.
• The creep test results are presented as Creep strain vs. time, at a constant stress and temperature.
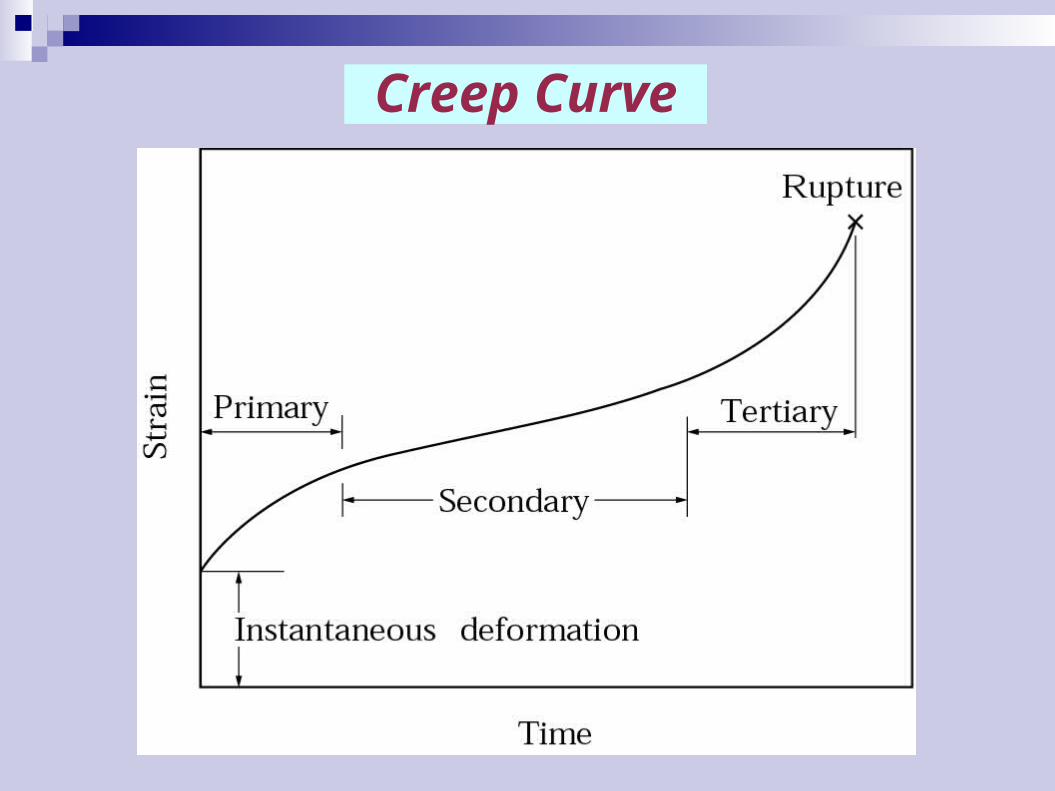
• Three stages of creep;- Primary, - Secondary and- Tertiary
Creep Curve

Creep• Begins with an instantaneous rapid elongation as the
load is applied.
• Creep rate d/dt, slope of the creep curve.
• Primary creep is where the creep rate progressively decreases with time.
• Secondary creep is where the creep rate is constant (steady state creep)
• Tertiary creep is where creep rate rapidly increase with time to the strain at fracture.


Creep• Shape of creep curve depends strongly on the
applied load (stress) and temperature.• The secondary creep is a constant creep rate
and referred to as the minimum creep rate.• For design data purposes, a specimen is
subjected to a minimum creep rate of 10-5
percent/hour.• This data is used for design purposes.• To be learned in advanced mechanical
engineering courses.
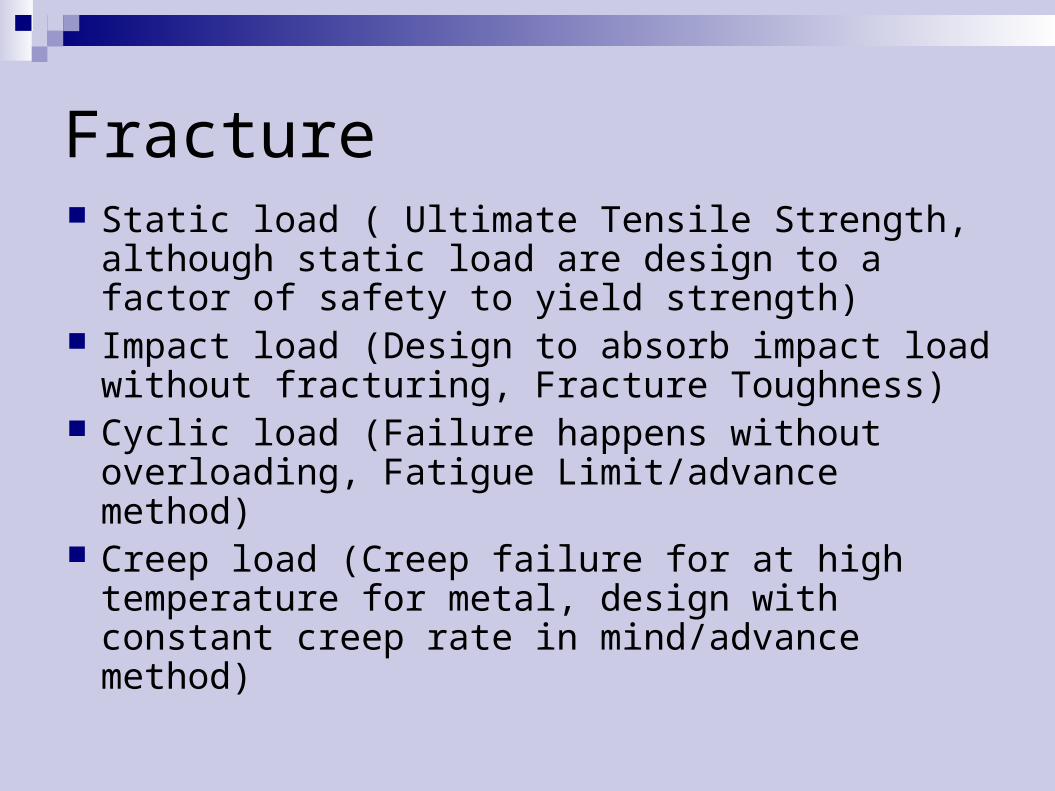
Fracture Static load ( Ultimate Tensile Strength,
although static load are design to a factor of safety to yield strength)
Impact load (Design to absorb impact load without fracturing, Fracture Toughness)
Cyclic load (Failure happens without overloading, Fatigue Limit/advance method)
Creep load (Creep failure for at high temperature for metal, design with constant creep rate in mind/advance method)

Fracture of Metals Fracture is the separation of a solid under stress into
two or more parts. Ductile Fracture – Brittle Fracture, or a mixture Ductile Fracture of a metal occurs after extensive
plastic deformation and is characterised by slow crack propagation
Brittle Fracture happens with almost no plastic deformations. Occurs in which the separation rather than slip occurs along certain crystallographic planes with rapid crack propagation:- common with ceramics and metals (BCC) at low temperatures and high strain rate
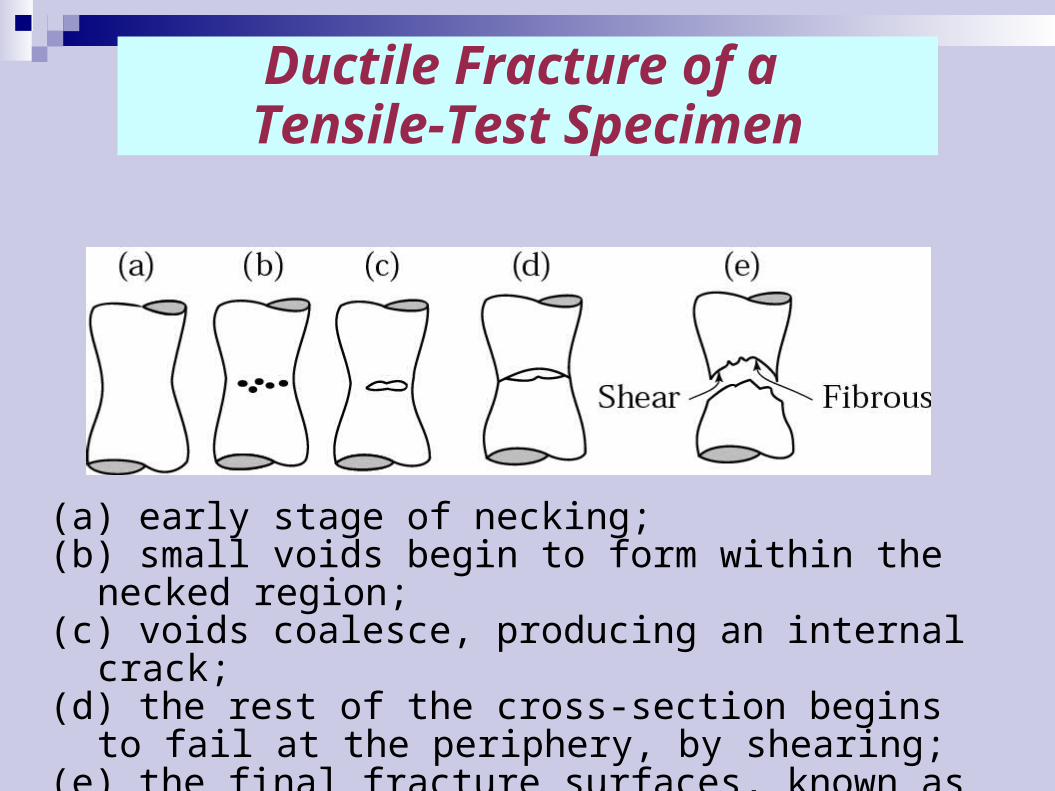
Ductile Fracture of a Tensile-Test Specimen
(a) early stage of necking; (b) small voids begin to form within the necked region; (c) voids coalesce, producing an internal crack; (d) the rest of the cross-section begins to fail at the periphery,
by shearing; (e) the final fracture surfaces, known as cup- (top fracture
surface) and cone- (bottom surface) fracture.

Ductile Fracture
Surface of ductile fracture in low-carbon steel, showing dimples.
Fracture is usually initiated at impurities, inclusions, or preexisting voids (microporosity) in the metal.
Source: K.-H. Habig and D. Klaffke. Photo by BAM Berlin/Germany.

Deformation of Soft and Hard Inclusions in Ductile Fracture
Stages of Ductile Fracture(b) small voids begin to form within the necked region; (c) voids coalesce, producing an internal crack;

Failure and Fracture of Materials in Tension
Schematic illustration of the types of fracture in tension: (a) brittle fracture in polycrystalline metals; (b) shear fracture in ductile single crystals(c) ductile cup-and-cone fracture in polycrystalline metals;(d) complete ductile fracture in polycrystalline metals, with 100% reduction
of area.

Failure and Fracture of Materials in Tension & Compression
Schematic illustration of types of failures in materials:(a) necking and fracture of ductile materials; (b) Buckling of ductile materials under a compressive load; (c) fracture of brittle materials in compression; (d) cracking on the barreled surface of ductile materials in compression.

Brittle Fracture
Brittle fracture in polycrystalline metals propagates along the matrix of the grains.
Brittle fracture can also happens along grain boundaries if the grain boundaries are weaken by brittle film or segregation.
Figure 6.13 (3rd Edition): Brittle cleavage fracture of ferritic ductile iron)
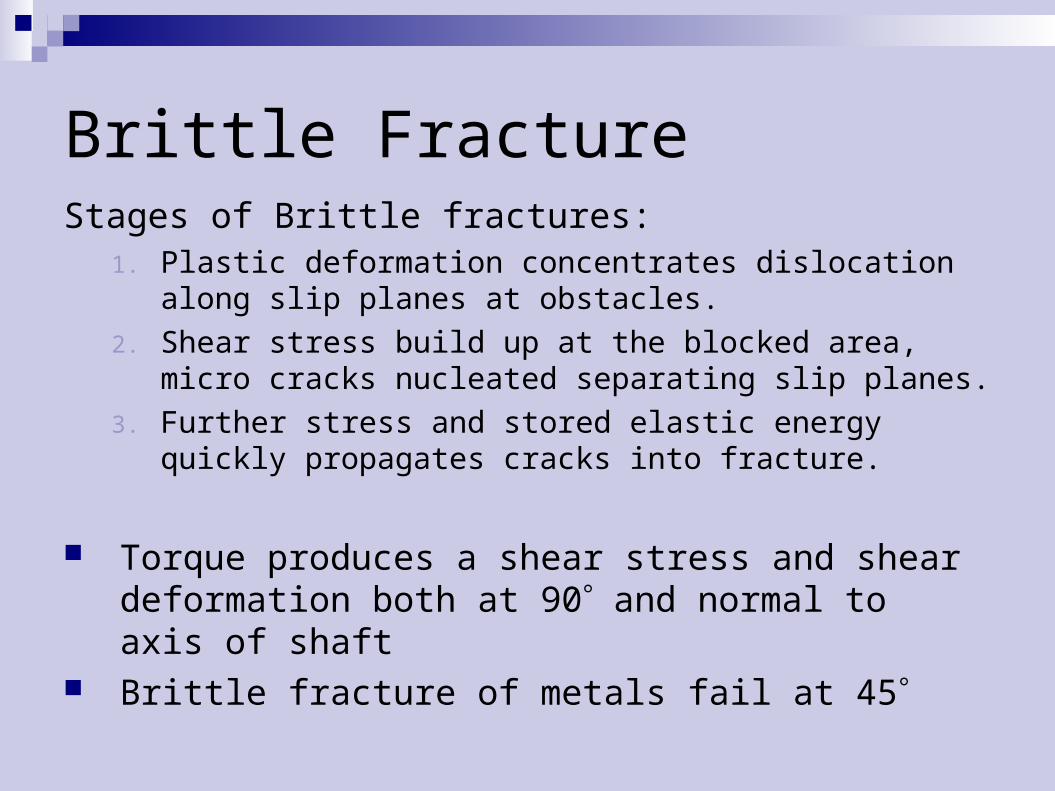
Brittle FractureStages of Brittle fractures:
1. Plastic deformation concentrates dislocation along slip planes at obstacles.
2. Shear stress build up at the blocked area, micro cracks nucleated separating slip planes.
3. Further stress and stored elastic energy quickly propagates cracks into fracture.
Torque produces a shear stress and shear deformation both at 90 and normal to axis of shaft
Brittle fracture of metals fail at 45

Fracture Toughness Concept
Impact load i.e. high strain rate and low temperature favours brittle factures.
Impact tests (Izod/Charpy) do not provide date for design purposes for material/components which already contains internal flaws or cracks.
Test specimens are intentionally made with cracks.
Introduction of stress intensity factors (KIC), to be learned in advance classes.

Mechanical Properties in Design and Manufacturing
Mechanical properties determine a material’s behavior when subjected to mechanical stresses Properties include elastic modulus, ductility, hardness, and
various measures of strength Dilemma: mechanical properties desirable to the designer,
such as high strength, usually make manufacturing more difficult The manufacturing engineer should appreciate the design
viewpoint and the designer should be aware of the manufacturing viewpoint

Why Mechanical Properties Important?
Parameters Application
Hardness Components subject to wear
Fracture toughness Sudden highly stressed or safety critical components
Fatigue life Repeated cyclic loading conditions
Impact properties Components exposed to sudden stress, especially at low temperatures
Creep
Stiffness
Strength
High temperature operation
To retain accuracy of positions
Static load carrying capabilities

Stiffness-Weight Design Considerations
Example
Strain
Stress
E
Stiffer material

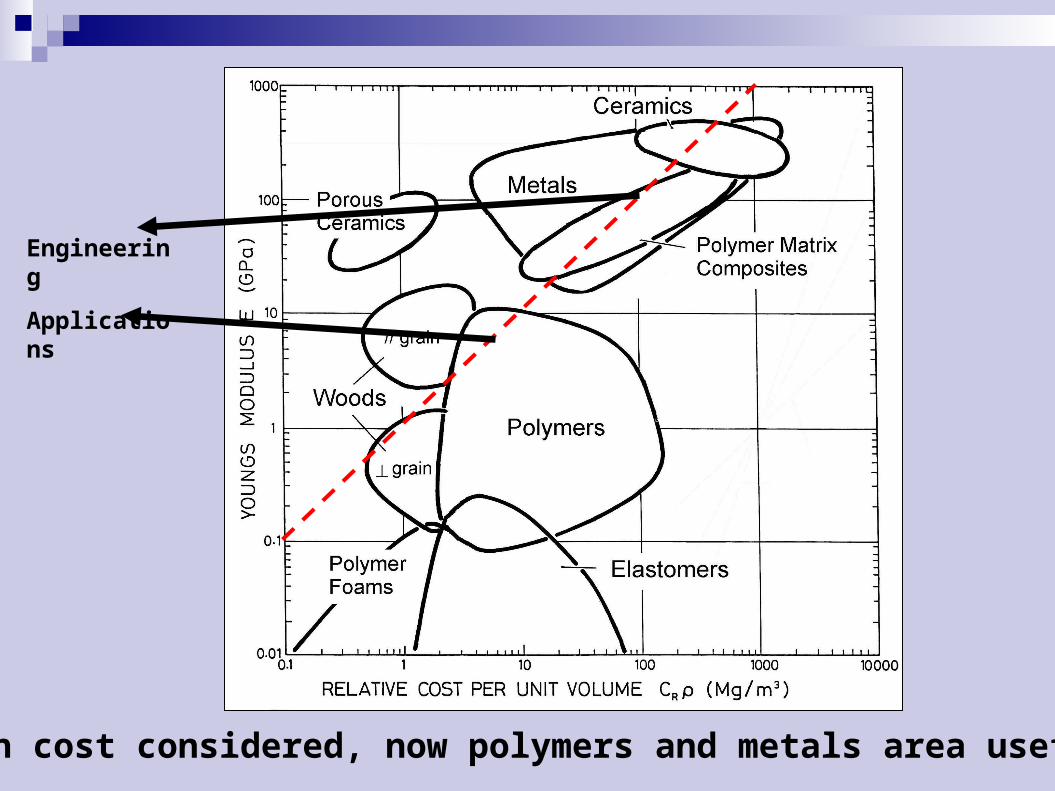
With cost considered, now polymers and metals area useful!
Engineering
Applications

• Design uncertainties mean we do not push the limit.• Factor of safety, N
working
y
N
Often N isbetween1.2 and 4
• Ex: Calculate a diameter, d, to ensure that yield does not occur in the 1045 carbon steel rod below. Use a factor of safety of 5.
1045 plain carbon steel: y=310MPa TS=565MPa
F = 220,000N
d
Lo working
y
N
220,000N
d2 /4
5
Design (Safety) factor

QUESTIONS

●Describe the difference between brittle and ductile fracture?● Describe the difference between strain-rate and deformation rate?● Describe a metal fatigue failure.● Describe the four major factors that affect the fatigue strength of a metal.
● Explanation on compression, torsion, and hardness test● Explanation on toughness, fatigue and creep test
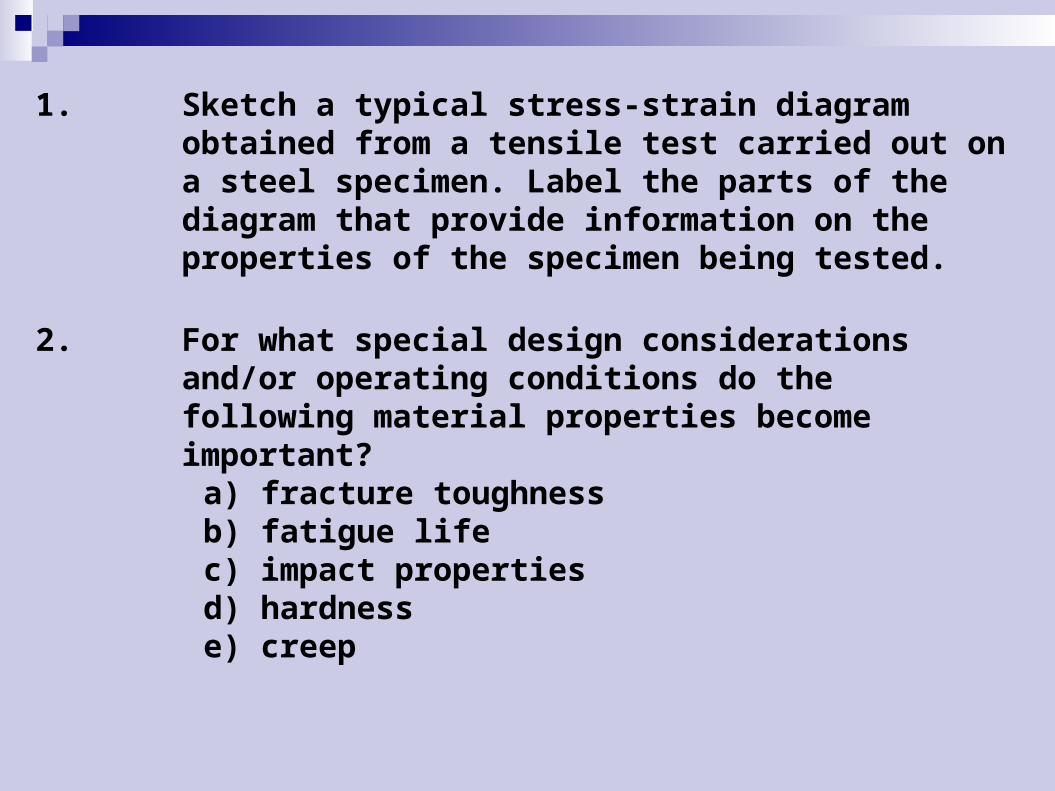
1. Sketch a typical stress-strain diagram obtained from a tensile test carried out on a steel specimen. Label the parts of the diagram that provide information on the properties of the specimen being tested.
2. For what special design considerations and/or operating conditions do the following material properties become important?a) fracture toughnessb) fatigue lifec) impact propertiesd) hardnesse) creep

1. During a tensile test in which the starting gage length = 125.0 mm and the cross‑ sectional area = 62.5 mm2, the following force and gage length data are collected
(1) 17,793 N at 125.23 mm, (2) (2) 23,042 N at 131.25 mm, (3) (3) 27,579 N at 140.05 mm, (4) (4) 28, 913 N at 147.01 mm, (5) (5) 27,578 N at 153.00 mm, and (6) (6) 20,462 N at 160.10 mm. (7) The maximum load is 28,913 N and the final data point
occurred immediately prior to failure. a) Plot the engineering stress strain curveb) Yield strengthc) Modulus of elasticityd) Tensile strength.

1. A test specimen in a tensile test has a gauge length of 2.0 in and an area = 0.5 in2. During the test the specimen yields under a load of 32000 Ib. The corresponding gauge length = 2.0083 in. The maximum load = 60,000 Ib is reached at a gauge length = 2.6 in. Determine;a) Yield strengthb) Modulus of elasticity, Ec) Tensile strength, TS

ANSWER1. A bar with cross section of 9 x 4 mm2, which is 36 x 10-6 m2 load of 3500 kg
convert to Newton, we get 3500 * 9.81 = 34335 N then the eng. stress is load/area = 34335/(36 x 10-6) = 9.54 x 10⁸ N/m2 = 9.54 x 10⁸ Pa
2. A brass wire is cold drawn 25% to a diameter of 1.10 mm (radius 0.55 mm) ( Note : percent reduction concern on the area not a diameter)
then the area after 25% cold drawn is π x 0.552 = 0.95 mm2the percent reduction is (Ao – A)/Ao * 100 then,(Ao – 0.95) / Ao x 100 = 25, then Ao = 1.2676 mm2then it is further cold drawn to 0.9 mm ( r is 0.45 mm)the final area will be π x 0.452 = 0.6364 mm2therefore, the total percent cold reduction is (1.2676-0.6364)/1.2676 x 10049.79 %
3. s = F/A = F/Ao (l/lo) = s ( l/lo)e= l-lo /lo => e = l/lo -1 => l/lo = e + 1s = s (e+1)
= (2.75 MPa)(0.0035 + 1)= 2.76 MPa

EXERCISEEXERCISE
1. The engineering stress (s) is 2.75 MPa. The engineering strain (e) is 0.35%. Calculate the true stress (s) Hint : e = l – lo
lo
ANSWER

1. The following engineering stress-strain data were obtained for a 0.1 % C plain carbon steel.
a) Plot the engineering stress strain curve.
b) Determine the elastic modulus of the alloy.
c) The yield strength of the alloy
d) Determine the ultimate tensile strength of the alloy.
e) Determine the percent elongation at fracture.
EXERCISEEXERCISE
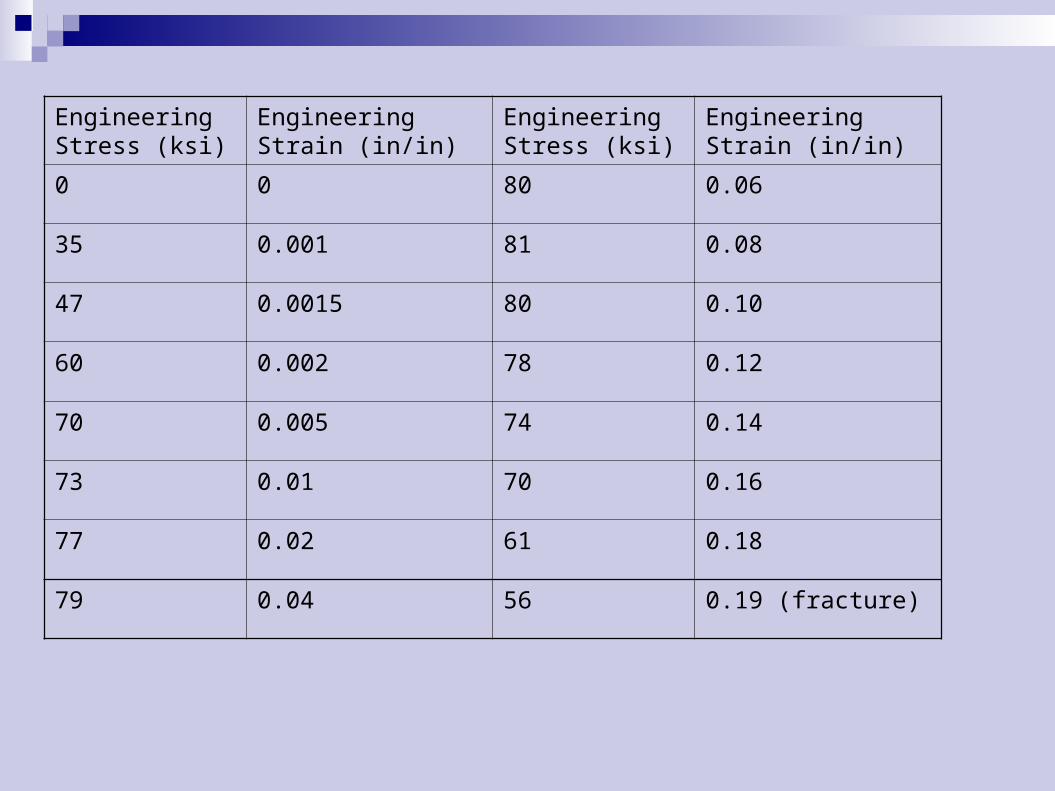
Engineering Stress (ksi)
Engineering Strain (in/in)
Engineering Stress (ksi)
Engineering Strain (in/in)
0 0 80 0.06
35 0.001 81 0.08
47 0.0015 80 0.10
60 0.002 78 0.12
70 0.005 74 0.14
73 0.01 70 0.16
77 0.02 61 0.18
79 0.04 56 0.19 (fracture)

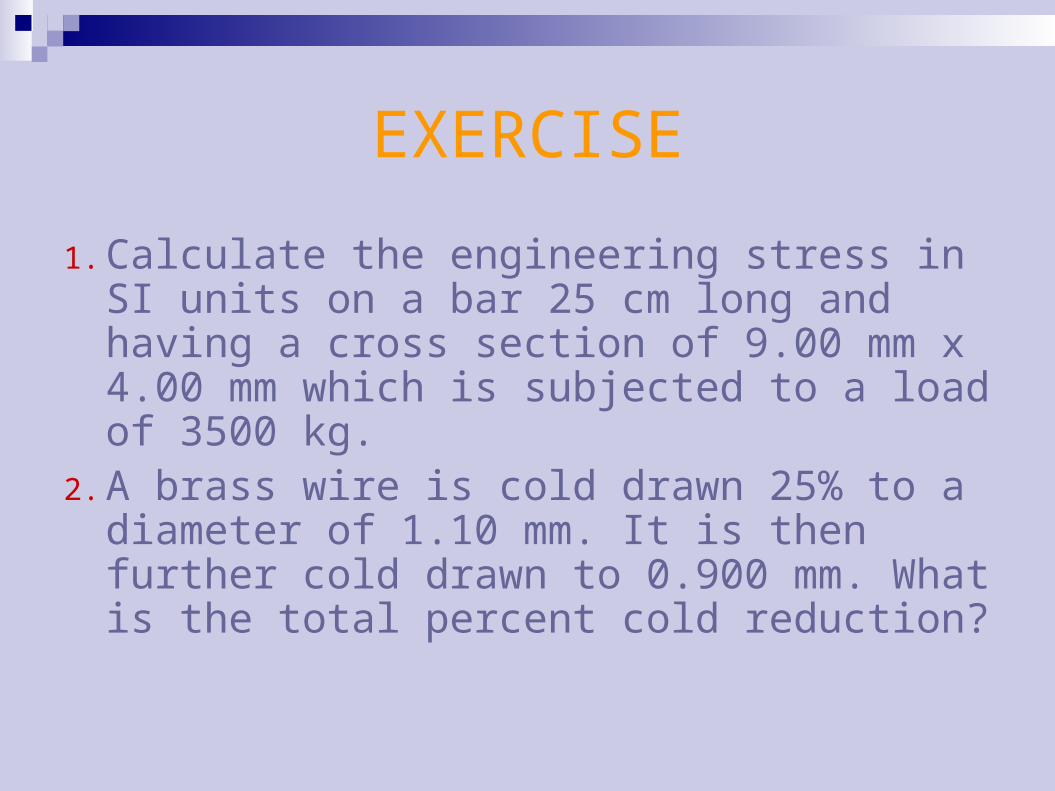
EXERCISE
1. Calculate the engineering stress in SI units on a bar 25 cm long and having a cross section of 9.00 mm x 4.00 mm which is subjected to a load of 3500 kg.
2. A brass wire is cold drawn 25% to a diameter of 1.10 mm. It is then further cold drawn to 0.900 mm. What is the total percent cold reduction?

Thank You

lecture #1clecture #1c

IntroductionIntroduction
DensityElectrical, Magnetic and Optical
PropertiesThermal Properties
Corrosion Resistance

Physical PropertiesPhysical Properties Properties that define the behavior of Properties that define the behavior of
materials in response to physical forces materials in response to physical forces other than mechanicalother than mechanical– Components in a product must do more Components in a product must do more
than simply withstand mechanical stressesthan simply withstand mechanical stresses– They must conduct electricity (or prevent They must conduct electricity (or prevent
conduction), allow heat to transfer (or conduction), allow heat to transfer (or allow its escape), transmit light (or block allow its escape), transmit light (or block transmission), and satisfy many other transmission), and satisfy many other functionsfunctions

Physical Properties in Materials Physical Properties in Materials SelectionSelection
Important in manufacturing because they Important in manufacturing because they often influence process performanceoften influence process performance
Examples:Examples:– In machining, thermal properties of the work In machining, thermal properties of the work
material determine the cutting temperature, material determine the cutting temperature, which affects how long tool can be used which affects how long tool can be used before failurebefore failure
– In microelectronics, electrical properties of In microelectronics, electrical properties of silicon and how these properties can be silicon and how these properties can be altered by chemical and physical processes altered by chemical and physical processes is the basis of semiconductor manufacturingis the basis of semiconductor manufacturing

Physical Properties of Material

DensityDensity
The mass per unit volume (cm3 = mL, m3, etc.) of is called density, an intensive property.
Determined by atomic number and other factors such as atomic radius, and atomic packing

Importance of DensityImportance of DensityImportant consideration in materials selection for a Important consideration in materials selection for a
given application, but it is generally not the only given application, but it is generally not the only property of interest property of interest
Relate to weight saving with major concerns to Relate to weight saving with major concerns to energy consumption and power limitation such as energy consumption and power limitation such as in automotive bodies and aircraft.in automotive bodies and aircraft.– Strength is also important, and the two Strength is also important, and the two
properties are often related in a properties are often related in a strength‑to‑weight ratio (specific strength)strength‑to‑weight ratio (specific strength),, which is tensile strength divided by its densitywhich is tensile strength divided by its density Useful ratio in comparing materials for Useful ratio in comparing materials for
structural applications in aircraft, structural applications in aircraft, automobiles, and other products.automobiles, and other products.

Specific Strength (tensile strength/density) and Specific Stiffness (elastic modulus/density) at room temperature
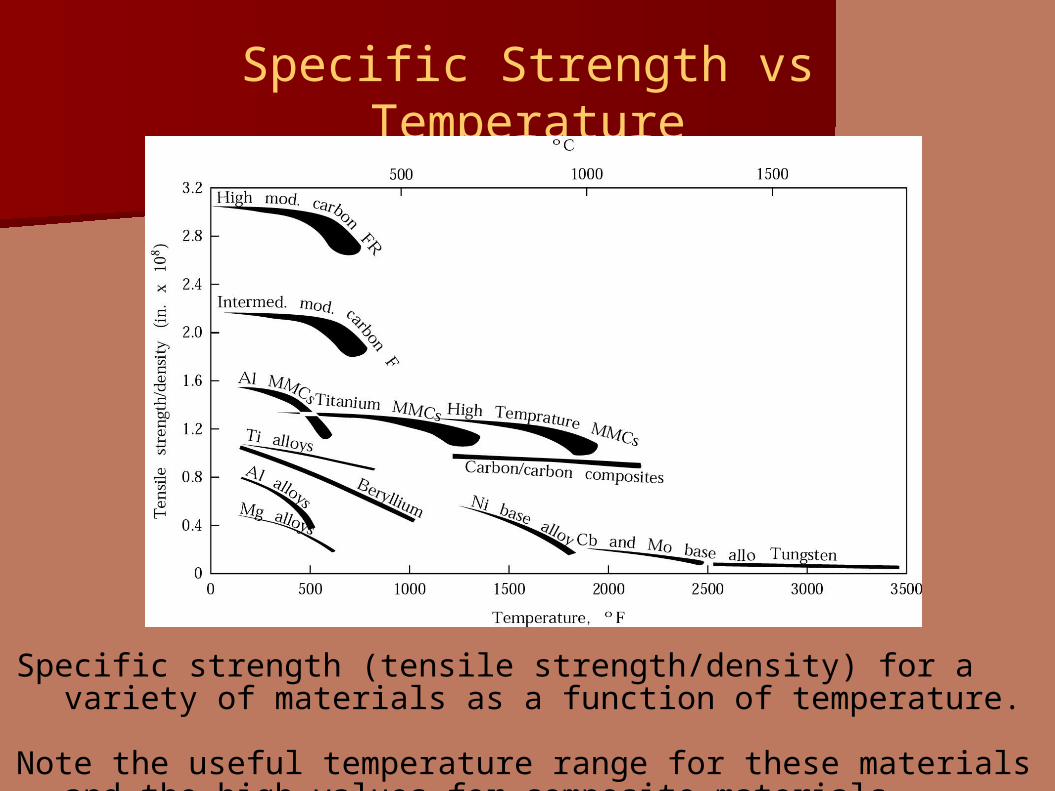
Specific Strength vs Temperature
Specific strength (tensile strength/density) for a variety of materials as a function of temperature.
Note the useful temperature range for these materials and the high values for composite materials.

Electrical PropertiesElectrical Properties
Engineering materials exhibit a great Engineering materials exhibit a great variation in their capability to conduct variation in their capability to conduct electricityelectricity
Flow of electrical current involves movement Flow of electrical current involves movement of of charge carrierscharge carriers ‑ infinitesimally small ‑ infinitesimally small particles possessing an electrical charge particles possessing an electrical charge – In solids, these charge carriers are electrons In solids, these charge carriers are electrons – In a liquid solution, charge carriers are positive In a liquid solution, charge carriers are positive
and negative ionsand negative ions

Electrical ConductivityElectrical Conductivity
A measure of how well a material accommodates the transport of electric charge
A conductor such as a metal has high conductivity, and an insulator like glass or a vacuum has low conductivity
Unit 1/[Ω·m]
ElectricalElectrical Resistivity Resistivity
Property that defines a material's Property that defines a material's capability to resist current flow capability to resist current flow – Resistivity is not a constant; it varies, Resistivity is not a constant; it varies,
as do so many other properties, with as do so many other properties, with temperature temperature
– For metals, resistivity increases with For metals, resistivity increases with temperature temperature

Engineering Materials and Engineering Materials and Electrical PropertiesElectrical Properties
Metals are the best Metals are the best conductorsconductors of of electricity, because of their metallic electricity, because of their metallic bondingbonding
Most ceramics and polymers, whose Most ceramics and polymers, whose electrons are tightly bound by covalent electrons are tightly bound by covalent and/or ionic bonding, are poor conductors and/or ionic bonding, are poor conductors
Many of these materials are used as Many of these materials are used as insulatorsinsulators because they possess high because they possess high resistivities resistivities

Semiconductors Semiconductors
A material whose resistivity lies between A material whose resistivity lies between insulators and conductorsinsulators and conductors– Most common semiconductor material is Most common semiconductor material is
siliconsilicon, largely because of its abundance in , largely because of its abundance in nature, relative low cost, and ease of nature, relative low cost, and ease of processingprocessing
– What makes semiconductors unique is the What makes semiconductors unique is the capacity to significantly alter conductivities capacity to significantly alter conductivities in their surface chemistries in very localized in their surface chemistries in very localized areas to fabricate integrated circuits areas to fabricate integrated circuits

Electrical Properties in Electrical Properties in ManufacturingManufacturing
Electric discharge machiningElectric discharge machining - uses - uses electrical energy in the form of sparks to electrical energy in the form of sparks to remove material from metals remove material from metals
The important welding processes, such The important welding processes, such as as arc weldingarc welding and and resistance spot resistance spot weldingwelding, use electrical energy to melt , use electrical energy to melt the joint metalthe joint metal
Capacity to alter electrical properties of Capacity to alter electrical properties of semiconductor materials is the basis for semiconductor materials is the basis for microelectronics manufacturingmicroelectronics manufacturing

Piezoelectric EffectPiezoelectric Effect
Voltage produced between surfaces of a solid Voltage produced between surfaces of a solid dielectric (non-conducting substance) when a dielectric (non-conducting substance) when a mechanical stress is applied to it. A small mechanical stress is applied to it. A small current may be produced as well. current may be produced as well.
The effect, discovered by Pierre Curie in 1883, The effect, discovered by Pierre Curie in 1883, is exhibited by certain crystals, e.g., quartz is exhibited by certain crystals, e.g., quartz and Rochelle salt, and ceramic materials. and Rochelle salt, and ceramic materials.
Conversely, an applied electric field can Conversely, an applied electric field can cause a piezoelectric material to change cause a piezoelectric material to change dimensions. dimensions.

Magnetic PropertiesMagnetic Properties
Magnetism is a phenomenon by which materials Magnetism is a phenomenon by which materials exert an attractive or repulsive force on other exert an attractive or repulsive force on other materials. materials.
2 types of magnetic materials: 2 types of magnetic materials:
1. Soft magnetic materials1. Soft magnetic materials - materials can be - materials can be easily magnetized and demagnetized. easily magnetized and demagnetized.
(e.g: cores for distribution power transformers) (e.g: cores for distribution power transformers)
2. Hard magnetic materials2. Hard magnetic materials - permanent - permanent magnetic and do not demagnetize easily.magnetic and do not demagnetize easily.
(e.g: permanent magnets in loud speakers) (e.g: permanent magnets in loud speakers)

FerromagnetismFerromagnetism The creation of a very large magnetization in a material when subjected to an applied magnetic field. After the applied field is removed the ferromagnetic material retains much of the magnetization.
One of the strongest forms of magnetism.
It is responsible for most of the magnetic behaviour encountered in everyday life, and is the basis for all permanent magnets (as well as the metals that are noticably attracted to them).
Ferromagnetic materials: iron, cobalt, nickel

FerrimagnetismFerrimagnetism
Permanent and large magnetism exhibited by some ceramic materials.
Ferrimagnetic materials (ferrites) have low conductivities and useful for electronics applications.

MagnetostrictionMagnetostriction
Property of ferromagnetic materials to undergo a change of their physical dimensions when subjected to a magnetic field. This effect was first identified in 1842 by James Joule when observing a sample of nickel.
This property, which allow magnetostrictive materials to convert magnetic energy into mechanical energy and conversely, is used for the building of both actuation and sensing devices

Optical PropertiesOptical Properties
The interaction of materials to The interaction of materials to refraction, reflection and absorption refraction, reflection and absorption of light.of light.

Refraction Refraction
Refraction is the change in direction of a Refraction is the change in direction of a wave due to a change in its velocity. This wave due to a change in its velocity. This is most commonly seen when a wave is most commonly seen when a wave passes from one medium to another.passes from one medium to another.
A light ray will refract as it enters and A light ray will refract as it enters and leaves glass; understanding of this leaves glass; understanding of this concept led to the concept led to the invention of lenses invention of lenses and the refracting telescopeand the refracting telescope
The straw seems to be The straw seems to be broken, due to refraction of broken, due to refraction of light as it emerges into the light as it emerges into the air. air.

AbsorptionAbsorption The interaction of light photons with the The interaction of light photons with the
electronic and bonding structure of the electronic and bonding structure of the atoms, ions or molecules that make up the atoms, ions or molecules that make up the material.material.
The absorbance of an object quantifies how The absorbance of an object quantifies how much light is absorbed by it.much light is absorbed by it.
Example: an object that absorbs blue, Example: an object that absorbs blue, green and yellow light will appear green and yellow light will appear redred when when viewed under white light. viewed under white light.
Application: More precise measurements at Application: More precise measurements at many wavelengths allow the identification many wavelengths allow the identification of a substance via of a substance via absorption spectroscopyabsorption spectroscopy

Reflection Reflection Reflection is the change in direction of a wave Reflection is the change in direction of a wave
front at an interface between two dissimilar front at an interface between two dissimilar media so that the wave front returns into the media so that the wave front returns into the medium from which it originated. medium from which it originated.
A mirror provides the most common model for A mirror provides the most common model for specular light reflection and consists of a glass specular light reflection and consists of a glass sheet in front of a metallic coating where the sheet in front of a metallic coating where the reflection actually occurs. It is also possible for reflection actually occurs. It is also possible for reflection to occur from the surface of reflection to occur from the surface of transparent media, such as water or glass. transparent media, such as water or glass.
Spheres reflecting the floor and each other Spheres reflecting the floor and each other

Transmission Transmission The fraction of incident light at a specified The fraction of incident light at a specified
wavelength that passes through a sample.wavelength that passes through a sample. The sum of the fractions of the incoming incident The sum of the fractions of the incoming incident
light light reflectedreflected, , absorbedabsorbed, and , and transmittedtransmitted = 1 = 1 The amount of energy absorbed by metals depends The amount of energy absorbed by metals depends
on the electronic structure of each metal.on the electronic structure of each metal. Examples:Examples:
– For copper and gold, greater absorption of the shorter For copper and gold, greater absorption of the shorter wavelengths of blue and green but greater reflection of wavelengths of blue and green but greater reflection of the yellow, orange and red wavelengths.the yellow, orange and red wavelengths.
– For silver and aluminium, strongly reflects all parts of the For silver and aluminium, strongly reflects all parts of the visible spectrum and thus, show a white ‘silvery’ colorvisible spectrum and thus, show a white ‘silvery’ color

Optical fiberOptical fiber An optical fiber is a thin (~1.25An optical fiber is a thin (~1.25μμm diameter), m diameter),
transparent fiber, usually made of glass or plastic, transparent fiber, usually made of glass or plastic, for transmitting light.for transmitting light.
Optical fibers are commonly used in Optical fibers are commonly used in telecommunication systems, as well as in telecommunication systems, as well as in illumination, sensors, and imaging optics.illumination, sensors, and imaging optics.
These systems consist a These systems consist a transmittertransmitter to encode to encode electrical signals into light signals, electrical signals into light signals, optical fiberoptical fiber to to transmit the light signals, and a transmit the light signals, and a photodiode photodiode to to convert the light signals back into electrical signals.convert the light signals back into electrical signals.
Examples:Examples:– Optical fiber sensors for temperature and Optical fiber sensors for temperature and
pressure have been developed for downhole pressure have been developed for downhole measurement in oil wells. The fiber optic sensor is measurement in oil wells. The fiber optic sensor is well suited for this environment as it is well suited for this environment as it is functioning at temperatures too high for functioning at temperatures too high for semiconductor sensors. semiconductor sensors.
Thermal ConductivityThermal Conductivity The ability of a material to conduct heat; The ability of a material to conduct heat; physical physical constant for quantity of heat that constant for quantity of heat that passes through passes through volume of a substance volume of a substance in in unit of time for unit unit of time for unit difference in temperature.difference in temperature.
Measured by Measured by coefficient ofcoefficient of thermal thermal conductivity,conductivity, k, k, in in watts per metre-kelvin, watts per metre-kelvin, (W.m(W.m-1-1.K.K-1-1).).
kk = = Heat flow rate x distanceHeat flow rate x distance (Area × (Area × ΔΔ T T))
Coefficient of thermal conductivity is Coefficient of thermal conductivity is generally high generally high in metals, low in ceramics and in metals, low in ceramics and plasticsplastics

Thermal ExpansionThermal Expansion Density of a material as a function of Density of a material as a function of
temperaturetemperature– In general, density decreases with In general, density decreases with
increasing temperatureincreasing temperature– Volume per unit weight increases with Volume per unit weight increases with
increasing temperatureincreasing temperature– Thermal expansion is the name for this Thermal expansion is the name for this
effect of temperature on densityeffect of temperature on density– Measured by Measured by coefficient of thermal coefficient of thermal
expansion, expansion,

Coefficient of Thermal Coefficient of Thermal Expansion (Expansion ())
Change in length per degree of temperature, Change in length per degree of temperature, such as mm/mm/such as mm/mm/C (in/in/C (in/in/F) F) – Length ratio rather than volume ratio because this is Length ratio rather than volume ratio because this is
easier to measure and apply easier to measure and apply Change in length for a given temperature Change in length for a given temperature
change is: change is: LL22 ‑ ‑ LL11 = = LL11 ( (TT22 ‑ ‑ TT11) )
where where = coefficient of thermal expansion; = coefficient of thermal expansion; LL11 and and LL22 are lengths corresponding respectively to are lengths corresponding respectively to temperatures temperatures TT11 and and TT22

Thermal Expansion in Thermal Expansion in ManufacturingManufacturing
Thermal expansion is used in Thermal expansion is used in shrink fitshrink fit and and expansion fitexpansion fit assemblies assemblies– Part is heated to increase size or cooled to Part is heated to increase size or cooled to
decrease size to permit insertion into another decrease size to permit insertion into another partpart
– When part returns to ambient temperature, a When part returns to ambient temperature, a tightly‑fitted assembly is obtained tightly‑fitted assembly is obtained
Thermal expansion can be a problem in Thermal expansion can be a problem in heat heat treatmenttreatment and and weldingwelding due to thermal stresses due to thermal stresses that develop in material during these processesthat develop in material during these processes

Effects of thermal Effects of thermal expansionexpansion
This factor affects the substance performance in This factor affects the substance performance in machines or structural assemblies.machines or structural assemblies.
Thermal expansion causes Thermal expansion causes tight fitted parts to tight fitted parts to breakbreak and and moving part to jam, in any machinemoving part to jam, in any machine. . The problem is serious if different material is The problem is serious if different material is used. When a large body of glass is subject to used. When a large body of glass is subject to local heating or cooling, it breaks up due to local heating or cooling, it breaks up due to expansion or shrinkage. expansion or shrinkage.
Thermal expansion also causes distortion. Thermal expansion also causes distortion. Thermal properties must be considered in any Thermal properties must be considered in any engineering constructions such as railroad, engineering constructions such as railroad, bridges, pipelines, and buildings, especially in bridges, pipelines, and buildings, especially in areas where temperatures go to extreme values.areas where temperatures go to extreme values.
Thermal stress -Thermal stress - Thermal stresses arise in Thermal stresses arise in materials materials when they are heated or cooled. when they are heated or cooled. Thermal Thermal stresses effect the operation of stresses effect the operation of facilities, both facilities, both because of the large components because of the large components subject to stress subject to stress and because they are affected and because they are affected by the way in which by the way in which the plant is operated. the plant is operated. Result cracking, warping, Result cracking, warping, loosening of loosening of componentscomponents
Thermal fatigue -Thermal fatigue - The premature fracture The premature fracture resulting from resulting from cyclic stresses due to temperature cyclic stresses due to temperature changes. Cause changes. Cause number of surface cracks, number of surface cracks, especially in tools and dies especially in tools and dies for casting and metal for casting and metal working.working.
Thermal shock -Thermal shock - Ability of a material to withstand Ability of a material to withstand heat heat and cold by subjecting it to rapid and wide and cold by subjecting it to rapid and wide changes in changes in temperature.temperature.
Corrosion ResistanceCorrosion Resistance Corrosion resistance is the property of a metal that Corrosion resistance is the property of a metal that
gives it the ability to withstand attacks from gives it the ability to withstand attacks from atmospheric, chemical, or electrochemical conditions.atmospheric, chemical, or electrochemical conditions.
In engineering materials selection, without adequate In engineering materials selection, without adequate corrosion resistance, or corrosion allowance, corrosion resistance, or corrosion allowance, components often fall short of the expected design components often fall short of the expected design life.life.
Surface treatments:Surface treatments:– Applied coatings (Plating, painting, and the application of Applied coatings (Plating, painting, and the application of
enamel are the most common anti-corrosion treatments) enamel are the most common anti-corrosion treatments) – Reactive coatings (electrically insulating and/or chemically Reactive coatings (electrically insulating and/or chemically
impermeable coating on exposed metal surfaces) impermeable coating on exposed metal surfaces) – Anodization Anodization

CorrosionCorrosionCorrosion is the deterioration of a material due to Corrosion is the deterioration of a material due to
interaction with its environment. It is the interaction with its environment. It is the electrochemical electrochemical process in which metallic atoms process in which metallic atoms leave leave the metal or form the metal or form compounds in the compounds in the presence of water presence of water and gases. and gases.
Typically it produces oxide(s) and/or salt(s) of the Typically it produces oxide(s) and/or salt(s) of the original metal.original metal.
Metal atoms are removed from a structural element Metal atoms are removed from a structural element until until it fails, or oxides build up inside a pipe until it it fails, or oxides build up inside a pipe until it is is plugged. plugged.
All metals and alloys are subject to corrosion. Even All metals and alloys are subject to corrosion. Even the the noble metals, such as gold, are subject to noble metals, such as gold, are subject to corrosive corrosive attack in some environments.attack in some environments.
TutorialTutorial1. List applications and give reasons where the following properties would be desirable:a) high density, b) low density, c) high melting point, d) low melting point, e) high thermal conductivity, f) low thermal conductivity2. What is piezoelectric material?3. Difference between thermal conductivity and specific heat?4. Why melting point of a material an important factor in manufacturing process?5. Give several applications in which specific strength and specific stiffness are important. Give some explanation.

Thank You


![1466 Ssulistijono Mat Eng Bentuk Korosi [Compatibility Mode]](https://cdn.vdocuments.site/doc/165x107/5571f34c49795947648dcd54/1466-ssulistijono-mat-eng-bentuk-korosi-compatibility-mode.jpg)
