
Energy Consumption in Energy Consumption in IP NetworksIP Networks
Rodney S. Tucker, Jayant Baliga, Robert Ayre, Kerry Hinton, Wayne V. Sorin
ARC Special Research Centre for Ultra-Broadband Information Networks (CUBIN)
University of Melbourne

Energy Consumption of the NetworkEnergy Consumption of the Network
• Greenhouse Impact• Managing “Hot Spots”
- Getting the energy in- Getting the heat out
• Energy-limited capacity bottlenecks
Why should we be interested in energy?
• OPEX
Hot spot
• Enabling energy efficiencies in other sectors
Power In

Energy Consumption GrowsEnergy Consumption Grows
More users
More data-intensive applications, e.g. video
More often and for longer periods
Increasing demand → operators provide faster access and increased core capacity
New applications enabled by faster access
Where are We Heading ?Where are We Heading ?

SummarySummary
Modeling energy consumption of the Internet- Core, metro, and access networks
Where does the energy go?
Will (can) optical switching technologies help to reduce energy consumption?
A Word of Warning

What is the Carbon Footprint of Telecoms?
Adapted from “SMART 2020: Enabling the low carbon economy in the information age,” GeSI, 2008 www.gesi.org
Global Telecoms Footprint (devices & infrastructure)
Mobile Network
1450+% growth
0 100 200 300 400
2020
2002
Footprint (MtCO2 p.a.)
Fixed Narrowband
Broadband Modems
Fixed Broadband
Mobile handsets
20X increase

Metro
Core
Edge Edge
Curb Curb Curb Curb
Core Core
Access
Core
ONU ~ 5-10W
OLT - 100W
12816 Edge ~ 4 kW
CRS-1 ~ 10 kW / rack
0.1 - 1000 Mb/s to the user
Fibre Amps
WDM
Passive Optical Network
Packet over
Sonet
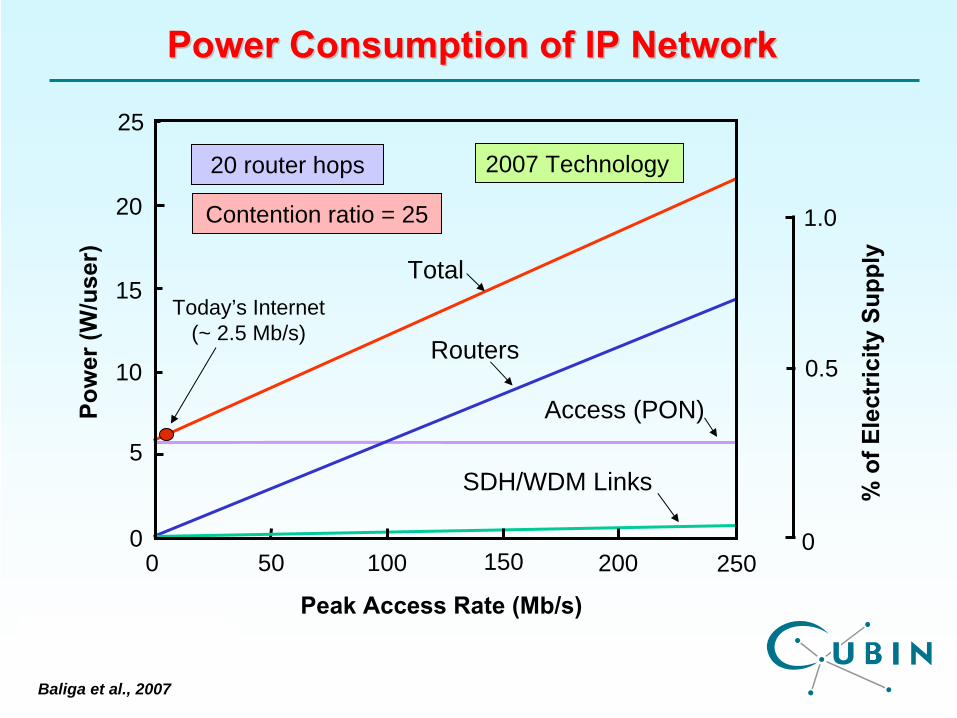
Where does the Energy Go? Where does the Energy Go?
Baliga et al., 2007
Core Core
Core
OLT - 100W

Number of Hops in the InternetNumber of Hops in the Internet
0 5 10 15 20 250
0.02
0.04
0.06
0.08
0.1
Number of Hops, k
[]
Pr
Hk
=
Source: P. Van Mieghem,“Performance Analysis of Computer Systems and Networks”, Cambridge (2006)
2006 Data
Multi ISP Network: 15 - 20 hops
25000
Pow
er (W
/use
r)
% o
f Ele
ctric
ity S
uppl
y
Baliga et al., 2007
0
20
0.5
25
5
Peak Access Rate (Mb/s)
15
100 20015050
1.0
10
Power Consumption of IP NetworkPower Consumption of IP Network
Total
Routers
Access (PON)
SDH/WDM Links
Today’s Internet (~ 2.5 Mb/s)
2007 Technology20 router hops
Contention ratio = 25
Pow
er (W
/use
r)
% o
f Ele
ctric
ity S
uppl
y
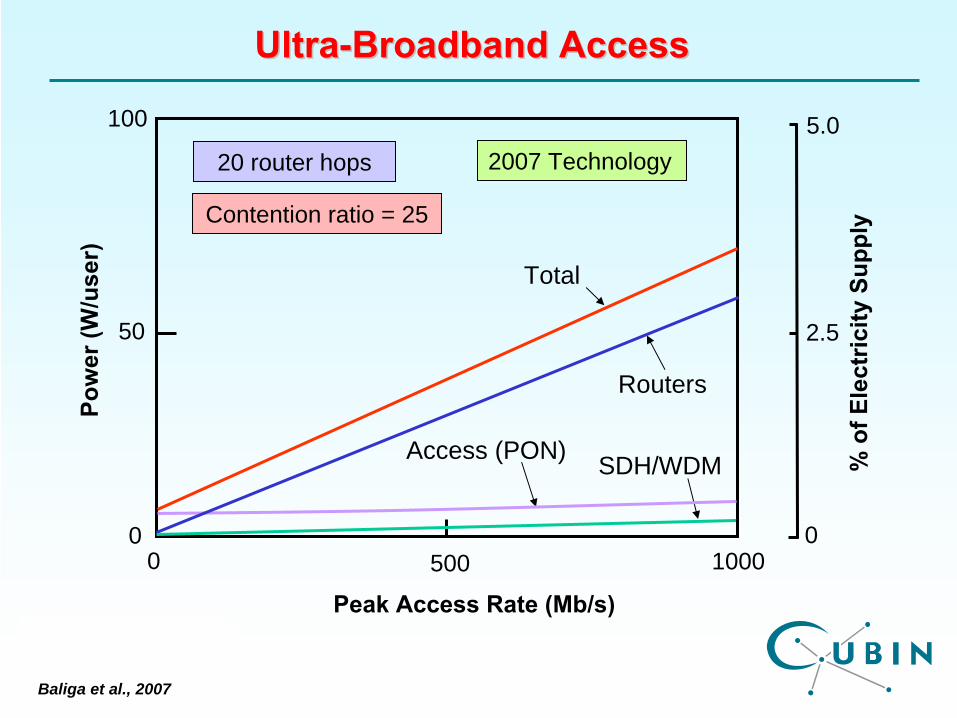
Baliga et al., 2007
Total
UltraUltra--Broadband AccessBroadband Access
2007 Technology
Peak Access Rate (Mb/s)
00
2.550
100 5.0
Routers
Access (PON) SDH/WDM
0 1000500
20 router hops
Contention ratio = 25

Energy Consumption in Access NetworksEnergy Consumption in Access NetworksNEC CM7710T
Splitter PON
PtP
WiMAX
Cabinet
Edge Node
Cisco 12816
NEC CM7700S
ZyxelVES-1616F-34Cisco
4503
NEC VF200F6
NEC GM100
Axxcelera ExcelMax CPE
AxxceleraExcelMax BTS
Cabinet
Access N/W
FTTN with VDSL2

Pow
er P
er U
ser (
W)
Peak Access Rate (Mb/s)1 100
WiMAX
FTTN
0
40
PtP
PON
10 250
Oversubscription = 10
Power Consumption in Access NetworksPower Consumption in Access Networks
• Wireless access consumes more energy than optical access• PON FTTH is “greener” than FTTN
25
20

Total
Access (PON)Routers
2.5 25 250 2500
Ener
gy p
er b
it (J
)
10-6
10-3
10-8
10-5
10-7
10-4
20 hops
~1 μJ/b
WDM Links
Peak Access Rate (Mb/s)
Network Network EnergyEnergy Consumption per BitConsumption per Bit
~100 μJ/b

• Optical transport (WDM) consumes relatively little energy< 5% of energy > 25% of CAPEX
• Eliminating the O/E/O converters provides no significant benefit
• Access network dominates at low rates– Standby/Sleep mode is key to reducing energy consumption
• Network routers dominate at higher rates– Need to
• reduce hop count• improve router efficiency (technology)• manage routers better (sleep states)• develop better network architectures using fewer routers• manage distribution and replication of content (IPTV)
ObservationsObservations

Router Throughput
Pow
er c
onsu
mpt
ion
(W)
Source: METI, 2006, Nordman, 2007
Power Consumption in RoutersPower Consumption in Routers
10
100
1,000
10,000
100,000
1,000,000
P = C2/3
where P is in Wattswhere C is in Mb/s
10 nJ/bit
100 nJ/bit
11 Pb/s
P ~ 10
1 Tb/s1 Gb/s1 Mb/s
?

High-end router: Cisco CRS-1
Linecard ChassisCapacity: 0.64 Tb/s Power: 13.6 kW
Switch Fabric Chassis: Power: 8 kW
Fully equipped:Multi-rack routerCapacity: 41 Tb/sPower ~ 1 MW
Source: Neilsen, 2006; Deutche Telekom, 2007
Per Rack
X2 every18 months
Energy BottleneckEnergy Bottleneck

Optics
Switch Fabrics Buffers
Demutiplexers
Multiplexers
Fibers
Forwarding Engine
J
SwitchFabric
O/E Converters
Reduced bit rate (i.e. parallel processing)
Electronic RoutersElectronic Routers
Speed (throughput) is not a limitation
Electronics

Line Card
Energy in Electronic and Optical RoutersEnergy in Electronic and Optical Routers
G. Epps, Cisco, 2007, ITRS, 2005, R. Tucker, JLT, 2006
BufferI/O
Data Plane
Control Plane
Routing Engine
Routing Tables
Power supply
inefficiency
Fans and blowersO/E
O/E Forwarding Engine
Forwarding Engine
Energy/bit
0.7 nJ 1.0 nJ0.5 nJ3.2 nJ 3.5 nJ1.1 nJElectronic (2008)
Optical Packet Switching is not a compelling alternative
Buffer
Switch Fabric
Buffer
10 nJ
Total
Electronic (2018) 10 pJ 20 pJ10 pJ65 pJ 80 pJ25 pJ 210 pJ
Switch Control
Optical (2018) 20 pJ 20 pJ20 pJ65 pJ 80 pJ25 pJ 220 pJ?
Amp
Amp

Contention Resolution in the Wavelength Domain Contention Resolution in the Wavelength Domain
Switch Fabric
Forwarding Engine
Forwarding Engine
Forwarding Engine
1λ
nλ
Fatal Flaw: Require large n for low blocking probability (n ~3 -10 x)
Pow
er (W
/use
r)
Total (Conventional router)
Peak Access Rate (Mb/s)
0
50
100
Routers
AccessWDM
0 1000500
WDM 5 X
Routers 1.2 X
Total (Wavelength-domain contention resolution )
Wong, JLT 2006 Pathiban et al., JLT 2009
• Optical Burst Switch
• Optical Label Switch

Efficiency Improvement Rate = 0% p.a
5% p.a
Peak Access Rate (Mb/s)1 100 200 300 400
Tota
l Pow
er P
er U
ser (
W)
0
40
60
20
0
% o
f Ele
ctric
ity C
onsu
mpt
ion
1.0
2.0
3.0
10% p.a
20% p.a
Baliga, et al, 2008, unpublished
The ChallengeThe Challenge
10 % -
20 % p.a. continuous improvement in efficiency
Target

SummarySummary
• Energy consumption currently dominated by the access network
• The energy bottleneck in routers is looming- More significant than the so-called “electronic speed bottleneck”
• Key strategies for efficient network design - Control energy in the access network (e.g. sleep mode in modems)- Reduce the hop count (i.e. “agile” optical bypass)- Energy-efficient network architectures- Continuous improvement in (electronic) router efficiency- Caching and content distribution networks- O/E/O conversions not necessarily a problem


