Download - Energiagazdálkodás I. konz
Óbuda University Power System Department
The wind
Dr. Péter Kádár
Óbuda University, Power System Department, Hungary
Óbuda University Power System Department
Wind basics - Patra, 2012
Draft
• Wind basics
• Drivers of the wind energy application
• The energy of the wind
• Dynamic simulation
• Wind forecast
2
Óbuda University Power System Department
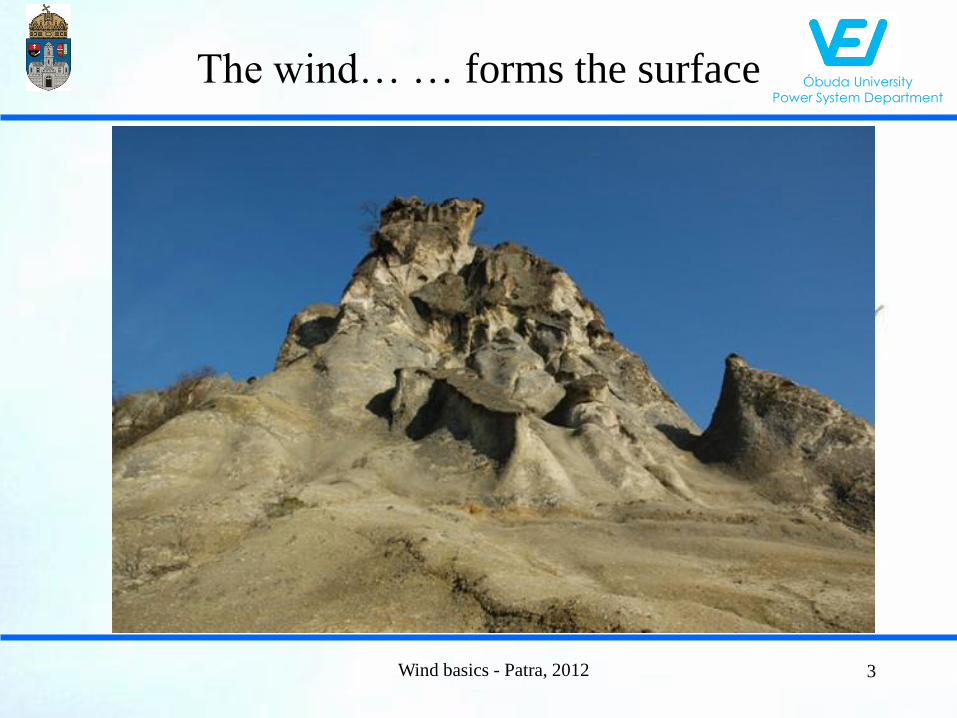
The wind… … forms the surface
Wind basics - Patra, 2012 3

Óbuda University Power System Department
The wind… … blows our hair
Wind basics - Patra, 2012 4

Óbuda University Power System Department
The wind… … brakes the signes
Wind basics - Patra, 2012 5
Óbuda University Power System Department
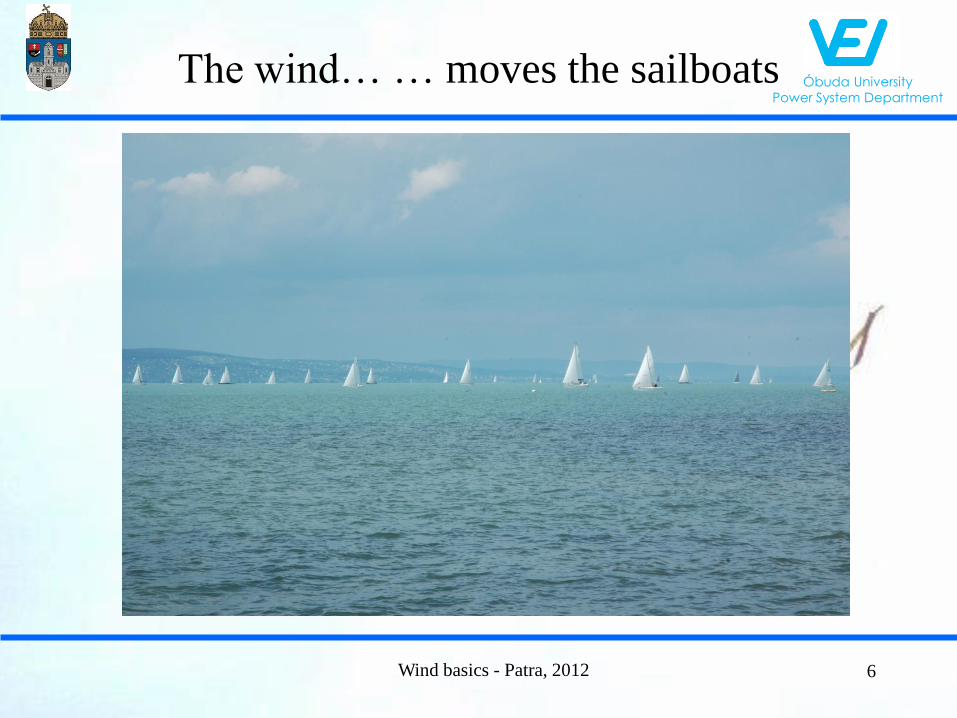
The wind… … moves the sailboats
Wind basics - Patra, 2012 6

Óbuda University Power System Department
The wind… … destroys the forests
Wind basics - Patra, 2012 7

Óbuda University Power System Department
The wind… … forwards the snow
Wind basics - Patra, 2012 8

Óbuda University Power System Department
The wind… … blows the flag
Wind basics - Patra, 2012 9

Óbuda University Power System Department
The wind… … lifts our kite
Wind basics - Patra, 2012 10

Óbuda University Power System Department
The wind… … dries our cloths
Wind basics - Patra, 2012 11
Óbuda University Power System Department
And the wind… …bends the trees
Wind basics - Patra, 2012 12

Óbuda University Power System Department
And the wind… …turns our propeller
Wind basics - Patra, 2012 13

Óbuda University Power System Department
…but nobody can see it!
Wind basics - Patra, 2012 14

Óbuda University Power System Department
Wind basics - Patra, 2012
Windrose
15

Óbuda University Power System Department
Wind basics - Patra, 2012
Windrose
16
Óbuda University Power System Department
Wind basics - Patra, 2012 17
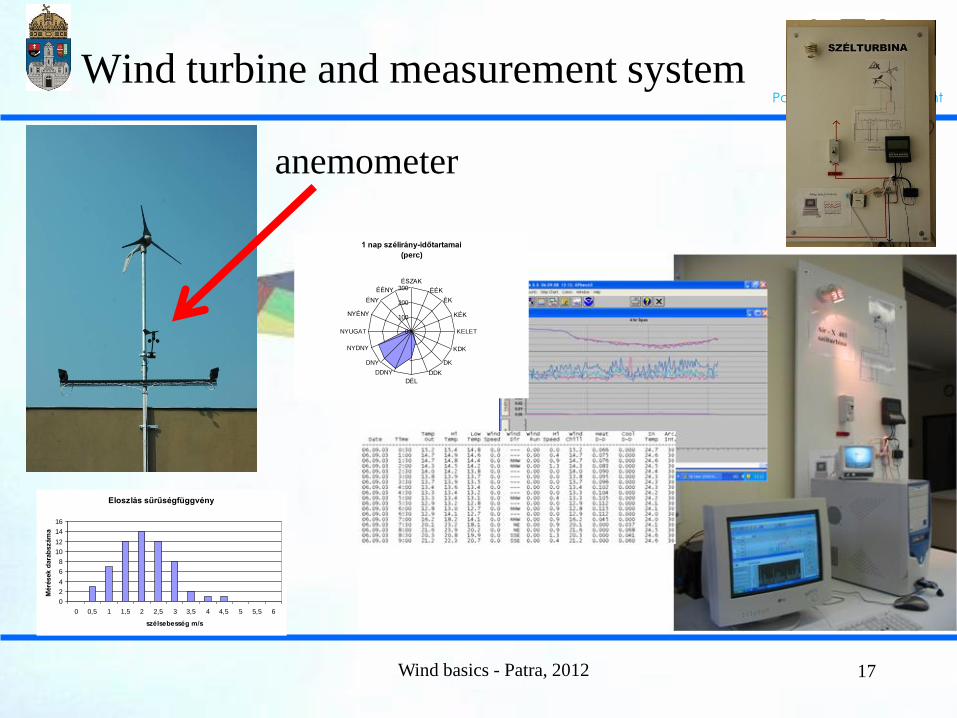
Wind turbine and measurement system
anemometer
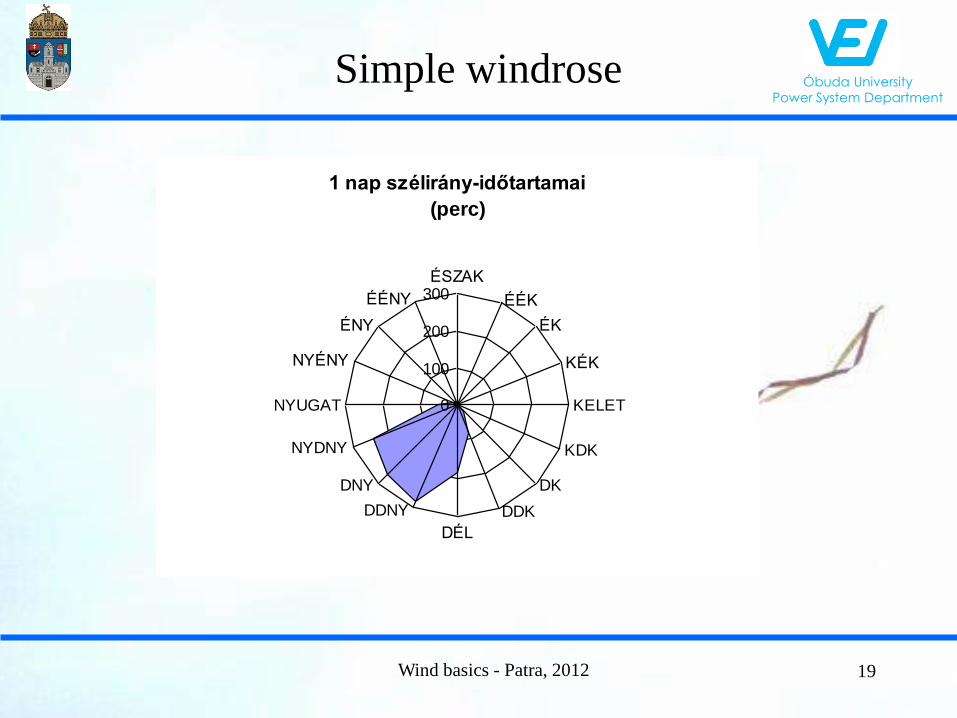
1 nap szélirány-időtartamai
(perc)
0
100
200
300ÉSZAK
ÉÉK
ÉK
KÉK
KELET
KDK
DK
DDK
DÉL
DDNY
DNY
NYDNY
NYUGAT
NYÉNY
ÉNY
ÉÉNY
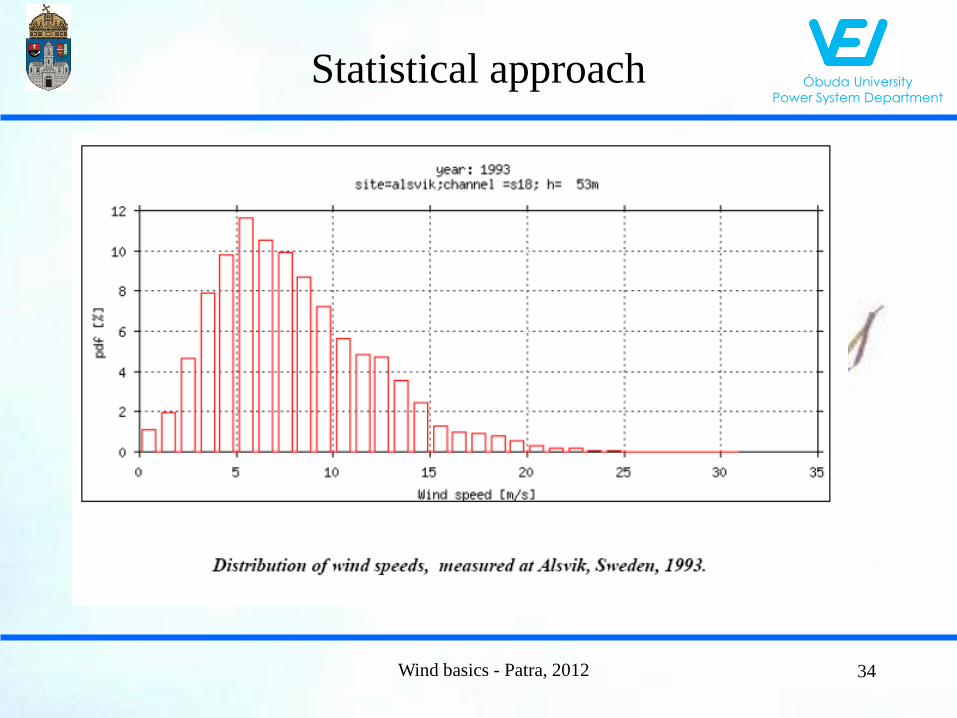
Eloszlás sűrűségfüggvény
0
2
4
6
8
10
12
14
16
0 0,5 1 1,5 2 2,5 3 3,5 4 4,5 5 5,5 6
szélsebesség m/s
Méré
sek d
ara
bszám
a

Óbuda University Power System Department
Measurements
Wind basics - Patra, 2012 18
Óbuda University Power System Department
Simple windrose
Wind basics - Patra, 2012 19
1 nap szélirány-időtartamai
(perc)
0
100
200
300ÉSZAK
ÉÉK
ÉK
KÉK
KELET
KDK
DK
DDK
DÉL
DDNY
DNY
NYDNY
NYUGAT
NYÉNY
ÉNY
ÉÉNY

Óbuda University Power System Department
Speed-Weighted windrose
• Direction?
• Average speed?
• Energy?
Wind basics - Patra, 2012 20
0
50
100
150
200ÉSZAK
ÉÉK
ÉK
KÉK
KELET
KDK
DK
DDK
DÉL
DDNY
DNY
NYDNY
NYUGAT
NYÉNY
ÉNY
ÉÉNY
Átlagos szélsebesség súlyozva 2006.09.07.

Óbuda University Power System Department
Wind basics - Patra, 2012
Main winter directions
21

Óbuda University Power System Department
Wind basics - Patra, 2012
Main yearly directions
22

Óbuda University Power System Department
Wind basics - Patra, 2012 23
Wind (speed) map for 10 m heights
Óbuda University Power System Department
Wind basics - Patra, 2012
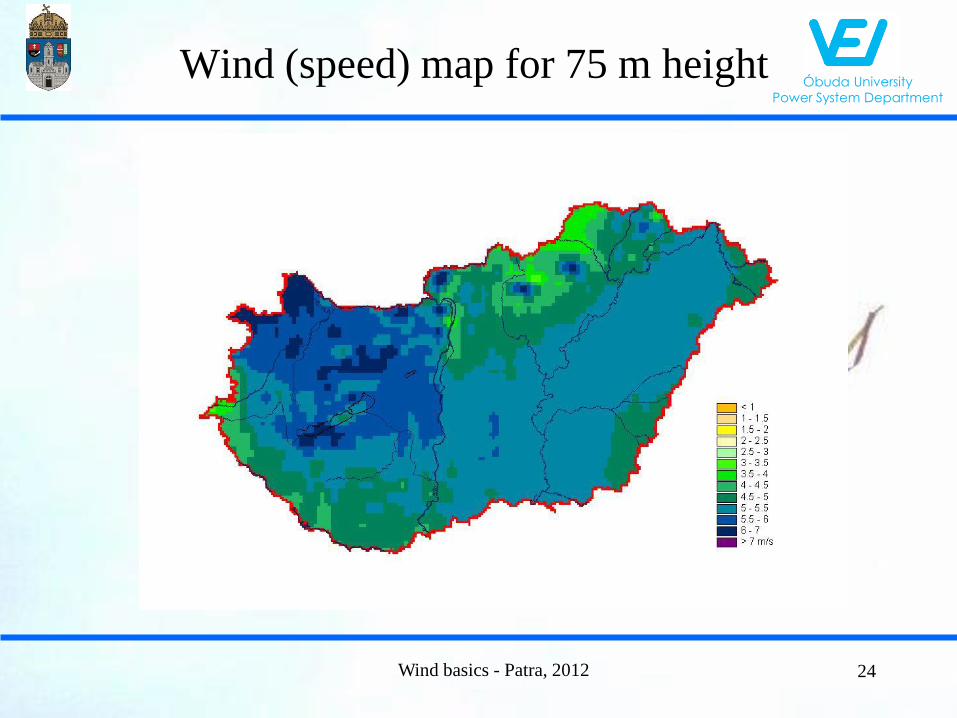
Wind (speed) map for 75 m height
24

Óbuda University Power System Department
Wind basics - Patra, 2012
Daily wind course in diff. heights
A szélsebesség átlagos napi menete különböző magasságokban
Szeged, SODAR
0
1
2
3
4
5
6
7
8
9
1 2 3 4 5 6 7 8 9 10 11 12 13 14 15 16 17 18 19 20 21 22 23 24
óra
m/s
30 m 45 m 60 m 75 m 90 m 105 m 120 m 135 m 150 m
25
Óbuda University Power System Department
Wind basics - Patra, 2012
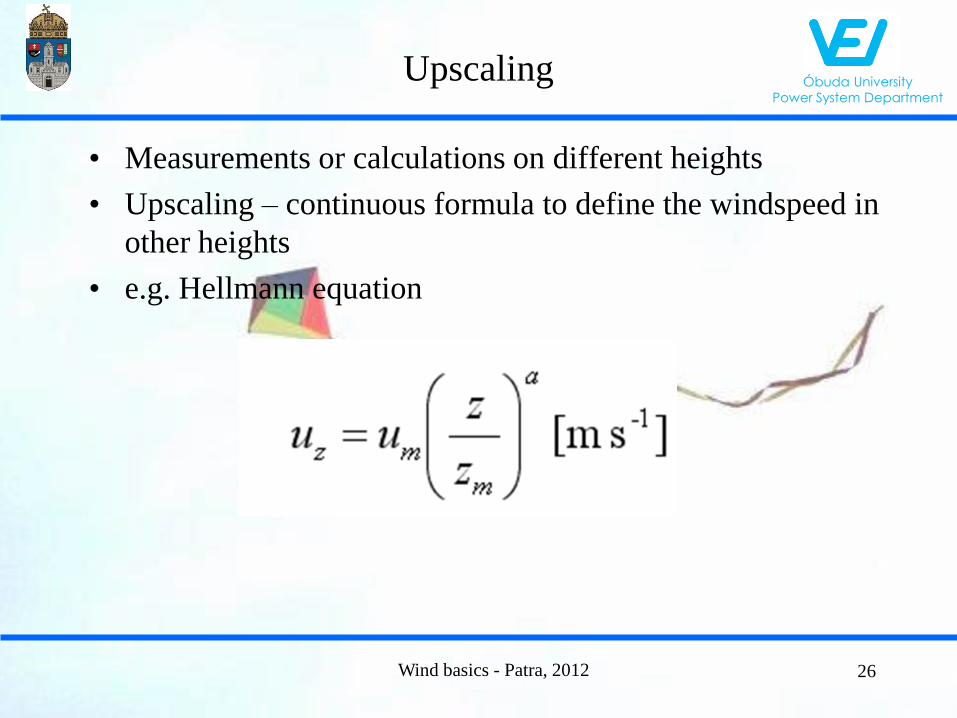
Upscaling
• Measurements or calculations on different heights
• Upscaling – continuous formula to define the windspeed in
other heights
• e.g. Hellmann equation
26

Óbuda University Power System Department
Wind basics - Patra, 2012 27
Local wind profile
200
175
225
250
275
300
325
350
375
5 10 15 20
Távolság [km]
Ten
gersz
int
fele
tti
ma
gass
ág
[m
]
NY
Hegyhátsál
200
225
250
275
300
350
375
325
Ten
gersz
int
fele
tti
ma
ga
ssá
g [m
]
3 m s-1
3 m s-1
4 m s-1
4 m s-1
5 m s-1
5 m s-1
6 m s-1
6 m s-1
É
Hegyhátsál

Óbuda University Power System Department
Wind basics - Patra, 2012 28
Global windforecast services
Óbuda University Power System Department
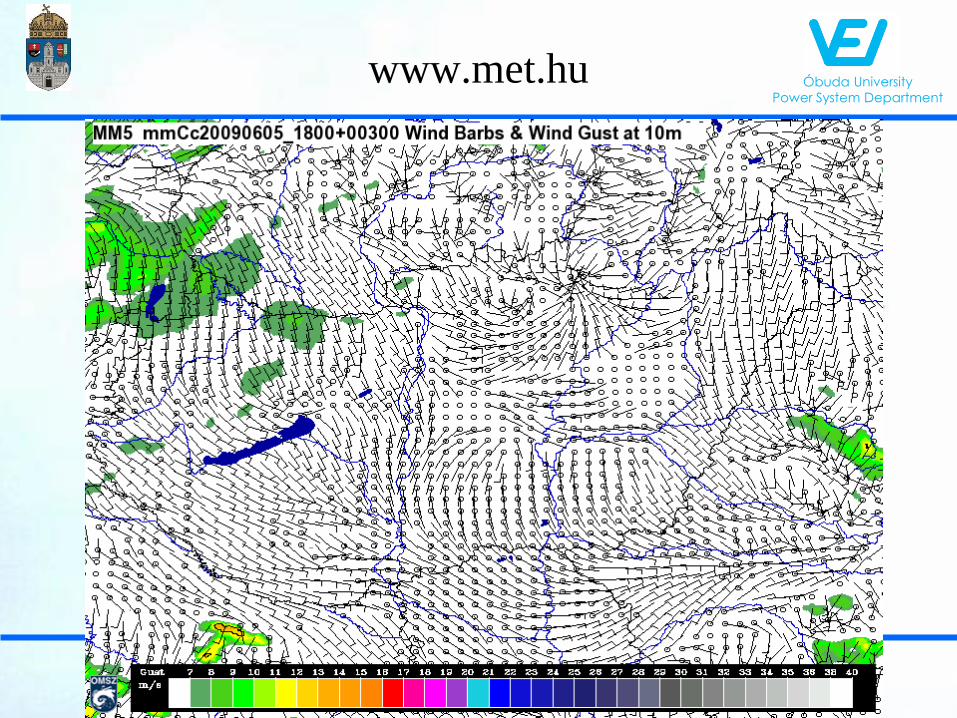
www.met.hu
Wind basics - Patra, 2012 29
Óbuda University Power System Department
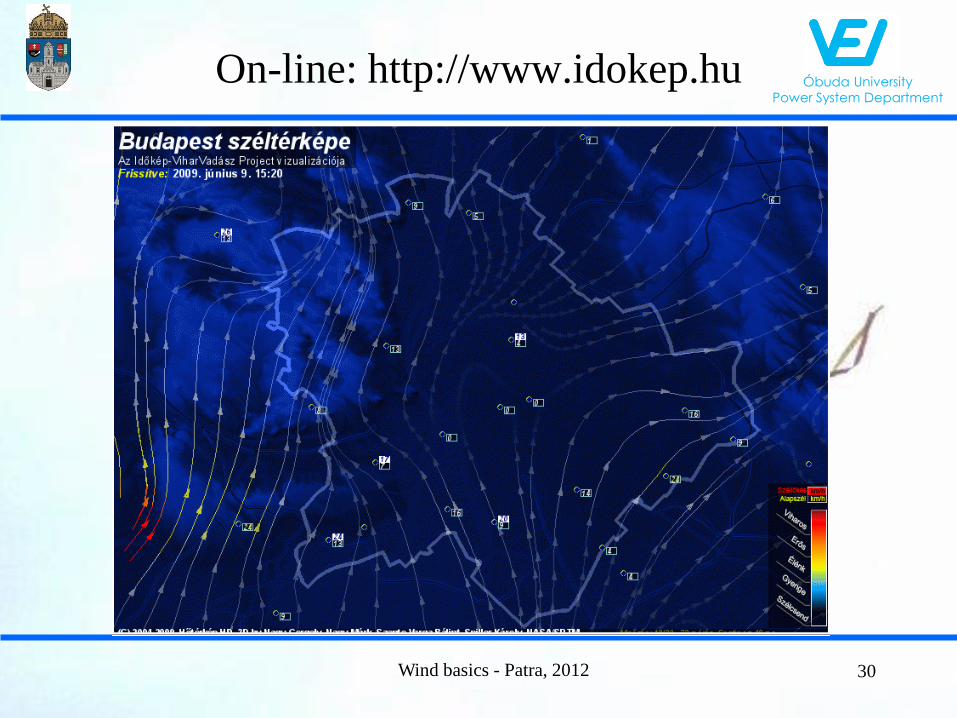
On-line: http://www.idokep.hu
Wind basics - Patra, 2012 30
Óbuda University Power System Department
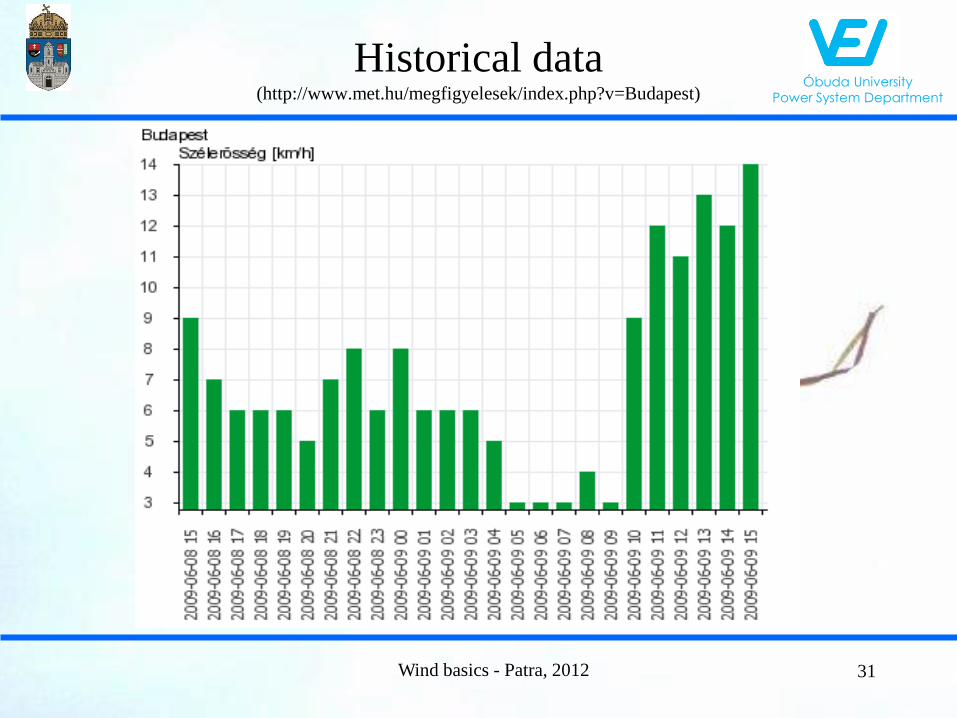
Historical data (http://www.met.hu/megfigyelesek/index.php?v=Budapest)
Wind basics - Patra, 2012 31

Óbuda University Power System Department
Wind basics - Patra, 2012 32
Global models
• Supercomputing
• 27 km -> 2,5 km cubes
• Differential equations
system
But
• Different measurement points
• Different application points
Forecast
Application
measurement
Terrestrial forms

Óbuda University Power System Department
Wind basics - Patra, 2012 33
Professional services
• Numerical weather forecasts
• Horizontal and vertical interpolation
• Wind Atlas Analysis and Application Program + PARK
modell
• Statistical elements
• Meteorological models (e.g. ALADIN, MEANDER), other
sources (ECMWF, MM5, HIRLAM, stb.)
• Result presentation by heights or by isobar?
Óbuda University Power System Department
Wind basics - Patra, 2012
Statistical approach
34
Óbuda University Power System Department
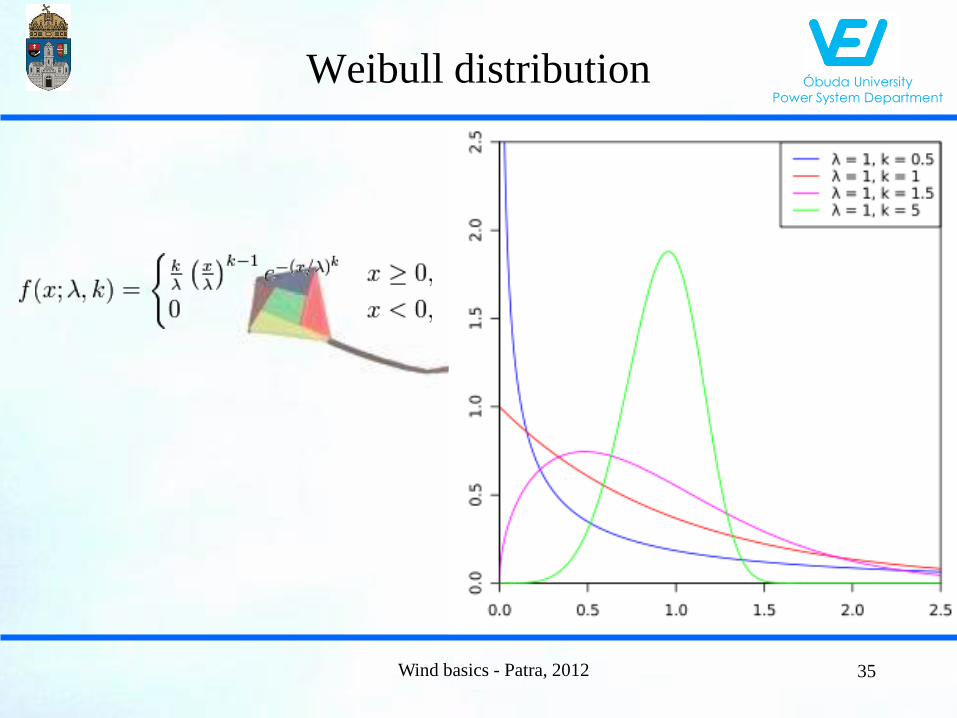
Weibull distribution
Wind basics - Patra, 2012 35

Óbuda University Power System Department
Wind basics - Patra, 2012 36
Local direction changes

Óbuda University Power System Department
Wind basics - Patra, 2012 37
Local speed changes
Speed changes + direction changes = turbulence

Óbuda University Power System Department
Turbulencies
Wind basics - Patra, 2012 38
A szélirány és -nagyság percenkénti változása (turbulencia)
-3,00
-2,00
-1,00
0,00
1,00
2,00
3,00
4,00
1 4 7 10 13 16 19 22 25 28 31 34 37 40 43 46 49 52 55 58
perc
m/s
és r
ad
Szélsebesség változás (m/s)
Szélirány változás (rad)
Óbuda University Power System Department
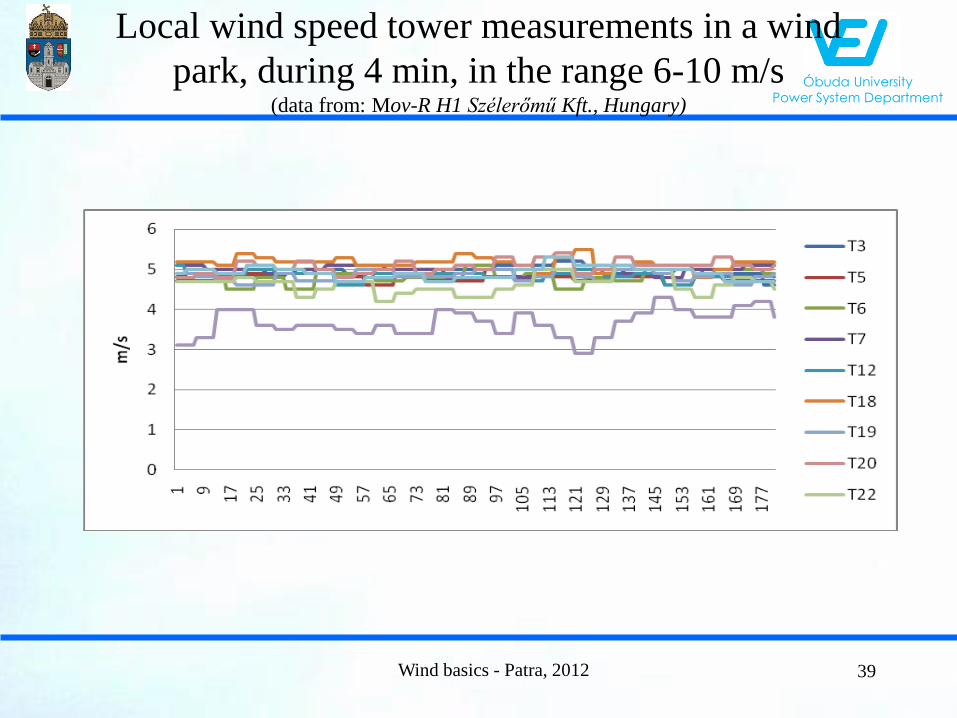
Local wind speed tower measurements in a wind
park, during 4 min, in the range 6-10 m/s (data from: Mov-R H1 Szélerőmű Kft., Hungary)
Wind basics - Patra, 2012 39
Óbuda University Power System Department
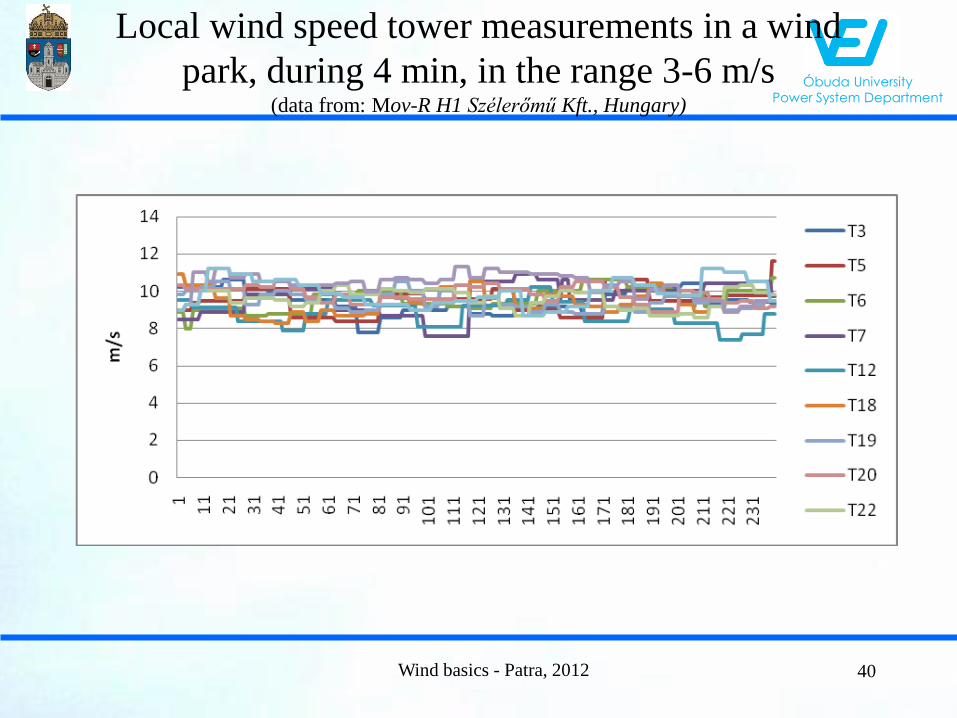
Local wind speed tower measurements in a wind
park, during 4 min, in the range 3-6 m/s (data from: Mov-R H1 Szélerőmű Kft., Hungary)
Wind basics - Patra, 2012 40

Óbuda University Power System Department
Local wind speed tower measurements in a wind
park, during 4 min, over 10 m/s (data from: Mov-R H1 Szélerőmű Kft., Hungary)
Wind basics - Patra, 2012 41
Óbuda University Power System Department
Spread over of the wind energy application
Wind basics - Patra, 2012 42

Óbuda University Power System Department
Wind basics - Patra, 2012
Fig.Global cumulative installed wind capacity 1996-2010 Global Wind Energy Council 2010 (GWEC)
MW 43
Óbuda University Power System Department
Wind basics - Patra, 2012
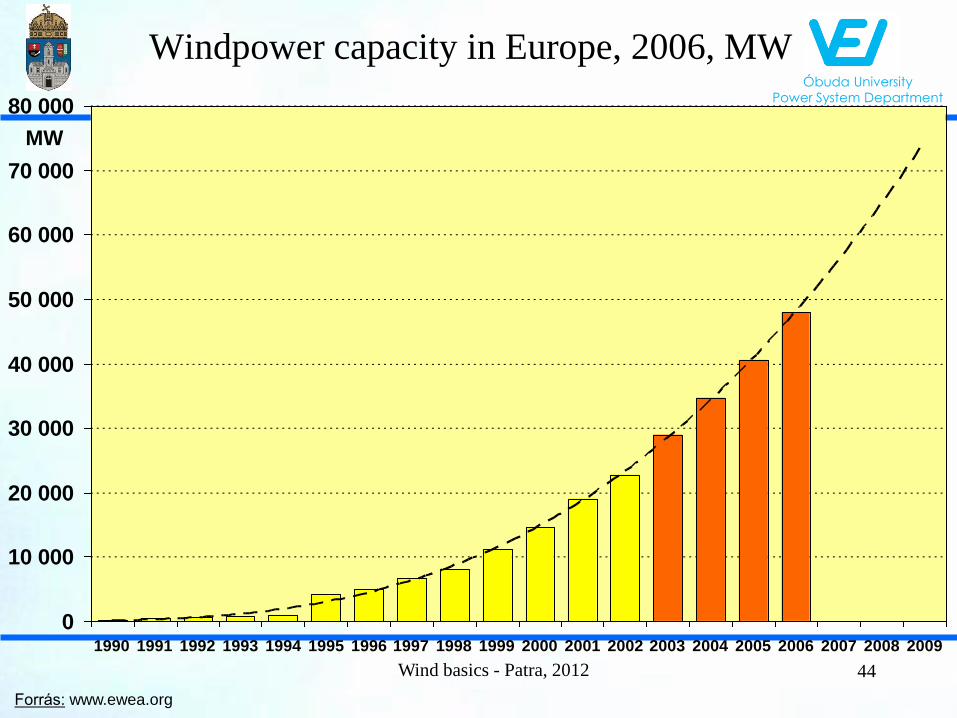
Windpower capacity in Europe, 2006, MW
Forrás: www.ewea.org
0
10 000
20 000
30 000
40 000
50 000
60 000
70 000
80 000
1990 1991 1992 1993 1994 1995 1996 1997 1998 1999 2000 2001 2002 2003 2004 2005 2006 2007 2008 2009
MW
44

Óbuda University Power System Department
Wind energy application in Europe
45
EWEA, 2010
Wind basics - Patra, 2012

Óbuda University Power System Department
Yearly built in wind capacities in Europe
46
EWEA, 2010
2009
9581MW
onshore
582MW
offshore
Wind basics - Patra, 2012

Óbuda University Power System Department
Repowering
47 Wind basics - Patra, 2012

Óbuda University Power System Department
Some drivers of the windenergy business
• Growing demand for electricity
• EU directives
• Subventions
• Sustainability
• Reduction of CO2 emisson
• Green investment boom (ROI 4-5 years)
• Employment, etc.
Wind basics - Patra, 2012 48

Óbuda University Power System Department
Catching the wind energy
Wind basics - Patra, 2012 49
Óbuda University Power System Department
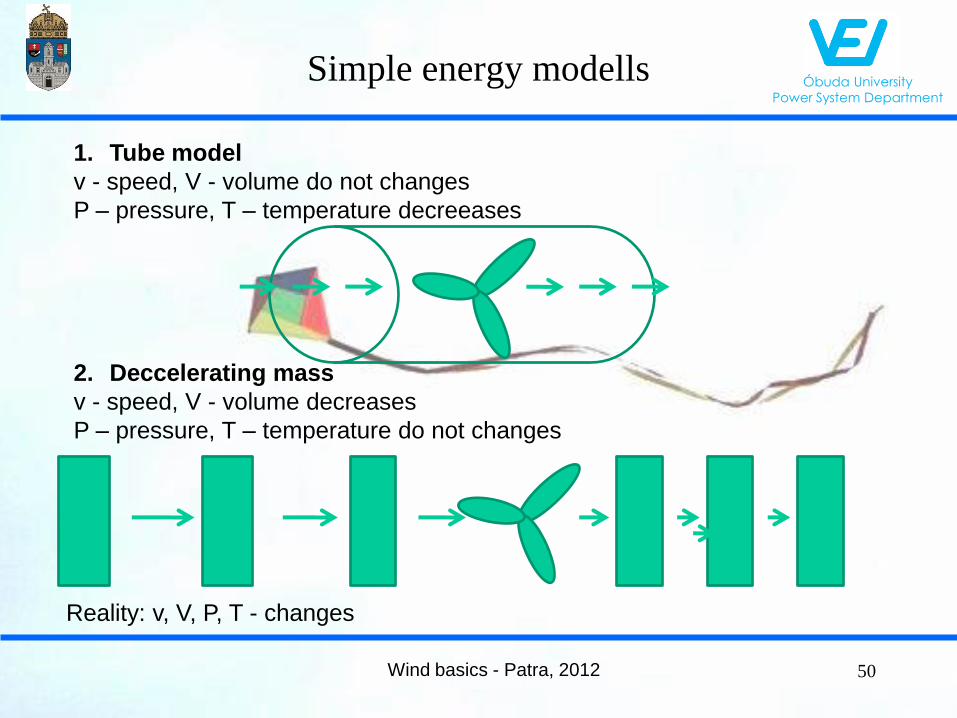
Simple energy modells
Wind basics - Patra, 2012
1. Tube model
v - speed, V - volume do not changes
P – pressure, T – temperature decreeases
Reality: v, V, P, T - changes
50
2. Deccelerating mass
v - speed, V - volume decreases
P – pressure, T – temperature do not changes

Óbuda University Power System Department
Wind basics - Patra, 2012 51
Power of the wind (moving mass model)
P = 0,5 ρ A v3 η where
• P = mechanical (~electrical) power of the wind turbine,
• ρ = 1,29 kg/Nm3 – density of the air,
• A = r2 π = d2 π / 4 area swept by the rotor blades (r is the length of the blade, d = 2 r diameter of the rotor),
• v = wind speed,
• η = efficiency of the rotor (theoretical max. is 60 %, practically 10-30 % ).

Óbuda University Power System Department
Wind basics - Patra, 2012
Obstacle and the flowing air
• a - turbulent
• b - laminal
• c – turbulent
(stall)
52

Óbuda University Power System Department
Wind basics - Patra, 2012 53
The possible energy conversion
• Fix bladed rotor
• TipSpeedRatio:
v blade edge / v air
• 100 %? no

Óbuda University Power System Department
Wind basics - Patra, 2012
Different rotors and blades
• P vs wind speed
• Different rpm
54

Óbuda University Power System Department
Wind basics - Patra, 2012 55
Practical characteristics of
wind turbine with control
Electronic control of
• Rotor speed
• Pitch
Óbuda University Power System Department
Wind basics - Patra, 2012 56
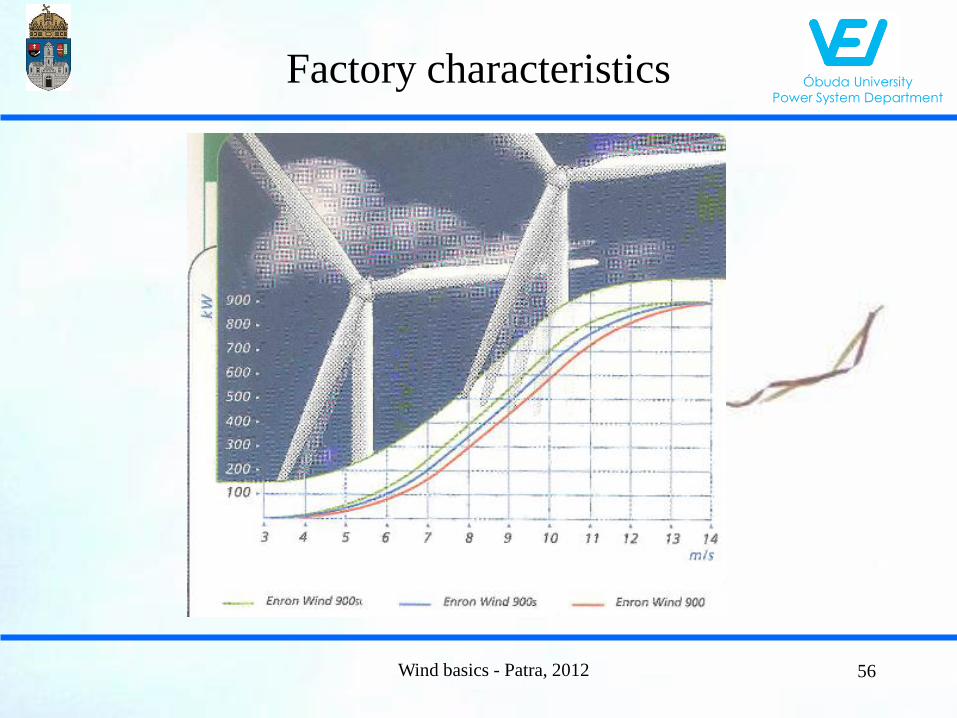
Factory characteristics

Óbuda University Power System Department
Typical characteristics
Wind basics - Patra, 2012 57
Szélturbina karakterisztikák
-500
0
500
1 000
1 500
2 000
2 500
0 5 10 15 20 25 30
Szélsebesség (m/s)
Kim
en
ő t
eljesít
mén
y (
kW
)
V-90-2MW
MM82
G90
V-90-1.8MW
E-48
MD77
E-70

Óbuda University Power System Department
Wind basics - Patra, 2012 58
Performance measurements

Óbuda University Power System Department
Dynamic simulation
Wind basics - Patra, 2012 59

Óbuda University Power System Department
Simulation logic
• Basic questions: „What happened if…”
• No yearly averages but
• Real wind measurements +
• Defined wind park locations +
• Wind turbine characteristics
• Result: MW curve during a long period (a year)
Wind basics - Patra, 2012 60

Óbuda University Power System Department
Investigated places, parks
Wind basics - Patra, 2012 61
Óbuda University Power System Department
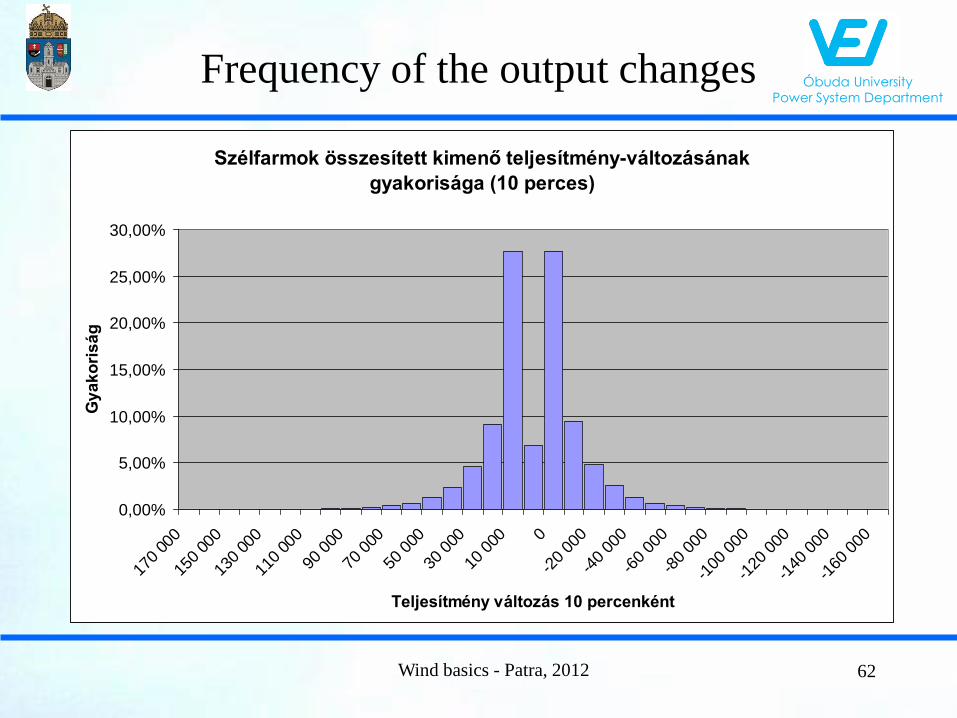
Frequency of the output changes
Wind basics - Patra, 2012 62
Szélfarmok összesített kimenő teljesítmény-változásának
gyakorisága (10 perces)
0,00%
5,00%
10,00%
15,00%
20,00%
25,00%
30,00%
170
000
150
000
130
000
110
000
90 0
00
70 0
00
50 0
00
30 0
00
10 0
00 0
-20
000
-40
000
-60
000
-80
000
-100
000
-120
000
-140
000
-160
000
Teljesítmény változás 10 percenként
Gy
ak
ori
sá
g
Óbuda University Power System Department
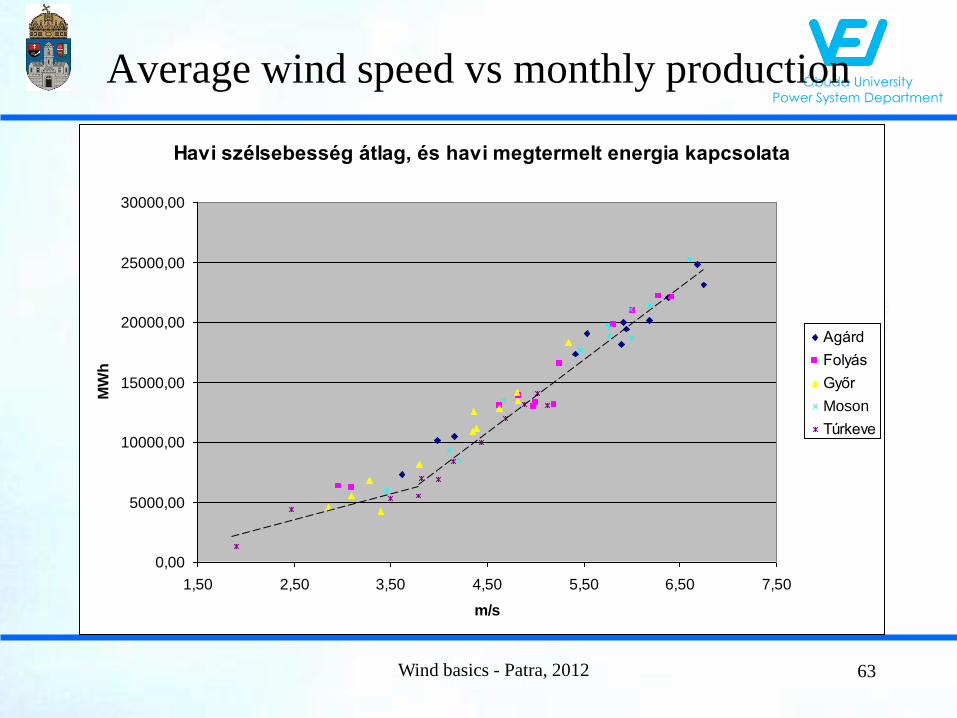
Average wind speed vs monthly production
Wind basics - Patra, 2012 63
Havi szélsebesség átlag, és havi megtermelt energia kapcsolata
0,00
5000,00
10000,00
15000,00
20000,00
25000,00
30000,00
1,50 2,50 3,50 4,50 5,50 6,50 7,50
m/s
MW
h
Agárd
Folyás
Győr
Moson
Túrkeve

Óbuda University Power System Department
Daily energy production vs built in capacity
Wind basics - Patra, 2012 64
A napi átlagteljesítmény gyakorisága a beépített teljesítményre
vonatkoztatva
0,00%
5,00%
10,00%
15,00%
20,00%
25,00%84%
80%
76%
72%
68%
64%
60%
56%
52%
48%
44%
40%
36%
32%
28%
24%
20%
16%
12%
8%
4%
0%
Beépített teljesítmény %-a
Gyako
riság
Óbuda University Power System Department
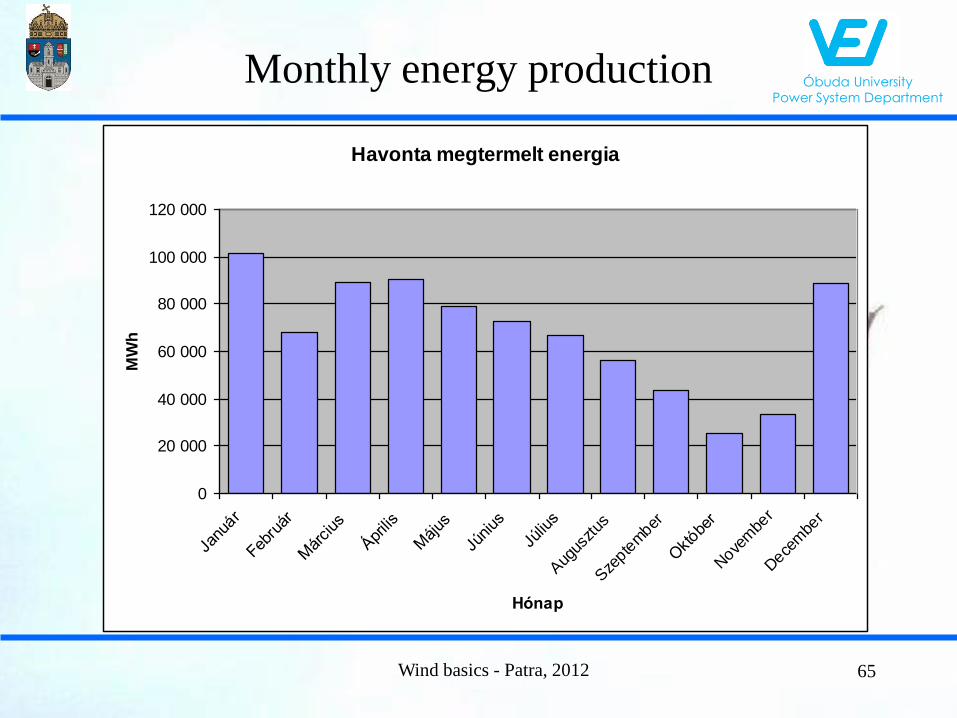
Monthly energy production
Wind basics - Patra, 2012 65
Havonta megtermelt energia
0
20 000
40 000
60 000
80 000
100 000
120 000
Janu
ár
Febru
ár
Már
cius
Ápr
ilis
Május
Június
Júliu
s
Aug
usztus
Sze
ptember
Októbe
r
Nove
mbe
r
Dece
mbe
r
Hónap
MW
h
Óbuda University Power System Department
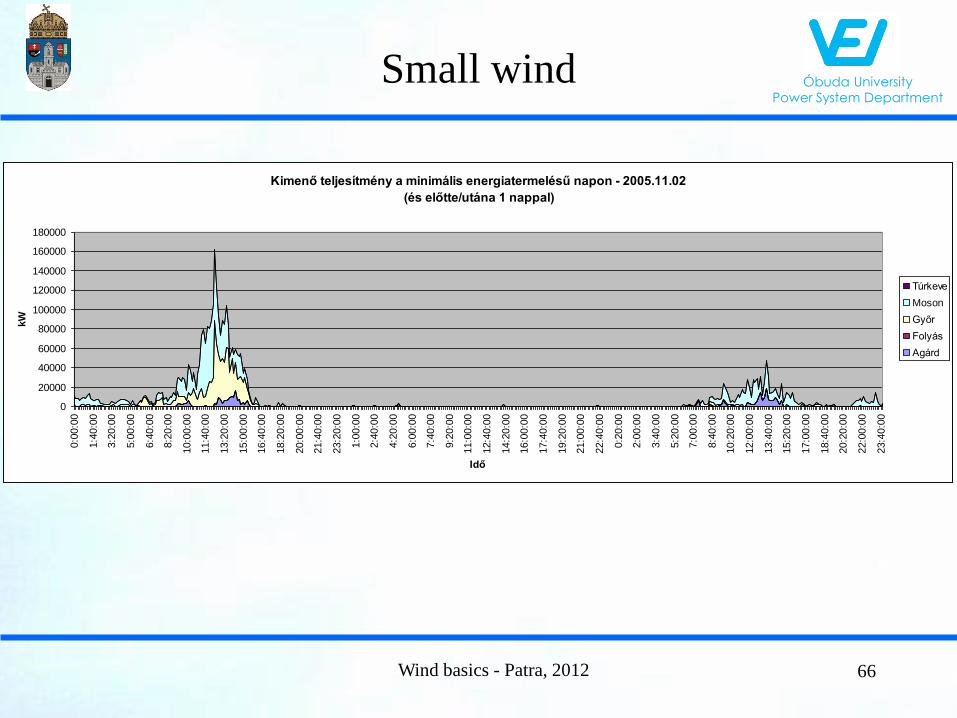
Small wind
Wind basics - Patra, 2012 66
Kimenő teljesítmény a minimális energiatermelésű napon - 2005.11.02
(és előtte/utána 1 nappal)
0
20000
40000
60000
80000
100000
120000
140000
160000
180000
0:0
0:0
0
1:4
0:0
0
3:2
0:0
0
5:0
0:0
0
6:4
0:0
0
8:2
0:0
0
10:0
0:0
0
11:4
0:0
0
13:2
0:0
0
15:0
0:0
0
16:4
0:0
0
18:2
0:0
0
20:0
0:0
0
21:4
0:0
0
23:2
0:0
0
1:0
0:0
0
2:4
0:0
0
4:2
0:0
0
6:0
0:0
0
7:4
0:0
0
9:2
0:0
0
11:0
0:0
0
12:4
0:0
0
14:2
0:0
0
16:0
0:0
0
17:4
0:0
0
19:2
0:0
0
21:0
0:0
0
22:4
0:0
0
0:2
0:0
0
2:0
0:0
0
3:4
0:0
0
5:2
0:0
0
7:0
0:0
0
8:4
0:0
0
10:2
0:0
0
12:0
0:0
0
13:4
0:0
0
15:2
0:0
0
17:0
0:0
0
18:4
0:0
0
20:2
0:0
0
22:0
0:0
0
23:4
0:0
0
Idő
kW
Túrkeve
Moson
Győr
Folyás
Agárd
Óbuda University Power System Department
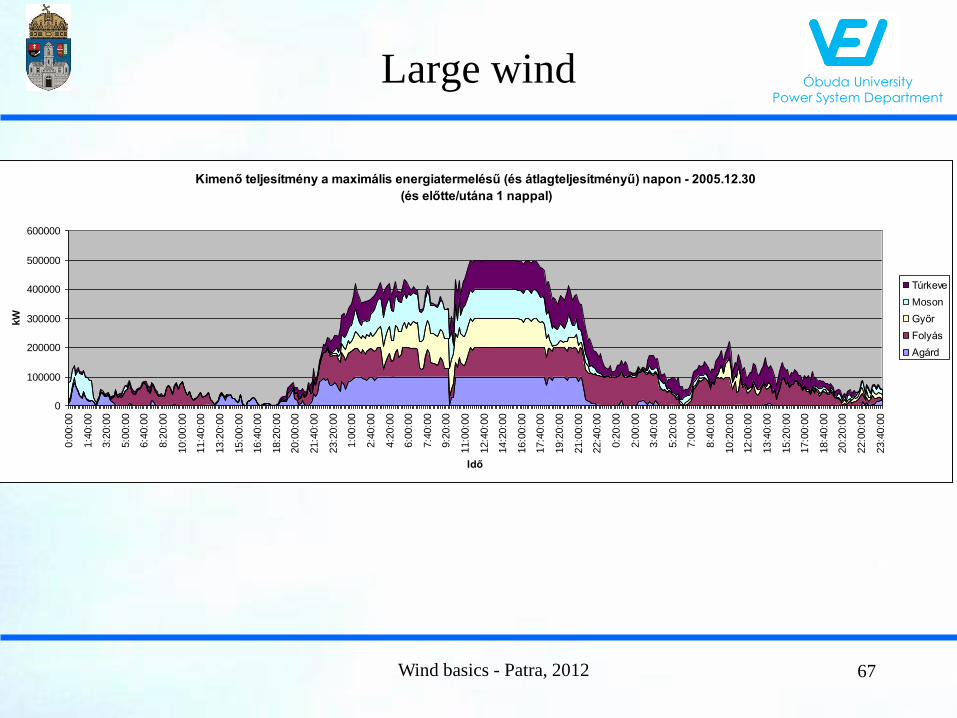
Large wind
Wind basics - Patra, 2012 67
Kimenő teljesítmény a maximális energiatermelésű (és átlagteljesítményű) napon - 2005.12.30
(és előtte/utána 1 nappal)
0
100000
200000
300000
400000
500000
600000
0:0
0:0
0
1:4
0:0
0
3:2
0:0
0
5:0
0:0
0
6:4
0:0
0
8:2
0:0
0
10:0
0:0
0
11:4
0:0
0
13:2
0:0
0
15:0
0:0
0
16:4
0:0
0
18:2
0:0
0
20:0
0:0
0
21:4
0:0
0
23:2
0:0
0
1:0
0:0
0
2:4
0:0
0
4:2
0:0
0
6:0
0:0
0
7:4
0:0
0
9:2
0:0
0
11:0
0:0
0
12:4
0:0
0
14:2
0:0
0
16:0
0:0
0
17:4
0:0
0
19:2
0:0
0
21:0
0:0
0
22:4
0:0
0
0:2
0:0
0
2:0
0:0
0
3:4
0:0
0
5:2
0:0
0
7:0
0:0
0
8:4
0:0
0
10:2
0:0
0
12:0
0:0
0
13:4
0:0
0
15:2
0:0
0
17:0
0:0
0
18:4
0:0
0
20:2
0:0
0
22:0
0:0
0
23:4
0:0
0
Idő
kW
Túrkeve
Moson
Győr
Folyás
Agárd

Óbuda University Power System Department
Meteorological front in and out
Wind basics - Patra, 2012 68
Kimenő teljesítmény a front megérkezésekor
0
50000
100000
150000
200000
250000
300000
350000
400000
450000
20:00:0
0
20:30:0
0
21:00:0
0
21:30:0
0
22:00:0
0
22:30:0
0
23:00:0
0
23:30:0
0
0:00
:00
0:30
:00
1:00
:00
1:30
:00
2:00
:00
2:30
:00
3:00
:00
Idő
kW
Túrkeve
Moson
Győr
Folyás
Agárd
Kimenő teljesítmény a front elvonulásakor
0
50000
100000
150000
200000
250000
300000
350000
400000
450000
19:00:0
0
19:30:0
0
20:00:0
0
20:30:0
0
21:00:0
0
21:30:0
0
22:00:0
0
22:30:0
0
23:00:0
0
23:30:0
0
0:00
:00
0:30
:00
1:00
:00
1:30
:00
2:00
:00
Idő
kW
Túrkeve
Moson
Győr
Folyás
Agárd
Óbuda University Power System Department
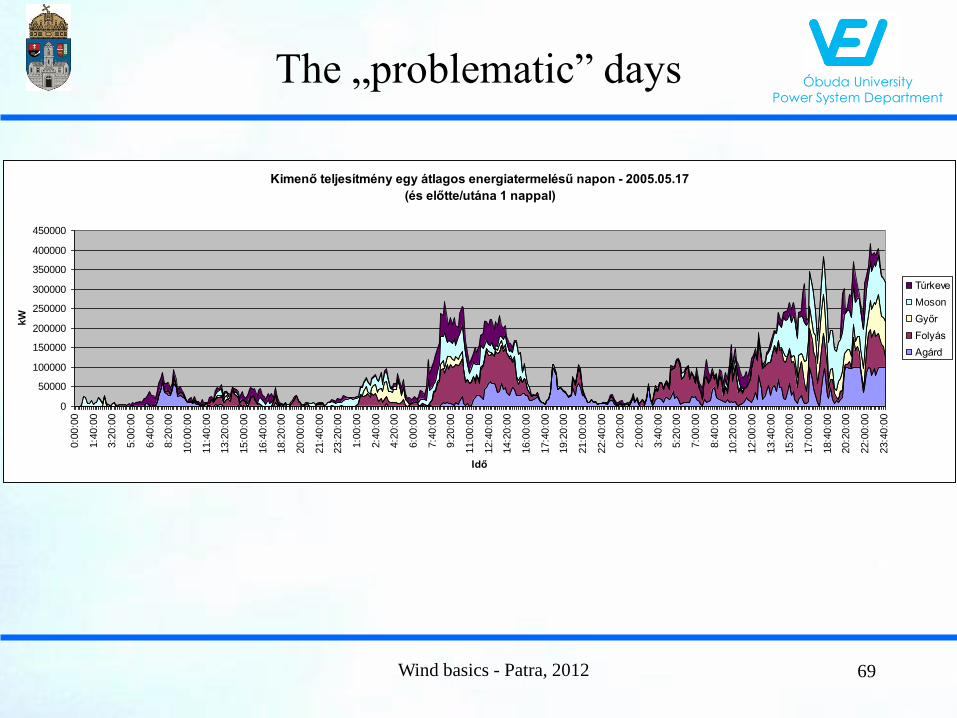
The „problematic” days
Wind basics - Patra, 2012 69
Kimenő teljesítmény egy átlagos energiatermelésű napon - 2005.05.17
(és előtte/utána 1 nappal)
0
50000
100000
150000
200000
250000
300000
350000
400000
450000
0:0
0:0
0
1:4
0:0
0
3:2
0:0
0
5:0
0:0
0
6:4
0:0
0
8:2
0:0
0
10:0
0:0
0
11:4
0:0
0
13:2
0:0
0
15:0
0:0
0
16:4
0:0
0
18:2
0:0
0
20:0
0:0
0
21:4
0:0
0
23:2
0:0
0
1:0
0:0
0
2:4
0:0
0
4:2
0:0
0
6:0
0:0
0
7:4
0:0
0
9:2
0:0
0
11:0
0:0
0
12:4
0:0
0
14:2
0:0
0
16:0
0:0
0
17:4
0:0
0
19:2
0:0
0
21:0
0:0
0
22:4
0:0
0
0:2
0:0
0
2:0
0:0
0
3:4
0:0
0
5:2
0:0
0
7:0
0:0
0
8:4
0:0
0
10:2
0:0
0
12:0
0:0
0
13:4
0:0
0
15:2
0:0
0
17:0
0:0
0
18:4
0:0
0
20:2
0:0
0
22:0
0:0
0
23:4
0:0
0
Idő
kW
Túrkeve
Moson
Győr
Folyás
Agárd

Óbuda University Power System Department
Correlation analysis of wind measurements
Wind basics - Patra, 2012 70

Óbuda University Power System Department
Wind basics - Patra, 2012
The problem
• Wind production forecast =
wind forecast + turbine caharactereistics
• There is no exact wind forecast for the wind turbine sites
• The forecast is crucial for the integration large wind parks
into the network
• The question: Can we forecast the generated energy based
on remote wind forecast?
71

Óbuda University Power System Department
Wind basics - Patra, 2012 72
The real task
• Not in that place
• Not in that time
• Not correct wind forecast
Forecast
Application
measurement
Terrestrial forms

Óbuda University Power System Department
Wind basics - Patra, 2012
The factory characteristics
• In the project we investigate a V-27 turbine at
“Bükkaranyos” and wind measurement ant “Folyás”
meteorological station.
• The figure shows a typical characteristics of wind turbines
(V27). This curve is measured in stationary mode, it does
not contain the effect of local turbulences, direction
changes and wind speed differences between the upper and
lower part of the (spinning) rotor measurements.
73
Óbuda University Power System Department
Wind basics - Patra, 2012
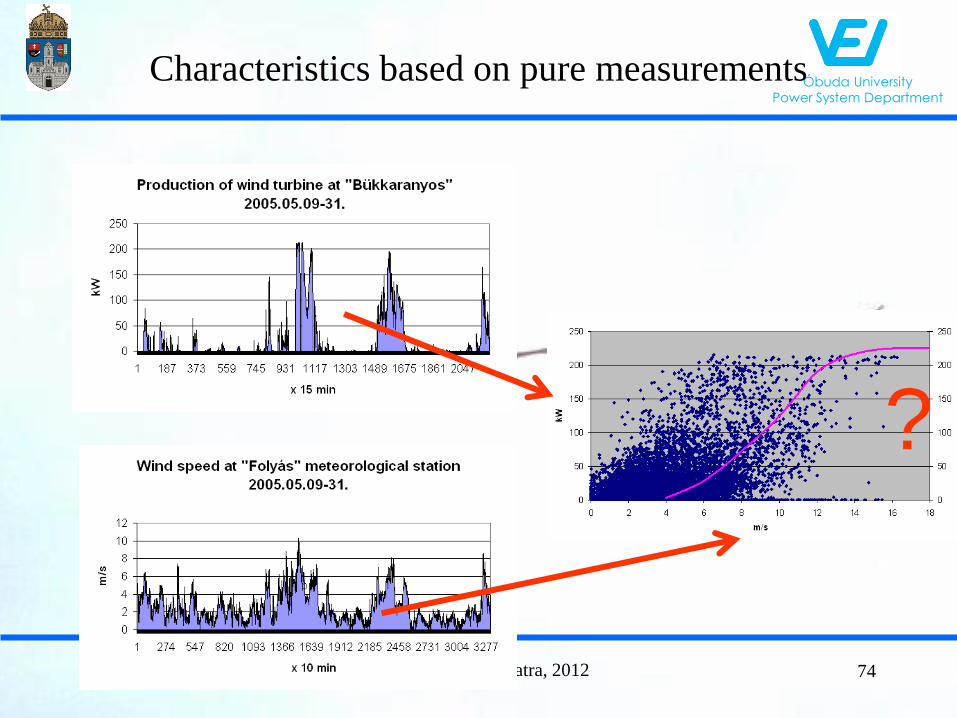
Characteristics based on pure measurements
?
74

Óbuda University Power System Department
Wind basics - Patra, 2012
Correlation?
The causes of the lack of correlation are
• The distance between the wind turbine and wind measurement
• The local wind turbulences that create difference in the wind blow at the two measurement points.
75

Óbuda University Power System Department
Wind basics - Patra, 2012
Other causes: turbulence
• The local wind turbulences that create difference in the wind blow at the two measurement points.
• fast (1-6 sec), the medium (1-6 min) and the slow (1-6 hour) changes.
• The fast and medium wind speed and direction changes are not handled (followed) by the turbine, it causes deviances.
• Turbine dynamics and measurement errors, etc.
– Wind speed changes
– Wind direction changes
– Wind speed changes measurement on minute scale
76

Óbuda University Power System Department
Wind basics - Patra, 2012
Distributional reorganization: a functional transformation
An ideal wind speed and power output measurement at the same
tower should give the factory characteristics of the wind turbine,
the two measurements correlate on the factory curve. If we prepare
the cumulative distribution function of both measurements, the
previous correlation is still valid and we get the same curve.
77

Óbuda University Power System Department
Wind basics - Patra, 2012
Back to the measurements (Bükkaranyos – Folyás: 33km)
78
Óbuda University Power System Department
Wind basics - Patra, 2012
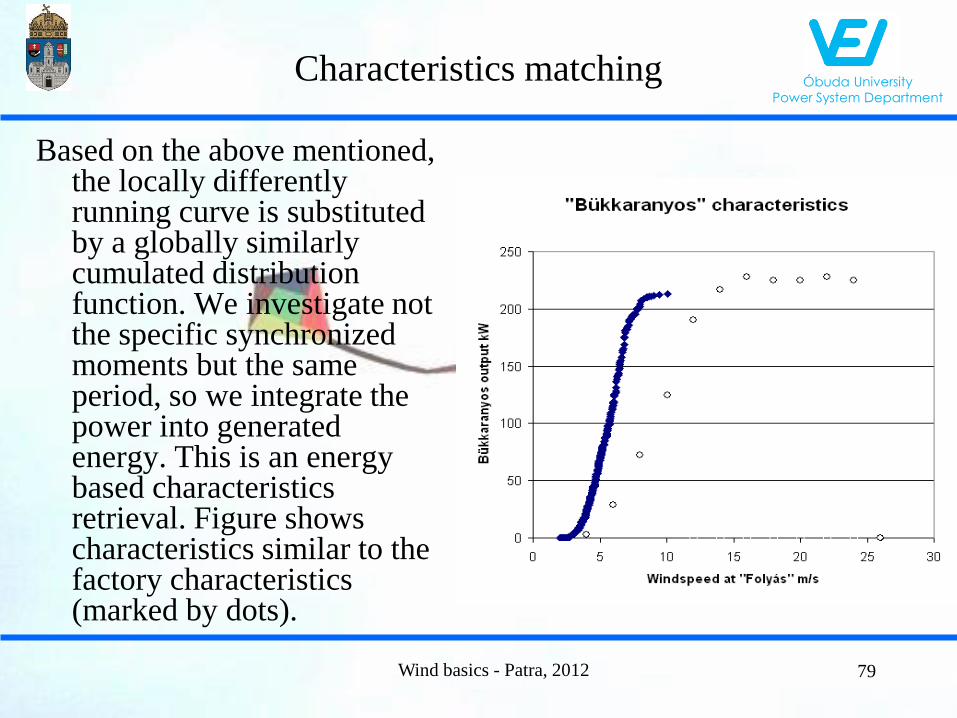
Characteristics matching
Based on the above mentioned, the locally differently running curve is substituted by a globally similarly cumulated distribution function. We investigate not the specific synchronized moments but the same period, so we integrate the power into generated energy. This is an energy based characteristics retrieval. Figure shows characteristics similar to the factory characteristics (marked by dots).
79
Óbuda University Power System Department
Wind basics - Patra, 2012
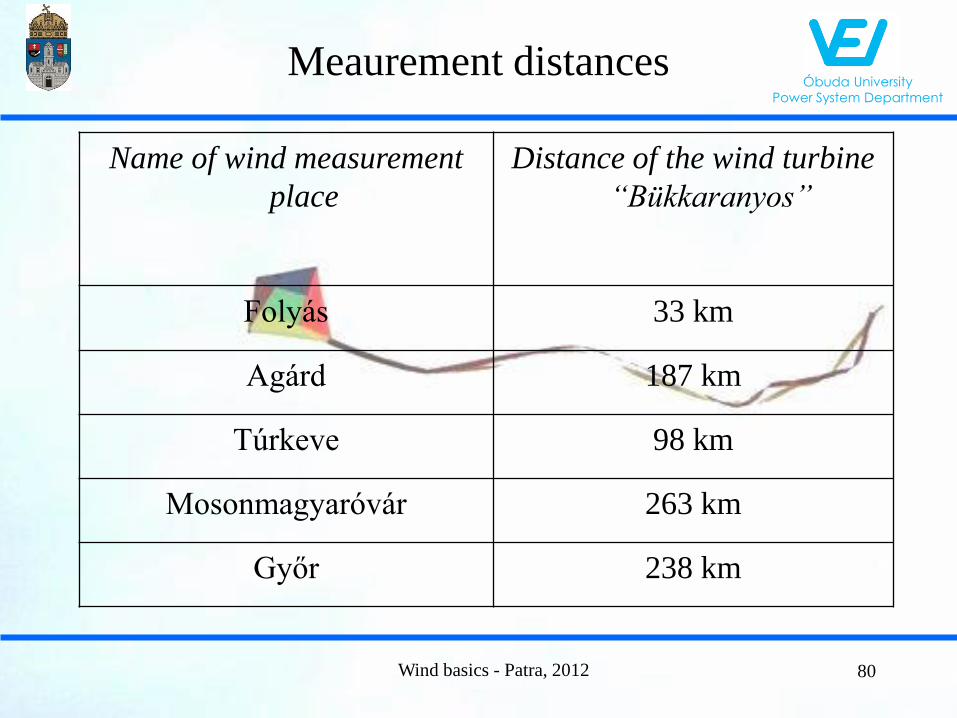
Meaurement distances
Name of wind measurement
place
Distance of the wind turbine
“Bükkaranyos”
Folyás 33 km
Agárd 187 km
Túrkeve 98 km
Mosonmagyaróvár 263 km
Győr 238 km
80

Óbuda University Power System Department
Wind basics - Patra, 2012
Wind power generation forecast
See WinDemo!
81
Óbuda University Power System Department
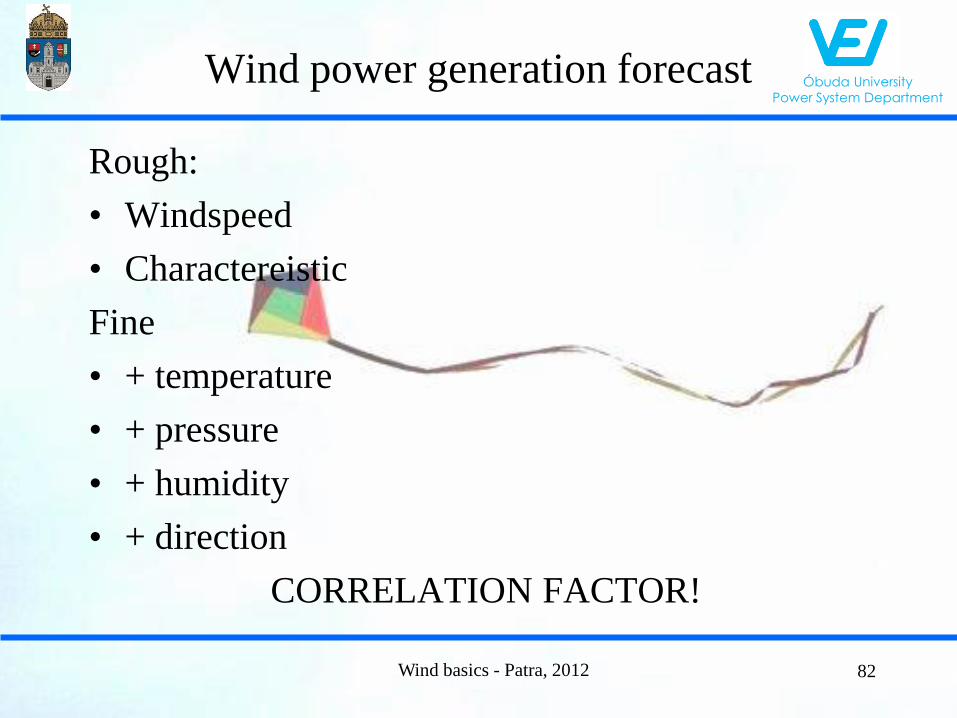
Wind power generation forecast
Rough:
• Windspeed
• Charactereistic
Fine
• + temperature
• + pressure
• + humidity
• + direction
CORRELATION FACTOR!
Wind basics - Patra, 2012 82
Óbuda University Power System Department
Wind basics - Patra, 2012
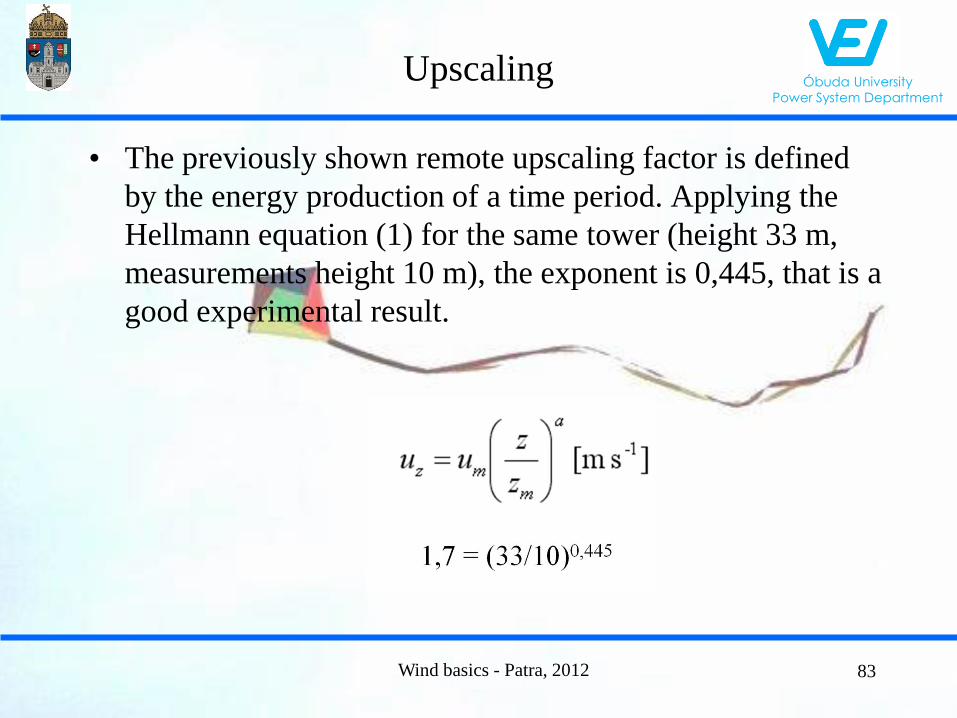
Upscaling
• The previously shown remote upscaling factor is defined
by the energy production of a time period. Applying the
Hellmann equation (1) for the same tower (height 33 m,
measurements height 10 m), the exponent is 0,445, that is a
good experimental result.
83
Óbuda University Power System Department
Wind basics - Patra, 2012
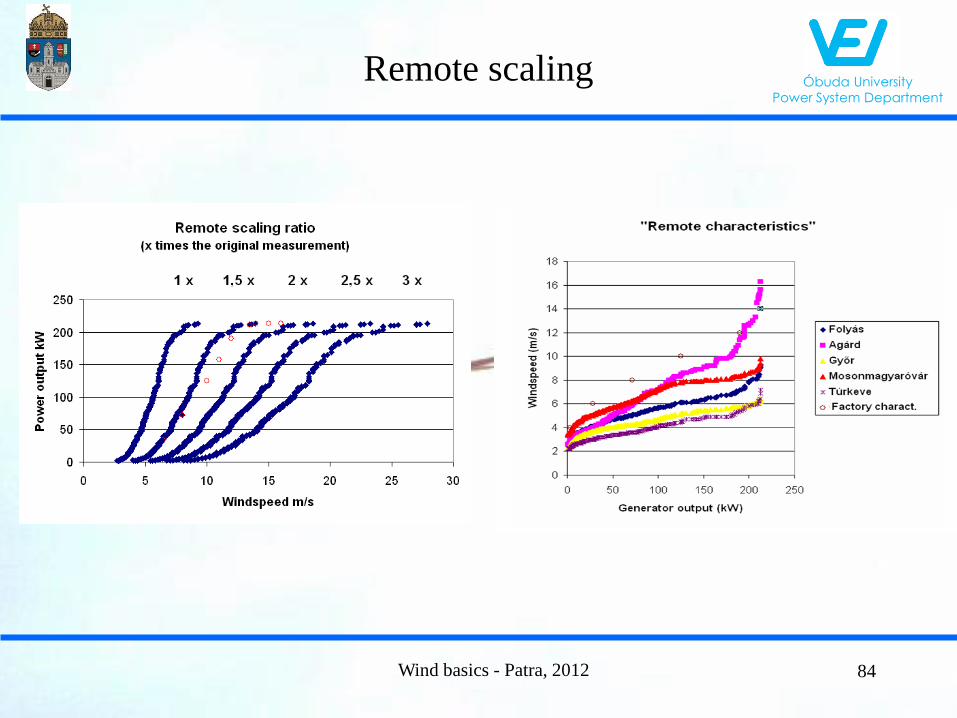
Remote scaling
84

Óbuda University Power System Department
Wind basics - Patra, 2012
Conclusion
• It is not possible to retrieve the vendor given stationary winds speed–generation characteristics of the wind turbine based on the real-time measurements.
• The calculations above show that for real-time generation forecast purposes only close measurement/estimation points could be used.
• The wind forecasts work on worldwide global models, these are theoretically not capable of forecasting local turbulences – which cause the 0,5 - 5 min deviations in the power output.
• In spite of this fact, based on further measurements quite good energy production estimations can be done. We used the cumulative distribution function to define the ratio between remote wind speed measurement and the possible local wind speed at the turbine. 85

Óbuda University Power System Department
Wind basics - Patra, 2012
Thanks for the attention!
86


