Download - ELM transport in the JET scrape-off layer
R. A. Pitts et al. 1 (12) IAEA, Chengdu 16-21 Oct. 2006
ELM transport in the JET scrape-off layer
R. A. Pitts, P. Andrew, G. Arnoux, T.Eich, W. Fundamenski, E. Gauthier, A. Huber, S. Jachmich, C. Silva, D. Tskhakaya and JET EFDA Contributors
18 October 2006
R. A. Pitts et al. 2 (12) IAEA, Chengdu 16-21 Oct. 2006
OUTLINE
• ELM divertor energy asymmetries
• ELM filamentary structure
• Modelling the ELM transport– Particle-in-cell (PIC) simulations– Transient modelling of ELM filament parallel
losses– Main wall particle energies– Main wall power deposition
• Conclusions

R. A. Pitts et al. 3 (12) IAEA, Chengdu 16-21 Oct. 2006
Brief diagnostic overview
Divertor IR and tile thermocouples
Wide angle main chamber IR
Fast reciprocating probes: TTP, RFA
Diagnostic Optimised Configuration (DOC)

R. A. Pitts et al. 4 (12) IAEA, Chengdu 16-21 Oct. 2006
Divertor target ELM energy asymmetry
T. Eich et al., PSI 2006
• ELM resolved target heat flux (IR)– Type I ELM energy
deposition strongly favours INNER target for FWD-B
– For REV-B, some evidence for more balanced deposition,
– Consistent with similar analysis from AUG (WELM < 20 kJ) and linked to passage of net current through target plates
• Favourable trend for ITER target power loading (since always more energy to OUTER target inter-ELM)
R. A. Pitts et al. 5 (12) IAEA, Chengdu 16-21 Oct. 2006
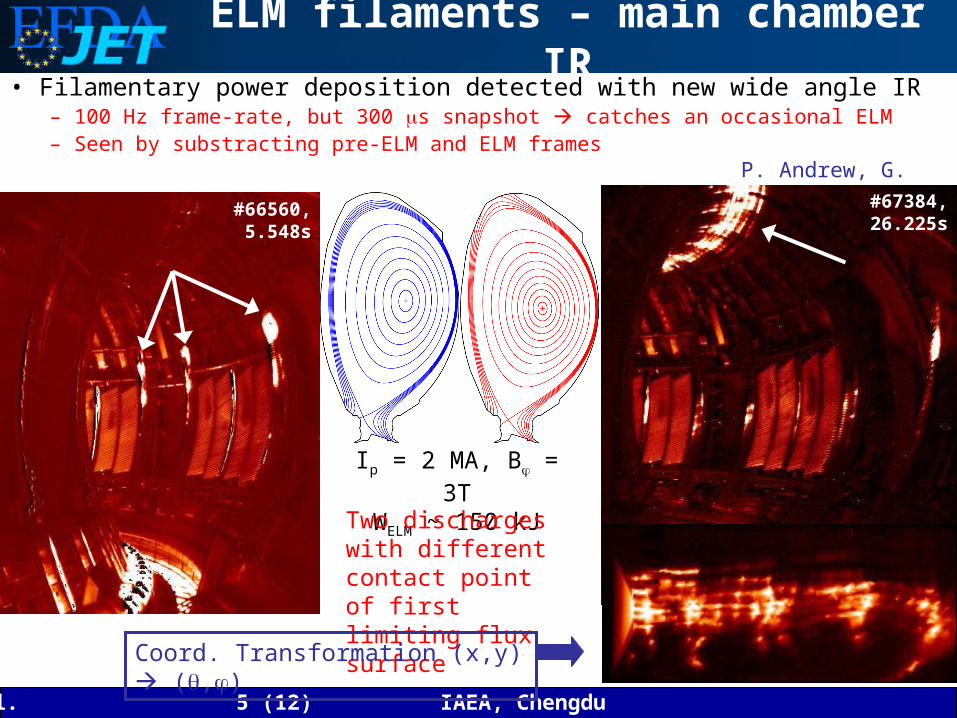
ELM filaments – main chamber IR• Filamentary power deposition detected with new wide angle IR
– 100 Hz frame-rate, but 300 s snapshot catches an occasional ELM– Seen by substracting pre-ELM and ELM frames
Ip = 2 MA, B = 3TWELM ~ 150 kJ
Two discharges with different contact point of first limiting flux surface
#66560, 5.548s
P. Andrew, G. Arnoux
Coord. Transformation (x,y) (,)
#67384, 26.225s

R. A. Pitts et al. 6 (12) IAEA, Chengdu 16-21 Oct. 2006
ELM filaments in the far SOLTTP r - rsep ~ 80 mm at the probe
• Clear filamentary structure in the particle flux, Te and radial velocity– WELM ~ 100 kJ– Te (pedestal) ~ 500 eV– Te
ELM(limiter) ~ 30 eV– vr
ELM ~ 500 1000 ms-1
• Electrons cool rapidly in the filament as it crosses the SOL
• ELM duration at the probe ~10x higher than ELM seen on MHD activity etc.
C. Silva et al., J. Nucl. Mater. 337-339 (2005) 722

R. A. Pitts et al. 7 (12) IAEA, Chengdu 16-21 Oct. 2006
Modelling the ELM transient
WA
LL
Losses along B
Present understanding: MHD perturbs pedestal radial expulsion of plasma parallel loss along field lines to divertor until filament hits wall
Particle-in-Cell (PIC) simulations CPU intensiveInject ELM energy kinetically via particle source at Tped, nped for time ELM and follow particles to targets including full target sheath dynamics
Two separate approaches being followed at JET to modelling the 1D SOL parallel transport.
Transient model Fluid and kinetic versions.Simpler to solve, captures many effects of PIC simulationsIntroduces 2D nature of filament propagation by relating loss times to radial velocities

R. A. Pitts et al. 8 (12) IAEA, Chengdu 16-21 Oct. 2006
PIC simulations of parallel losses• More realistic description of the
ELMy JET SOL using improved PIC simulations (BIT1 code)– Scan in Tped, nped to vary WELM – Most of the heat flux arrives with
ions on the acoustic timescale– BUT, only ~30% of ELM energy
deposited when qtarget peaks– Electrons account for ~30% of
target energy deposition– Strong transient increase over
“Maxwellian” sheath transmission factors during the ELM
– Fluid code assumption of fixed underestimates qtarget at high WELM
Example: Tped = 1.5 keV, nped = 1.5x10¹⁹m-3
WELM ~ 120 kJ, ELM = 200 s D. Tskhakaya

R. A. Pitts et al. 9 (12) IAEA, Chengdu 16-21 Oct. 2006
Transient model of ELM parallel losses
• Key elements of model– Temporal evolution of n, Te
and Ti in the filament frame of reference
– Time and radius related by filament propagation velocity
– Parallel loss treated as conductive and convective removal times
– Radial expansion included
• Filament cools faster than it dilutes, electrons cooled more rapidly than ions
in the far SOL,Ti > Te in the filament at wall impact
W. Fundamenski, Plasma Phys. Control. Fusion 48 (2006) 109
Example with Ti,ped = Te,ped = 400 eV nped = 1.5x10¹⁹m-3, H+ ions

R. A. Pitts et al. 10 (12) IAEA, Chengdu 16-21 Oct. 2006
Model consistent with RFA hot ion data
• Good agreement with transient model for i-side peak fluxes– Predicts Ti,RFA/Ti,ped = 0.30.5– Te,RFA/Te,ped = 0.130.25– ne,RFA/ne,ped = 0.30.4
• Consistent with low Te on TTP probeR. A. Pitts et al., Nucl. Fusion 46 (2006) 82W. Fundamenski, PPCF 48 (2006) 109
RFA
Current of ions with energy > 400 eV
• Filaments on plasma and hot ion fluxes– WELM ~ 50 kJTi,ped ~ 400 eV
• Lower ion energy in successive filaments
• Net “flow” to inboard side!
ELM enters SOL mainly on the outboard side
r - rsep ~ 80 mm at the probe

R. A. Pitts et al. 11 (12) IAEA, Chengdu 16-21 Oct. 2006
ELM-wall power loads
T. Eich et al., subm. to Plasma Phys. Control. FusionW. Fundamenski et al. PSI 2006
O. E. Garcia et al., Phys. Plasmas 13 (2006) 082309
• Fraction of ELM energy in the divertor decreases with increasing ELM size– Up to 60% “missing” from
divertor at high WELM
• Dedicated plasma-wall gap expts. give far SOL power widths of W,ELM ~ 35 mm for WELM/Wped ~ 12% – Agrees well with transient
model prediction– Use this W,ELM as reference for
empirical scaling: W,ELM 35(WELM/0.12Wped)1/2
– Factor 1/2 consistent with recent ELM amplitude scaling due to interchange motion
WELM,wallWELMexp(-/W,ELM)
f = 1 - WELM,wall/WELM

R. A. Pitts et al. 12 (12) IAEA, Chengdu 16-21 Oct. 2006
CONCLUSIONS
• Significant progress at JET in the measurement and modelling of ELM SOL transport– Strong asymmetry in divertor Type I ELM energy
deposition favouring inner target– ELM filaments seen on several diagnostics– Sophisticated 1D PIC modelling now providing
scalings of target heat flux with ELM energy – Available data in good agreement with new transient
parallel energy loss model– Implies that filaments detached from pedestal plasma– ELM ions can reach limiters with high energies
• See poster by A. Loarte (IT/P1-14) for more applications of the transient model to ITER wall power loads


